California is once again a fracked state. The moratorium on well stimulations (hydraulic fracturing and acidizing) that lasted since June 26, 2019 has now come to an end. As of April 3rd, 2020, California’s oil and gas regulatory body, California Geological Energy Management Division (CalGEM), approved 24 new permits to frack new wells. The wells were permitted to the operator Aera Energy. Well types to be fracked include 22 oil and gas production wells and 2 water flood wells; 18 of which are in the South Belridge Field and 6 North Belridge Field. Locations of the wells are shown in the map in Figure 1, and are mapped with the rest of 2020’s approved well drilling and rework permits in Consumer Watchdog’s updated release on NewsomWellWatch.com. Please read our press release with Consumer Watchdog here!
Figure 1. Map of New Fracking Permits in California
Fortunately, these 24 approved well stimulation permits are not located in close proximity to communities that would be directly impacted by the negative contributions to air quality and potential groundwater quality degradation that result from drilling and stimulating oil and gas wells. Regardless of where oil and gas wells and stimulations are permitted in relation to Frontline Communities, these wells will still degrade the regional air quality of the San Joaquin Valley. The San Joaquin Valley has the worst air quality in the country. According to the U.S. EPA, oil and gas production is a main contributor of volatile organic compounds (VOC’s) and NOX in the Valley. In addition to VOC’s being carcinogens, these pollutants are precursors to the ozone and smog that cause health impacts such as asthma, chronic obstructive pulmonary disease (COPD), cardiovascular disease, and negative birth outcomes.
Geology and Spills
Additionally, the dolomite formations where these 24 stimulations were permitted have also experienced the same type of oil seeps and spills (known as surface expressions) as the Cymric Field just to the south. Readers may remember the operator Chevron spilling 1.3 million gallons of oil and wastewater in an uncontrollable seep resulting from high pressure injection wells.
Whereas Governor Newsom may have put a halt to unpermitted high-pressure injections, regulators have just approved permits for 24 new fracking operations, a.k.a well stimulations. The irony here is that risks inherent in the fracking process in California include the same risks associated withhigh pressure steam injection operations. Both techniques elevate the downhole pressure of a well to the point that the formation “source” rock is fractured. These techniques increase the likelihood of downhole communication with other surrounding wells, both active and plugged. Downhole communication events between wells, in this case known as “frack hits” are a major cause of well casing failures and blowouts, which in turn are the primary cause of surface expressions. Simply put, high pressure injections in over-developed oil fields result in spills, and in this case, these 24 permitted stimulations are within 1,500’ of over 7,000 existing wells, a distance specifically identified by CalGEM as a high-risk zone for downhole communication between wells.
Regulation
So how did these wells get approved? Here’s the story, as told by CalGEM:
In November, CalGEM requested a third-party scientific review of pending well stimulation permit applications to ensure the state’s technical standards for public health, safety and environmental protection are met prior to approval of each permit. To ensure the proposed permits comply with California law, including the state’s technical standards to protect public health, safety, and environmental protection, the Department of Conservation asked experts at the Lawrence Livermore National Laboratory (LLNL) to assess CalGEM’s permit review process. LLNL also evaluated the completeness of operators’ application materials and CalGEM’s engineering and geologic analyses.
The independent scientific review is one of Governor Newsom’s initiatives to ensure oil and gas regulations protect public health, safety, and environmental protection. This review, which assesses the completeness of each proposed hydraulic fracturing permit, is taking place as an interim measure while a broader audit is completed of CalGEM’s permitting process for well stimulation. That audit is being completed by the Department of Finance Office of Audits and Evaluation (OSAE) and will be completed and shared publicly later this year. LLNL experts are continuing evaluation on a permit-by-permit basis and conducting a rigorous technical review to verify geological claims made by well operators in the application process. Permit by permit review will continue until the Department of Finance Audit is complete later this year.
LLNL’s scientific review of the permit applications and process found that the permitting process met statutory and regulatory requirements. LLNL found, however, that CalGEM could improve its evaluation of the technical models used in the permit approval process. As a result, CalGEM now requires all operators to provide an Axial Dimensional Stimulation Area (ADSA) Narrative Report for each oilfield and fracture interval which must be validated by LLNL and conform to the new CalGEM permitting process. This will improve CalGEM’s ability to independently validate applicants’ fracture modeling.
While this sounds like a methodological approach to the permitting process, it is still flawed in several ways. First and foremost, there is still no process for community input, let alone community decision-making. Community stakeholders are not engaged at in point in this process. Furthermore the contribution of oil and gas extraction operations to the degradation of environmental quality is already well established. In the case of these 24 fracking permits, they will contribute to the further degradation of regional air quality and continue the legacy of groundwater contamination within the sacrifice zone surrounding the Belridge fields.
Fracking in the Age of Pandemics
While we are critical of Governor Newsom’s climate-changing oil extraction policies, FracTracker would like to recognize the leadership Governor Newsom has shown instituting responsible policies to keep Californians as safe as possible and protected from the threat of COVID-19. While there can still be more done to provide relief for the most financially vulnerable, such as instituting a rent moratorium for those that do not own their own homes, California leads as an example for the public health interventions that need to be instituted nation-wide. The Governors inclusion of undocumented citizens in the state’s economic stimulus program is a first step, and FracTracker Alliance fully supports increasing the amount to at least match the $1,200 provided to the rest of Californians.
Conclusion
Regardless, the threat of COVID-19 cannot be addressed in a vacuum. Threats of infection are magnified for Frontline Communities. Living near oil and gas operations exposes communities to a cocktail of volatile organic compounds that suppress the immune system, increasing the risk of contracting viral lung infections. Frontline Communities are therefore particularly vulnerable to the threat of COVID-19. California and Governor Newsom need to consider the public health implications of permitting new fracking and new oil and gas wells, particularly those permits within 2,500’ of hospitals, schools, and other sensitive sites, above all during an existing pandemic.
By Kyle Ferrar, MPH, Western Program Coordinator, FracTracker Alliance
https://fractracker.org/wp-content/uploads/2020/04/Map-of-New-2020-Fracking-Permits-in-California.jpg7201500Kyle Ferrar, MPHhttps://fractracker.org/wp-content/uploads/2025/09/2025-Wordmark-Logo.pngKyle Ferrar, MPH2020-05-07 12:48:132021-04-15 14:16:49California, Back in Frack
In the 2018 The Sky’s Limit report by Oil Change International (OCI),4 FracTracker’s analysis showed that 8,493 active or newly permitted oil and gas wells were located within a 2,500’ buffer of sensitive sites including occupied dwellings, schools, hospitals, and playgrounds. At the time, it was estimated that over 850,000 Californians lived within the setback distance of at least one of these oil and gas wells.
An assessment of the number of California citizens living proximal to active oil and gas production wells was also conducted for the CCST State Bill 4 Report on Well Stimulation in 2016.5 The analysis calculated the number of California residents living within 2,500’ of an active (producing) oil and gas well, and based estimates of demographic percentages on 2015 ACS data at the census block level. The report found that:
859,699 individuals in California live within 2,500’ of an active oil and gas well
Of this, a total of 385,067 are “Non-white” (45%)
Of this, a total of 341,231 are “Hispanic” (40%) *[as defined by the U.S. Census Bureau]
Population counts within the setbacks were calculated for smaller census designated areas including counties and census tracts. The results of the calculations are presented in Table 1 and the analysis is shown in the maps in Figure 1 and Figure 2 below.
Data for the City of Los Angeles was also aggregated. Results showed:
215,624 individuals in the City of Los Angeles live within 2,500’ of an active oil and gas well
Of this, a total of 114,593 are “Non-white” (53%)
Of this, a total of 119,563 are “Hispanic” (55%) *[as defined by the U.S. Census Bureau]
Table 1. Population Counts by County. The table presents the counts of individuals living within 2,500’ of an active oil and gas well, aggregated by county. The top 12 counties with the highest population counts are shown. “Impacted Population” is the count of individuals estimated to live within 2,500’ of an oil and gas well. The “% Non-white” and “% Hispanic” columns report the estimated percentage of the impacted population of said demographic.
County
Total Pop.
Impacted Pop.
Impacted % Non-white
Impacted % Hispanic
Los Angeles
9,818,605
541,818
0.54
0.46
Orange
3,010,232
202,450
0.25
0.19
Kern
839,631
71,506
0.34
0.43
Santa Barbara
423,895
8,821
0.44
0.71
Ventura
823,318
8,555
0.37
0.59
San Bernardino
2,035,210
6,900
0.42
0.59
Riverside
2,189,641
5,835
0.46
0.33
Fresno
930,450
2,477
0.34
0.50
San Joaquin
685,306
2,451
0.55
0.42
Solano
413,344
2,430
0.15
0.15
Colusa
21,419
1,920
0.39
0.70
Contra Costa
1,049,025
1,174
0.35
0.30
Figure 1. Map of impacted census tracts for a 2,500’ setback in California. The map shows areas of California that would be impacted by a 2,500’ setback from active oil and gas wells in California.
Figure 2. Map of impacted census tracts for a 2,500’ setback in Los Angeles. The map shows areas of California that would be impacted by a 2,500’ setback from active oil and gas wells in Los Angeles.
From the analysis we find that the majority of California citizens living near active production wells are located in Los Angeles County. This amounts to 61% of the total count of individuals within 2,500’ in the full state. Additionally, the well sample population is limited to only wells that are reported with an “active” status. Including wells identified as idle or support wells such as Class II injection or EOR wells would increase both the total numbers and the demographical percentages because of the high population density in Los Angeles.
Well Counts – Updated Data
Using California Geologic Energy Management Division (CALGEM) data published March 1, 2020, we find that there are 105,808 wells reported as Active/Idle/New in California. There are 16,690 are located within 2,500′ of a sensitive receptor (15.77%). Of the 74,775 active wells in the state, 9,835 fall within the 2,500’ setback distance.6
There are 6,558 idle wells that fall within the 2500’ setback distance, of nearly 30,000 idle wells in the state. Putting these idle wells back online would be blocked if they required reworks to ramp up production. For the most part operators do not intend for most idle wells to come back online. Rather they are just avoiding the costs of plugging.
Of the 3,783 permitted wells not yet in production, or “new wells,” 298 are located within the 2,500’ buffer zone (235 in Kern County).
In Los Angeles, Rule 1148.2 requires operators to notify the South Coast Air Quality Management District of activities at well sites, including permit approvals for stimulations and reworks. Of the 1,361 reports made to the air district since the beginning of 2018 through April 1, 2019; 634 (47%) were for wells that would be impacted by the setback distance; 412 reports were for something other than “well maintenance” of which 348 were for gravel packing, 4 for matrix acidizing, and 65 were for well drilling.
We also analyzed data reported to DOGGR under the well stimulation requirements of SB4. From 1/1/2016 to 4/1/19 there were 576 well stimulation treatment permits granted under the SB4 regulations. Only 1 hydraulic fracturing event, permitted in Goleta, would have been impacted by a 2,500’ setback.
Production
Also part of the OCI The Sky’s Limit report,4 we approximated the amount of oil produced from wells within 2,500’ of sensitive receptors. Using the API numbers of wells identified as being within the buffer area, we pulled production data for each well from the Division of Oil, Gas, and Geothermal Resources (DOGGR) database. The results are based on 2016 production data, the latest complete data available at the time of the analysis. The data indicated that 12% of statewide production came from wells within the buffer zone in 2016. Looking at the production data for a full 6 year period (2010 – 2016), production from wells within the buffer zone was 10% on average statewide. Limiting the analysis to only Kern County, the result was actually smaller. About 5% of countywide production in 2016 (6.1 million barrels) was found to come from wells in the buffer zone.
Low Income Communities
FracTracker conducted an analysis in Kern County for the California Environmental Justice Alliance’s 2018 Environmental Justice Agency Assessment.7 We assessed the proportions of wells near sensitive receptors that are located in low-income communities (at or below 80% of the Kern County Average Median Income). We found that 5,229 active/idle/new oil and gas wells were within 2,500’ from sensitive receptors in low-income communities, including 3,700 active, 1,346 idle, and 183 newly permitted “new” oil and gas wells. The maps in Figures 3 and 4 below show these areas of Kern County and specifically Bakersfield, California.
FracTracker’s analysis of low income communities in Kern County showed the following:
There are 16,690 active oil and gas production wells located in census blocks with median household incomes of less than 80% of Kern’s area median income (AMI).
Therefore about 25% (16,690 out of 67,327 total) of Kern’s oil and gas wells are located within low-income communities.
Of these 16,690 wells, 5,364 of them are located within the 2,500′ setback distance from sensitive receptor sites such as schools and hospitals (32%), versus 13.1% for the rest of the state.
Figure 3. Map of Kern County census tracts with wells impacted by a 2,500’ setback, with median income brackets.
Figure 4. Map of Kern County census tracts with wells impacted by a 2,500’ setback, with median income brackets.
Schools and Environmental Justice
FracTracker conducted an environmental justice analysis to investigate student demographics in schools near oil and gas drilling in California.8 The school enrollment data is from 2013 and the oil and gas wells data is from June 2014. For the analysis we used multiple distances, including 0.5 miles (about 2,500’). Based on the statistical comparisons in the report, we made the following conclusions:
Students attending school near at least one active oil and gas well are 10.5% more likely to be Hispanic.
Students attending school near at least one active oil and gas well are 6.7% more likely to be a minority.
There are 61,612 students who attend school within 1 mile of a stimulated oil or gas well, and 12,362 students who attend school within 0.5 miles of a stimulated oil or gas well.
School districts with greater Hispanic and non-white student enrollment are more likely to house wells that have been hydraulically fractured.
Schools campuses with greater Hispanic and non-white student enrollment are more likely to be closer to more oil and gas wells and wells that have been hydraulically fractured.
Students attending school within 1 mile of oil and gas wells are predominantly non-white (79.6%), and 60.3% are Hispanic.
The top 11 school districts with the highest well counts are located the San Joaquin Valley with 10 districts in Kern County and the other just north of Kern in Fresno County.
The two districts with the highest well counts are in Kern County: Taft Union High School District, host to 33,155 oil and gas wells; and Kern Union High School District, host to 19,800 oil and gas wells.
Of the schools with the most wells within a 1 mile radius, 8/10 are located in Los Angeles County.
There are 485 active/new oil and gas wells within 1 mile of a school and 177 active/new oil and gas wells within 0.5 miles of a school. This does not include idle wells.
There are 352,784 students who attend school within 1 mile of an oil or gas well, and 121,903 student who attend school within 0.5 miles of an oil or gas well. This does not include idle wells
Permits
In collaboration with Consumer Watchdog,9 we counted permit applications that were approved in 2018 during Governor Brown’s administration, as well as in 2019 and 2020 under Governor Newsom. The analysis included permits for drilling new wells, well reworks, deepening wells and well sidetracks. Almost 10% of permits issued during the first two months of 2020 have been issued within 2,500’ of sensitive receptors including homes, hospitals, schools, daycares, and nursing facilities. This is slightly lower than the average for all approved permits in 2019 (12.2%). In 2018, Governor Brown approved 4,369 permits, of which 518 permits (about 12%) were granted within the proposed 2,500’ setback.
Conclusion
FracTracker Alliance’s body of work in California provides a summary of the population demographics of communities most impacted by oil and gas extraction. It is clear that communities of color in Los Angeles and Kern County make up the majority of Frontline Communities. New oil and gas wells are not permitted in equitable locations and setbacks from currently active oil and gas extraction sites are an environmental justice necessity. Putting a ban on new permits and shutting down existing wells located within 2,500’ of sensitive receptors such as schools, hospitals, and homes would have a very small impact on overall production of oil in California. It is clear that the public health and environmental equity benefits of a 2,500’ setback far outweigh any and all drawbacks. We hope that the resources summarized in this article provide a useful source of condensed information for those that feel similarly.
References
Hays J, Shonkoff SBC. 2016. Toward an Understanding of the Environmental and Public Health Impacts of Unconventional Natural Gas Development: A Categorical Assessment of the Peer-Reviewed Scientific Literature, 2009-2015. PLOS ONE 11(4): e0154164. https://doi.org/10.1371/journal.pone.0154164Ferrar, K.
COVID-19 and the oil and gas industry are at odds. Air pollution created by oil and gas activities make people more vulnerable to viruses like COVID-19. Simultaneously, the economic impact of the pandemic is posing major challenges to oil and gas companies that were already struggling to meet their bottom line. In responding to these challenges, will our elected leaders agree on a stimulus package that prioritizes people over profits?
Air pollution from oil and gas development can come from compressor stations, condensate tanks, construction activity, dehydrators, engines, fugitive emissions, pits, vehicles, and venting and flaring. The impact is so severe that for every three job years created by fracking in the Marcellus Shale, one year of life is lost due to increased exposure to pollution.
Yes, air quality has improved in certain areas of China and elsewhere due to decreased traffic during the COVID-19 pandemic. But despite our eagerness for good news, sightings of dolphins in Italian waterways does not mean that mother earth has forgiven us or “hit the reset button.”
Significant environmental health concerns persist, despite some improvements in air quality. During the 2003 SARS outbreak, which was caused by another coronavirus, patients from areas with the high levels of air pollution were twice as likely to die from SARS compared to those who lived in places with little pollution.
On March 8th, Stanford University environmental resource economist Marshall Burke looked at the impacts of air quality improvements under COVID-19, and offered this important caveat:
“It seems clearly incorrect and foolhardy to conclude that pandemics are good for health. Again I emphasize that the effects calculated above are just the health benefits of the air pollution changes, and do not account for the many other short- or long-term negative consequences of social and economic disruption on health or other outcomes; these harms could exceed any health benefits from reduced air pollution. But the calculation is perhaps a useful reminder of the often-hidden health consequences of the status quo, i.e. the substantial costs that our current way of doing things exacts on our health and livelihoods.”
This is an environmental justice issue. Higher levels of air pollution tend to be in communities with more poverty, people of color, and immigrants. Other health impacts related to oil and gas activities, from cancer to negative birth outcomes, compromise people’s health, making them more vulnerable to COVID-19. Plus, marginalized communities experience disproportionate barriers to healthcare as well as a heavier economic toll during city-wide lockdowns.
Financial Instability of the Oil & Gas Industry in the Face of COVID-19
The COVID-19 health crisis is setting off major changes in the oil and gas industry. The situation may thwart plans for additional petrochemical expansion and cause investors to turn away from fracking for good.
Persistent Negative Returns
Oil, gas, and petrochemical producers were facing financial uncertainties even before COVID-19 began to spread internationally. Now, the economics have never been worse.
In 2019, shale-focused oil and gas producers ended the year with net losses of $6.7 billion. This capped off the decade of the “shale revolution,” during which oil and gas companies spent $189 billion more on drilling and other capital expenses than they brought in through sales. This negative cash flow is a huge red flag for investors.
“North America’s shale industry has never succeeded in producing positive free cash flows for any full year since the practice of fracking became widespread.” IEEFA
Plummeting Prices
Shale companies in the United States produce more natural gas than they can sell, to the extent that they frequently resort to burning gas straight into the atmosphere. This oversupply drives down prices, a phenomenon that industry refers to as a “price glut.”
The oil-price war between Russia and Saudi Arabia has been taking a toll on oil and gas prices as well. Saudi Arabia plans to increase oil production by 2 – 3 million barrels per day in April, bringing the global total to 102 million barrels produced per day. But with the global COVID-19 lockdown, transportation has decreased considerably, and the world may only need 90 million barrels per day.
If you’ve taken Econ 101, you know that when production increases as demand decreases, prices plummet. Some analysts estimate that the price of oil will soon fall to as low as $5 per barrel, (compared to the OPEC+ intended price of $60 per barrel).
Corporate welfare vs. public health and safety
Oil and gas industry lobbyists have asked Congress forfinancial support in response to COVID-19. Two stimulus bills in both the House and Senate are currently competing for aid.
Speaker McConnell’s bill seeks to provide corporate welfare with a $415 billion fund. This would largely benefit industries like oil and gas, airlines, and cruise ships. Friends of the Earth gauged the potential bailout to the fracking industry at $26.287 billion. In another approach, the GOP Senate is seeking to raise oil prices by directly purchasing for the Strategic Petroleum Reserve, the nation’s emergency oil supply.
Speaker Pelosi’s proposed stimulus bill includes $250 billion in emergency funding with stricter conditions on corporate use, but doesn’t contain strong enough language to prevent a massive bailout to oil and gas companies.
Hopefully with public pressure, Democrats will take a firmer stance and push for economic stimulus to be directed to healthcare, paid sick leave, stronger unemployment insurance, free COVID-19 testing, and food security.
Grasping at straws
Fracking companies were struggling to stay afloat before COVID-19 even with generous government subsidies. It’s becoming very clear that the fracking boom is finally busting. In an attempt to make use of the oversupply of gas and win back investors, the petrochemical industry is expanding rapidly. There are currently plans for $164 billion of new infrastructure in the United States that would turn fracked natural gas into plastic.
The location of the proposed PTTGC Ethane Cracker in Belmont, Ohio. Go to this map.
There are several fundamental flaws with this plan. One is that the price of plastic is falling. A new report by the Institute for Energy Economics and Financial Analysis (IEEFA) states that the price of plastic today is 40% lower than industry projections in 2010-2013. This is around the time that plans started for a $5.7 billion petrochemical complex in Belmont County, Ohio. This would be the second major infrastructural addition to the planned petrochemical buildout in the Ohio River Valley, the first being the multi-billion dollar ethane cracker plant in Beaver County, Pennsylvania.
Secondly, there is more national and global competition than anticipated, both in supply and production. Natural gas and petrochemical companies have invested in infrastructure in an attempt to take advantage of cheap natural gas, creating an oversupply of plastic, again decreasing prices and revenue. Plus, governments around the world are banning single-use plastics, and McKinsey & Company estimates that up to 60% of plastic production could be based on reuse and recycling by 2050.
Sharp declines in feedstock prices do not lead to rising demand for petrochemical end products.
Third, oil and gas companies were overly optimistic in their projections of national economic growth. The IMF recently projected that GDP growth will slow down in China and the United States in the coming years. And this was before the historic drop in oil prices and the COVID-19 outbreak.
“The risks are becoming insurmountable. The price of plastics is sinking and the market is already oversupplied due to industry overbuilding and increased competition,” said Tom Sanzillo, IEEFA’s director of finance and author of the report.
Oil, gas, and petrochemical companies are facing perilous prospects from demand and supply sides. Increasing supply does not match up with decreasing demand, and as a result the price of oil and plastics are dropping quickly. Tens of thousands of oil and gas workers are being fired, and more than 200 oil and gas companies have filed for bankruptcy in North America in the past five years. Investors are no longer interested in propping up failing companies.
Natural gas accounts for 44% of electricity generation in the United States – more than any other source. Despite that, the cost per megawatt hour of electricity for renewable energy power plants is now cheaper than that of natural gas power plants. At this point, the economy is bound to move towards cleaner and more economically sustainable energy solutions.
It’s not always necessary or appropriate to find a “silver lining” in crises, and it’s wrong to celebrate reduced pollution or renewable energy achievements that come as the direct result of illness and death. Everyone’s first priority must be their health and the health of their community. Yet the pandemic has exposed fundamental flaws in our energy system, and given elected leaders a moment to pause and consider how we should move forward.
It is a pivotal moment in terms of global energy production. With determination, the United States can exercise the political willpower to prioritize people over profits– in this case, public health over fossil fuel companies.
Top photo of petrochemical activity in the Houston, Texas area. By Ted Auch, FracTracker Alliance. Aerial assistance provided by LightHawk.
https://fractracker.org/wp-content/uploads/2020/04/HoustonArea_feature.jpg6661500Shannon Smithhttps://fractracker.org/wp-content/uploads/2025/09/2025-Wordmark-Logo.pngShannon Smith2020-03-24 15:48:412021-04-15 14:16:51COVID-19 and the oil & gas industry
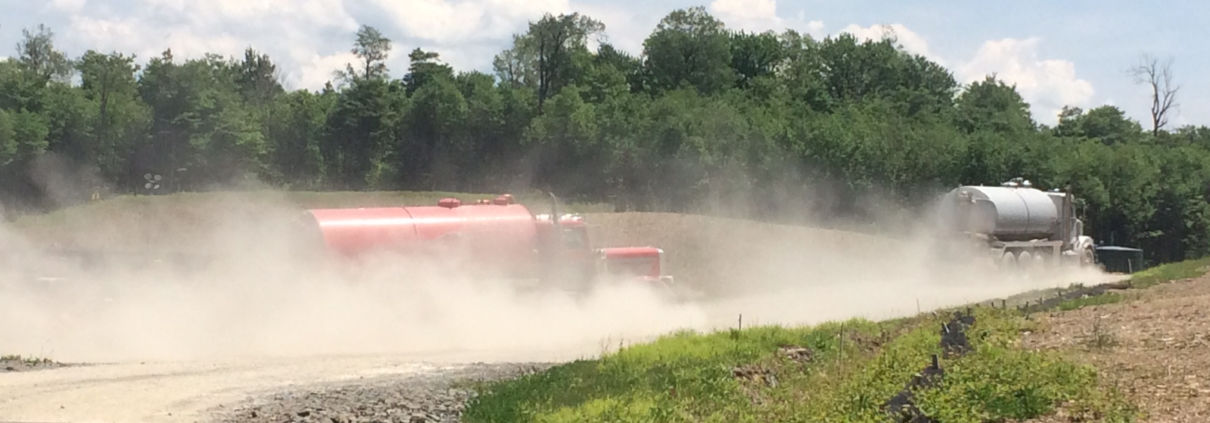
https://fractracker.org/wp-content/uploads/2020/03/TruckFeatureImage.jpg6661500Erica Jacksonhttps://fractracker.org/wp-content/uploads/2025/09/2025-Wordmark-Logo.pngErica Jackson2020-02-28 23:18:032020-07-17 10:27:25Front Range Health Tracking Project
For the past decade, petroleum operators in the United States have been busy pumping record amounts of oil and gas from the ground. But has the pace been too frenzied? Since the vast majority of the oil and gas is not used in situ, the industry must transport these hydrocarbon products to other locations. The principal way of achieving this is through pipelines, a process which has resulted in thousands of incidents, causing hundreds of injuries and fatalities, thousands of evacuations, and billions of dollars’ worth of damage.
The United States has an estimated 3 million miles of hazardous liquid, gas distribution, and gathering and transmission pipelines in operation, and more are being built every day. Not only have the pipelines themselves become so ubiquitous that most people never give them a second thought, the incidents themselves have become so familiar to us that even severe ones struggle to gain any attention outside of the local media area.
In 2019, there were 614 reported pipeline incidents in the United States, resulting in the death of 10 people, injuries to another 35, and about $259 million in damages. As mentioned below, some of these totals are likely to creep upward as additional reports are filed. In terms of statistical fluctuations, 2019 was slightly better than normal, but of course statistics only tell a part of the story. Friends and family of the ten people that died last year would find no comfort knowing that there were fewer such casualties than 2017, for example. Similarly, it would be useless to comfort a family that lost their home by reminding them that someone lost an even bigger and more expensive home the year before.
Keeping in mind the human impact, let’s take a look at the data.
Pipeline Incident Summary
These incidents are broken into three separate reports:
Hazardous Liquids (including crude oil, refined petroleum products, and natural gas liquids).
Gas Distribution (lines that take gas to residents and other consumers), and
Gas Transmission & Gathering (collectively bringing gas from well sites to processing facilities and distant markets)
Table 1: Summary of pipeline incidents from 1/1/2010 through 12/31/2019
Report
Incidents
Fatalities
Injuries
Evacuees
Damages ($)
Fires
Explosions
Hazardous Liquids Lines
3,978
10
26
2,482
2,812,391,218
130
15
Gas Transmission & Gathering Lines
1,226
25
108
12,984
1,315,162,976
133
57
Gas Distribution
1,094
105
522
20,526
1,229,189,997
659
257
Totals
6,298
140
656
35,992
5,356,744,191
922
329
But is increasing the capacity of the pipes a good idea? As FracTracker has shown in the past, pipeline incidents occur at a rate of about 1.7 incidents per day. This holds true with updated data, showing 6,298 incidents from January 1, 2010 through December 17, 2019, which was the latest report filed when the data was downloaded in early February 2020.
Pipeline Usage in the United States
In 2018, roughly three million miles of natural gas pipelines transported almost 28 trillion cubic feet (Tcf) of gas, which is roughly 13 times the volume of Mount Everest. For liquids, pipeline data is available showing shipments of from one region of the country (known as a PAD District) to another, which shows that 1.27 billion barrels of crude oil were shipped through almost 81,000 miles of pipelines in 2018, and 3.39 billion barrels through nearly 214,000 miles of pipes when counting natural gas liquids and refined petroleum products.
Note that these figures are less than 2018 estimates based on 70% of liquid petroleum products being moved by pipeline. This discrepancy could be accounted for by the dramatic increase in production in recent years, or perhaps by intra-PAD shipments not listed in the data above. For example, petroleum produced in the Permian Basin in western Texas and eastern New Mexico may travel nearly 500 miles by pipeline en route to export terminals on the Gulf coast, while remaining in the same PAD District. If the 70% estimate holds true, then roughly 2.8 billion barrels (117 billion gallons) of crude would be shipped by pipeline, more than twice as much as the 1.27 billion barrel figure shown above.
The drilling boom in the United States was quickly followed by a boom in pipeline construction. Total mileage for liquid pipelines – known as hazardous liquid lines – increased by 20% from 2010 to 2018. For those aware of thousands of miles of recent gas pipeline projects, it is confusing to hear that the data from the Pipeline and Hazardous Materials Safety Administration (PHMSA) are mixed for natural gas. It does show a 2.4% increase in total miles for gas distribution mainlines to 1.3 million miles, and a 2.0% increase over the same time in distribution service lines, which run from the mainlines to the consumer. However, the total mileage for transmission lines – which are large diameter pipes that move gas long distances – actually contracted 2.1% to just under 302,000 miles. Total mileage for gathering lines fell even more, by 8.4% to just under 18,000 miles. However, since PHMSA estimates only 5% of gathering lines report to the agency, this last figure is probably not a valid estimate.
If this data is accurate, it means that the thousands of miles of transmission and gathering lines built in recent years were more than offset by decommissioned routes. However, given the record production levels mentioned above, it is almost certain that total capacity of the system has gone up, which can be accomplished through a combination of increased pressure and diameter of the pipe.
Hazardous Liquids
Incident Impact Summary - Table 2
Table. 2. Hazardous Liquid Pipeline Incident Impact Summary. Data from PHMSA.
Year
Incidents
Fatalities
Injuries
Evacuees
Damages ($)
Fires
Explosions
2010
350
1
3
686
1,075,193,990
8
1
2011
344
0
1
201
273,526,547
9
2
2012
366
3
4
235
145,477,426
10
2
2013
401
1
6
858
278,525,540
15
2
2014
455
0
0
34
140,211,610
20
4
2015
460
1
0
138
256,251,180
16
1
2016
420
3
9
104
212,944,094
17
2
2017
415
1
1
58
163,118,772
7
0
2018
405
0
2
165
152,573,682
15
1
2019
362
0
0
3
114,568,377
13
0
Grand Total
3978
10
26
2482
2,812,391,218
130
15
Age of Pipelines - Histogram
Figure 1. Hazardous Liquid Line Incidents from Jan. 2010 – Jan. 2020, Arranged by Year of Pipe Installation. Data from PHMSA.
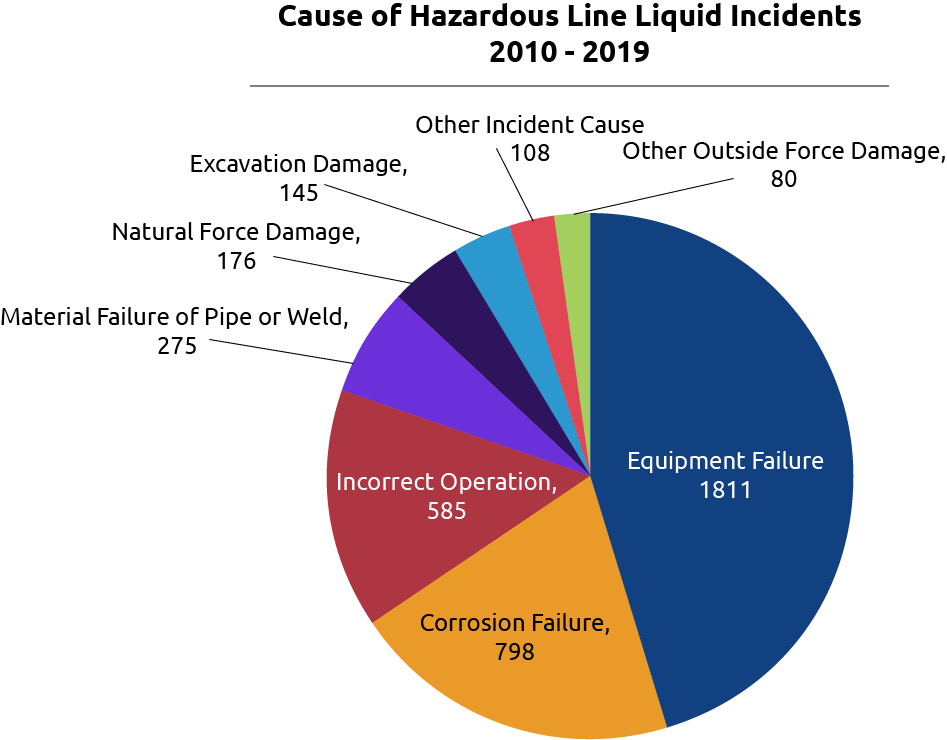
Cause of Incidents - Pie Chart
Figure 2. Cause of Hazardous Liquid Line Incidents 2010-2019. Data from PHMSA.
The most important statistics when considering pipeline incidents are those representing bodily harm – injuries and fatalities. In those respects, at least, 2019 was a good year for hazardous liquid pipelines, with no reported injuries or fatalities. Most of the other metrics were below average as well, including 362 total incidents, three evacuees, $115 million in damages, and zero explosions. The 13 reported fires represents a typical year. However, we should keep in mind that the results may not be complete for 2019. The data was downloaded on February 3, 2020, but represented the January 2020 update of the dataset. Additionally, there is often a gap between the incident date and the reporting date, which is sometimes measured in months.
One thing that really sticks out about hazardous liquid pipelines is that the pipelines that fail the most often are the newest. Of the hazardous liquid incidents since 2010, 906 occurred in pipelines that were installed within the decade. By means of comparison, the same amount of incidents occurred in the same period for pipes installed in the 40 years between 1970 and 2009. Of course, the largest category is “Unspecified,” where the install year of the pipeline was left blank in 1,459 of the 3,978 total incidents (37%).
The causes of the incidents are dominated by equipment failure, where the 1,811 incidents accounted for 46% of the total. The next highest total was corrosion failure with 798 incidents, or 20% of the total. Six of the incidents in the “Other Outside Force Damage” are attributed to intentional damage, representing 0.15% of the total.
Gas Transmission & Gathering
Incident Impact Summary - Table 3
Table. 3. Gas Transmission and Gathering Pipeline Incident Impact Summary. Data from PHMSA.
Year
Incidents
Fatalities
Injuries
Evacuees
Damages ($)
Fires
Explosions
2010
116
10
61
373
596,151,925
19
7
2011
128
0
1
874
125,497,792
14
6
2012
116
0
7
904
58,798,676
15
7
2013
112
0
2
3,103
53,022,396
11
4
2014
142
1
1
1,482
61,533,154
15
6
2015
149
6
16
565
61,498,753
10
6
2016
97
3
3
944
107,524,564
8
4
2017
126
3
3
202
85,665,233
17
7
2018
118
1
7
4,088
77,753,611
17
6
2019
122
1
7
449
87,716,872
7
4
Grand Total
1,226
25
108
12,984
1,315,162,976
133
57
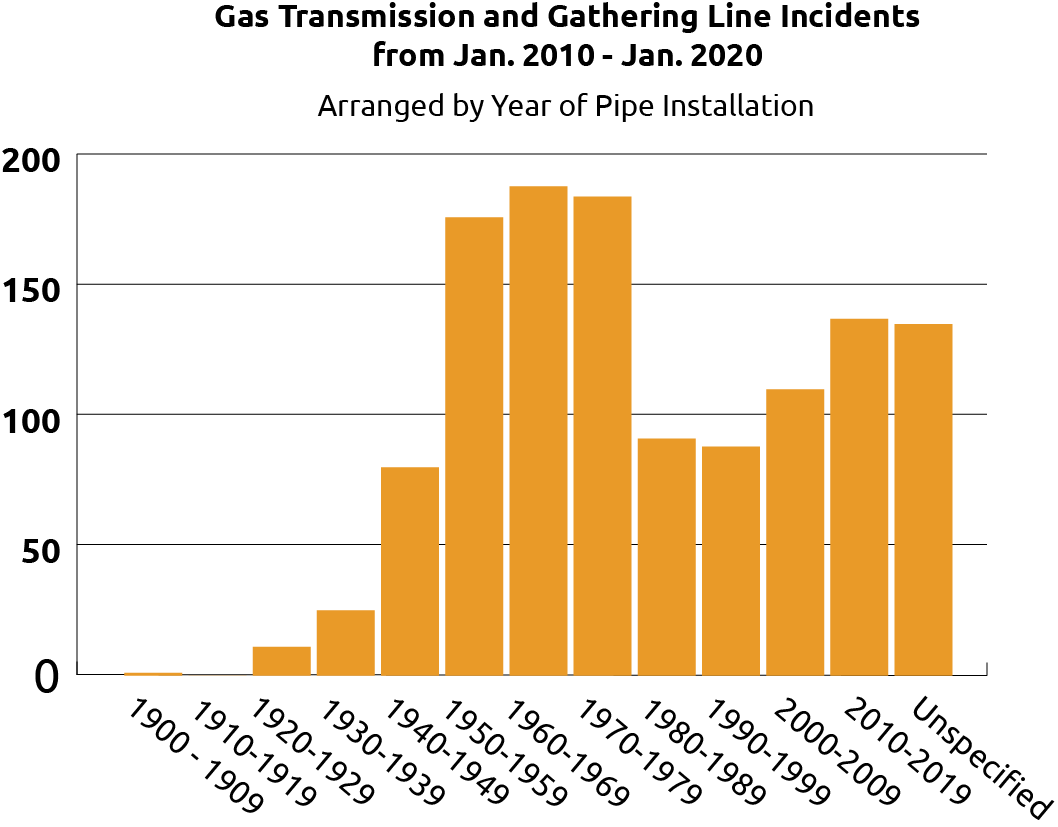
Age of Pipelines - Histogram
Fig. 3. Gas Transmission and Gathering Pipeline Incidents from Jan. 2010 – Jan. 2020, Arranged by Year of Pipe Installation. Data from PHMSA.
Cause of Incidents - Pie Chart
Fig. 4. Cause of Gas Transmission and Gathering Line Incidents from 2010 – 2019. Data from PHMSA.
One person died and seven were injured from gas transmission and gathering line accidents that were reported to PHMSA in 2019, which were both below average for this dataset. The total number of incidents was typical, while the 499 evacuees, $88 million in property damage, seven fires, and four explosions were all below normal. Note that only a small fraction of the nation’s gathering lines are required to report incident data to PHMSA, so this data should not be seen as comprehensive. And as with the hazardous liquid incidents, it is likely that not all incidents occurring during the year have had reports filed in time for this analysis.
The distribution of the age of pipes that failed within the past decade is different from the hazardous liquid pipelines. Pipes installed in the 1950s, 1960s, and 1970s were the most likely to fail, although failures in routes built this century represent a secondary peak. The number of incidents where the age of pipe data field was not completed remains high at 135 incidents, but the data gap is not as outrageous as it is for hazardous liquid lines.
Once again, equipment failure is the most common cause of transmission and gathering line accidents, with 390 incidents accounting for 32% of the total. Corrosion failure was the second most common reason, with 239 incidents accounting for an additional 19%. One incident was attributed to intentional damage, accounting for 0.08% of the total.
Gas Distribution
Incident Impact Summary - Table 4
Year
Incidents
Fatalities
Injuries
Evacuees
Damages ($)
Fires
Explosions
2010
120
11
44
2,080
21,155,972
82
29
2011
116
13
53
4,417
27,105,022
73
32
2012
88
9
46
746
25,556,562
61
22
2013
104
8
36
1,606
37,363,960
59
20
2014
106
18
93
2,037
72,885,067
61
30
2015
101
4
32
948
32,176,608
65
24
2016
115
10
75
2,510
56,900,068
71
28
2017
104
16
34
1,960
72,226,380
57
17
2018
110
7
81
2,561
827,647,610
64
31
2019
130
9
28
1,661
56,172,748
66
24
Grand Total
1,094
105
522
20,526
1,229,189,997
659
257
Table 4. Gas Distribution Pipeline Incident Impact Summary. Data from PHMSA.
Age of Pipelines - Histogram
Figure 5. Gas Distribution Line Incidents from jan. 2010 – Jan. 2020, Arranged by Year of Pipe Installation. Data from PHMSA.
Cause of Incidents - Pie Chart
Figure 6. Cause of Gas Distribution Line Incidents: 2010 – 2019. Data from PHMSA.
The nine fatalities and 28 injuries reported for gas distribution lines in 2019 were obviously tragic, but these totals are both below what would be expected in a typical year. The 130 incidents and 66 fires were both above average totals, while the 1,661 evacuees, $56 million in property damage, and 24 explosions were all below average. As with the other reports, these totals are subject to change as additional reports are filed.
The distribution for the age of pipes that failed during the past decade is more like a normal (or bell curve) distribution than the other two datasets, with the most incidents occurring in pipeline routes laid in the 1990s. Much like the hazardous liquids dataset, however, the largest category is “Unspecified”, where the age of the pipe was not entered into the data for one reason or another. These 222 incidents account for 20% of the total, and if we had this data, the distribution could be significantly different.
The causes of distribution line incidents are attributed very differently than either the hazardous liquids or transmission and gathering line datasets. The leading cause is “Other Outside Force Damage,” with 355 incidents accounting for 32% of the total, followed by 330 “Excavation Damage” incidents accounting for an additional 30%. This difference could well be explained because this type of line tends to occur in highly populated areas. The largest subtype for the outside force damage category is damage by motor vehicles not involved in excavation, with 160 incidents, followed by fires or explosions which the operator claims did not originate with the pipeline, with 78 incidents. Intentional damage remains rare – although still way too high – with 15 incidents, or 1.4% of the overall total.
Data Notes
PHMSA incident data is ultimately self-reported by the various operators. Because the vast majority of gathering lines do not report to the agency, this dataset should not be seen as comprehensive for incidents in that category.
There were eleven issues with faulty location data that we were able to correct for this map. There are likely to be more, as only the ones with coordinates rendering outside of the United States were identified. Some of these had mixed up latitude and longitude values, or omitted the negative value for longitude, placing the points in Kyrgyzstan, the Himalayas, and Mongolia. One record had no coordinates at all, but included a detailed description of the location, which was then found on Google Maps. Two wells that rendered in Canada were on the correct longitude for the county that they belonged in, but had faulty latitude values. One of these was reduced by exactly 20° of latitude, while the other was reduced by exactly 7° of latitude, and were then located in the proper county. Other than the adjustments for these eleven incidents, all location data reflects the data available on the PHMSA .
Additional Leaks
The data above reflects 6,298 incidents over the course of a decade, with a few more incidents likely to trickle in during the next few updates of the reports by PHMSA. And while these discrete incidents account for the majority of human impacts in terms of life and well-being, it is worth noting that these 1.7 incidents per day are not the only problems that occur along millions of miles of pipelines in this country.
William Limpert has analyzed information about pipeline leakage in gas transmission lines, which found that 0.35% of the volume of gas was lost in transmission, one tenth of which was vented or flared intentionally, for example in compressor station blowdown events. This means that 0.315% of the gas is released unintentionally.
These numbers sound tiny, but due to the enormous volume of gas transported in pipes, they really add up quickly. For example, the Atlantic Coast Pipeline, Mr. Limpert’s primary focus, is scheduled to transmit 1.5 billion cubic feet (Bcf) of natural gas per day. At a typical rate of failure, we could expect leakage of 4.725 million cubic feet (MMcf) per day, or 1.725 billion cubic feet over the course of a year. That’s enough gas to provide to all Pennsylvania residential consumers for about 13 days in August, and this is just from one pipeline.
As mentioned above, the entire pipeline network moved about 28 Tcf in 2018. The estimated amount leaked at 0.315% is 88.2 Bcf. What would residential consumers pay for that volume of gas? Even with the current low prices due to the gas glut, the average residual price was $9.43 per Mcf in November 2019, the most recent data available. That means that residential consumers would pay roughly $832 million for an equivalent amount of gas.
Still More Leaks
There are also countless leaks that occur during the construction of the pipelines themselves. When pipelines are built, they have numerous obstacles to navigate during their construction. Among the most challenging are linear obstacles, such as roads and streams. A method that the industry regularly uses to avoid having to trench through these features is horizontal directional drilling (HDD).
While HDDs are meant to minimize impacts, they very frequently result in an incident known as an “inadvertent return,” when volumes of drilling mud return to the surface through a series of underground voids, frequently karst geology or abandoned mines. The leaking borehole under the road or stream then leaks drilling mud – sometimes thousands of gallons of it – which can then affect aquatic stream life. Additionally, these areas represent voids in the matrix that is intended to keep the pipeline stable and may represent future opportunities for catastrophic failure.
These features are so prevalent in some parts of the country that pipeline operators seem to be unable to avoid them, and regulators seem unwilling to press the issue in a proactive fashion. For example, Energy Transfers’ Mariner East II pipeline is currently being built to move natural gas liquids from Appalachia to its industrial complex and export terminal at Marcus Hook, Pennsylvania. During construction, there have been hundreds of inadvertent returns, both to the soil and waters of the Commonwealth. The presence of karst and abandoned mines along the route were well known ahead of time to the operator designing and implementing the HDDs, as well as the regulators who approved their use.
The many issues along the Mariner East II route, when combined with a massive pipeline explosion in Beaver County led to Pennsylvania’s decision to temporarily block all permit actions by the operator statewide. That hold is now lifted, leading residents along the route worried about a new batch of inadvertent returns, related sinkholes, and other follies as the project is completed. Construction activities for the parallel Mariner East 2X pipeline are already underway.
While residents along the Mariner East pipeline system have seen more than their fair share of impacts from the construction, these impacts are not at all rare on unusual. What is unusual, however, is for regulators to provide data highlighting these types of errors. In Pennsylvania, enough people requesting data on a variety of problematic pipelines has prompted the Department of Environmental Protection to create a Pennsylvania Pipeline Portal page. This only includes information on recent major pipeline projects and is not comprehensive in terms of content, but it is a major step in the right direction in terms of data transparency.
Can We Do Better?
Statistics can never capture the full force of tragedies. Most of us are aware of this point intellectually, and yet when we are confronted with such numbers, it seems that we are obliged to process them in one form or another. Perhaps the most common way is to compartmentalize it, where we might acknowledge the data and misfortune that they represent, but the file it away in the messy cabinet of our mind, clearing the slate of active thought for the next bit of information. Many of us never stop to question whether we can do better.
So, can we do better with pipelines? Perhaps so. If there are structural hazards such as abandoned mines or karst, perhaps regulators could demand that the operator route around them. If there are residents nearby, communities should demand that the pipeline get rerouted as well. Of course, these reroutes will just push the impacts elsewhere, but hopefully to an area where people won’t be affected by them, if such a place exists. Certainly, there could be better standards for construction and identification, so that there are fewer accidents involving pipelines. Or better yet, we could transition to renewable fuels for an ever-increasing share of our energy needs, making dirty and dangerous pipelines a relic of the past.
The one thing that we can no longer afford to do is continue to stick our fingers in our ears and dismiss the entire issue of pipeline safety as manageable or the cost of doing business.
By Matt Kelso, Manager of Data and Technology, FracTracker Alliance
Feature image at top of page shows San Bruno, California, following the 2010 pipeline explosion
https://fractracker.org/wp-content/uploads/2019/02/San-Bruno-Aftermath-feature-image.png400900Matt Kelso, BAhttps://fractracker.org/wp-content/uploads/2025/09/2025-Wordmark-Logo.pngMatt Kelso, BA2020-02-21 16:13:542021-04-15 14:55:30Pipelines Continue to Catch Fire and Explode
A recent study out of Carnegie Mellon University estimated that for every three job years created by fracking in the Marcellus Shale, one year of life is lost for a resident due to increased pollution exposure. As fracking continues to expand around the perimeter of Allegheny County, Pennsylvania — one of the top ten most polluted regions in the U.S. — we’re called to question how this industry is impacting the area’s already poor air quality. To answer this question, Southwest Pennsylvania Environmental Health Project (EHP), and FracTracker Alliance conducted a study on air quality around sites impacted by fracking development.
Over the course of this past year, we set up air monitors in seven communities in or near Allegheny County with current or proposed oil and gas infrastructure, with the goal of gathering baseline data and identifying possible public health concerns.
The sites in question are mapped and described below. Click on the arrow to scroll through maps of the different sites.
North Braddock: Merrion Oil and Gas has proposed a fracking well on the property of the Edgar Thomson Steel Works, near where North Braddock, East Pittsburgh, and North Versailles meet.
Plum Borough: Penneco has proposed to build a wastewater disposal well in Plum Borough. We placed three monitors at homes in areas where the air is likely to be impacted by construction and truck traffic should the wastewater disposal well be installed.
Economy Borough (Beaver County): We monitored around PennEnergy Resource’s B50 well pad, which recently began construction. Of particular concern to residents is the increase in truck traffic along a narrow road in a residential neighborhood that will be used to access the well pad.
Frazer Township: Monitoring took place around the Gulick, Schiller, and Bakerstown well pads.During their monitoring period, there was reported fracking activity on one well, and drilling activity on another.
Elizabeth Township: Monitoring occurred around three EQT and Olympus Energy fracked well pads listed as active; fracking reportedly occurred on one well pad during the monitoring period.
Indiana Township: Monitoring followed the construction of the Miller Jr. fracked well pad.
Stowe Township: Monitoring occurred in Stowe Township, where McKees Rocks Industrial Enterprise (MRIE) is located, and in adjacent McKees Rocks. This facility processes and transports frac sand, which operators use to frack a well by injecting it at extremely high pressures underground.
PM2.5 is a pollutant small enough to enter our lungs and bloodstream and therefore poses a great risk to human health.
The process of constructing, drilling and fracking a well releases a variety of pollutants, including particulate matter, volatile organic compounds (VOCs), and nitrous oxides (NOx).
Allegheny County has some of the worst air quality in the nation. In recent years, the air quality in the Pittsburgh metropolitan area, which had been improving since 2005, began to worsen. This is due in part to fracking activities.
There are 163 fracked wells that have been drilled in Allegheny County, all of which pose a threat to human health.
This initial air quality study by Southwest Environmental Health Project and FracTracker found that areas with proposed fracking sites are particularly vulnerable because they already have poor air quality.
Further investigations will need to monitor air quality throughout different stages of development and during different seasons in order to provide meaningful comparisons of changes in air quality that could be correlated with oil and gas development.
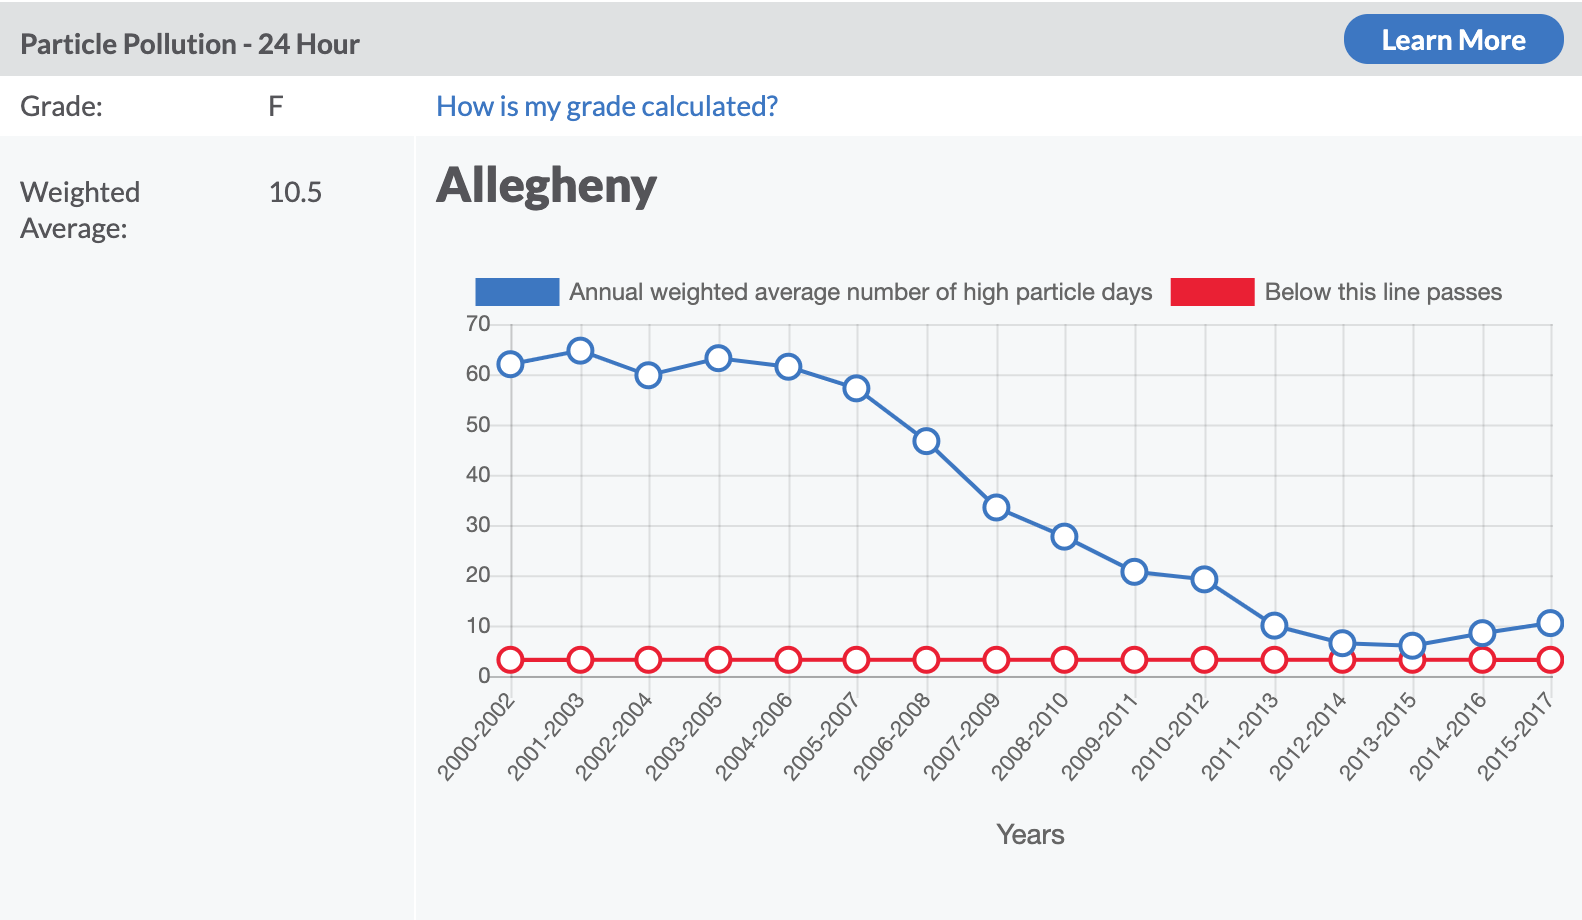
Allegheny’s air – from bad to worse
In recent years, the air quality in the Pittsburgh metropolitan area, which had been improving since 2005, began to worsen. According to the 2019 State of the Air report, levels of ozone and particle pollution increased over 2015-2017 (Figure 1).
This fact echoes a nationwide trend. Another study out of Carnegie Mellon University found that after several years of improvement, air pollution in the United States worsened in 2017 and 2018. The study cited several possible explanations, including increased natural gas production, more wildfires, and a rollback on Clean Air Act regulations by the EPA.
While Allegheny County’s air pollution is largely attributable to steel, coal, and chemical plants, in the last decade, the oil and gas industry has brought many new sources of pollution to the area.
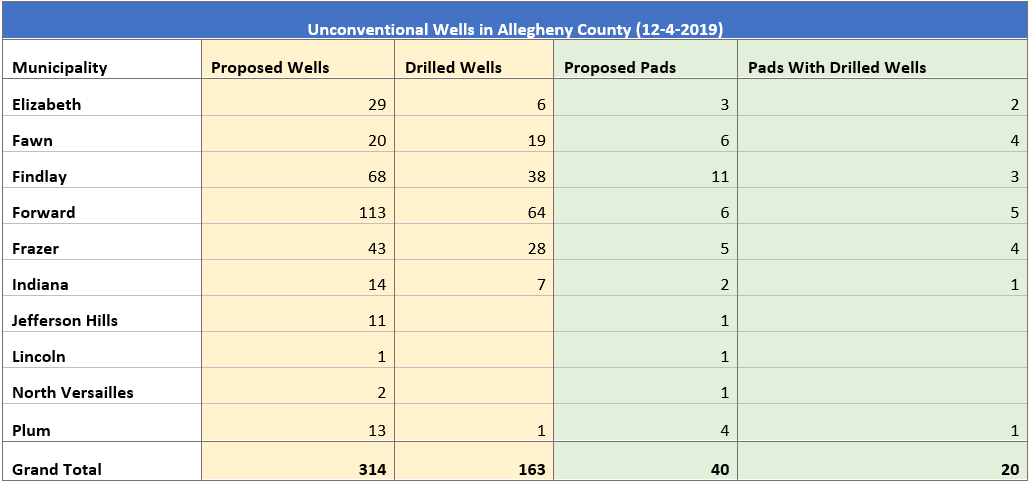
As of December, 2019, operators have drilled 163 fracking wells in the county (Table 1) and constructed nine compressor stations. Additional pollution caused by the oil and gas industry is attributable to the thousands of truck trips required to frack a well.
Table 1. Fracked wells in Allegheny County by municipality
The fracking process releases emissions that can affect human health at every stage of its lifespan. Research has linked fracking to immediate health symptoms, such as burning eyes, sore throat, and headaches. Ongoing research has identified the potential for long term health impacts, such as cardiovascular disease and adverse birth outcomes.
Air pollution from the oil and gas industry does not impact everyone equally. An individual’s response to exposure varies depending on factors such as age and health conditions.
There is also a great deal of variation amongst wells and compressor stations when it comes to emissions. As such, the best way to understand someone’s exposure is to monitor the places they frequent, such as the home, school, or workplace.
Types of Pollutants
The process of drilling and fracking a well releases a variety of pollutants, including particulate matter, volatile organic compounds (VOCs), and nitrous oxides (NOx). Table 2, below, shows reported emissions from gas wells in Allegheny County for 2017.
Table 2. Reported emissions from Allegheny County gas wells in 2017, from the PA DEP
POLLUTANT
Emission Amount (Tons)
2,2,4-Trimethylpentane
0.00093
Benzene
0.10466
Carbon Dioxide
22982.68774
CO
66.20016
Ethyl Benzene
0.00053
Formaldehyde
0.02366
Methane
714.90485
n-Hexane
0.16083
Nitrous Oxide
0.2332
NOX
270.81382
PM10
8.87066
PM2.5
8.74341
SOX
0.23478
Toluene
0.04636
VOC
21.68682
Xylenes (Isomers And Mixture)
0.03487
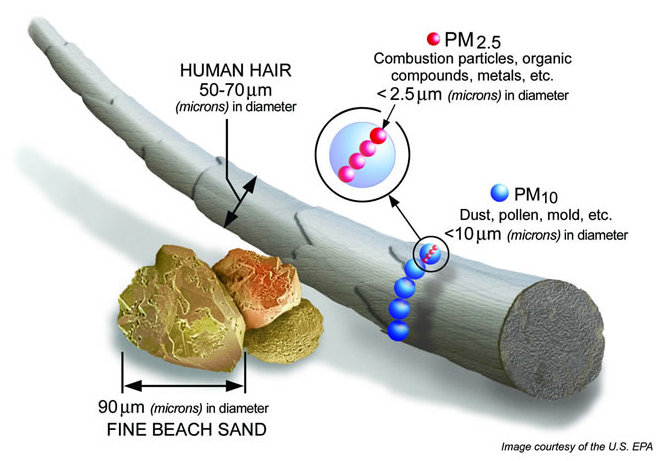
Our study looked at particulate matter (PM) – a mix of solid particles and liquids found in the air, like dust, soot, and smoke. Specifically, the study focused on PM2.5, which are particles less than 2.5 microns in diameter (Figure 2). PM forms during construction activities, combustion processes such as those in diesel engines, and from industrial sites and facilities.
Fracking and its associated processes release hazardous chemicals into the air, which then attach to PM2.5. Additionally, combustion engines of trucks and machinery used to construct well sites and drill wells release diesel emissions, including PM2.5. Compressor stations and flaring are additional sources.
PM2.5 is small enough to enter our lungs and bloodstream and therefore poses a great risk to human health. Their health impacts include reduced lung function and cardiovascular disease, as well as short term effects such as sinus irritation.
Figure 2. Particulate matter diagram, from the US EPA
The monitors were placed at varying distances and directions from the facility in question, not exceeding 1.5 miles from the facility in question. We used Speck monitors indoors and Purple Air monitors outdoors; both types measured the concentration of particulate matter over roughly one month.
The EPA’s guideline for exposure to PM2.5 is 35 μg/m3 averaged over 24 hours. However, averaging exposure over 24 hours can obscure peaks- relatively short time spans of elevated PM2.5 concentrations. While it is normal for peaks to occur occasionally, high, long, or frequent peaks in pollution can affect people’s health, particularly with acute impacts such as asthma attacks.
Results
The graphs below show our results. On each graph, you’ll see three to five lines, one for each outdoor monitor. Lines that follow similar trends show data that is likely an accurate representation of air quality in the community. Lines that stray from the pack may represent a unique situation that only that house is experiencing.
In addition to graphing the results, EHP used the following parameters to analyze the data:
Frequency of peaks
Duration of peaks
Time between peak exposures
Baseline (level of particles generally found outside when peaks are not occurring)
Total sum (or quantity) of peak exposure
These five parameters were compared to EHP’s data gathered from roughly 400 sites in Ohio, West Virginia, New York, and Pennsylvania. This database compiles air quality data from locations that have no infrastructure present as well as nearby sites such as well pads, compressor stations, frac-sand terminals, processing facilities, etc.
In the table below, numbers in green indicate values that are better than EHP’s averages, while red values show values that are worse than the average of EHP’s dataset. Black numbers show values that are average.
Table 3. EHP/FracTracker sites of air quality investigation in Allegheny County
*The proposed well is near the intersection of East Pittsburgh, North Braddock, and North Versailles
**Monitors were also placed in neighboring McKees Rocks
~In homes where baseline levels of PM2.5 are low, such as in Frazer and Economy, peaks are more easily registered in our analysis, but they typically have a smaller magnitude compared to homes that have high baselines.
Discussion
Communities with proposed sites
In North Braddock and Plum Borough, the outdoor air monitors collected data around sites of future and/or proposed activity. This baseline monitoring helps us understand what the air is like before oil and gas activity and is essential for understanding the future impact of oil and gas development in a community.
In these neighborhoods, we found worse than average values for total accumulation of PM2.5. This may be due to other patterns of PM2.5 movement in the area related to weather and surrounding sources of pollution. North Braddock is an urban environment, and therefore has pollution from traffic and buildings. Another source is the Edgar Thomson Steel Works, one of the county’s top polluters. While Plum Borough is more rural, it also contains an active fracking well pad and is near a coal-fired power plant and a gas power plant.
If constructed, the proposed fracking well and the proposed wastewater disposal well will add additional pollution from construction, truck traffic, and in North Braddock’s case, emissions from the well itself. This may pose a significant health risk, especially in vulnerable populations like children and those with preexisting health conditions.
Communities with constructed well pads
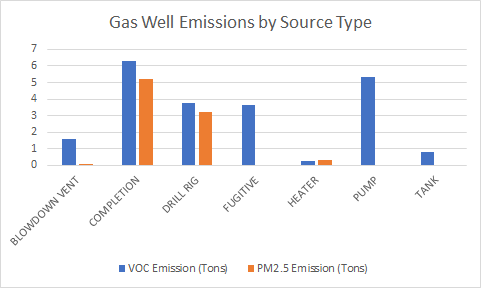
Emissions vary across the timeline of drilling and fracking a well. Figure 2 below shows reported emissions of PM2.5 and VOCs from different components of a fracking operation. PM2.5 emissions are highest during drilling (when the well bore is formed) and completion (when the well is fracked by injecting high volumes of water, sand, and chemicals at tremendous pressure). For a step by step outline of the fracking process, check out FracTracker’s fracking operation virtual tour.
Figure 2. 2017 emissions from Allegheny County gas wells at different stages in the fracking process, reported to the PA DEP
Our monitoring in Economy Borough, where construction on PennEnergy Resources’ B50 well pad had just begun, showed air quality that is better than EHP’s averages. However, if the wells on the well pad are drilled and fracked, EHP hopes to provide monitors again to track changes in air quality. In addition to emissions from the fracking well, which is close to the Chestnut Ridge housing development, residents are concerned about truck traffic along Amsler Ridge Road.
In Indiana, while residents reported truck traffic to the site, the wells were not fracked during the monitoring period. The measurements were average or slightly above the average EHP typically sees near homes. Looking at these results, peak duration was flagged, and the total sum of particulate matter was slightly elevated compared to our average suggesting that the long durations may ignite a health response in sensitive individuals. Other sources that could be contributing to pollution include the PA Turnpike and the Redland Brick manufacturer.
In Frazer, there was reported fracking activity on one well and drilling activity on another; these time periods were only slightly elevated on the hourly average charts. Monitors were left at two households in Frazer because there was an indication that fracking would start soon.
In Elizabeth Township, air quality measurements were generally better compared to the rest of EHP’s data, but there were clear peaks that all monitors registered which generated a similar, if not potentially higher, amounts of accumulated PM2.5.
Frac sand facility
Finally, monitors around MRIE, the frac sand processing facility in Stowe Township, showed air quality that may pose a health risk. The peaks in these neighborhoods generated a higher amount of accumulated PM2.5 and lasted longer compared to the rest of our data. In addition to pollution from MRIE and its associated trucks and trains, the neighborhood has many sources of pollution, including highways and industrial facilities on Neville Island.
Limitations
This study is limited in that PM2.5 was the only pollutant that the Purple Air and Speck monitors captured. To understand the complete burden of air pollution residents are exposed to, other pollutants such as VOCs, must be monitored.
Additionally, monitoring occurred over a short time period. Further investigations will need to monitor air quality throughout different stages of development and during different seasons in order to provide meaningful comparisons of changes in air quality that could be correlated with oil and gas development. EHP will continue to monitor around certain active sites to watch for changes in the data.
Get Involved
If you’re concerned about health or environmental impacts from a well in your neighborhood, make sure to document the issue by taking notes, photos, and videos, and file a complaint with the state’s Department of Environmental Protection. To report an environmental health concern, reach out to the Department of Health by phone at 1-877 PA Health (1-877-724-32584) or email (RA-DHENVHEALTH@pa.gov). If you’re an employer or worker and have health or safety concerns, reach out to your area’s OSHA office or call 1-800-321-OSHA (6742).
While cleaning up the air in your community is difficult, there are steps you can take to protect the air in your home. With the average American spending 90% of their time indoors, the air inside can greatly impact your health. For this project, we also set up air monitors in residents’ homes so participants could better understand these risks. Visit EHP’s resources under the section “What You Can Do” to learn more about protecting your indoor air quality. To learn more about how fracking is impacting residents in southwest Pennsylvania, explore the Environmental Health Channel.
Finally, help us crowdsource new data on the impacts and status of oil and gas development in your community by reporting what you see, hear, smell, and question on the FracTracker mobile app (also available from your computer!). Those living near oil and gas infrastructure are the best source of knowledge when it comes to understanding the impacts of this industry. With your help, we want to make sure all of these impacts are being documented to inform decision makers and residents about the risks of fracking.
Many thanks to the Southwest Environmental Health Project for including us as collaborators on this study.
https://fractracker.org/wp-content/uploads/2019/12/drilling-rig-scaled.jpg6671500Erica Jacksonhttps://fractracker.org/wp-content/uploads/2025/09/2025-Wordmark-Logo.pngErica Jackson2019-12-18 10:56:062021-04-15 14:55:33Allegheny County Air Quality Monitoring Project
Pennsylvania’s fracking industry is producing record amounts of toxic waste — where does it all go?
Drilling for methane and other fossil fuels is an energy-intensive process with many associated environmental costs. In addition to the gas that is produced through high volume hydraulic fracturing (“unconventional drilling,” or “fracking”), the process generates a great deal of waste at the drill site. These waste products may include several dozen tons of drill cutting at every well that is directionally drilled, in addition to liner materials, contaminated soil, fracking fluid, and other substances that must be removed from the site.
In 2018, Pennsylvania’s oil and gas industry (including both unconventional and conventional wells) produced over 2.9 billion gallons (nearly 69 million barrels) of liquid waste, and 1,442,465 tons of solid waste. In this article, we take a look at where this waste (and its toxic components) end up and how waste values have changed in recent years. We also explore how New York State, despite its reputation for being anti-fracking, isn’t exempt from the toxic legacy of this industry.
Waste that comes back to haunt us
According to a study by Physicians, Scientists and Engineers, over 80% of all waste from oil and gas drilling stays within the state of Pennsylvania. But once drilling wastes are sent to landfills, is that the end of them? Absolutely not!
Drilling waste also gets into the environment through secondary means. According to a recent report by investigative journalists at Public Herald, on average, 800,000 tons of fracking waste from Pennsylvania is sent to Pennsylvania landfills. When this waste is sent to landfills, radioactivity and other chemicals can percolate through the landfill, and are collected as leachate, which is then shipped to treatment plants.
Public Herald documented how fourteen sewage treatment plants in Pennsylvania have been permitted by Pennsylvania’s Department of Environmental Protection (PA DEP) to process and discharge radioactive wastes into more than a dozen Pennsylvania waterways.
Public Herald’s article includes an in-depth analysis of the issue. Their work is supported by a map of the discharge sites, created by FracTracker.
Trends over time
Pennsylvania Department of Environmental Protection maintains a rich database of oil and gas waste and production records associated with their Oil and Gas Reporting Website. The changes in waste disposal from Pennsylvania’s unconventional drilling reveal a number of interesting stories.
Let’s look first at overall unconventional drilling waste.
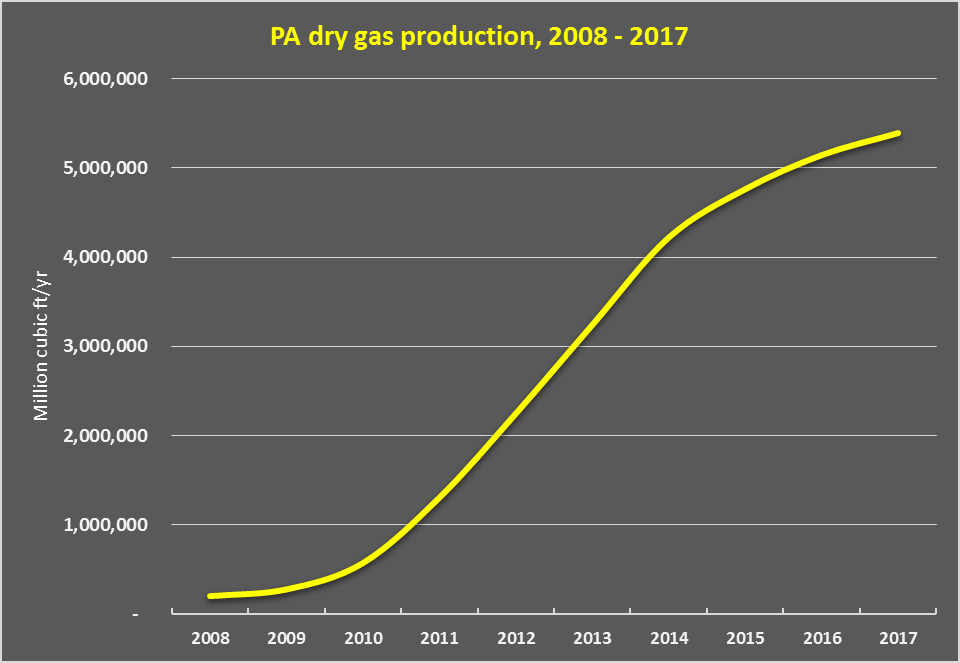
According to data from the federal Energy Information Administration, gas production in Pennsylvania began a steep increase around 2010, with the implementation of high volume hydraulic fracturing in the Marcellus Shale (see Figure 1). The long lateral drilling techniques allowed industry to exploit exponentially more of the tight shale via single well than was ever before possible with conventional, vertical drilling.
Figure 1. Data summary from FracTracker.org, based on EIA data.
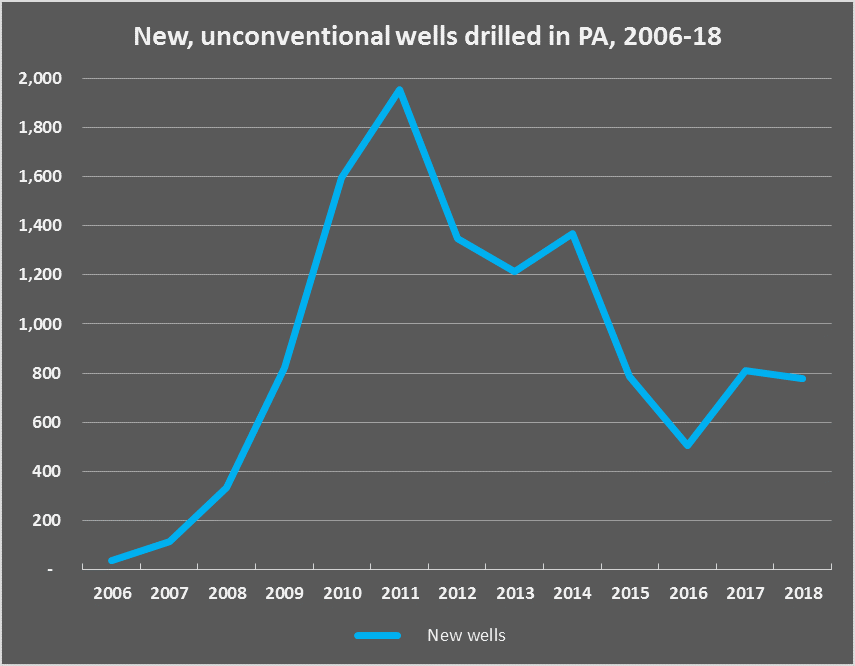
The more recently an individual well is drilled, the more robust the production. We see an overall increase in gas production over time in Pennsylvania over the past decade. Paradoxically, the actual number of new wells drilled each year in the past 4-5 years are less than half of the number drilled in 2011 (see Figure 2).
Figure 2: Data summary from FracTracker.org, based on PA DEP data
Why is this? The longer laterals —some approaching 3 miles or more—associated with new wells allow for more gas to be extracted per site.
With this uptick in gas production values from the Marcellus and Utica Formations come more waste products, including copious amounts drilling waste, “produced water,” and other byproducts of intensive industrial operations across PA’s Northern Tier and southwestern counties.
Comparing apples and oranges?
When we look at the available gas production data compared with data on waste products from the extraction process, some trends emerge. First of all, it’s readily apparent that waste production does not track directly with gas production in a way one would expect.
Recall that dry gas production has increased annually since 2006 (see Figure 1). However, the reported waste quantities from industry have not followed that same trend.
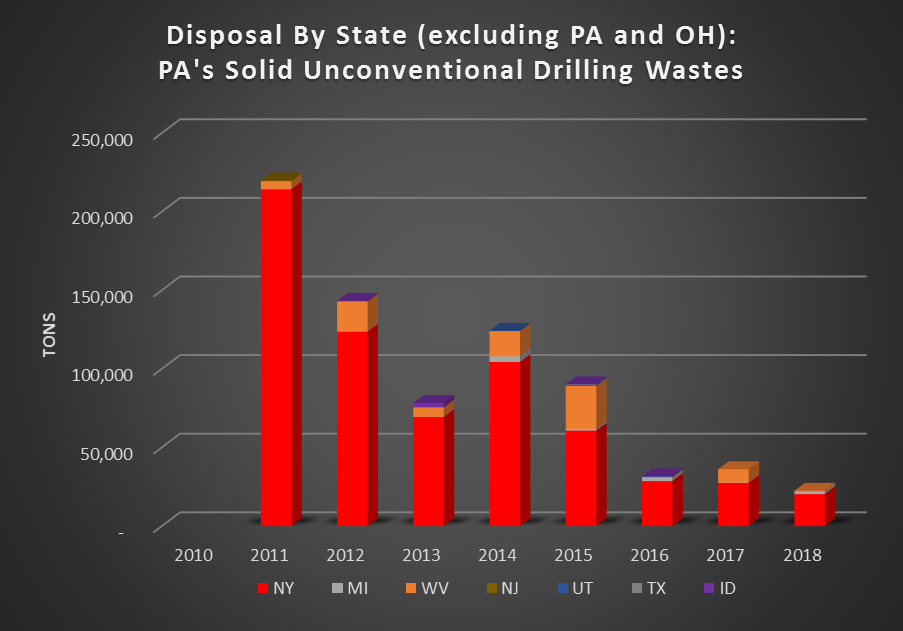
In the following charts, we’ve split out waste from unconventional drilling by solid waste in tons (Figure 3) and liquid waste, in barrels (Figure 4).
Figure 3: Annual tonnage of solid waste from the unconventional oil and gas industry, organized by the state it is disposed in. Data source: PA DEP, processed by FracTracker Alliance
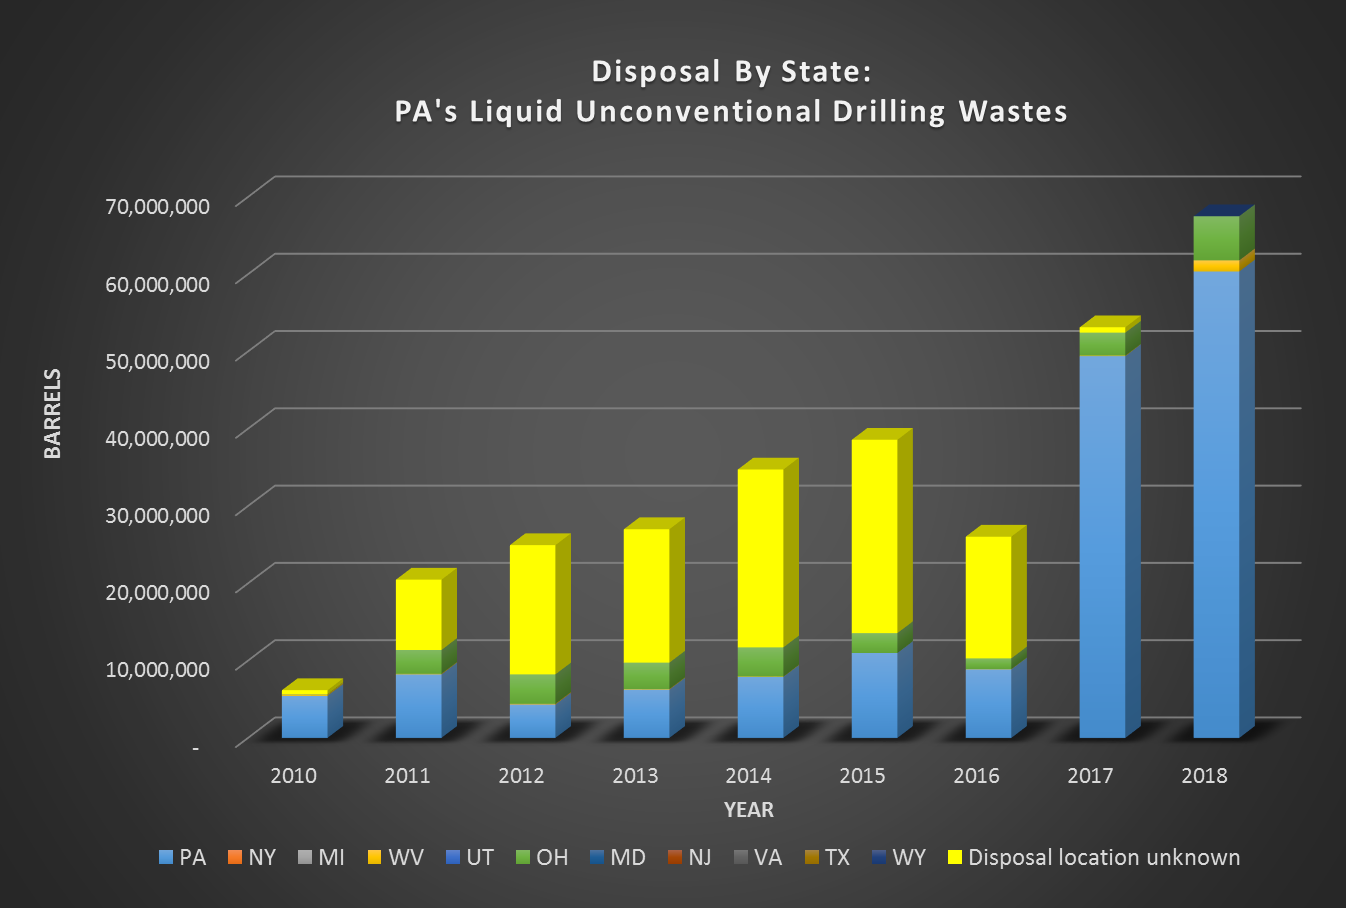
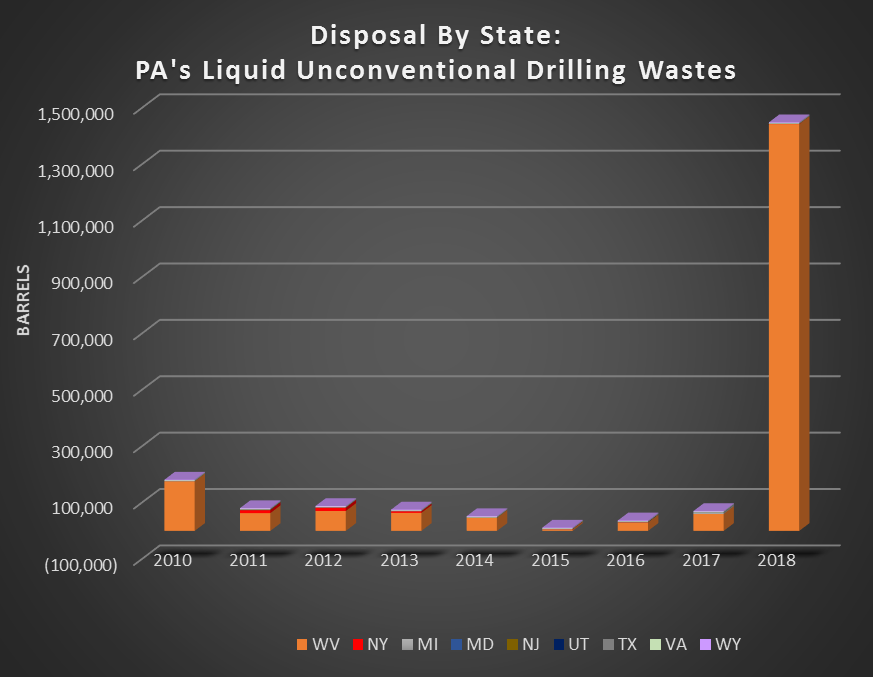
Figure 4: Annual volume of liquid waste from the unconventional oil and gas development, organized by state it is disposed in. One barrel is equivalent to 42 gallons. Data source: PA DEP, processed by FracTracker Alliance
Note the striking difference in disposal information for solid waste, compared with liquid waste, coming from Pennsylvania.
“Disposal Location Unknown”
Until just the last year, often more than 50% of the known liquid waste generated in PA was disposed of at unknown locations. The PA DEP waste report lists waste quantity and method for these unknown sites,depending on the year: “Reuse without processing at a permitted facility,” “Reuse for hydraulic fracturing,” “Reuse for diagnostic purposes,” “Reuse for drilling or recovery,” “Reuse for enhanced recovery,” and exclusively in more recent years (2014-2016), “Reuse other than road-spreading.”
In 2011, of the 20.5 million barrels of liquid waste generated from unconventional drilling, about 56% was allegedly reused on other drilling sites. However, over 9 million barrels—or 44% of all liquid waste—were not identified with a final destination or disposal method. Identified liquid waste disposal locations included “Centralized treatment plant for recycle,” which received about a third of the non-solid waste products.
In 2012, the quantity of the unaccounted-for fracking fluid waste dropped to about 40%. By 2013, the percentage of unaccounted waste coming from fracking fluid dropped to just over 21%, with nearly 75% coming from produced fluid, which is briny, but containing fewer “proprietary”—typically undisclosed—chemicals.
By 2017, accounting had tightened up further. PA DEP data show that 99% of all waste delivered to undisclosed locations was produced fluid shipped to locations outside of Pennsylvania. By 2018, all waste disposal was fully accounted for, according to DEP’s records.
In looking more closely at the data, we see that:
Prior to 2018, well drillers did not consistently report the locations at which produced water was disposed of or reused. Between 2012 and 2016, a greater volume of unconventional liquid waste went unaccounted for than was listed for disposal in all other locations, combined.
In Ohio, injection wells, where liquid waste is injected into underground porous rock formations, accounted for the majority of the increase in waste accepted there: 2.9 million barrels in 2017, and 5.7 million barrels in 2018 (a jump of 97%).
West Virginia’s acceptance of liquid waste increased significantly in 2018 over 2017 levels, a jump of over a million barrels, up from only 55,000. This was almost entirely due to unreported reuse at well pads.
In 2018, reporting, in general, appears to be more thorough than it was in previous years. For example, in 2017, nearly 692,000 barrels of waste were reused at well pads outside PA, but those locations were not disclosed. Almost 7000 more barrels were also disposed of at unknown locations. In 2018, there were no such ambiguities.
A closer look at Pennsylvania’s fracking waste shipped to New York State
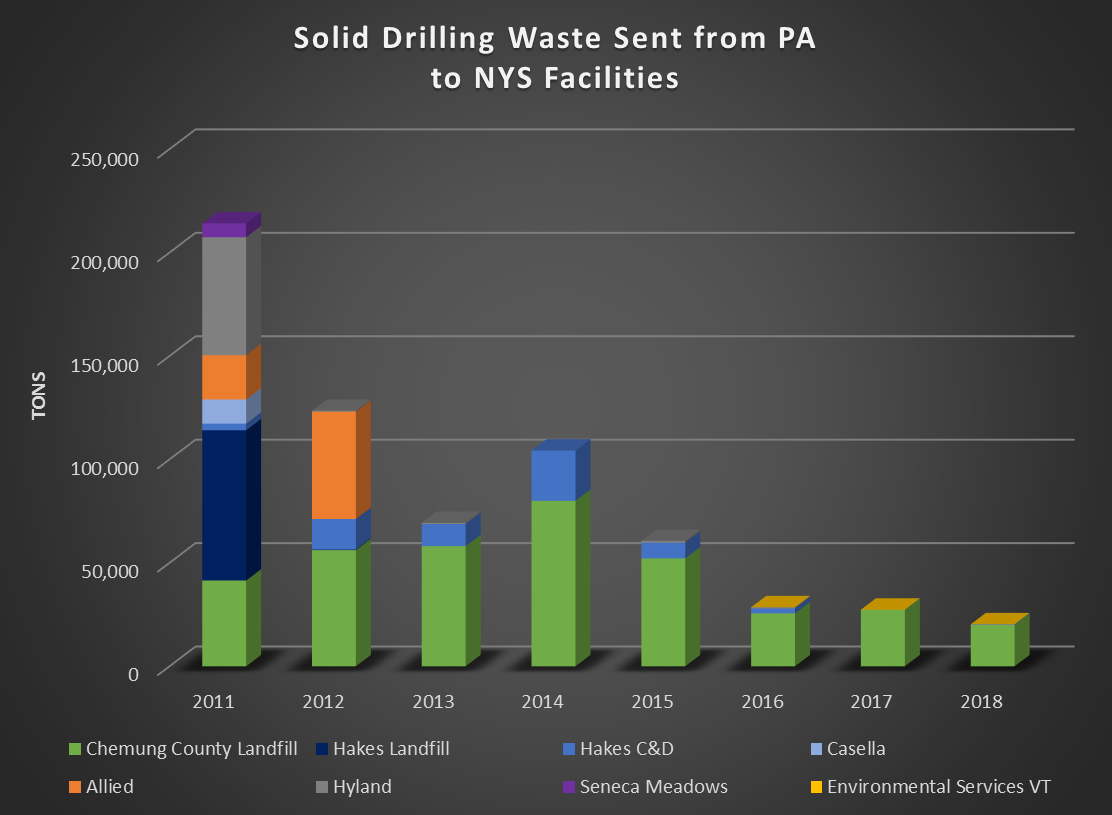
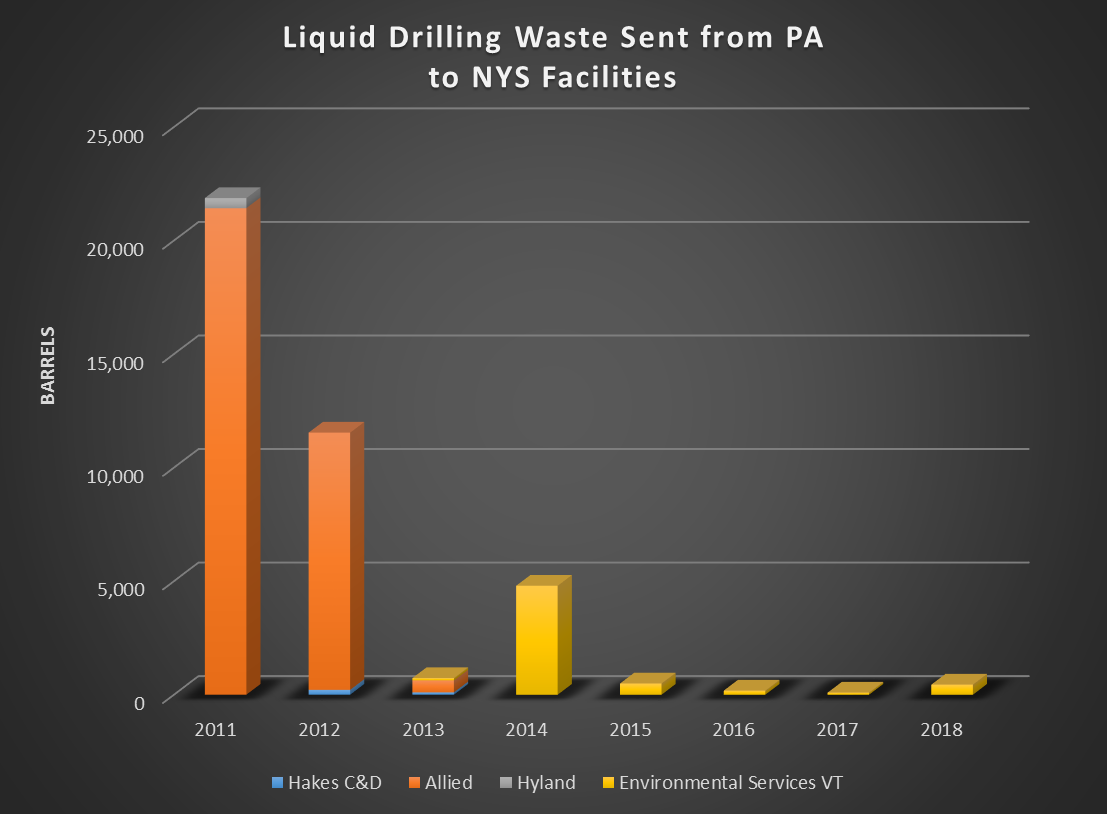
Despite a reputation for being resistant to the fracking industry, for most of this decade, the state of New York has been accepting considerable amounts of fracking waste from Pennsylvania. The greatest percentage shipped to New York State is in the form of drilling waste solids that go to a variety of landfills throughout Central and Western New York.
Looking closely at the bar charts above, it’s easy to notice that the biggest recipients of Pennsylvania’s unconventional liquid drilling waste are Pennsylvania itself, Ohio, as well as a significant quantity of unaccounted-for barrels between 2011 and 2016 (“Disposal location unknown”). The data for disposal of solid waste in New York tells a different story, however. In this case, Pennsylvania, Ohio, and New York State all play a role. We’ll take a look specifically at the story of New York, and illustrate the data in the interactive map that follows.
In this map, source locations in Pennsylvania are symbolized with the same color marker as the facility in New York that received the waste from the originating well pad. In the “Full Screen” view, use the “Layers” drop down menu to turn on and off data from separate years.
From the early days of unconventional drilling in Pennsylvania, New York State’s landfills provided convenient disposal sites due to their proximity to the unconventional drilling occurring in Pennsylvania’s Northern tier of counties. Pennsylvania and Ohio took the majority of solid wastes from unconventional drilling waste from Pennsylvania. New York State, particularly between 2011-2015, was impacted far more heavily than all other states, combined (Figure 5, below).
Figure 5: Known disposal locations (excluding PA and OH) of Pennsylvania’s solid waste. Data source: PA DEP, processed by FracTracker Alliance
Here’s the breakdown of locations in New York to where waste was sent. Solid waste disposal into New York’s landfills also dropped by half, following the state’s ban on unconventional drilling in 2014. Most of the waste after 2012 went to the Chemung County Landfill in Lowman, New York, 10 miles southeast of Elmira.
Figure 6: Solid waste from unconventional drilling, sent to facilities in NYS. Data source: PA DEP, processed by FracTracker Alliance
Is waste immobilized once it’s landfilled?
The fate of New York State’s landfill leachate that originates from unconventional drilling waste is a core concern, since landfill waste is not inert. If drilling waste contains radioactivity, fracking chemicals, and heavy metals that percolate through the landfill, and the resulting leachate is sent to municipal wastewater treatment plants, will traditional water treatment methods remove those wastes? If not, what will be the impact on public and environmental health in the water body that receives the “treated” wastewater? In Pennsylvania, for example, a case is currently under investigation relating to pollution discharges into the Monongahela River near Pittsburgh. “That water was contaminated with diesel fuels, it’s alleged, carcinogens and other pollutants,” said Rich Bower, Fayette County District Attorney.
Currently, a controversial expansion of the Hakes Landfill in Painted Post, New York is in the news. Sierra Club and others were concerned about oversight of radium and radon in the landfill’s leachate and air emissions, presumably stemming from years of receiving drill cuttings. The leachate from the landfill is sent to the Bath Wastewater Treatment plant, which is not equipped to remove radioactivity. “Treated” wastewater from the plant is then discharged into the Cohocton River, a tributary of the Chesapeake Bay. In April 2019, these environmental groups filed a law suit against Hakes C&D Landfill and the Town of Campbell, New York, in an effort to block the expansion.
Similar levels of radioactivity in leachate have also been noted in leachate produced at the Chemung County Landfill, according to Gary McCaslin, President of People for a Healthy Environment, Inc.
In recent years, much of the solid unconventional waste arriving in New York State has gone to the Chemung County Landfill (see Figure 6, above). Over the course of several years, this site requested permission to expand significantly from 180,000 tons per year to 417,000 tons per year. However, by 2016, the expansion was deemed unnecessary, and according, the plans were put on hold, in part “…because of a decline in the amount of waste being generated due to a slower economy and more recycling than when the expansion was first planned years ago.” The data in Figure 5 above also parallel this story, with unconventional drilling waste disposed in New York State dropping from over 200,000 tons in 2011 to just over 20,000 tons in 2018.
Liquid waste transported to New York State
The story about liquid unconventional drilling waste exported from Pennsylvania to states other than Ohio is not completely clear (see Figure 7, below). Note that the data indicate more than a 2000% increase in waste liquids going from Pennsylvania to West Virginia after 2017. While it has not been officially documented, FracTracker has been anecdotally informed that a great deal of waste was already going to West Virginia, but that the record-keeping prior to 2018 was simply not strongly enforced.
Figure 7: Known disposal locations (excluding Pennsylvania and Ohio) of Pennsylvania’s liquid waste. Data source: PA DEP, processed by FracTracker Alliance
Beginning in the very early years of the Pennsylvania unconventional fracking boom, a variety of landfills in New York State have also accepted liquid wastes originating in Pennsylvania, including produced water and flowback fluids (see Figure 8, below).
Figure 8: Liquid waste from unconventional drilling, sent to facilities in New York State. Data source: PA DEP, processed by FracTracker Alliance
In addition, while this information doesn’t even appear in the PA DEP records (which are publicly available back to 2010), numerous wastewater treatment plants did accept some quantity, despite being fully unequipped to process the highly saline waste before it was discharged back into the environment.
One such facility was the wastewater treatment plant in Cayuga Heights, Tompkins County, which accepted more than 3 million gallons in 2008. Another was the wastewater treatment plant in Auburn, Cayuga County, where the practice of accepting drilling wastewater was initially banned in July 2011, but the decision was reversed in March 2012 to accept vertical drilling waste, despite strong public dissent. Another wastewater treatment plant in Watertown, Jefferson County, accepted 35,000 gallons in 2009.
Fortunately, most New York State wastewater treatment plant operators were wise enough to not even consider adding a brew of unknown and/or proprietary chemicals to their wastewater treatment stream. Numerous municipalities and several counties banned fracking waste, and once the ban on fracking in New York State was instituted in 2014, nearly all importation of liquid unconventional drilling waste into the state ceased.
Nevertheless, conventional, or vertical well drilling also generates briny produced water, which the New York State Department of Environmental Conservation (DEC) permits communities in New York to accept for ice and dust control on largely rural roads. These so-called “beneficial use determinations” (BUDs) of liquid drilling waste have changed significantly over the past several years. During the height of the Marcellus drilling in around 2011, all sorts of liquid waste was permitted into New York State (see FracTracker’s map of affected areas) and was spread on roads. As a result, the chemicals—many of them proprietary, of unknown constituents, or radioactive—were indirectly discharged into surface waters via roadspreading.
Overall, in the years after the ban in 2014 on high volume hydraulic fracturing was implemented, restrictions on Marcellus waste coming into New York have strengthened. Very little liquid waste entered New York’s landfills after 2013, and what did come in was sent to a holding facility owned by Environmental Services of Vermont. This facility is located outside Syracuse, New York.
New York State says “no” to this toxic legacy
Fortunately, not long after these issues of fracking fluid disposal at wastewater treatment facilities in New York State came to light, the practice was terminated on a local level. The 2014 ban on fracking in New York State officially prevented the disposal of Marcellus fluids in municipal wastewater treatment facilities and required extra permits if it were to be road-spread.
In New York State, the State Senate—after 8 years of deadlock—in early May 2019, passed key legislation that would close a loophole that had previously allowed dangerous oil and gas waste to bypass hazardous waste regulation. Read the press release from Senator Rachel May’s office here. However, despite strong support from both the Senate, and the Assembly, as well as many key environmental groups, the Legislature adjourned for the 2019 session without bringing the law to a final vote. Said Elizabeth Moran, of the New York Public Interest Research Group (NYPIRG), “I want to believe it was primarily a question of timing… Sadly, a dangerous practice is now going to continue for at least another year.”
See Earthworks’ recent three part in-depth reporting on national, New York, and Pennsylvania oil and gas waste, with mapping support by FracTracker Alliance.
All part of the big picture
As long as hydrocarbon extraction continues, the issues of waste disposal—in addition to carbon increases in the atmosphere from combustion and leakage—will result in impacts on human and environmental health. Communities downstream and downwind will bear the brunt of landfill expansions, water contamination, and air pollution. Impacts of climate chaos will be felt globally, with the greatest impacts at low latitudes and in the Arctic.
Transitioning to net-zero carbon emissions cannot be a gradual endeavor. Science has shown that in order to stay under the 1.5 °C warming targets, it must happen now, and it requires the governmental buy-in to the Paris Climate Agreement by every economic power in the world.
No exceptions. Life on our planet requires it.
We have, at most, 12 years to make a difference for generations to come.
Guest Blog by Josh Eisenfeld, Director of Marketing with Fair Shake Environmental Legal Services
Fair Shake Environmental Legal Services looks maps the origin of their intake calls and reflects on their geographic distribution as it relates to areas with heavy environmental burdens.
Over the last five years, Fair Shake Environmental Legal Services has worked in Ohio and Pennsylvania to promote environmental justice by providing legal services at income-based rates. Our service area has a long history of extraction, from timbering, conventional drilling for oil, multiple forms of mining, and unconventional drilling for natural gas. Because of our proximity to these resources, we also have a long history of industrial manufacturing, which can be evidenced by the many oil refineries, steel production facilities, power plants, cement factories, factory farms, and chemical production facilities. Fair Shake offers counsel and representation in environmental law with accessible, sliding scale fees, and we receive a continuous stream of phone calls from those on the front lines. We were curious to see if our intake calls correlated with geographic areas with heavy environmental burdens in order to allocate our limited resources to those regions most efficiently.
With the help of Ted Auch from FracTracker Alliance we collected zip codes from nearly 600 of intake calls received by Fair Shake and placed them on the map below.
In general, our intakes in Pennsylvania mirror the Marcellus Shale formation. Over the last decade and a half, technical advancements in drilling have transformed the Marcellus Shale formation from a nonproducing region to the largest producing natural gas formation by volume in the world. Entering 2005, only 13 “unconventional” wells had been drilled in the Marcellus Shale region of Pennsylvania, where today there are roughly 12,000 wells according to FracTracker’s PA Shale Viewer Map. Reduced regulations for unconventional drilling and infrastructure have facilitated this rush for production, resulting in an influx of compressor stations, gathering lines, pump stations, processing plants, wastewater impoundments, wastewater treatment facilities, wastewater injection wells, and more.
We believe that this map indicates that these 12,000 wells place a significant burden on residents living within this region. Speaking broadly, reduced regulation has left loopholes in major environmental laws that have to get justice when their rights have been violated and, even more concerning, when harm has occurred.
One of the most prominent manifestations of this burden is the contamination of private drinking water sources near drilling and wastewater sites. Our region’s history of extraction and industrial enterprise and the pollution associated with these industries makes it extremely difficult to prove, in court, that drilling activity is the sole cause of damage to private wells. The fact is that our groundwater (and therefore private drinking wells) has been contaminated over and over again. Polluters use this to their advantage, leaning on the uncertainty of what caused the contaminants in question to get there. Simply put, water contamination is not a question of whether contaminants exist (they do) it’s a question of how can you prove that it was a given industry when there are many other possible culprits.
One thing we do know is that the number of reports for well contamination has increased in conjunction with the increase in drilling activity. The graph below, created by FracTracker and The Public Herald, shows the correlation of wells drilled, complaints to the Department of Environmental Protection, and complaints specifically about water.
Upon closer examination of the intake map, we saw a higher density of cases in more populated areas of Allegheny County, which actually has very little fracking activity (less than 170 drilled wells). But Allegheny is also one of the most polluted counties in America. The American Lung Association gave the county all F’s on its air quality and ranked it as 7th worst air quality in the nation according to the association’s state of the air. Allegheny County is also home to two of the most polluted rivers in our country: the Monongahela and the Ohio. Over a century of industrial activity and coal mining have impaired the water but most recently sewer overflows from the city of Pittsburgh have sent dangerous levels of raw sewage into the surrounding waterways.
The population density combined with the very poor air and water quality could be the explanation for the anomaly. Furthermore, Allegheny County is also where our Pittsburgh office is located, which is perhaps the reason that we see so many cases in this region and not in other regions of high population density such as Philadelphia, Harrisburg, or Scranton.
When we started this project, we thought we would discover a correlation between intakes and regions with the heaviest environmental burdens. This could allow us to allocate our limited resources to those regions most efficiently. Unfortunately, the problem is not so simple.
As evidenced by the intake map, resource extraction in Ohio and Pennsylvania is spread over a very large area. That is troubling because the bigger the problem geographically the harder it becomes to deal with. We need to devote far more resources to protecting individuals who face spills, emissions, erosion, impacts to wetland, etc. By speaking more openly about how pervasive these environmental risks are, and how that risk plays into the bigger picture of the climate emergency, we hope we can incite folks to give their time, effort, and resources to defending their health and environment.
By Josh Eisenfeld, Marketing Director at Fair Shake Environmental Legal Services
https://fractracker.org/wp-content/uploads/2019/07/DSC_0624_LowRes-scaled.jpg9821500Shannon Smithhttps://fractracker.org/wp-content/uploads/2025/09/2025-Wordmark-Logo.pngShannon Smith2019-08-07 09:36:032026-04-28 15:34:37Wildness Lost – Pine Creek
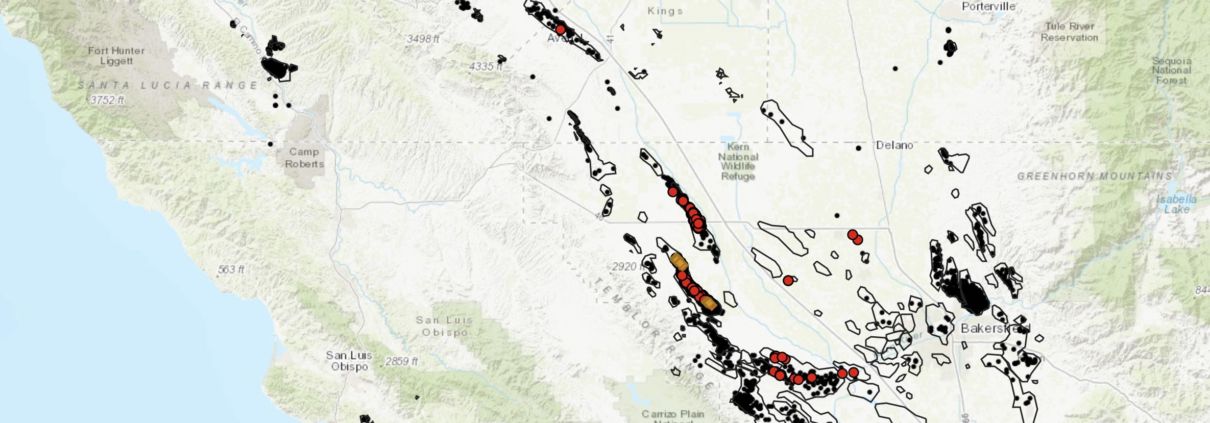
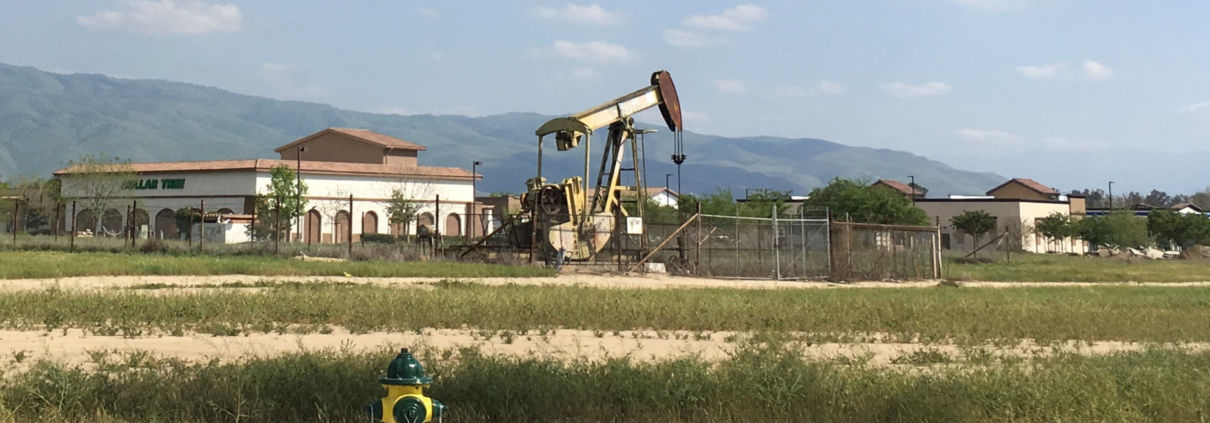
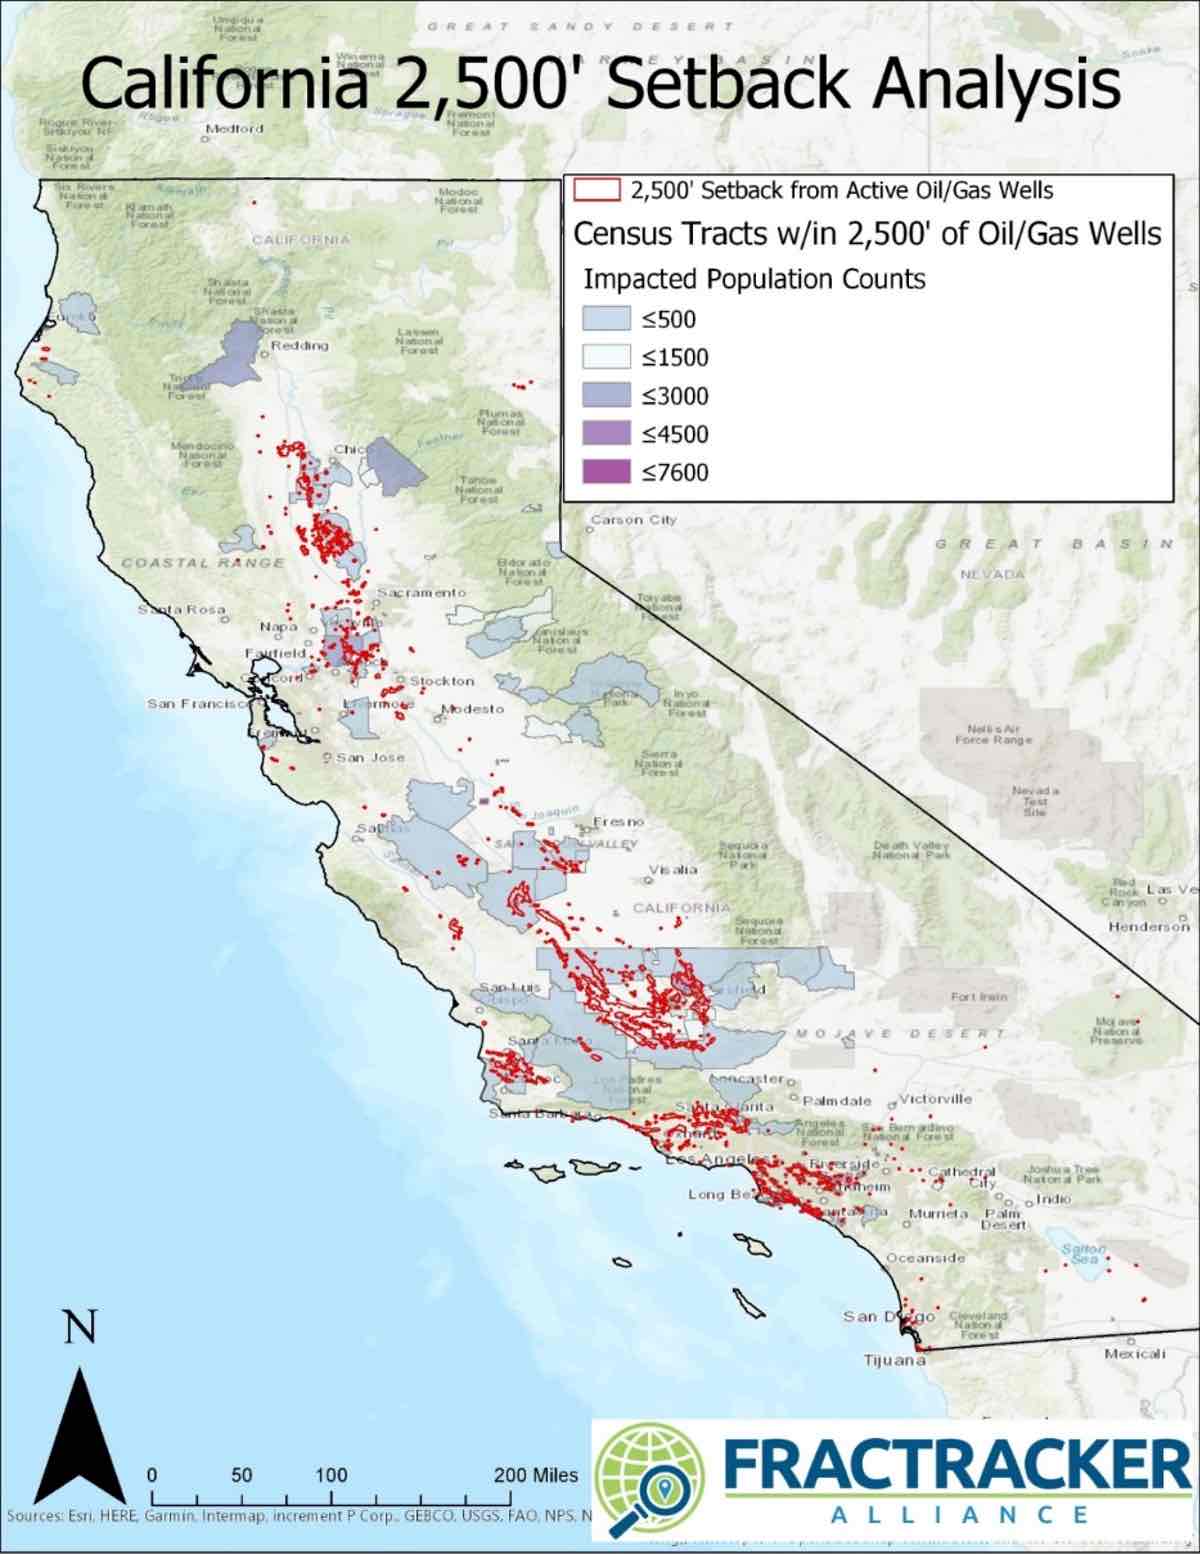
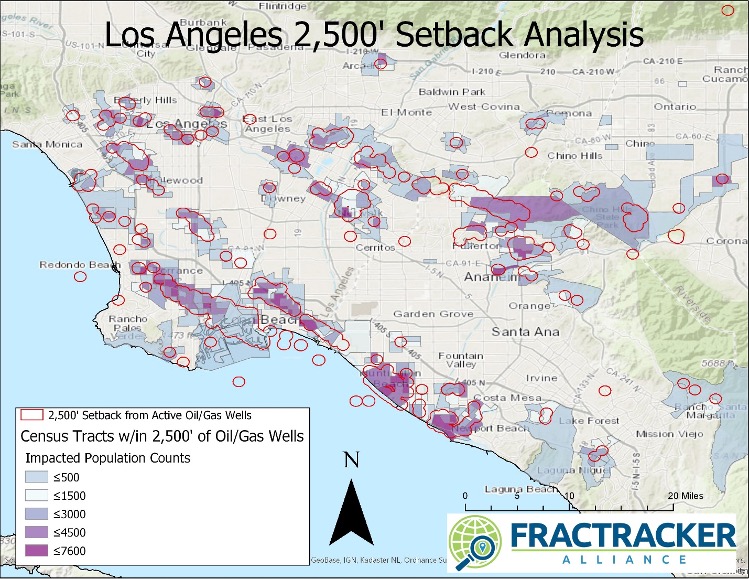
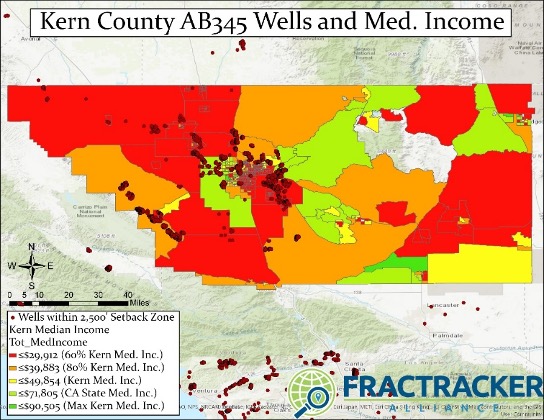
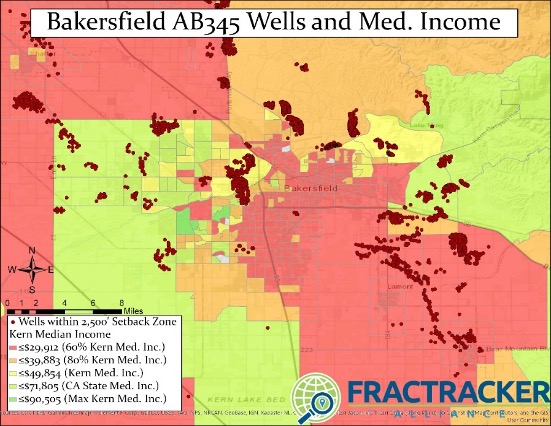
 Photo by Ted Auch, FracTracker Alliance, with aerial support by LightHawk