
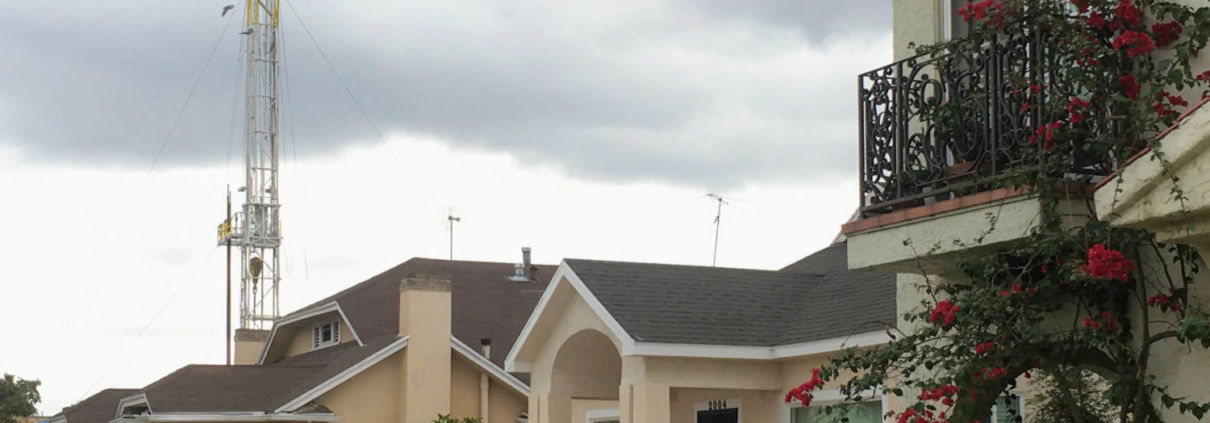
California Prisons are Within 2,500’ of Oil and Gas Extraction
California prisoners are on the frontlines of the environmental justice movement, thousands living within 2,500’ of operational O&G wells.
California prisoners are on the frontlines of the environmental justice movement, thousands living within 2,500’ of operational O&G wells.
California drilling permits continue while Frontline communities and grassroots groups call for an immediate moratorium and 2,500′ setback.
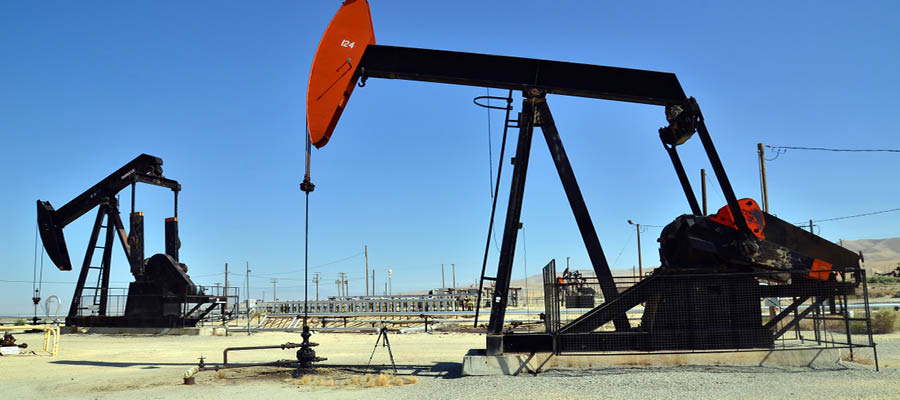
As California permit approvals for new oil & gas well drills decrease, Consumer Watchdog urges the Governor to move from fossil fuels.
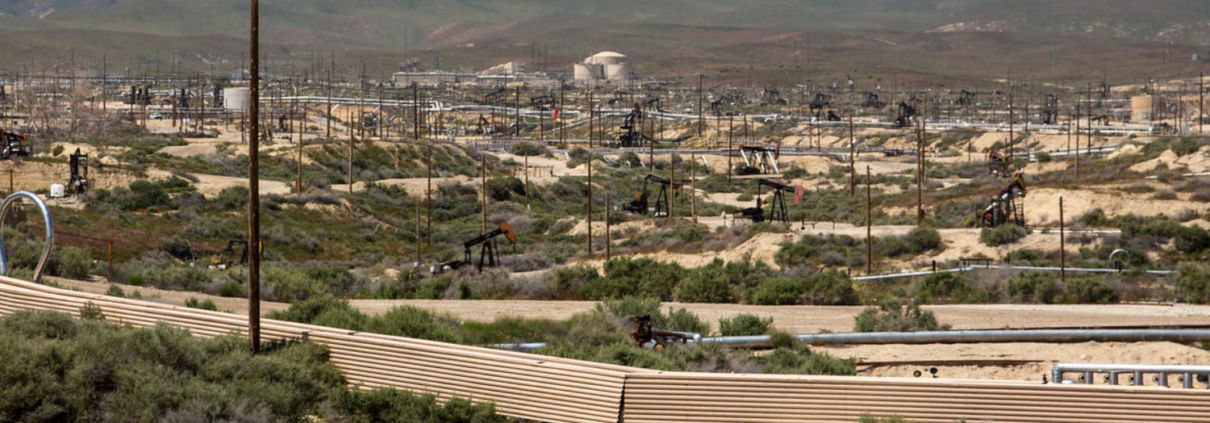
California regulators recently denied 21 well stimulation permit applications—a welcomed move in the right direction—but not enough.
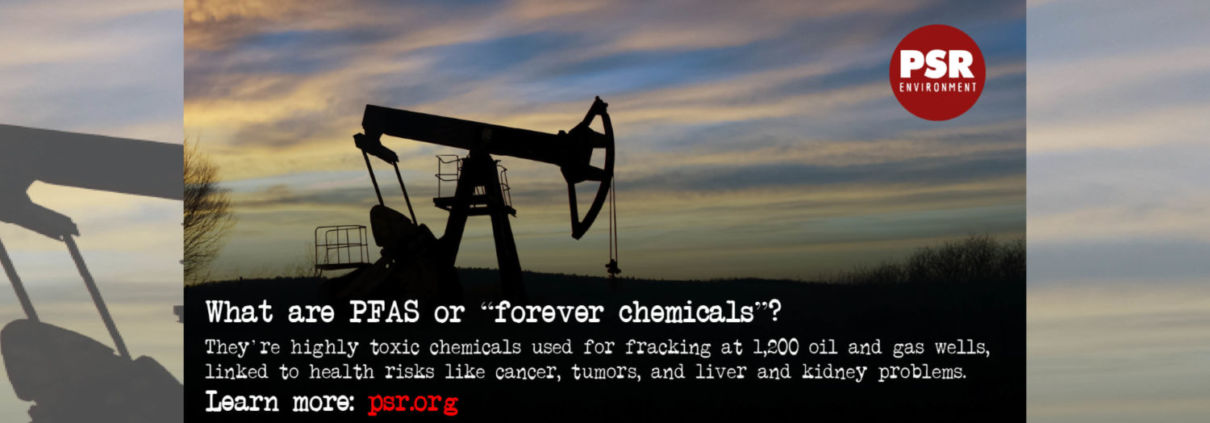
FracTracker Alliance released a new map identifying the locations of over 1,200 oil and gas wells using toxic “forever chemicals” in Arkansas, Louisiana, Oklahoma, New Mexico, Texas, and Wyoming.
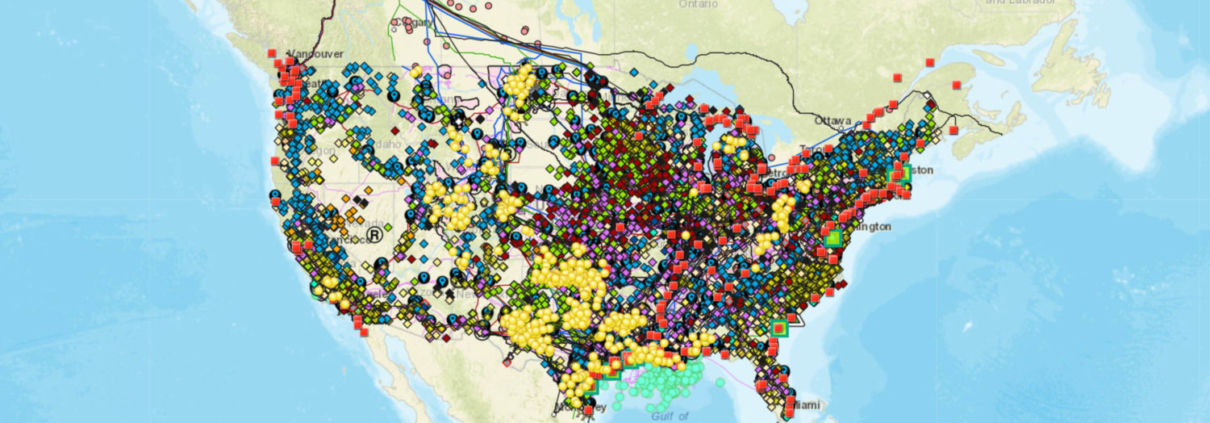
We first released this map in February of 2020. In the year since, the world’s energy systems have experienced record changes. Explore the interactive map, updated by FracTracker Alliance in April, 2021.
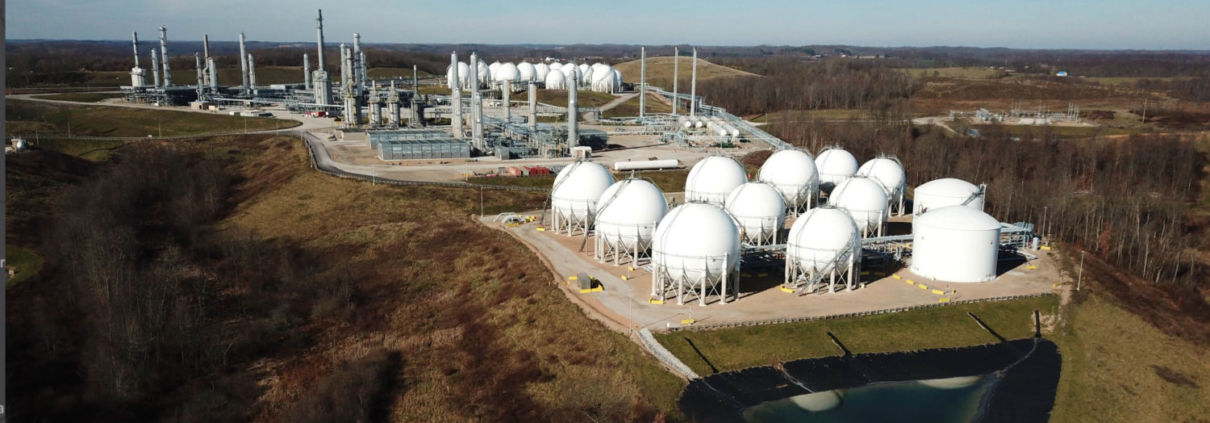
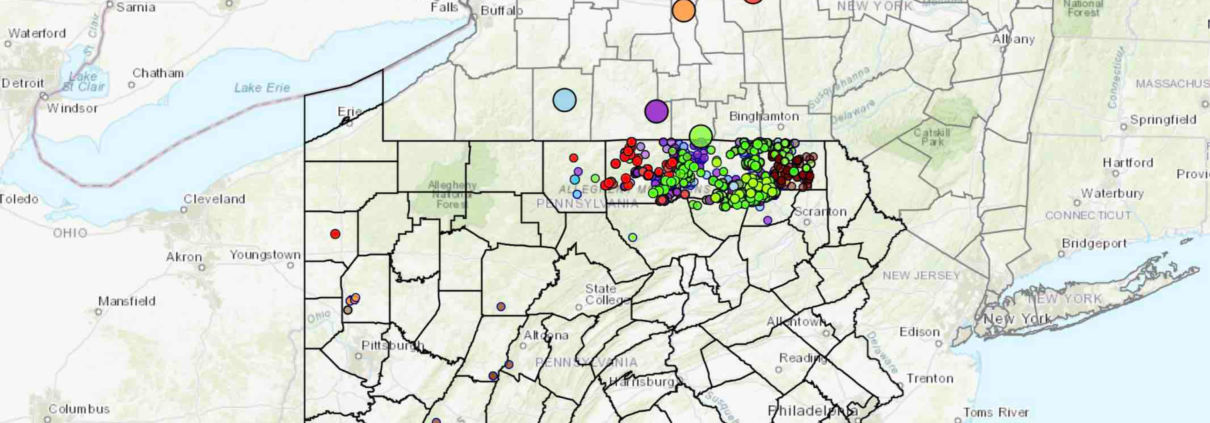
FracTracker’s aerial survey of unconventional oil & gas infrastructure and activities in northeast PA to southern OH and central WV
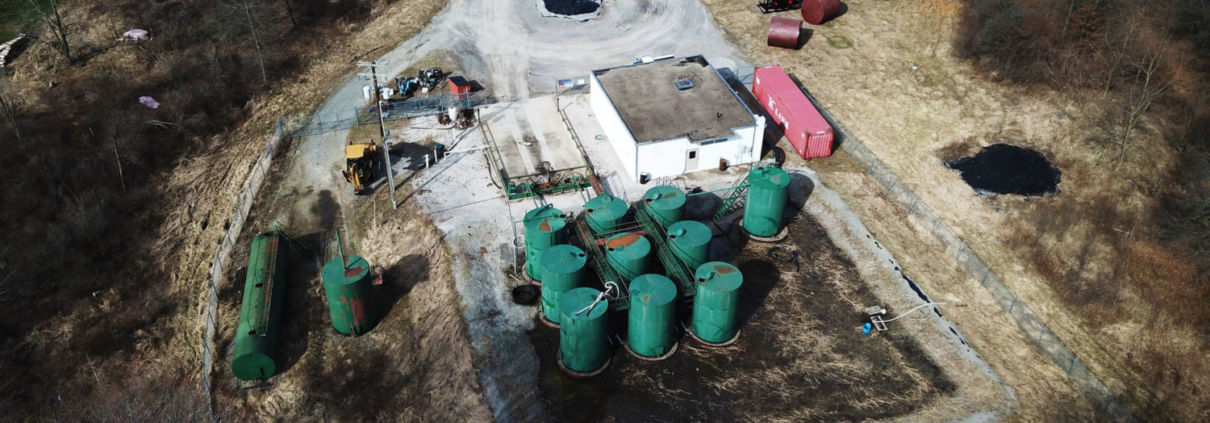
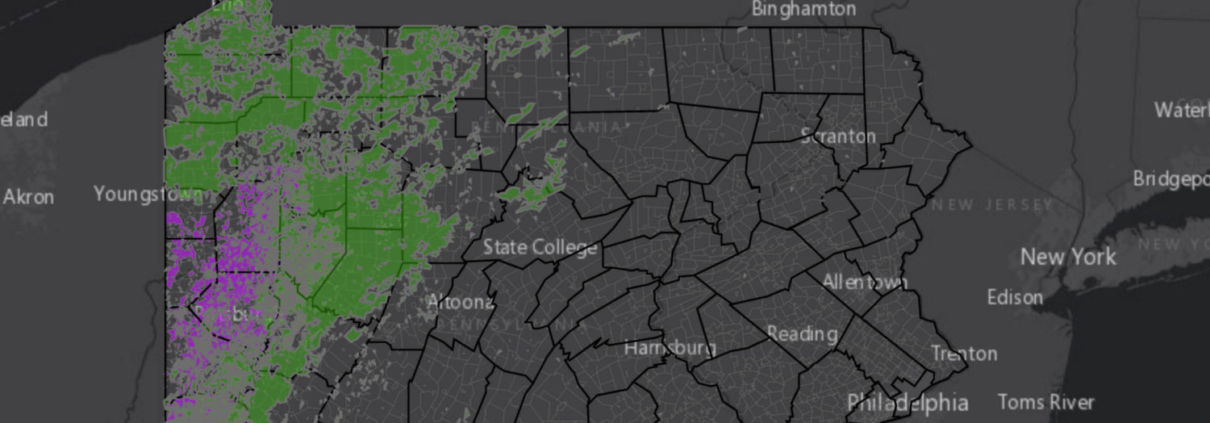
Insights on Ohio’s massive fracking waste gap, Class II injection well activity, and fracking waste related legislation
There are over 100,000 active conventional wells in PA, with more permitted each year. Most are unplugged, posing serious threats to the climate.
Over the past decade, New York State has seen a steep decline in the quantity of waste products from the fracking industry sent to its landfills for disposal. Explore FracTracker’s 2020 updated data.
![]()
216 Franklin St, Suite 400, Johnstown, PA 15901
Phone: +1 (717) 303-0403 | info@fractracker.org
FracTracker Alliance is a 501(c)3 non-profit: Tax identification number: 80-0844297