Systematic Racism in Kern County Oil and Gas Permitting Ordinance
Kern County, California has approved at least 18,356 illegal permits to drill new and rework existing oil and gas wells from 2015 – 2019 (data downloaded May 18, 2020). In a monumental decision in February of 2020, a California court ruled that a Kern County oil and gas ordinance paid for and drafted by the oil industry violated the state’s foundational environmental law. Kern County has failed to consider the environmental harms resulting from oil and gas drilling, such as water supply and air quality problems, farmland degradation, and increased noise, and communities have had enough.
Starting in 2015, Kern County used a local ordinance to fast-track the drilling of up to 72,000 new oil and gas wells over the next 25 years. The court’s recent decision allows the existing 18,356 permits to remain valid, but blocked the county from issuing any more permits after the end of April, 2020. This is an important victory for Kern County communities, but the existing permits present a public health threat that regulators have never adequately addressed.
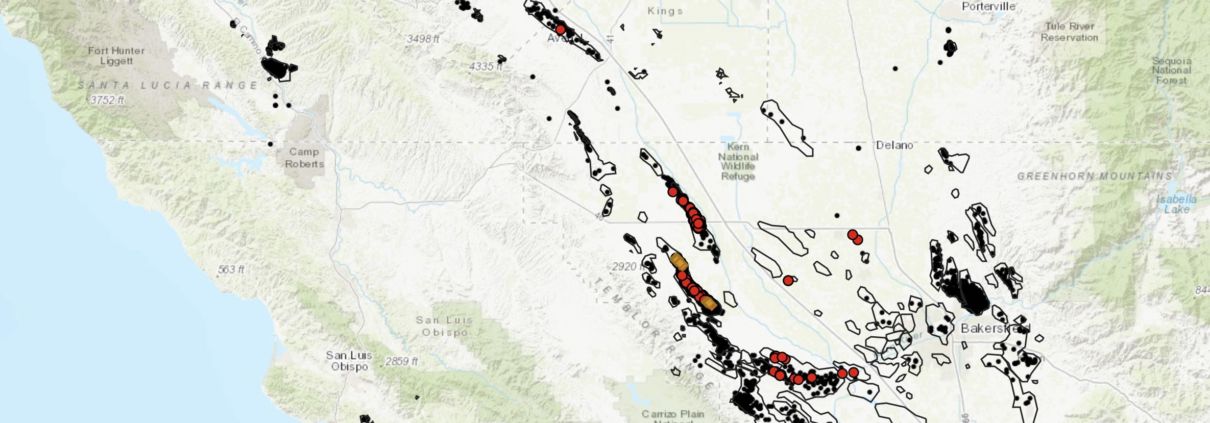
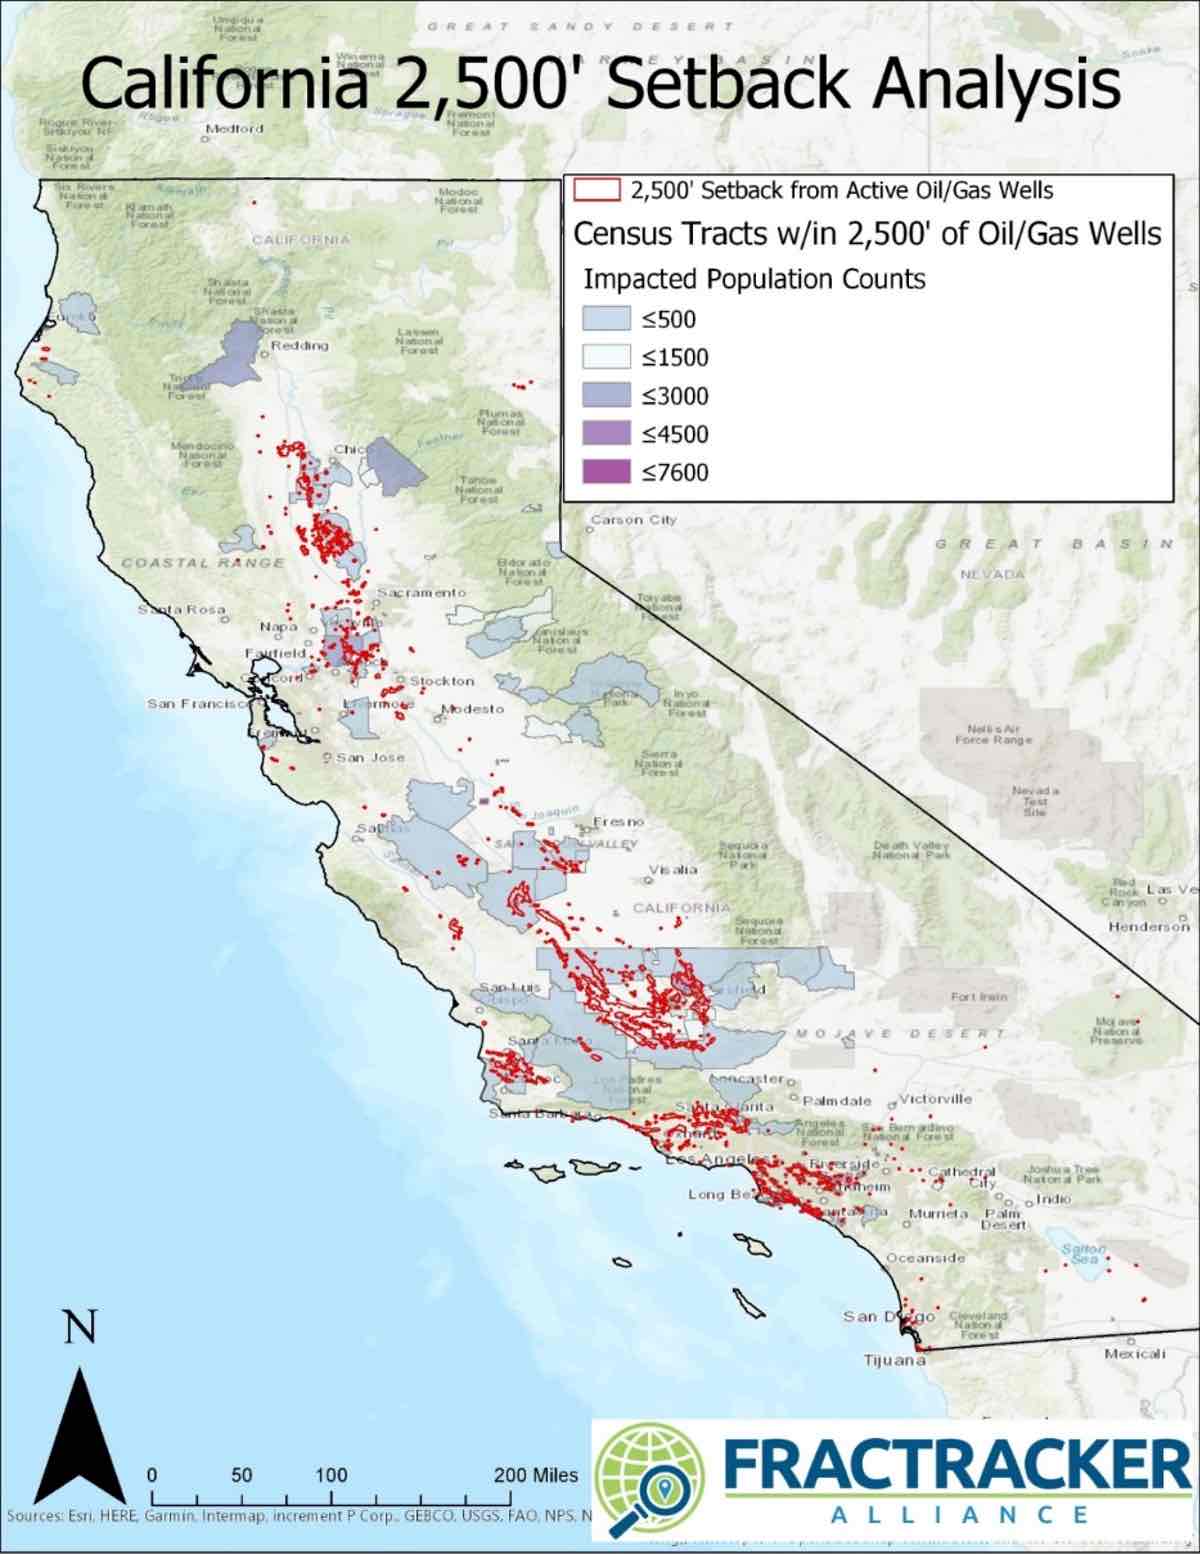
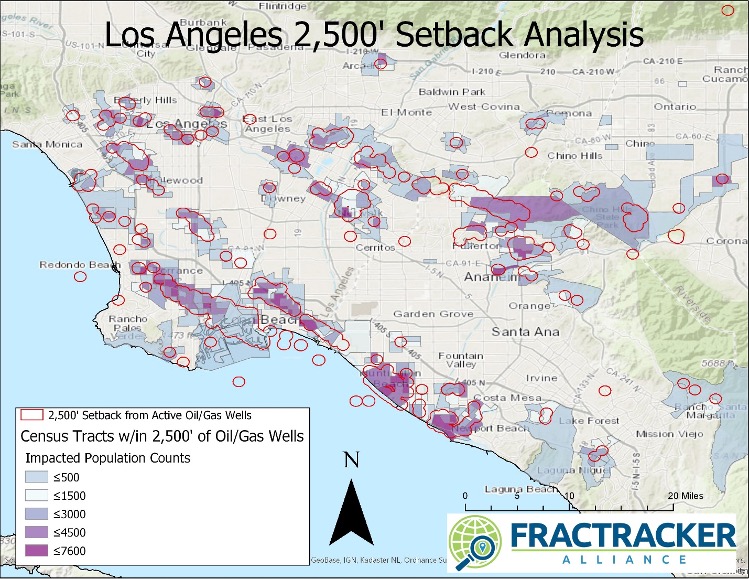
To better understand the impacts of these illegal permits, and identify the communities most impacted, FracTracker Alliance has conducted an environmental justice spatial analysis based on the location of the permits. A map of the permits is found below in Figure 1. shows that there are 18,356 “Drilling” and “Rework” permits issued in Kern County since 2015, as well as the 1,304 permits located within 2,500’ of a sensitive receptor, including hospitals, schools, daycares, and homes.
Figure 1. Map of California Geologic Energy Management Division (CalGEM), formerly the California Division of Oil, Gas, and Geothermal Resources (DOGGR), approved drilling and rework permits, 2015-2019.
View map fullscreen | How FracTracker maps work
Ordinance
The ordinance, written by oil industry consultants, sidestepped state requirements for environmental reviews or public notices, as required by the California Environmental Quality Act (CEQA). It was used as a blanket environmental impact report (EIR), so that the threats of specific projects need not be considered.
To pass the ordinance, the county used a flawed study to hide the immense harm caused by oil and gas drilling and extraction. The appellate court that ruled against the ordinance stated it was passed “despite its significant, adverse environmental impacts.” As a result, the county allowed wells to be constructed next to people’s homes, schools, daycares, and healthcare facilities.
Permitting Summary
FracTracker aggregated, cleaned, and compiled California Geologic Energy Management Division’s (CalGEM) datasets of well permits. A breakdown of the statewide counts of permit types is shown below in Table 1. The table shows that in 2019, permits to drill new oil and gas wells made up about 34% of total permits. Over the course of the last five years, statewide permits have been distributed pretty equally between drilling wells, reworking wells to increase production (including re-drilling activities like deepening and sidetracking wells), and plugging and abandoning wells.
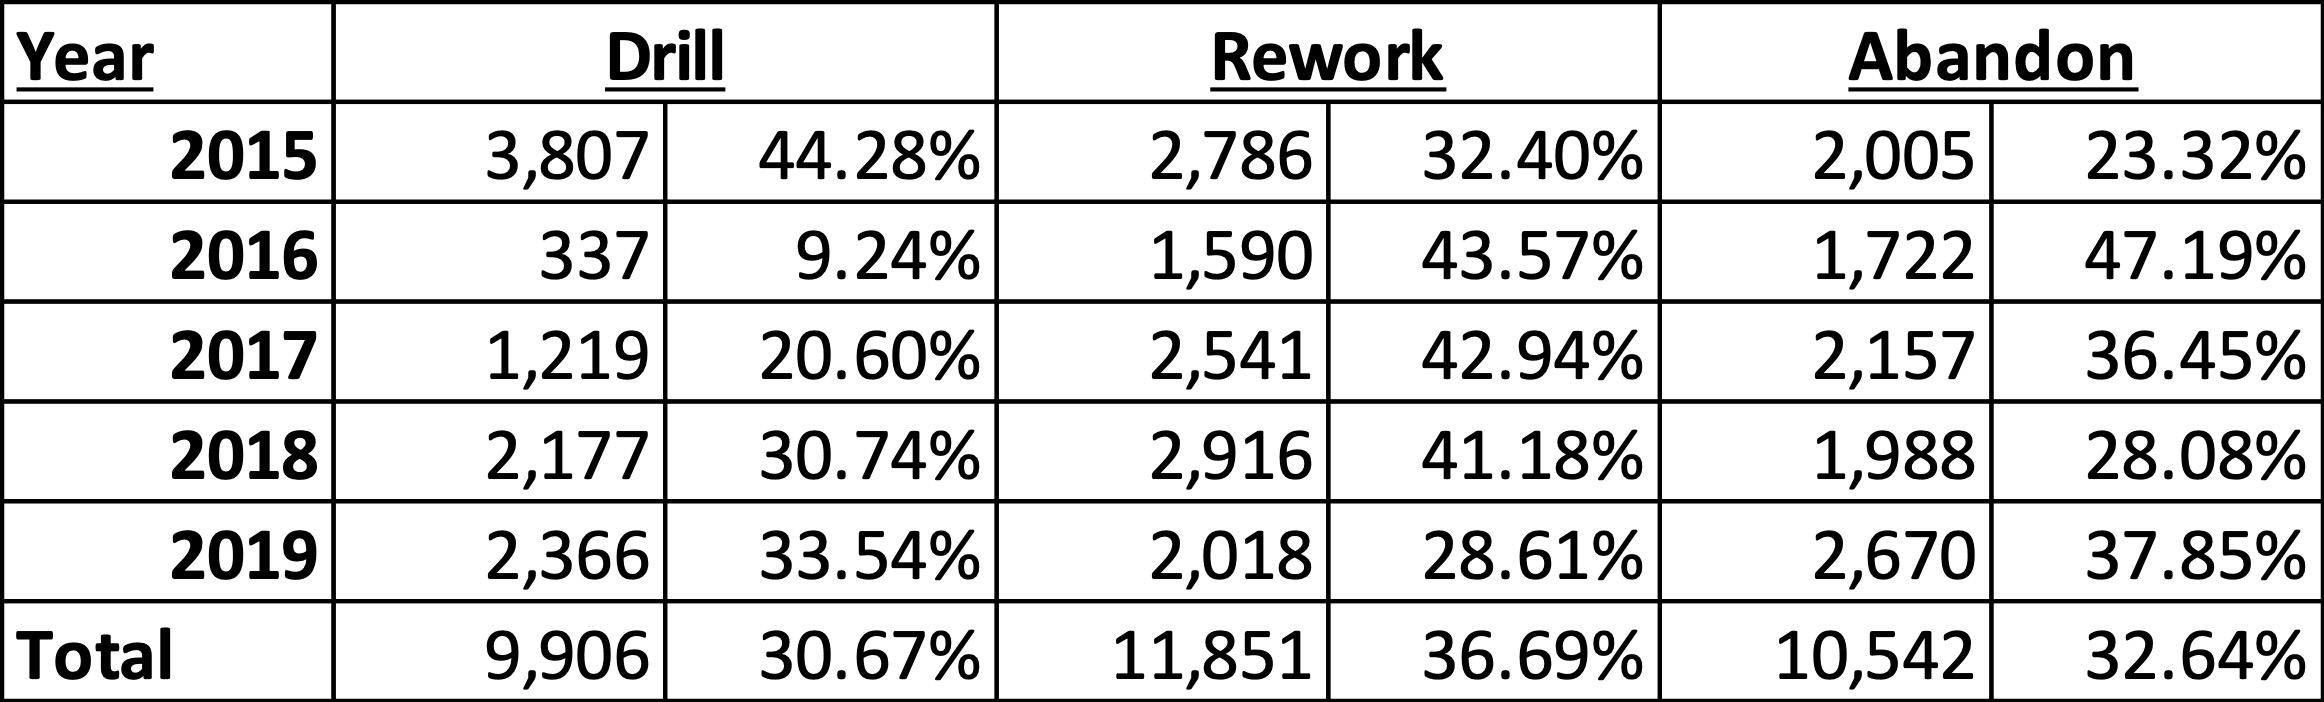
Table 1. Breakdown of permit types issued by California Geologic Energy Management Division (CalGEM), formerly the California Division of Oil, Gas, and Geothermal Resources (DOGGR), 2015-2019.
The illegal Kern County ordinance took effect in 2015, and permit counts for Kern County are shown in Table 2 and Figure 2 below. Note the permit count increase from 2014 to 2015 in the graph in Figure 2. The data shows that Kern County permitting counts increased in 2015 with the passage of the illegal ordinance. In 2016, a new statewide rule (State Bill 4) took effect regulating hydraulic fracturing. Since most oil and gas drilling in California was using hydraulic fracturing, permit numbers statewide, including in Kern, fell drastically. Since 2016, permitting rates have been climbing back up to pre-2016 levels. As of May 18, 2020, Kern County has already approved 1,310 new drilling permits, putting Kern County on track to meet or exceed 2015 permit numbers.
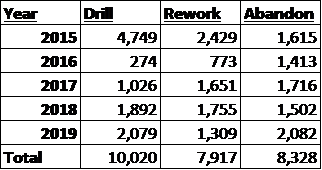
Table 2. Breakdown of permit types issued by California Geologic Energy Management Division (CalGEM) in Kern County alone, 2015-2019.
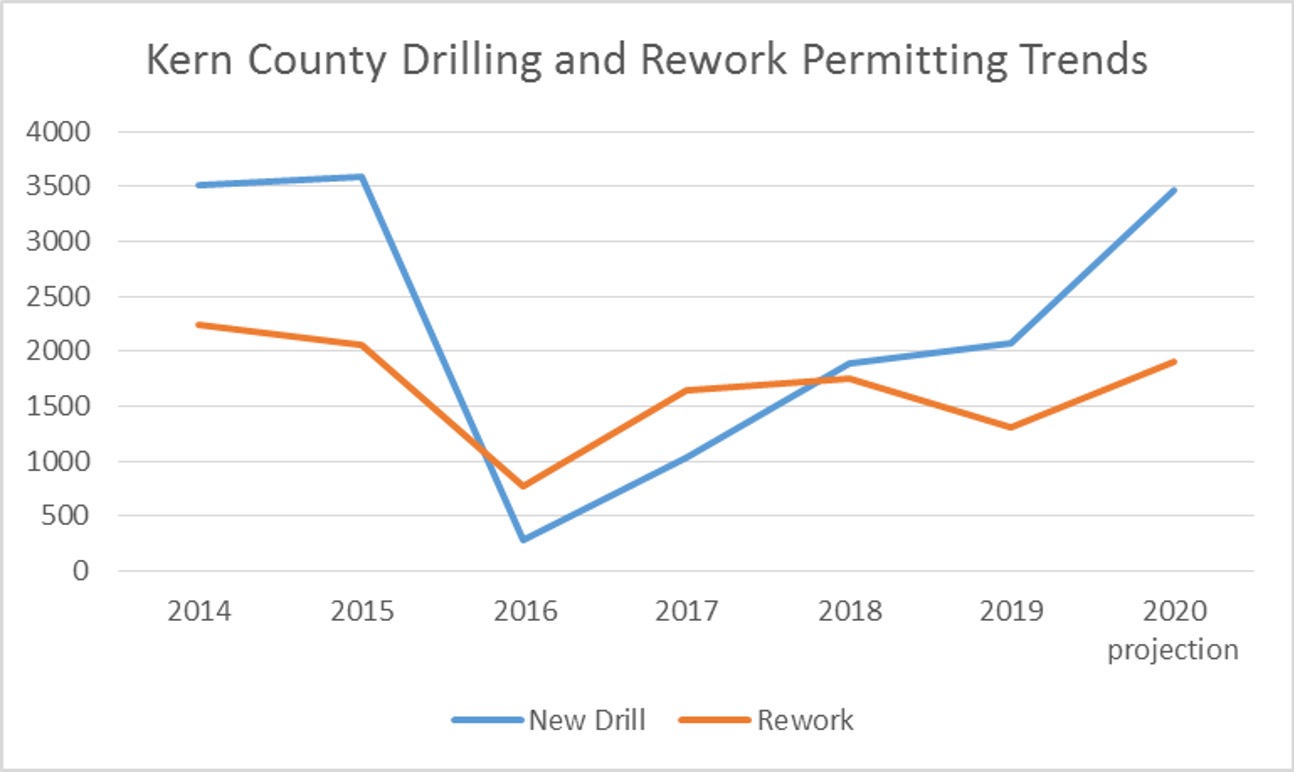
Figure 2. Time Series of drilling permits issued by Kern County, California, 2014 to present.
Kern County is the most heavily drilled county in the United States, and from 2015 to 2019 well permits were issued in Kern at elevated numbers as compared to the rest of the state. From the implementation of the ordinance (2014 to 2015), the proportion of drilling permits issued by Kern County increased from 82% to 94% of the state total. In Figure 3 below, the time series shows that Kern County makes up the majority of permits issued to drill new wells in California, and the proportion of wells drilled in Kern County has been higher from 2015 to 2019 than it had been prior. Not only did the ordinance allow permits to be drilled without any consideration for the community and public health impacts of Frontline Communities, but the actual numbers and proportions of wells drilled in Kern County increased as well. We have mapped these permits in Figure 3 below to show exactly where they are located.
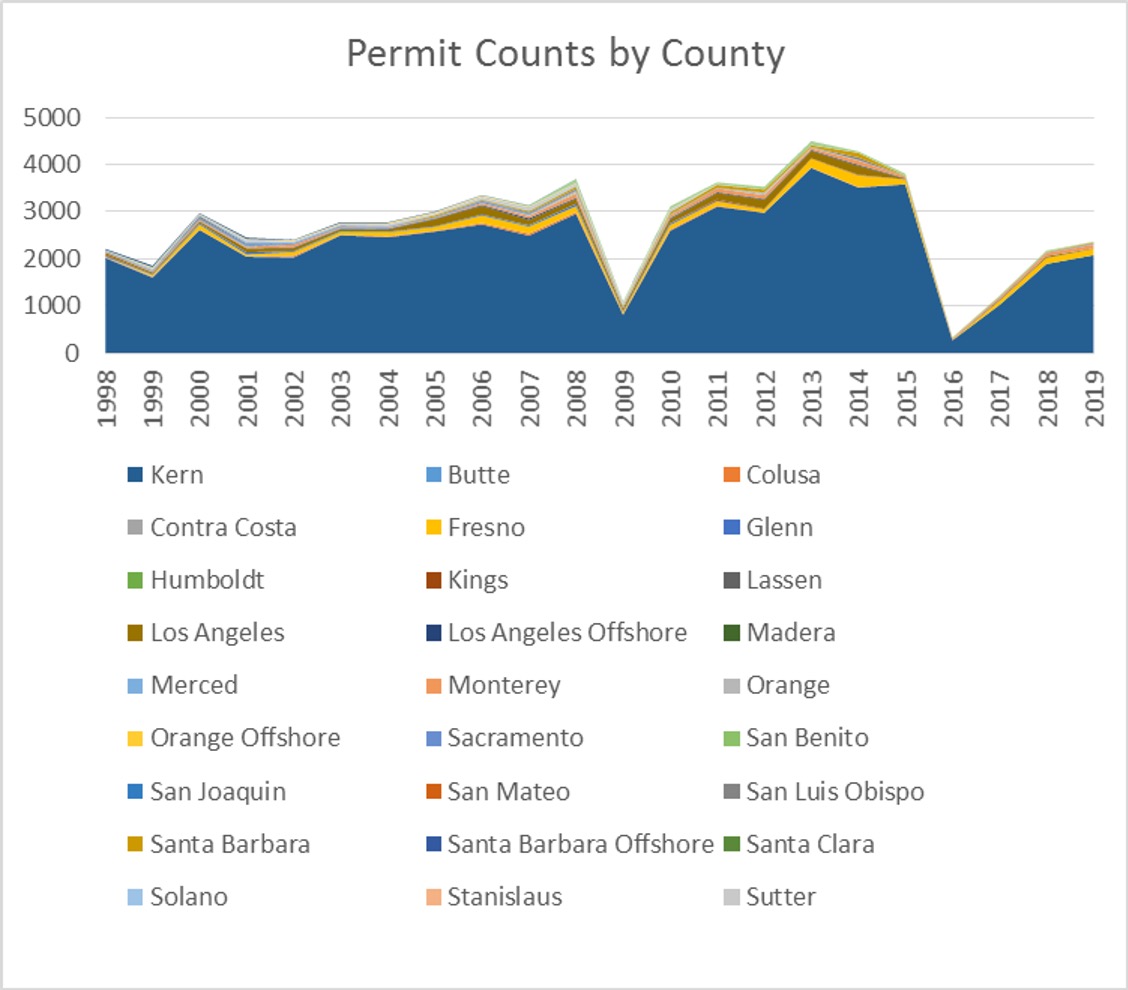
Figure 3. Time series of permits issued to drill new wells in California from 1998 to 2019. The contribution of individual counties is shown with different colors, the area under the trend line representing the cumulative total.
Environmental Justice Mapping
The locations of well permits were mapped using GIS software and overlaid with indicators of social and environmental justice. The layers of Environmental Justice (EJ) mapping data were derived from CalEnviroScreen 3.0 census tract data, assigned to the block level, and 2015 American Community Survey demographical data, also summarized at the census block data.
Demographics
One of the major failings of the Kern County ordinance was the lack of risk communication with Frontline Communities. Not only were communities not informed of proposed drilling projects, all communications from Kern County and CalGem have been posted solely in English. Any attempts at communication of impacts and notices have excluded non-English speakers. Providing notices and information in non-English languages, at the very least in Spanish, needs to be a top priority for any regulatory body in California. The current permitting policy leverages systematic racism to preclude communities from participating in the decision-making processes that directly affect their families’ health.
As shown below in map in Figure 4, the majority of Kern County ranks high in “linguistic isolation” according to CalEnviroScreen 3.0. Our analysis shows that 11,244 permits were issued in block groups that CalEnviroscreen 3.0 has ranked in the top 60th percentile for linguistic isolation. A total 16,143 permits were issued in block groups that are 40% or more Hispanic, and that number increases to 18,000 (98.1%) permits if you include the permits issued in the Midway-Sunset Field, located on the border of one of Kern’s largest, and predominantly “Hispanic,” census block groups.
View map fullscreen | How FracTracker maps work
Figure 4. Map of Oil and Gas Permits with Kern County “Hispanic” Demographics and Language Disparities. The shades of yellow to red census blocks represent the 60th percentile and above linguistic isolation. Hatched census tracts are census blocks with demographical profiles over 40% Hispanic.
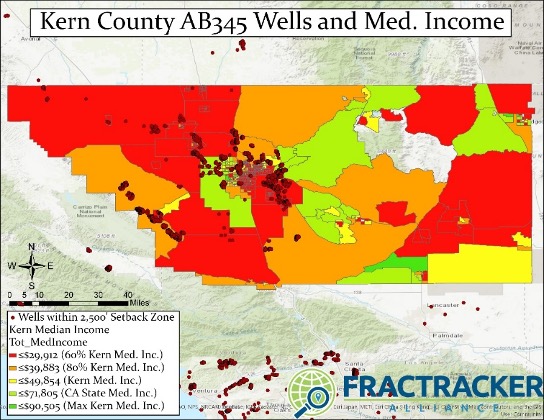
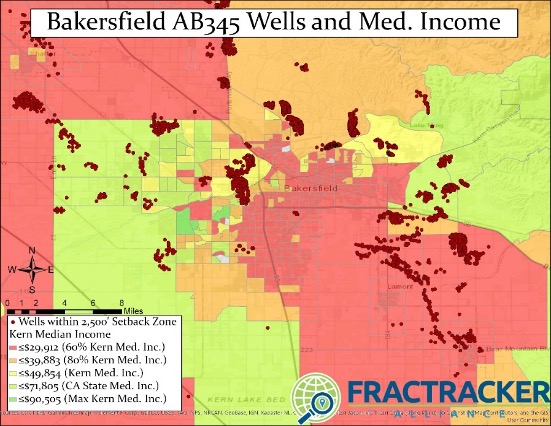
Within Kern County, these permits were approved mostly in low income areas, and areas with pre-existing environmental degradation. In the map in Figure 5, below, permit locations were overlaid with CalEnviroScreen 3.0 rankings for existing environmental degradation and median income data from the American Community Survey (2015) to visually show the disparity.
Our analysis shows that 17,978 0f the 18,356 total drilling and reworking permits were issued in census block groups where the median income was at least 20% lower than that of Kern County (Kern median income = $51,579). Additionally, these areas are more impacted by existing sources of pollution. In fact, 18,298 (99.7%) permits were issued in census blocks designated as the above the 60th percentile of those suffering from existing pollution burden by CalEnviroScreen 3.0.
View map fullscreen | How FracTracker maps work
Figure 5. Map of oil and gas permits with Kern County environmental justice areas. Shown in shades of blue are the block groups with median incomes less than 80% of that of the Kern County ($51,579). The hatched areas are above the 60th percentile for CalEnviroScreen pollution burden.
Conclusion
Our results find that from 2015-2019, very few well permits were issued in census blocks that are predominantly white, with median incomes above the median, and low rankings of linguistic isolation. The policies enacted by Kern County to fast track permits were instituted in predominantly poor, linguistically isolated, Hispanic communities already suffering from existing environmental degradation. Through systematic racism, these areas have become Kern County’s “sacrifice zones.” Moving forward, we are pressuring Kern County to adopt a permitting approach that considers the health of Frontline Communities.
Unfortunately, since the court’s decision, well permitting in Kern County has not only continued, but actually accelerated. While the appellate court ordered permitting to stop for one month, the gap was quickly filled. Between March 28 and May 18, 2020; CalGEM approved 733 permits to drill new wells and rework existing wells in Kern County. In addition, CalGEM approved 38 new fracking permits in 2020 since March 28th, all in Kern County (regulated separately under State Bill 4), increasing the environmental burden on Kern communities further. Like Kern County, CalGEM’s permitting process also deserves scrutiny, as state permitting requirements are lax.
These irresponsible policies have had a direct impact on the health of Central Valley communities. Environmental monitoring has shown time and again that emissions from oil and gas wells include a cocktail of air toxics and carcinogens, and that living near oil and gas activity has been shown to be associated with numerous health impacts such as low birth weight, cancer, skin problems, asthma, and depression, The exclusion of Spanish-speaking residents from notifications and information on decisions that affect their health is an even further condemnation of the systematic and outright racism of Kern County’s permitting approach.
There is more work to be done, but the elimination of Kern County’s fast-tracking ordinance is a major win for public health and democracy.
FracTracker Alliance would like to congratulate the organizations responsible for this legislative victory and thank them for all their hard work. They include Committee for a Better Arvin, Committee for a Better Shafter, and Greenfield Walking Group, represented by the Center on Race, Poverty & the Environment, together with the Center for Biological Diversity, and Sierra Club, who was represented by Earthjustice.
By Kyle Ferrar, MPH, Western Program Coordinator, FracTracker Alliance