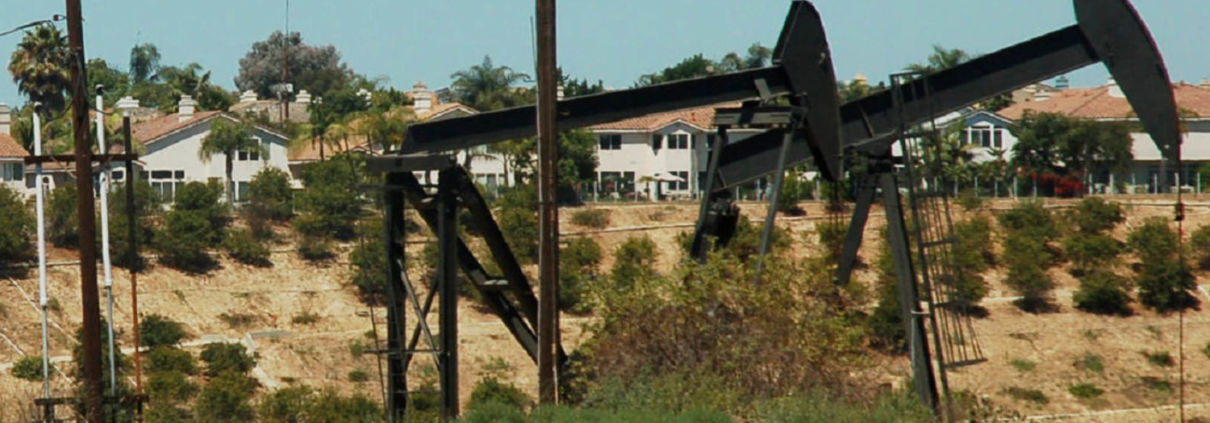
It’s Time to Stop Urban Oil Drilling in Los Angeles
Oil & gas wells in Los Angeles disproportionately impact marginalized communities, producing dangerous levels of invisible, toxic emissions.
Oil & gas wells in Los Angeles disproportionately impact marginalized communities, producing dangerous levels of invisible, toxic emissions.
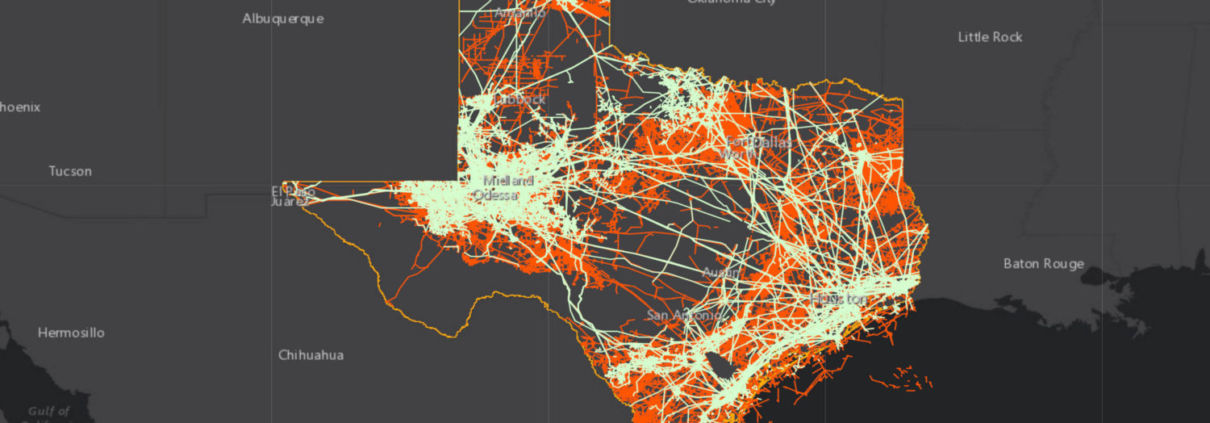
This map illustrates infrastructure networks in Texas and explores how these unseen webs connect us and improve lives, but also carry risks and burdens.

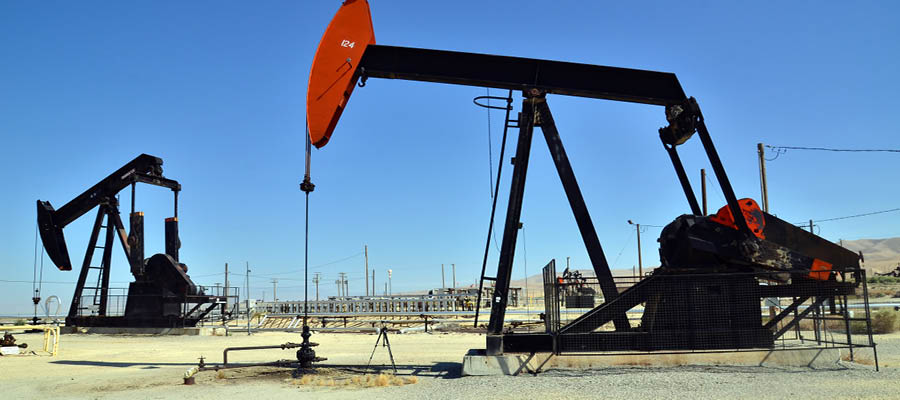
California prisoners are on the frontlines of the environmental justice movement, thousands living within 2,500’ of operational O&G wells.

California drilling permits continue while Frontline communities and grassroots groups call for an immediate moratorium and 2,500′ setback.
As California permit approvals for new oil & gas well drills decrease, Consumer Watchdog urges the Governor to move from fossil fuels.
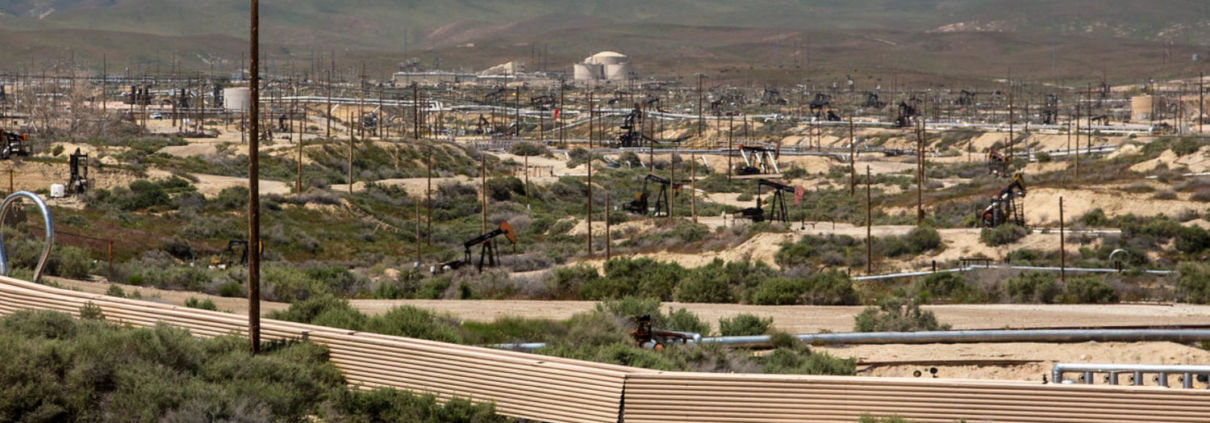
California regulators recently denied 21 well stimulation permit applications—a welcomed move in the right direction—but not enough.
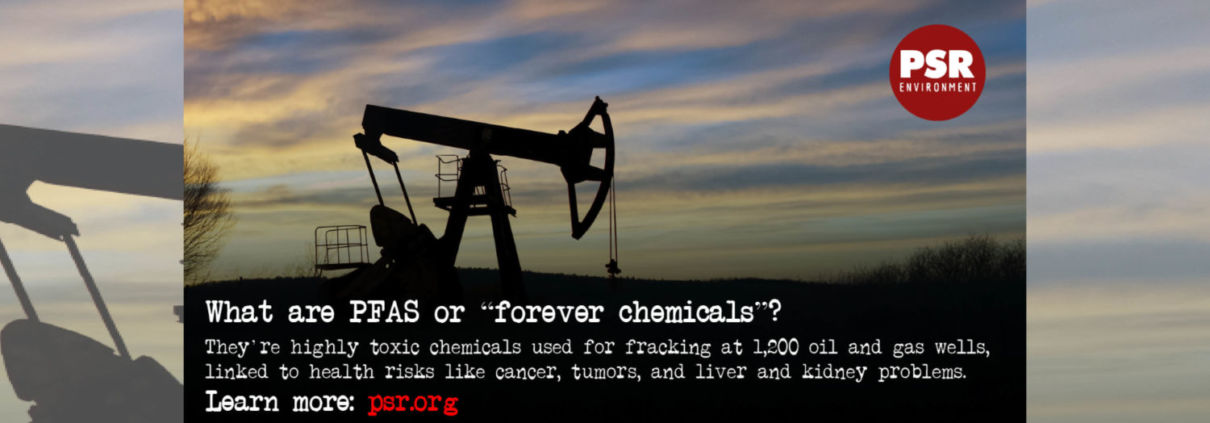
FracTracker Alliance released a new map identifying the locations of over 1,200 oil and gas wells using toxic “forever chemicals” in Arkansas, Louisiana, Oklahoma, New Mexico, Texas, and Wyoming.
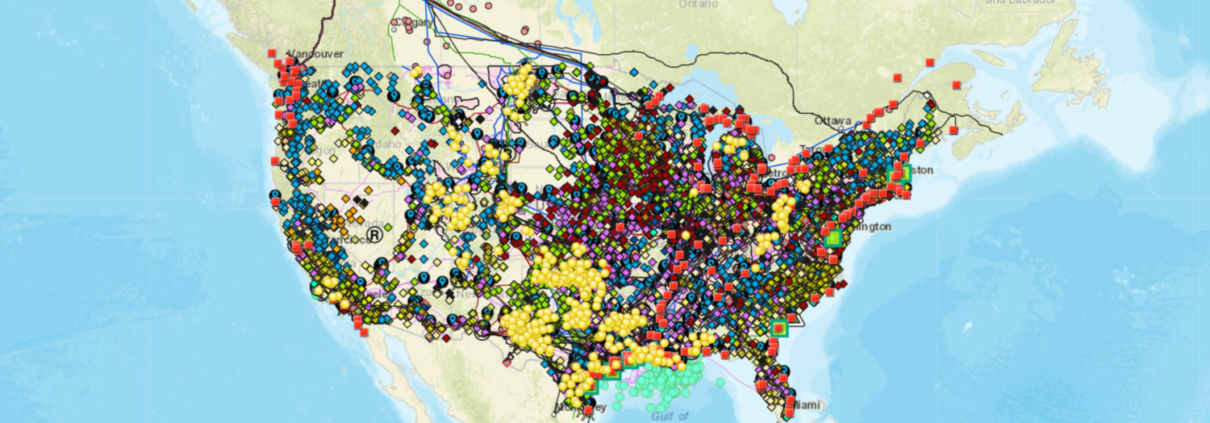
We first released this map in February of 2020. In the year since, the world’s energy systems have experienced record changes. Explore the interactive map, updated by FracTracker Alliance in April, 2021.
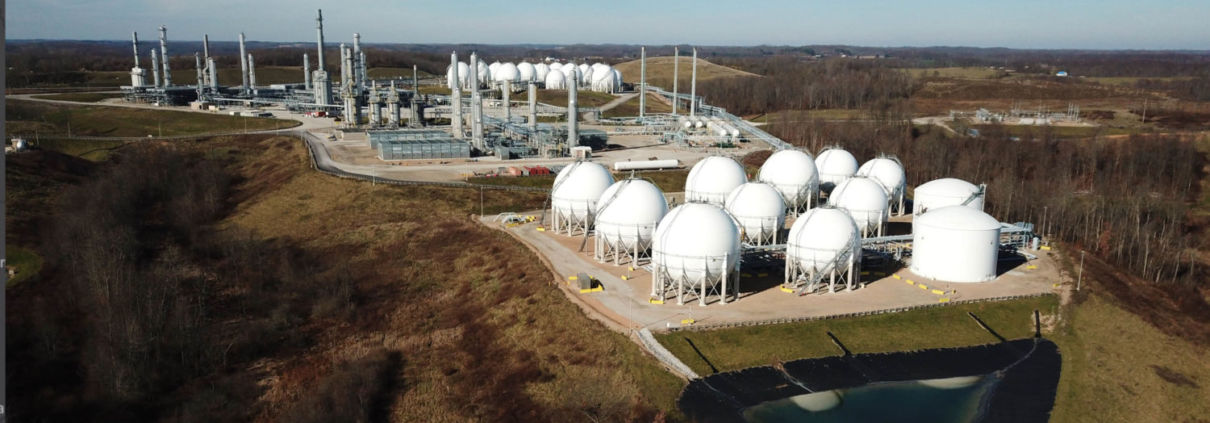
FracTracker’s aerial survey of unconventional oil & gas infrastructure and activities in northeast PA to southern OH and central WV
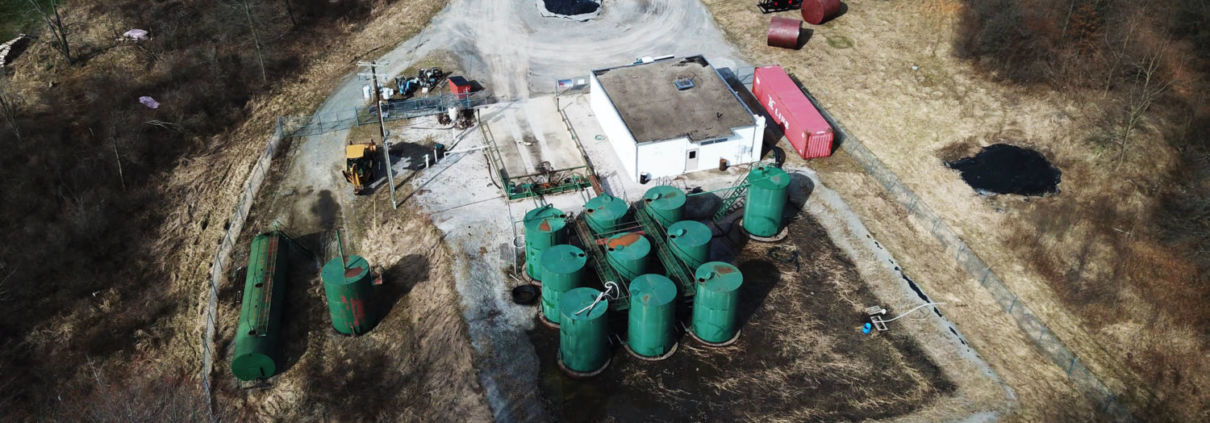
Insights on Ohio’s massive fracking waste gap, Class II injection well activity, and fracking waste related legislation
![]()
216 Franklin St, Suite 400, Johnstown, PA 15901
Phone: +1 (717) 303-0403 | info@fractracker.org
FracTracker Alliance is a 501(c)3 non-profit: Tax identification number: 80-0844297