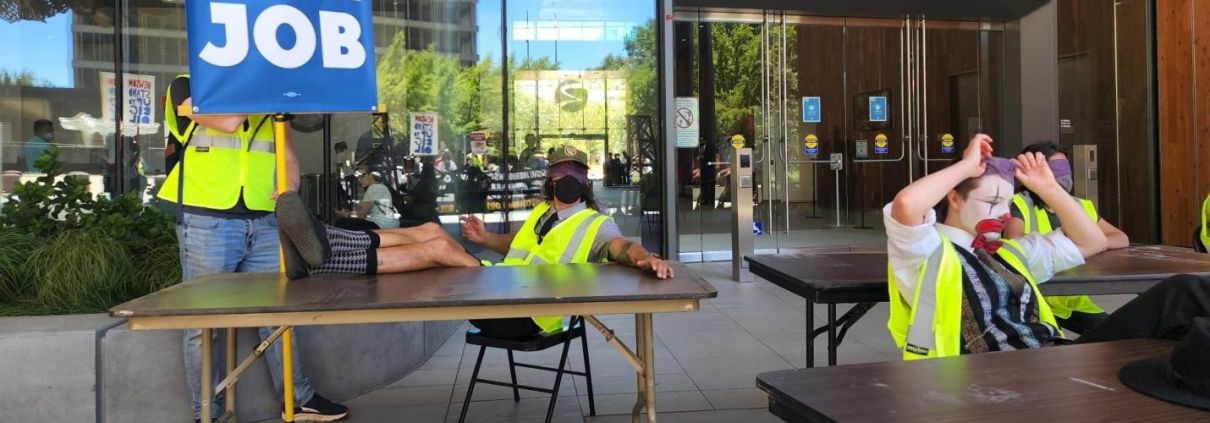
Take Action in Support of No New Leases
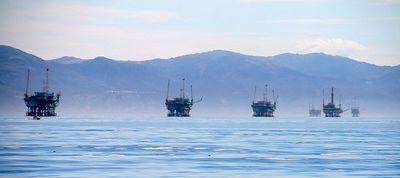
The federal government is accepting comments on a 5-Year Offshore Oil and Gas Lease Program. We need your voice to join in solidarity with communities in the Gulf and the Arctic and call for no new leases.
The federal government is accepting comments on a 5-Year Offshore Oil and Gas Lease Program. We need your voice to join in solidarity with communities in the Gulf and the Arctic and call for no new leases.
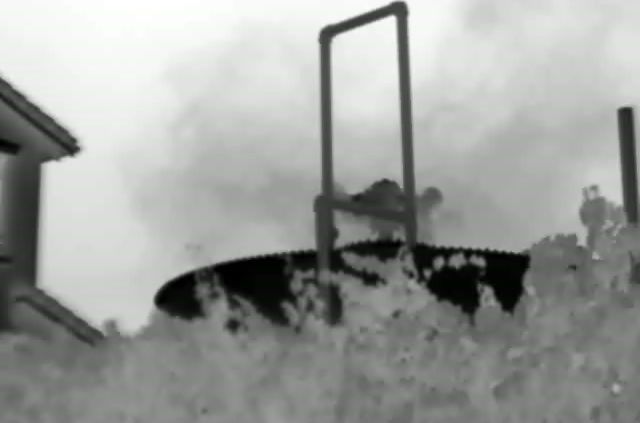
FracTracker inspections of oil and gas infrastructure using an optical gas imaging camera found numerous sources of uncontrolled emissions in three California counties.
FracTracker’s in-the-field inspections and updated analysis of CalGEM permit data shows that California’s regulatory practices and permitting policies risk exposing frontline communities to VOCs from oil and gas well sites.

A hazardous byproduct of oil & gas operations, called “brine,” poses a problem because of its radioactivity and the volumes produced.

David Hess reports on the pervasive & dangerous practice of waste disposal at oil and gas well drilling sites via “dusting.”

FracTracker has released an analysis of Pennsylvania’s 2021 oil and gas production totals and the impacts of orphaned and abandoned wells.
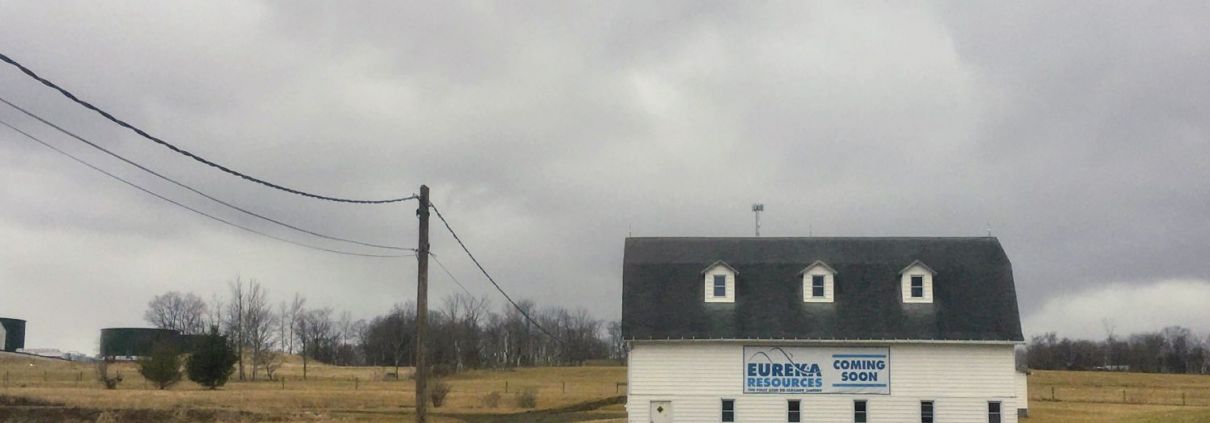
Sen. Muth and Dimock, PA residents are fighting a permitted Eureka Resource Susquehanna facility that puts their water at risk.

A report by PSR provides evidence that oil and gas companies have been using dangerous PFAS “forever chemicals” in CO wells.
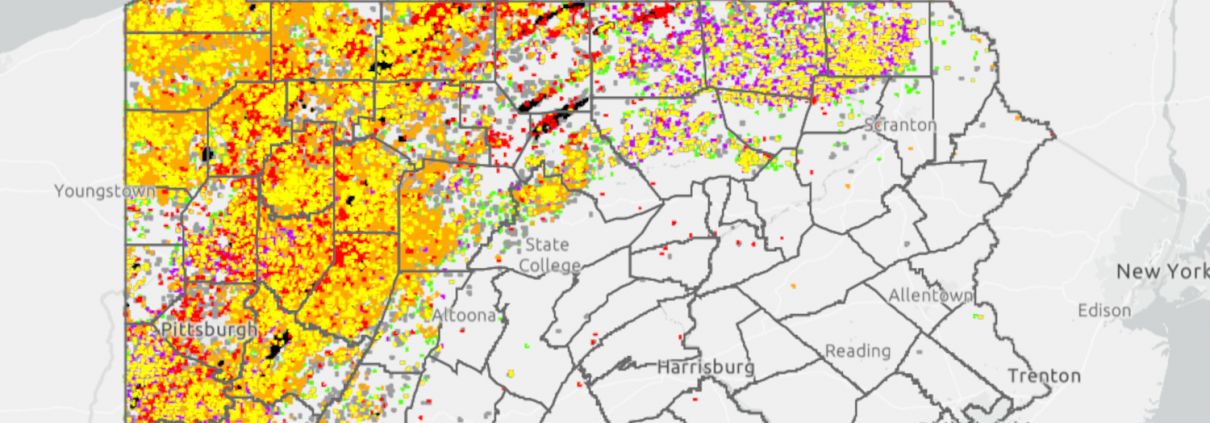
FracTracker’s new Pennsylvania oil and gas well map displays conventional and unconventional wells and violations as of January 12, 2022.
FracTracker details the disproportionate amounts of water used by the oil and gas industry in CA and recommends that Gov. Newsom take action.
![]()
216 Franklin St, Suite 400, Johnstown, PA 15901
Phone: +1 (717) 303-0403 | info@fractracker.org
FracTracker Alliance is a 501(c)3 non-profit: Tax identification number: 80-0844297