Abandoned Wells in Pennsylvania: We’re Not Doing Enough
By Isabelle Weber, FracTracker Alliance Spring 2019 Intern
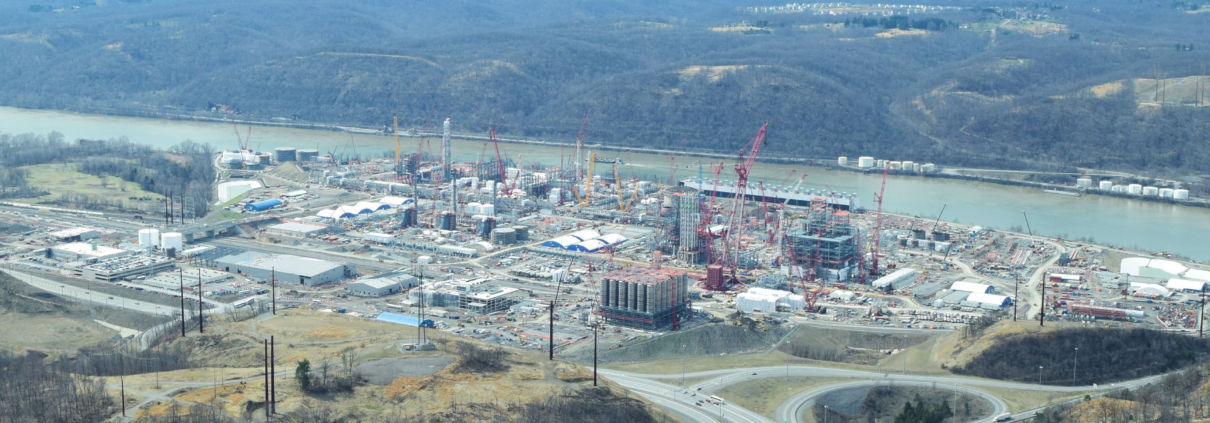
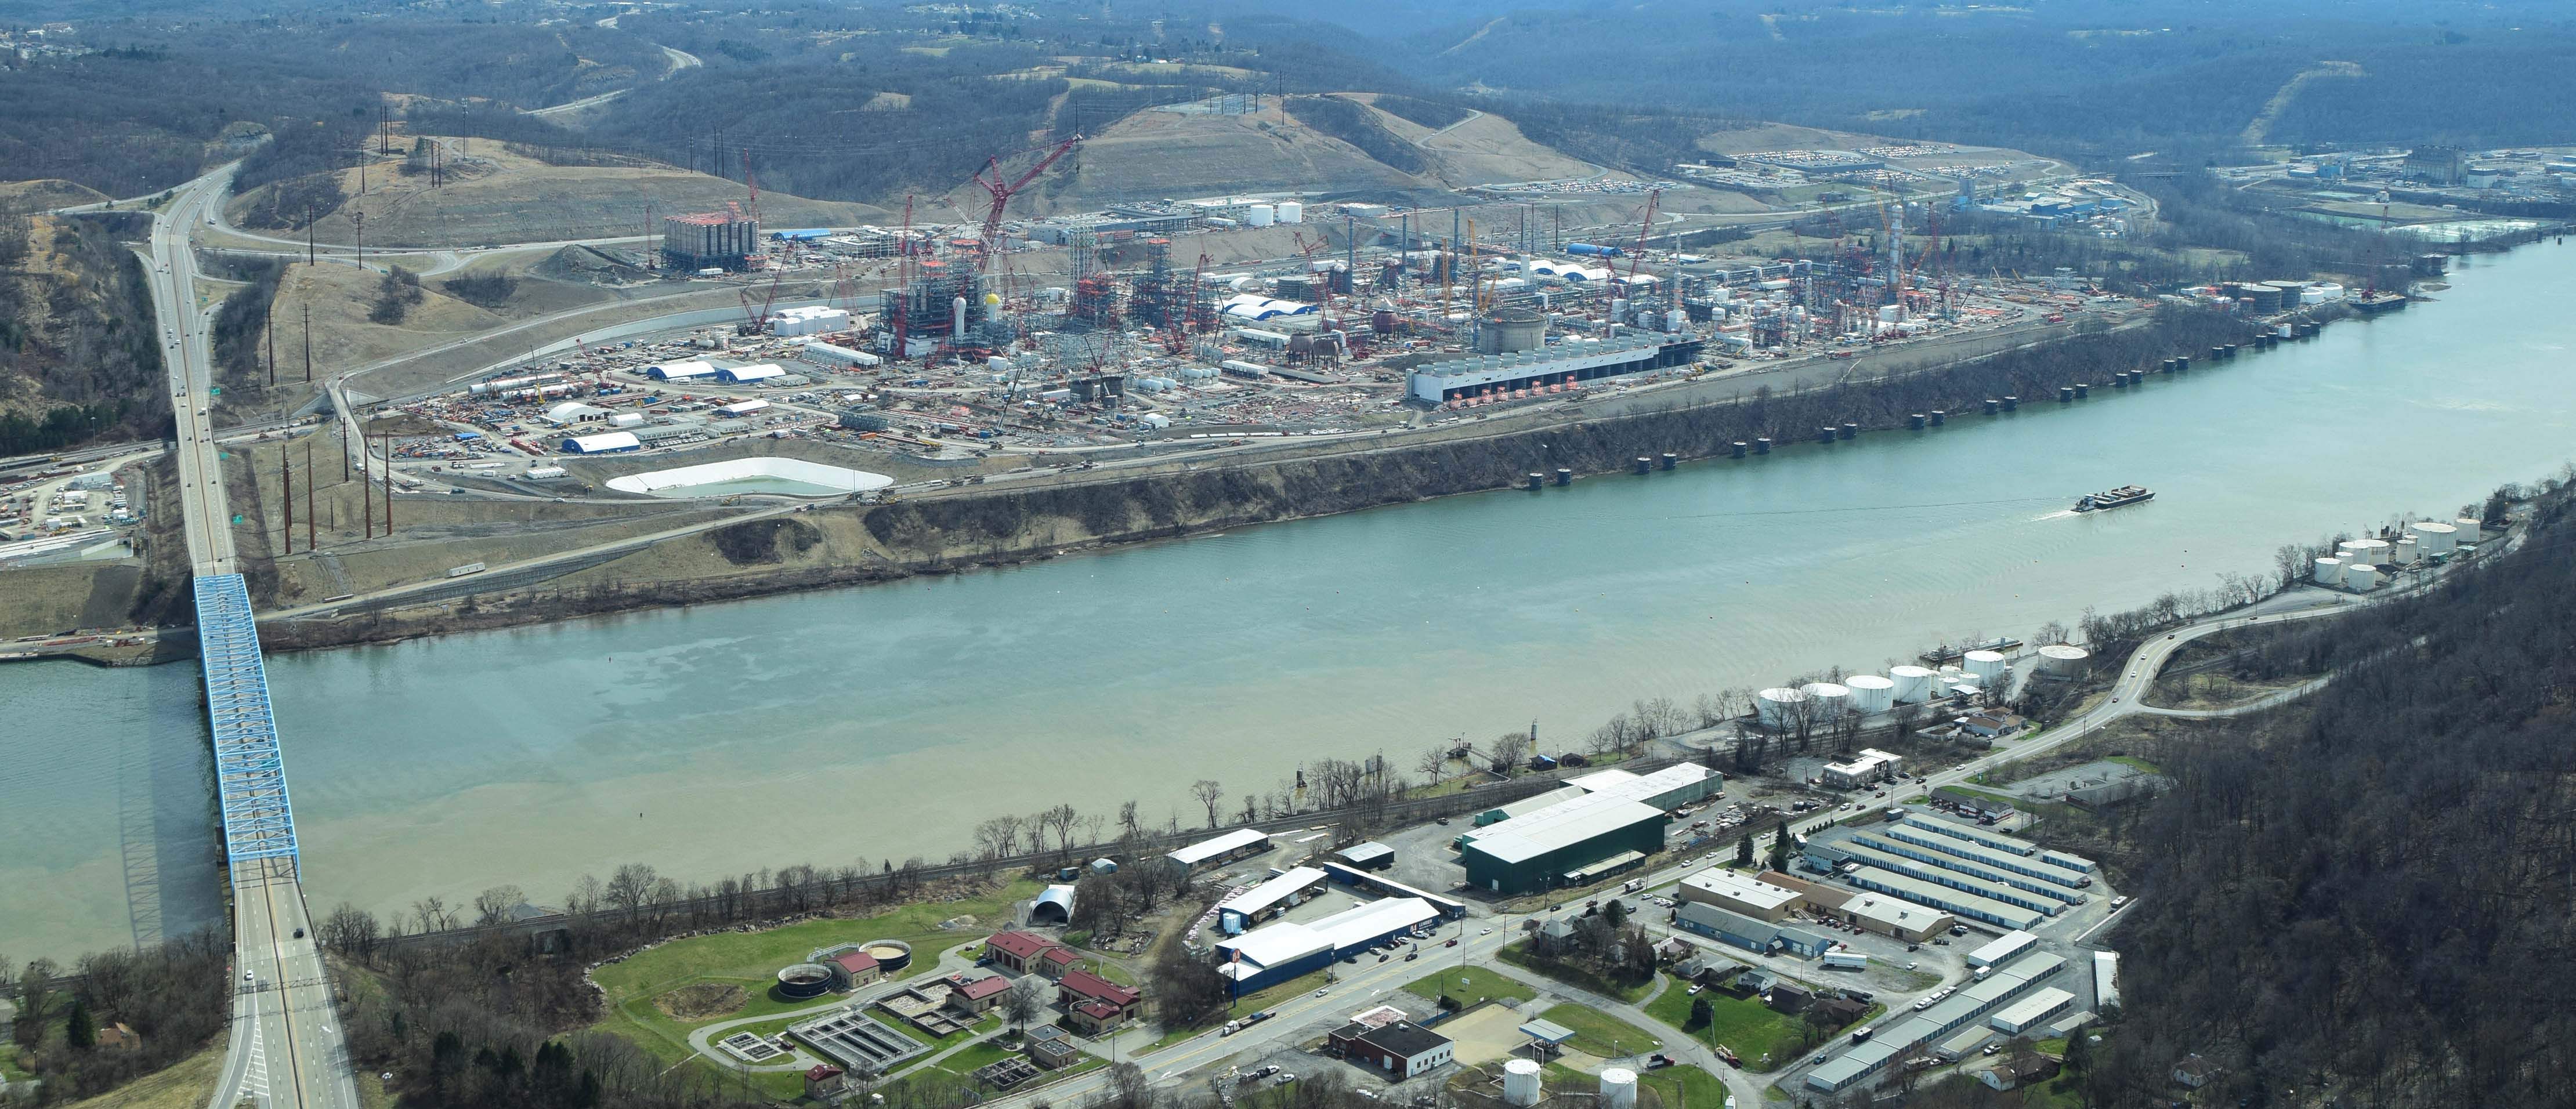
Fracking in Pennsylvania: The History
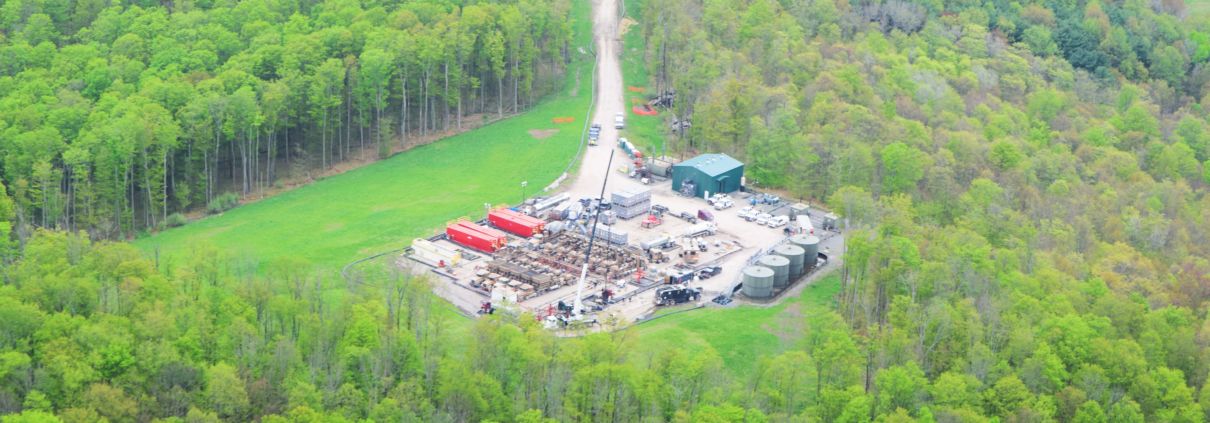
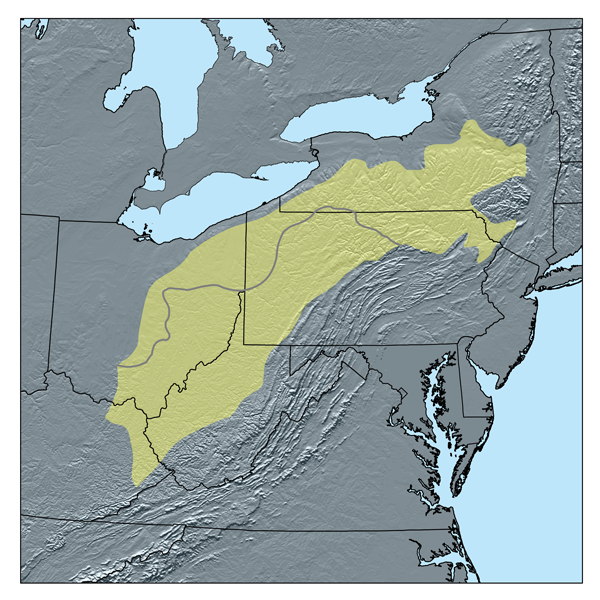
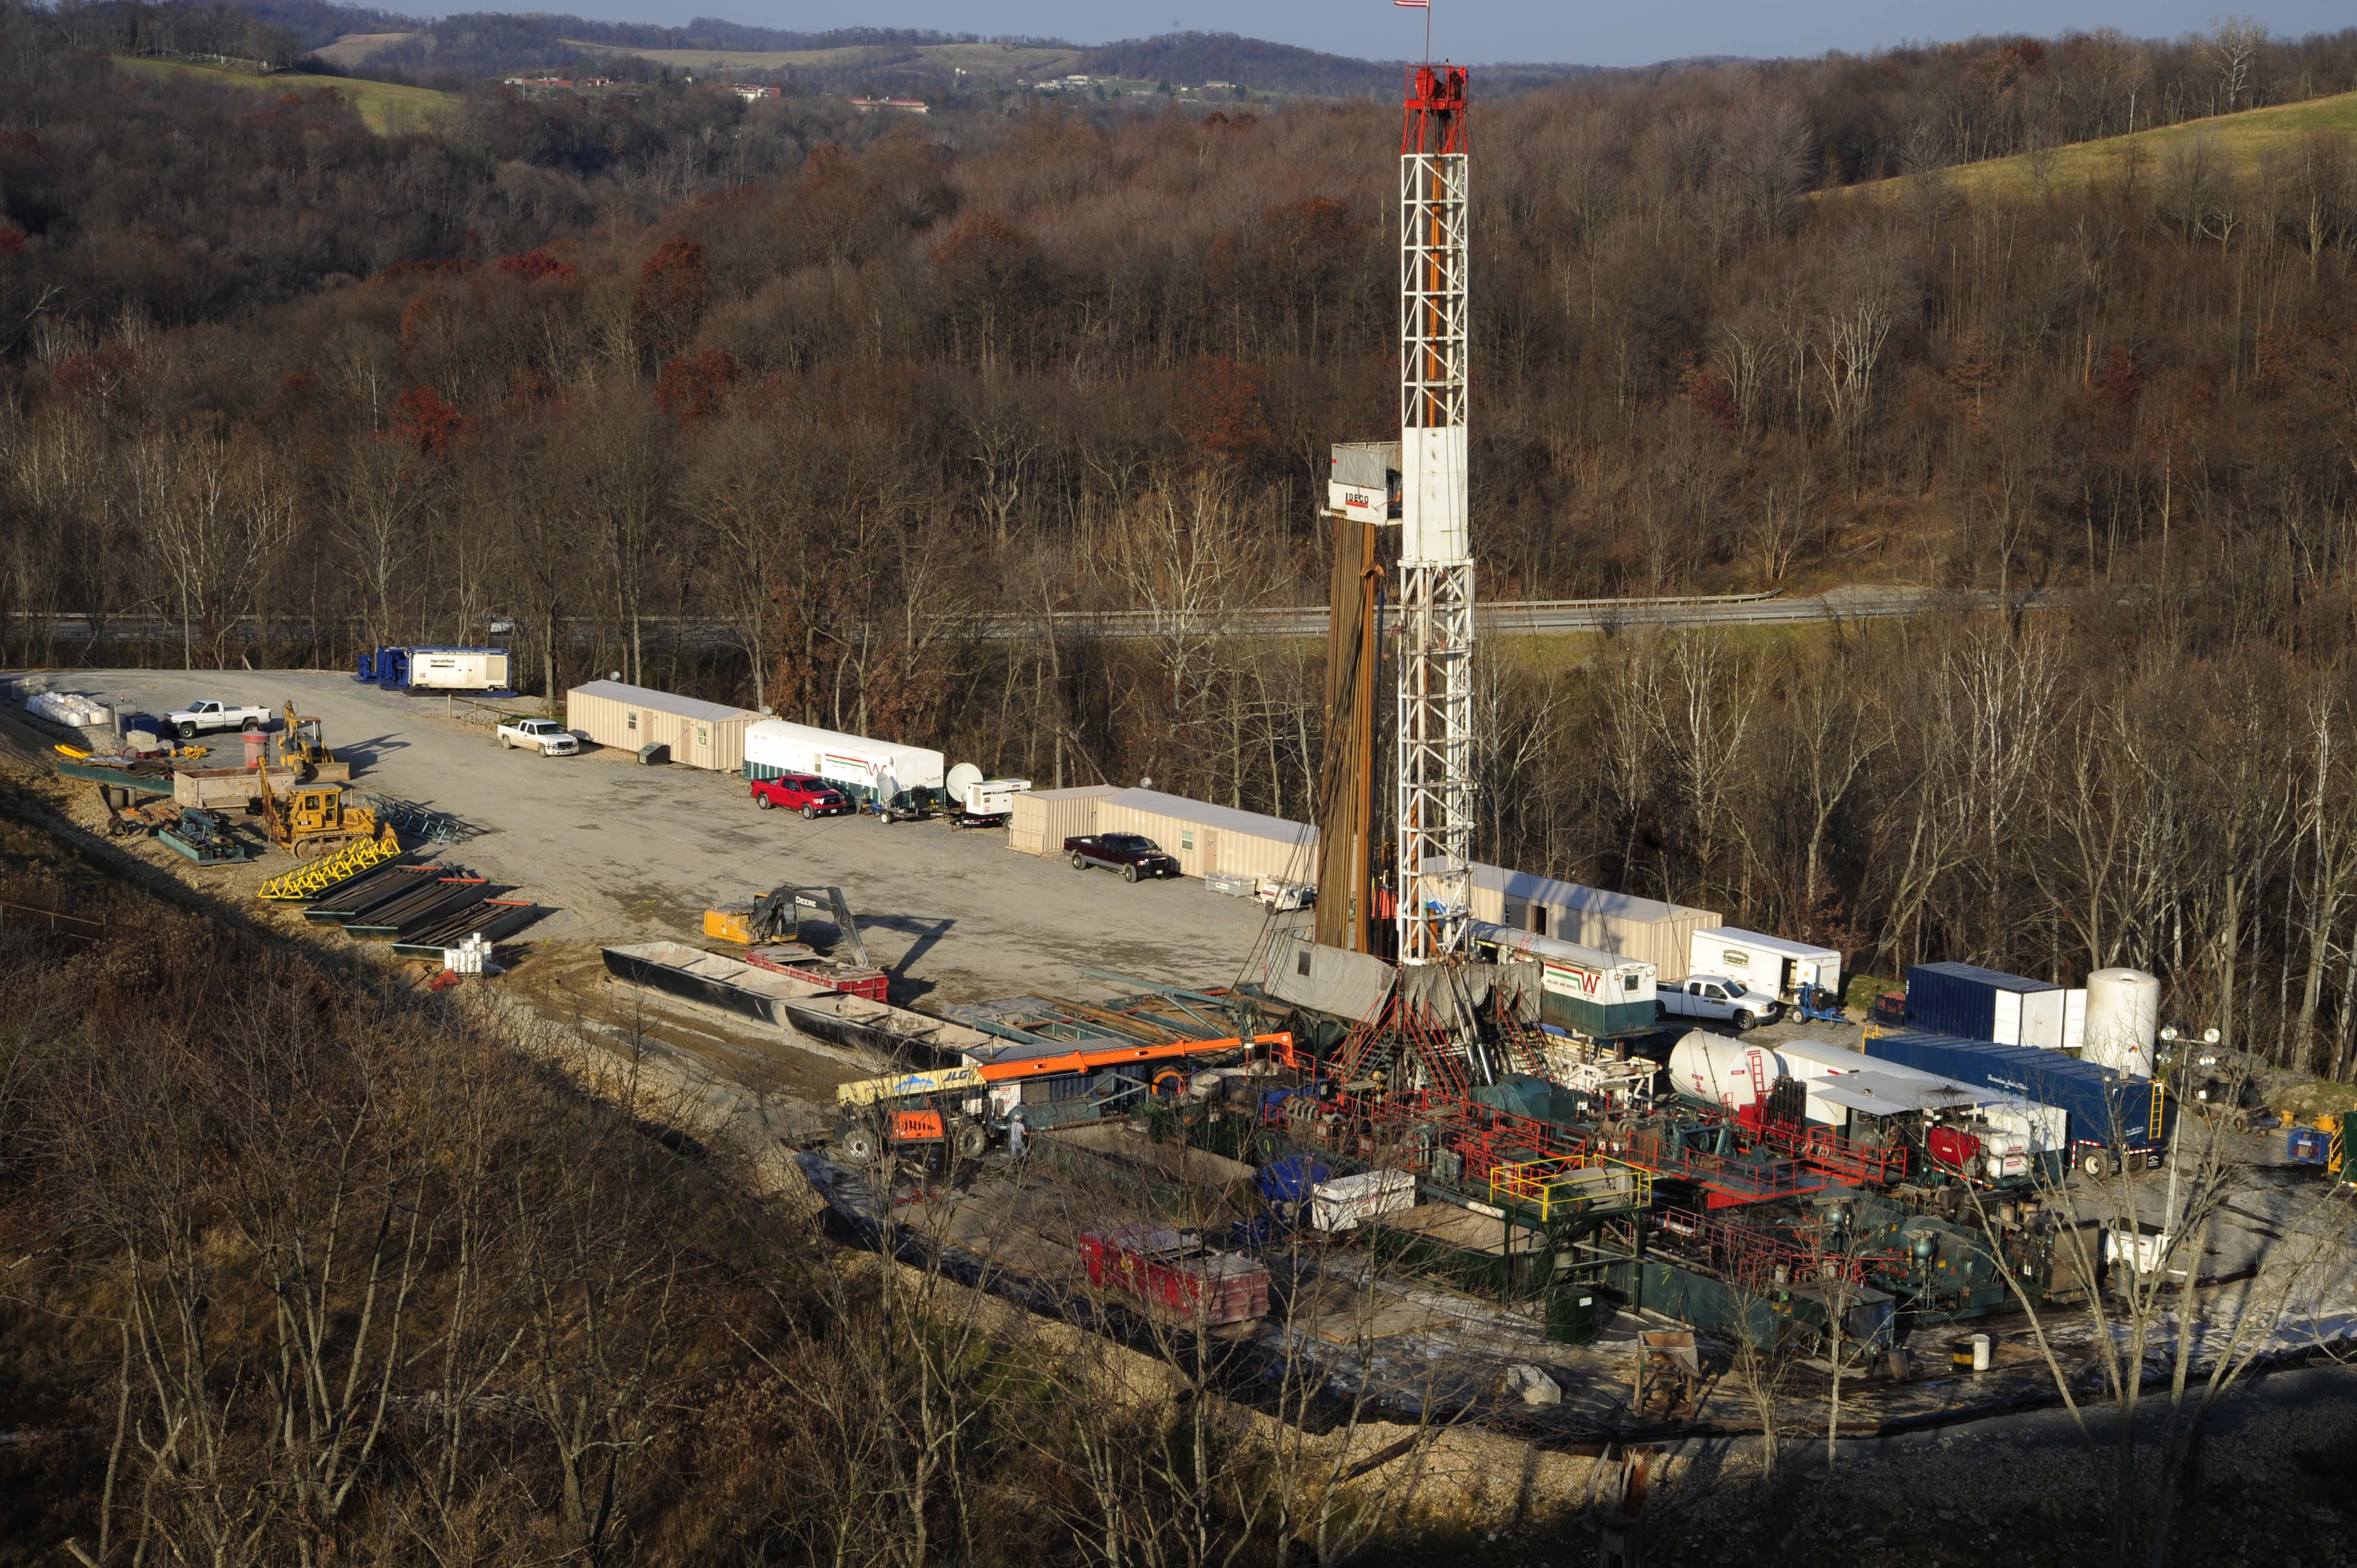
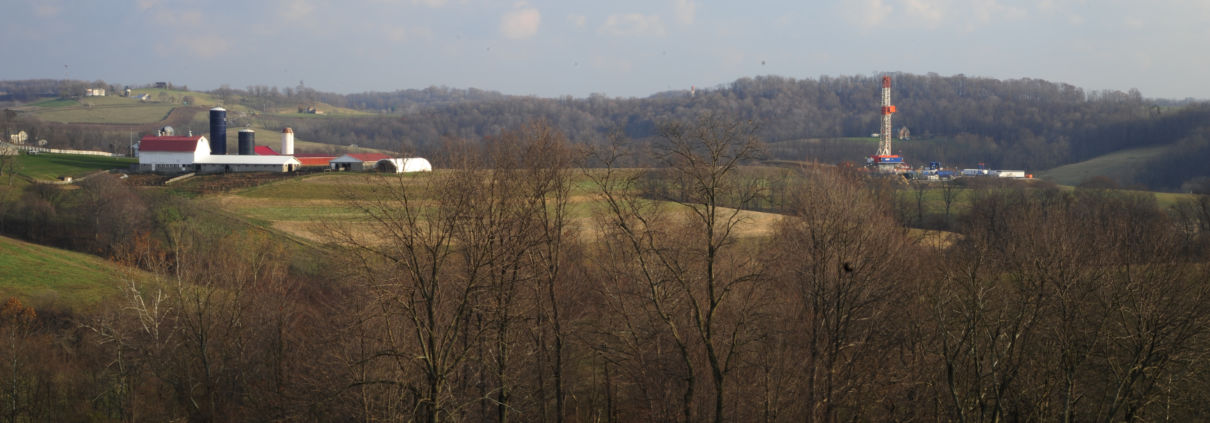
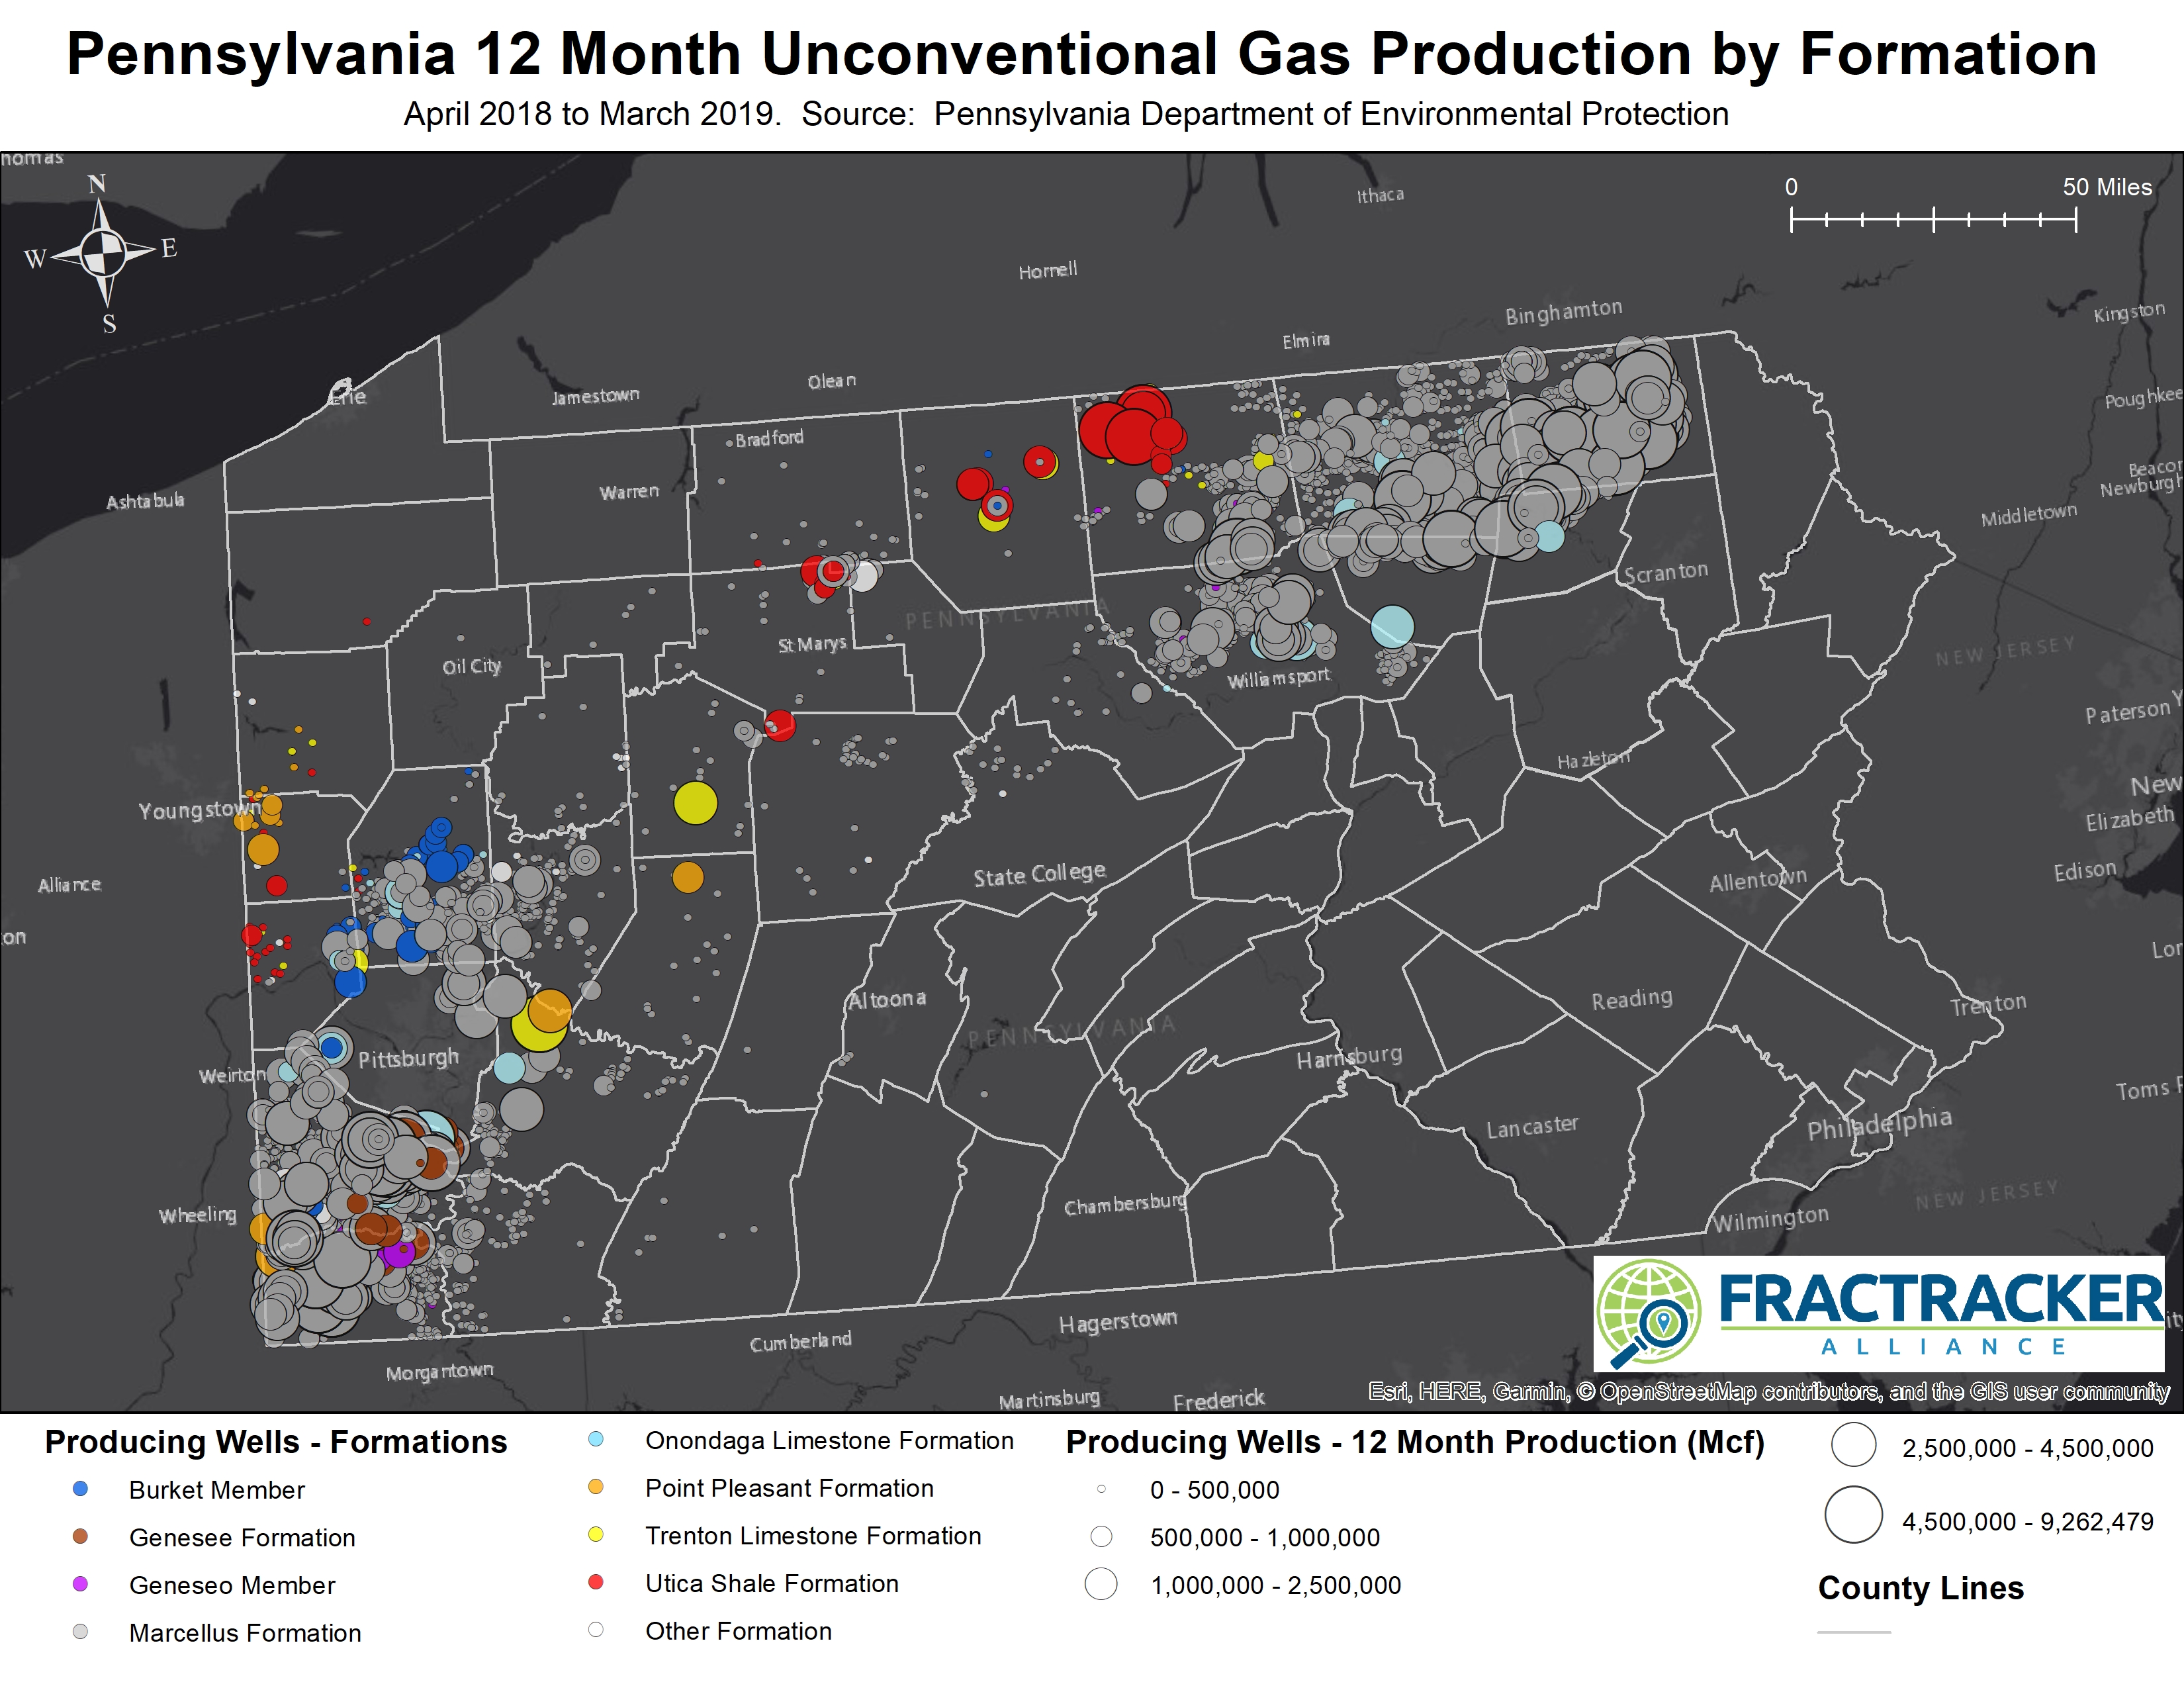
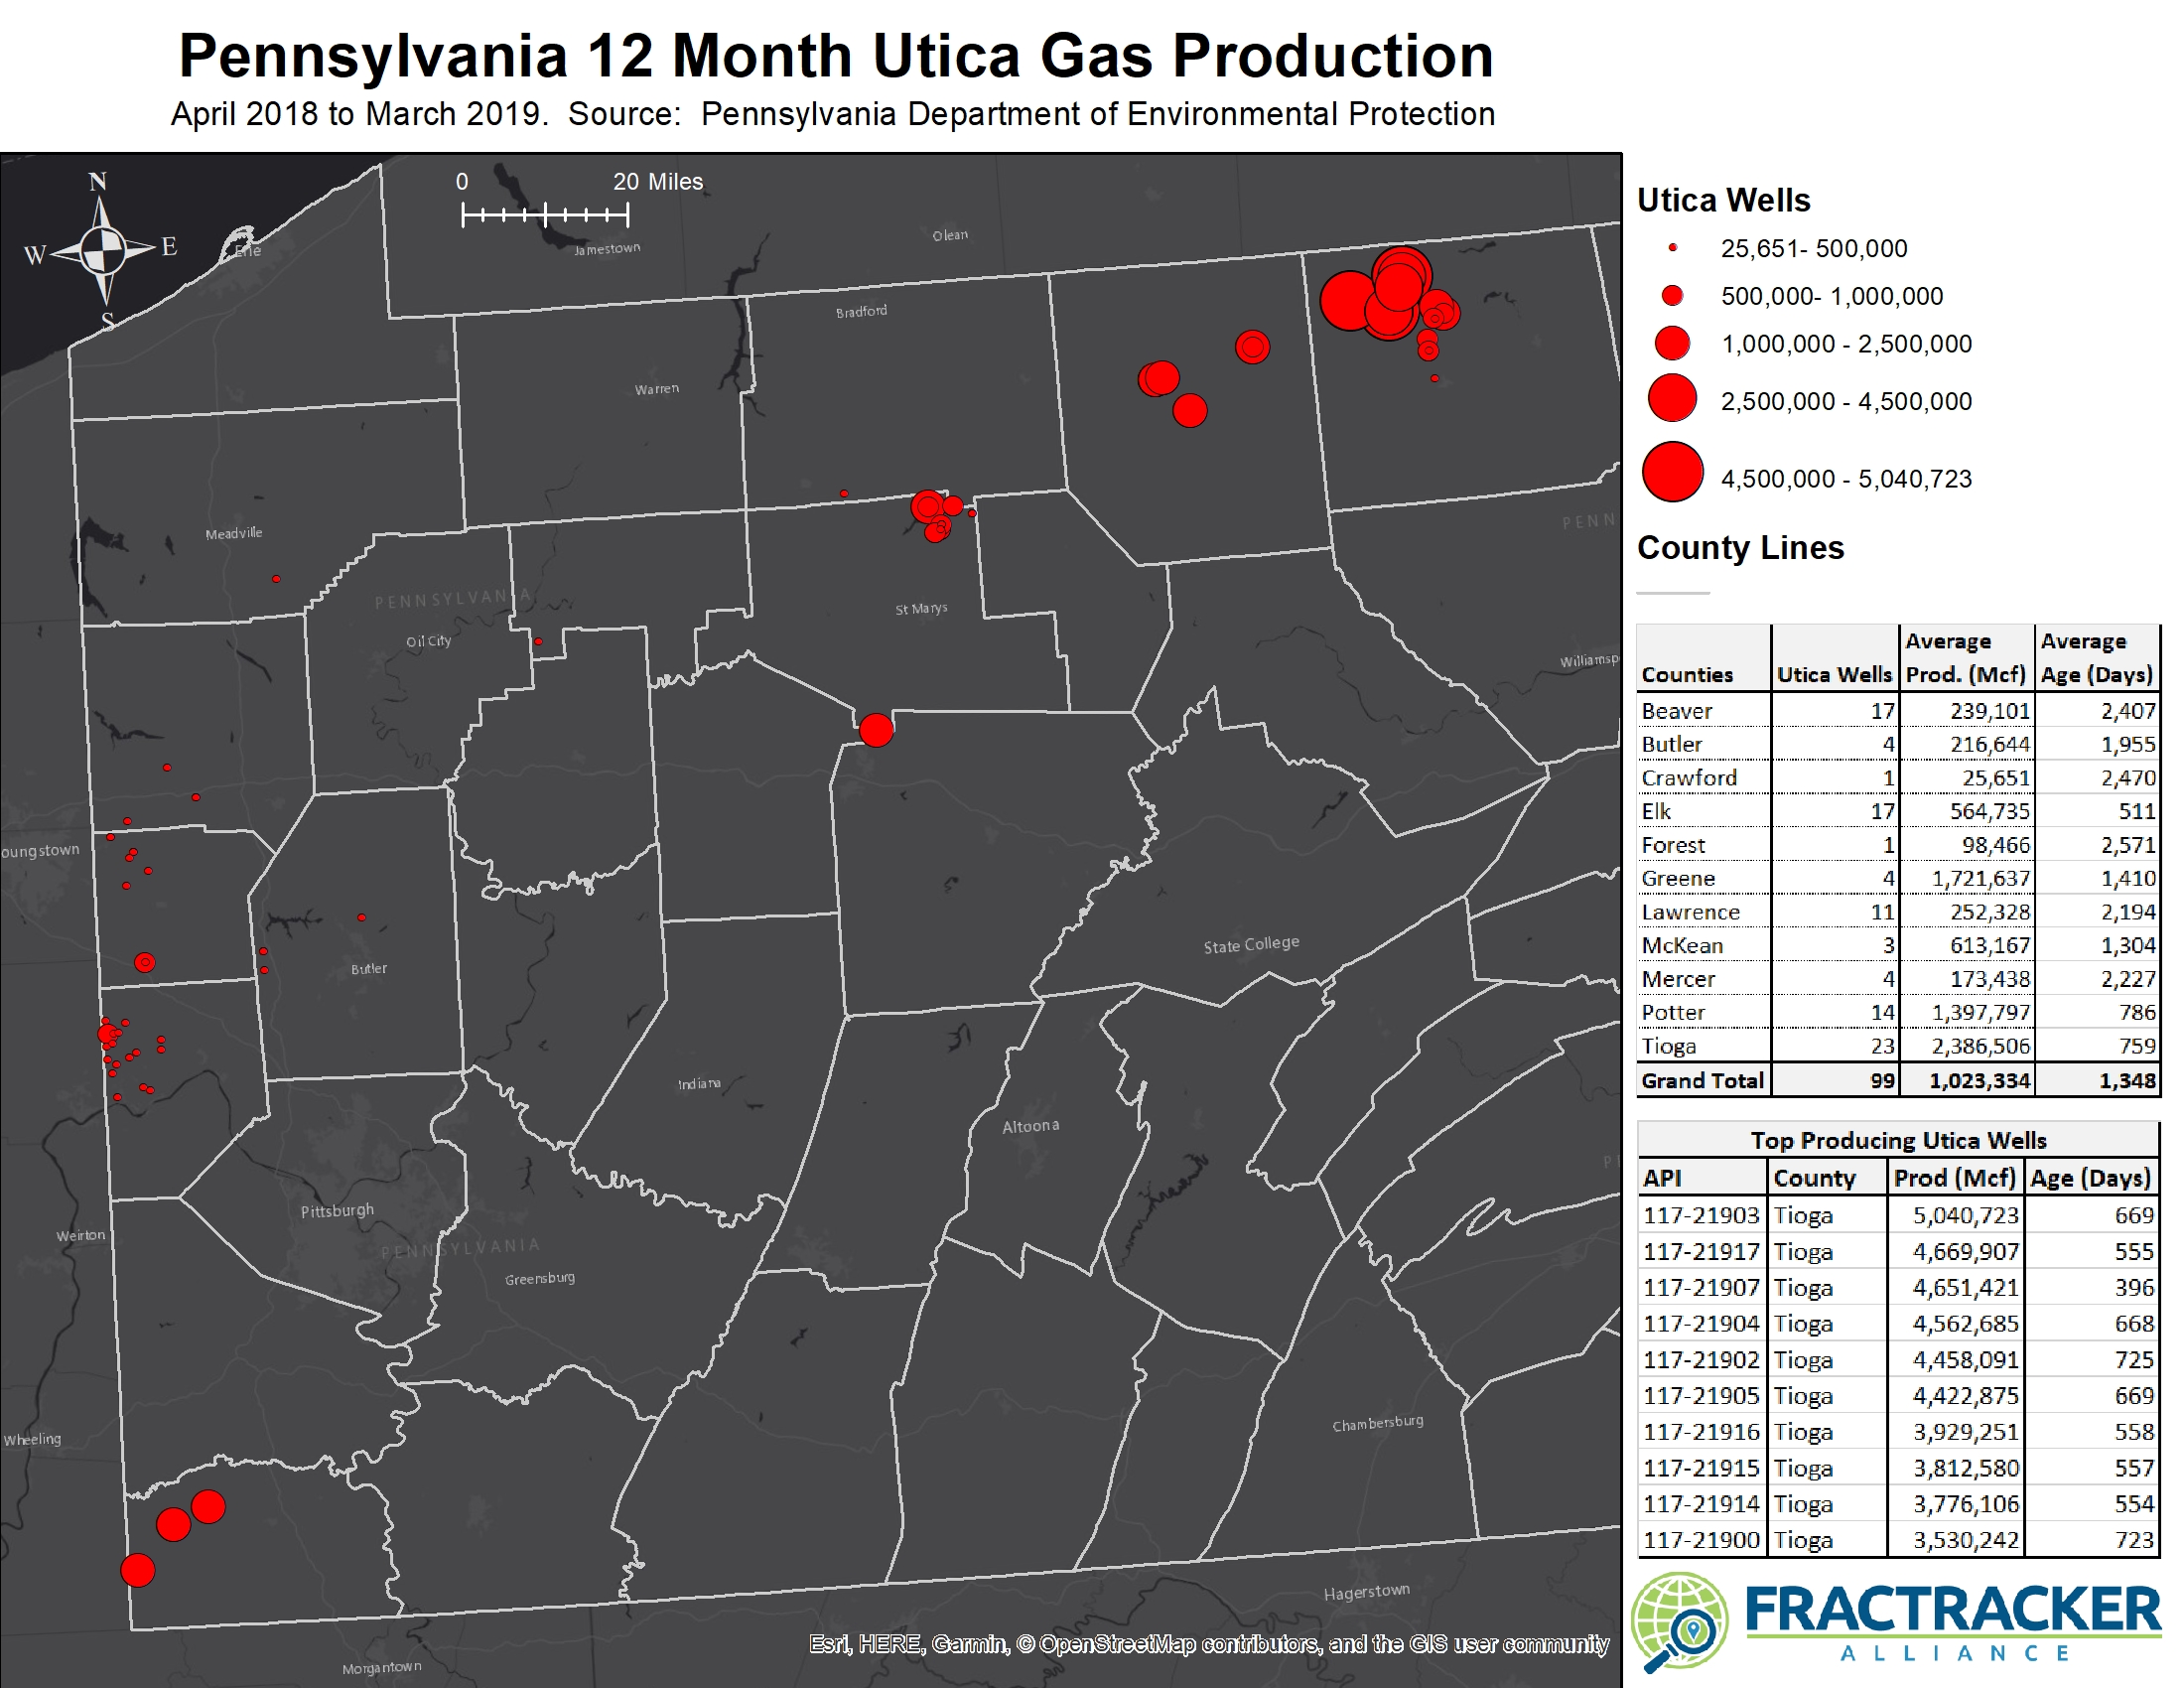
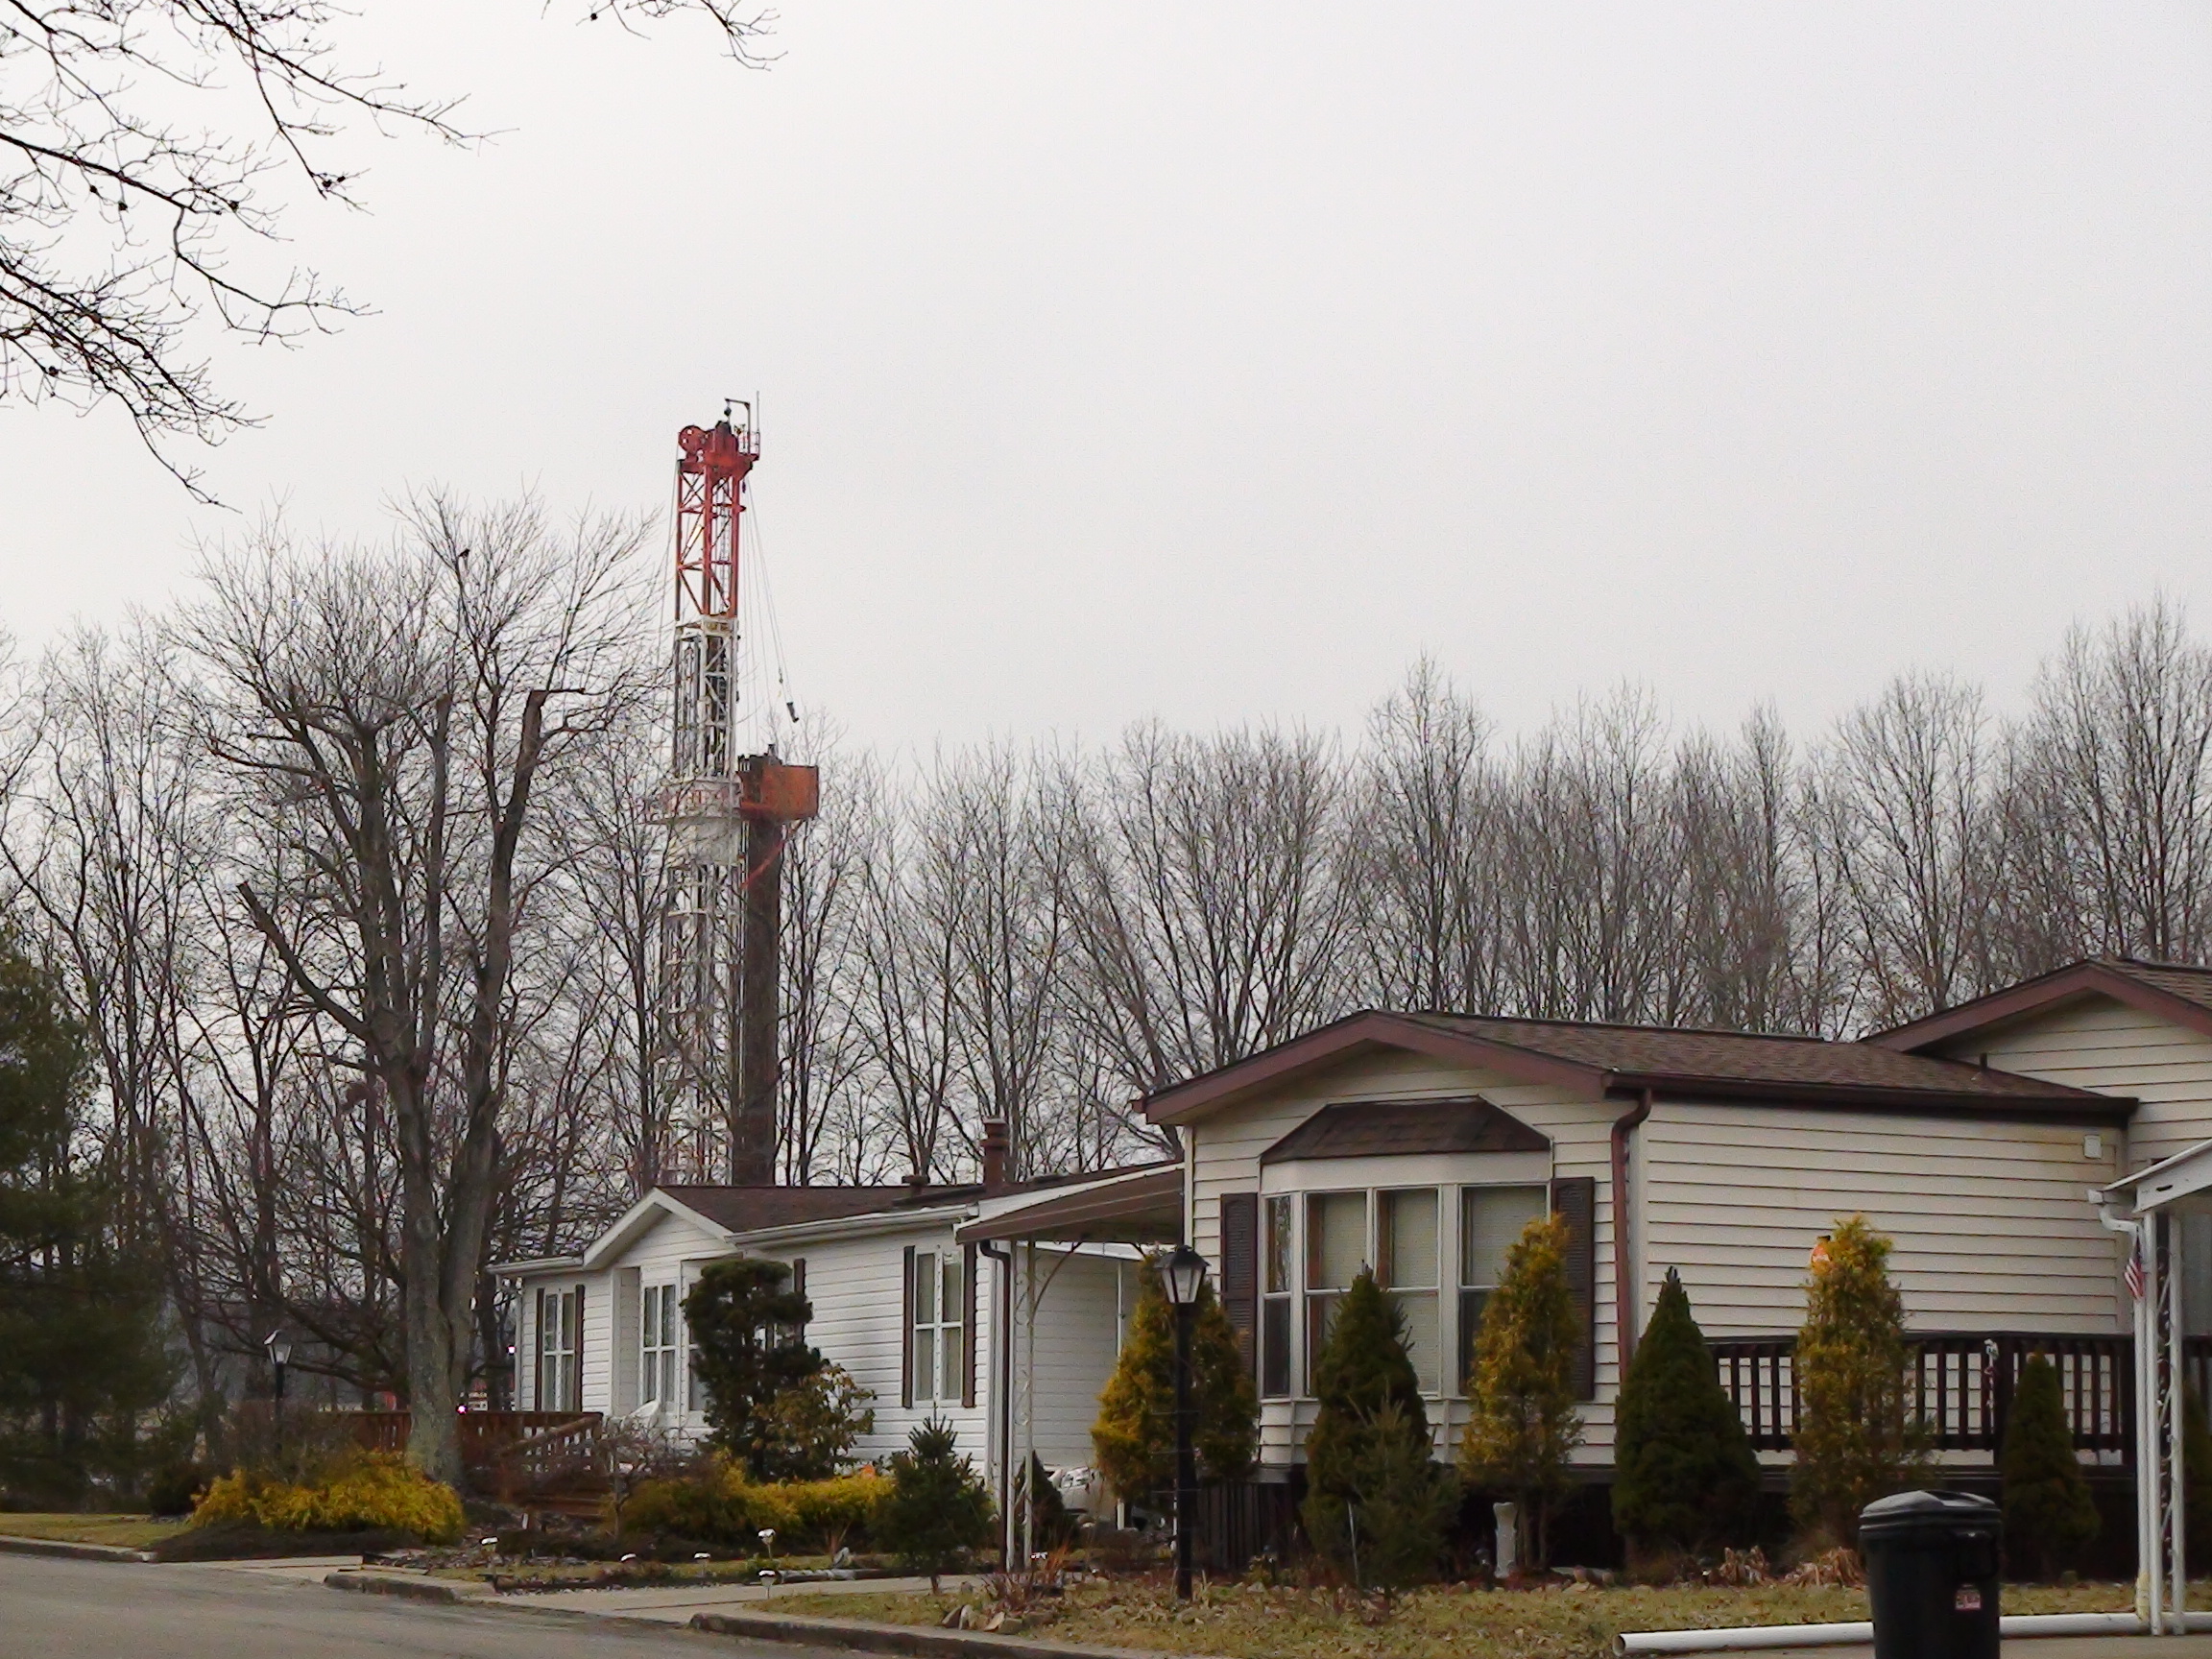
When driving through Pennsylvania, you can see what an impact oil and gas has had on the state. Towns like Oil City and Petrolia speak to the oil and gas industry’s long standing history here. In more recent history, Pennsylvania has been a prime fracking location because of the presence of the Marcellus shale formation that covers over half of the state. With more unconventional oil and gas exploration came impacts to communities, who were denied their right to “clean air, pure water, and the preservation of the natural, scenic, historic, and esthetic values of the environment” as defined by the Pennsylvania Constitution.
Hydraulically fractured wells are often no longer profitable after just one stimulation, after which they are abandoned. Improperly abandoned wells wreak havoc on our communities and our environment. The number of improperly abandoned wells has been increasing over time as companies go bankrupt transfer wells to other companies. These wells can easily go undetected because they are often buried underground, leaving no traces at the surface level.
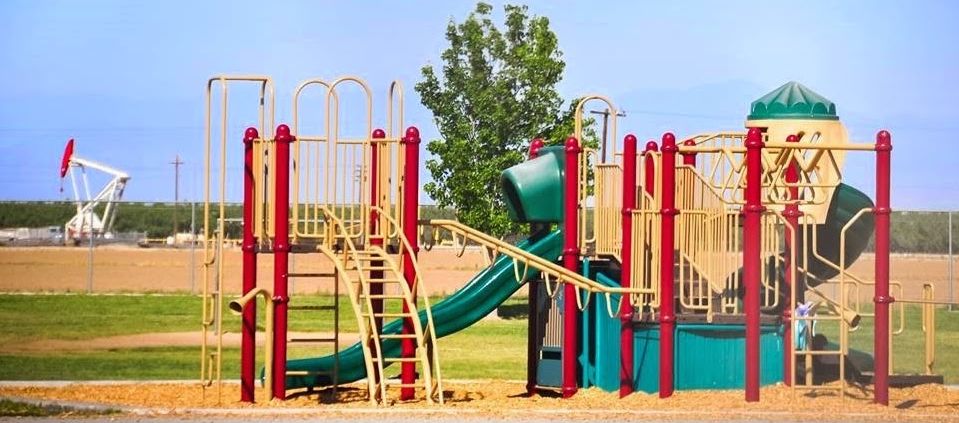
These unplugged abandoned wells are underneath our homes, our schools, and in our own backyards, negatively impacting our health and the environment.
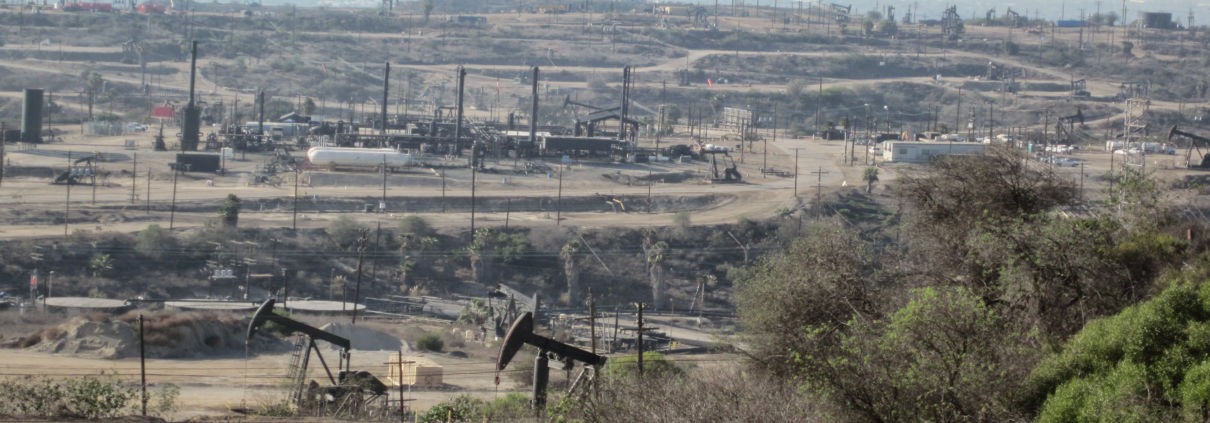
FracTracker’s West Coast Coordinator Kyle Ferrar shows how abandoned wells are hiding all around us in his investigation of downtown Los Angeles. He used an infrared camera to visualize the plumes of methane and other volatile organic compounds spewing out of abandoned wells in the middle of streets.
Dangers of unplugged abandoned wells
The plugging process consists of filling the well with cement, ensuring that nothing leaks from the well into the surrounding ecosystem. Without that measure in place, the chemical-water solution used to frack the underlying shale, as well as any oil or natural gas still left in the well, can very easily seep into nearby aquifers or into close by waterways. Wells that are not plugged or are not plugged properly leak into nearby aquifers, releasing methane and other volatile organic compounds are continually released from the well into the atmosphere as well. This leakage into the atmosphere and ground water can have disastrous effects on our ecosystem and health.
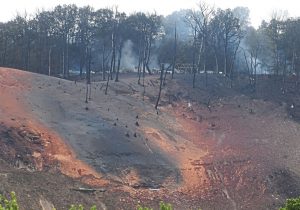
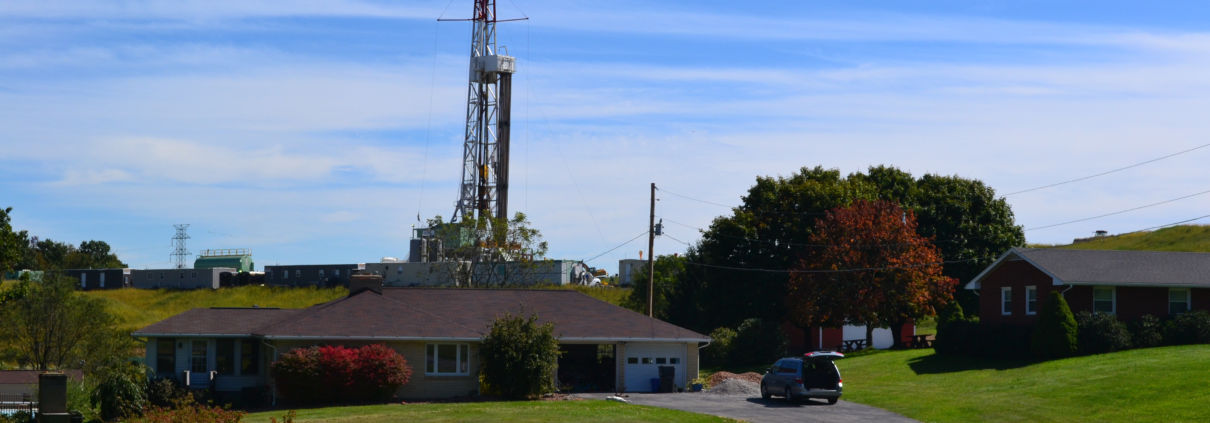
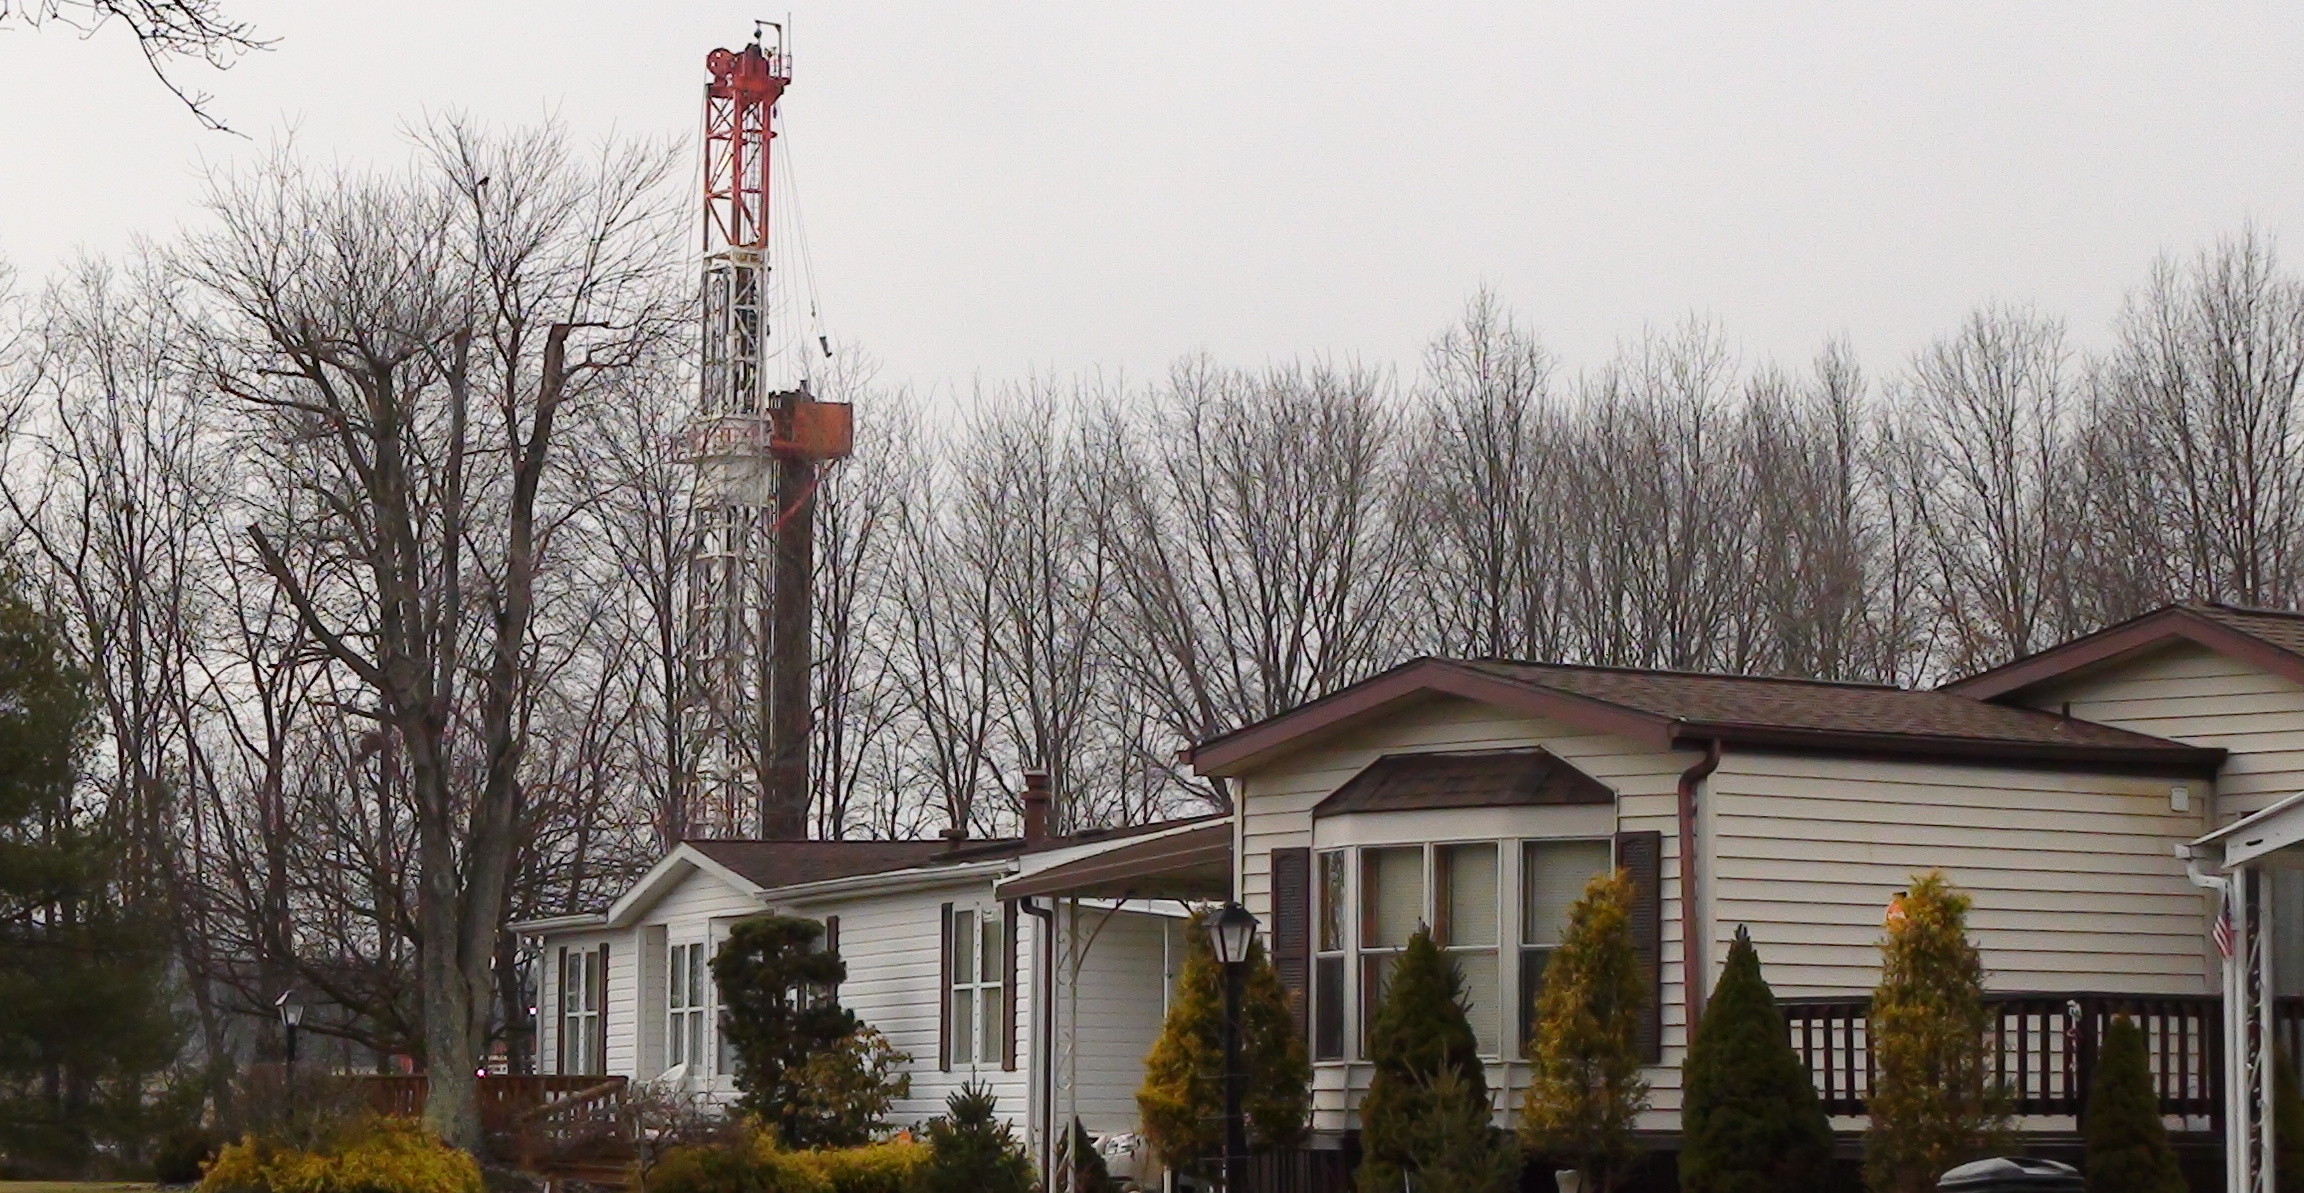
Abandoned wells are also a dangerous threat because many of their locations are unknown. These wells can ruin the structural integrity of buildings and homes that are unknowingly built on top of them. The methane leaking out of the well is colorless and odorless, meaning that it can easily build-up in homes or elsewhere and cause explosions.
Bankruptcy and Bonds
When an oil and gas company drills a well, they are responsible for making sure that it is plugged properly at the end of the well’s life. This is the case even if the company goes bankrupt. To do this, Pennsylvania government requires that the company put up a bond that is set aside to plug the well properly. This ensures that if the company does go bankrupt, the necessary funds are already set aside to plug the well. Normally, this bond takes the shape of a blanket bond amount of $25,000 which is intended to cover the total expenses that would be incurred in plugging all of the wells a company has in the state. Depending on the number of wells a company possesses, this could mean very little actually being set aside for each individual well.
A shallow well can cost between $8,000 to $10,000 plus, and up to $50,000 or more depending on how difficult it is to plug. In the case of Pennsylvania’s top oil and gas holder Diversified Gas & Oil PLC and its recently acquired. Company Alliance Petroleum Corp, this bond sets aside just $2 per well. With most other companies holding no more than 5,700 wells, this sets aside $4.40 per well. Where the bond amounts fall short in accounting for the cost to plug the hundreds of thousands of abandoned wells across the state, the rest of the cost falls at the feet of taxpayers.
The New Contract
The state government has started to recognize the severity of the situation as they are confronted with a mountain of costs in plugging these wells. To start to mitigate this, the government has recently settled with Diversified Gas & Oil. The company has been ordered to properly plug 1,058 abandoned wells. To do this they have signed on to a $7 million bond with $20,000 to $30,000 bonds for each additional abandoned or non-producing well that is acquired.
Although it is a great start to ensure that these two major companies have the proper bonding amount moving forward, this does not apply to all companies, whose likelihood of going bankrupt puts a lot of financial pressure on Pennsylvanian citizens. Also, these 1,058 wells are only the tip of the iceberg, with the DEP estimating that there are between 100,000 and 560,000 total abandoned wells in Pennsylvania, many of which still have unknown locations.
In the 2017 Pennsylvania Oil and Gas Report, it is stated that: “Currently, more abandoned wells are being added to the state’s inventory than are being addressed through permanent plugging through state-issued contracts. Since 2015, DEP has been able to fund the plugging of oil and gas wells only in emergency situations and/or when residents must be temporarily evacuated from their homes due to imminent threats that legacy wells pose when well integrity is compromised.” They continue on by stating that, considering the historic operating costs and acknowledging the sheer number of wells, properly addressing es the abandoned wells will cost between $150 million and $3.7 billion. The $150 million is an estimation based on the scenario that no more historic legacy wells are discovered, and the $3.7 billion is based on if 200,000 more are found, a more likely scenario.
The funding to cover the costs of plugging these abandoned wells comes from surcharges of $150 and $200 established by the 1984 Oil and Gas Act for each oil well permit and gas well permit. The DEP has received fewer permits in recent years meaning that there are very little funds to resolve this issue. This means that eventually this public health and environmental burden will have to fall at the feet of the taxpayers.
This makes the state’s step in the right direction look more like a tip toe. With no real, substantial plans to locate and address the large amount of wells across the state, the government is putting their people at risk because these abandoned wells are not harmless.
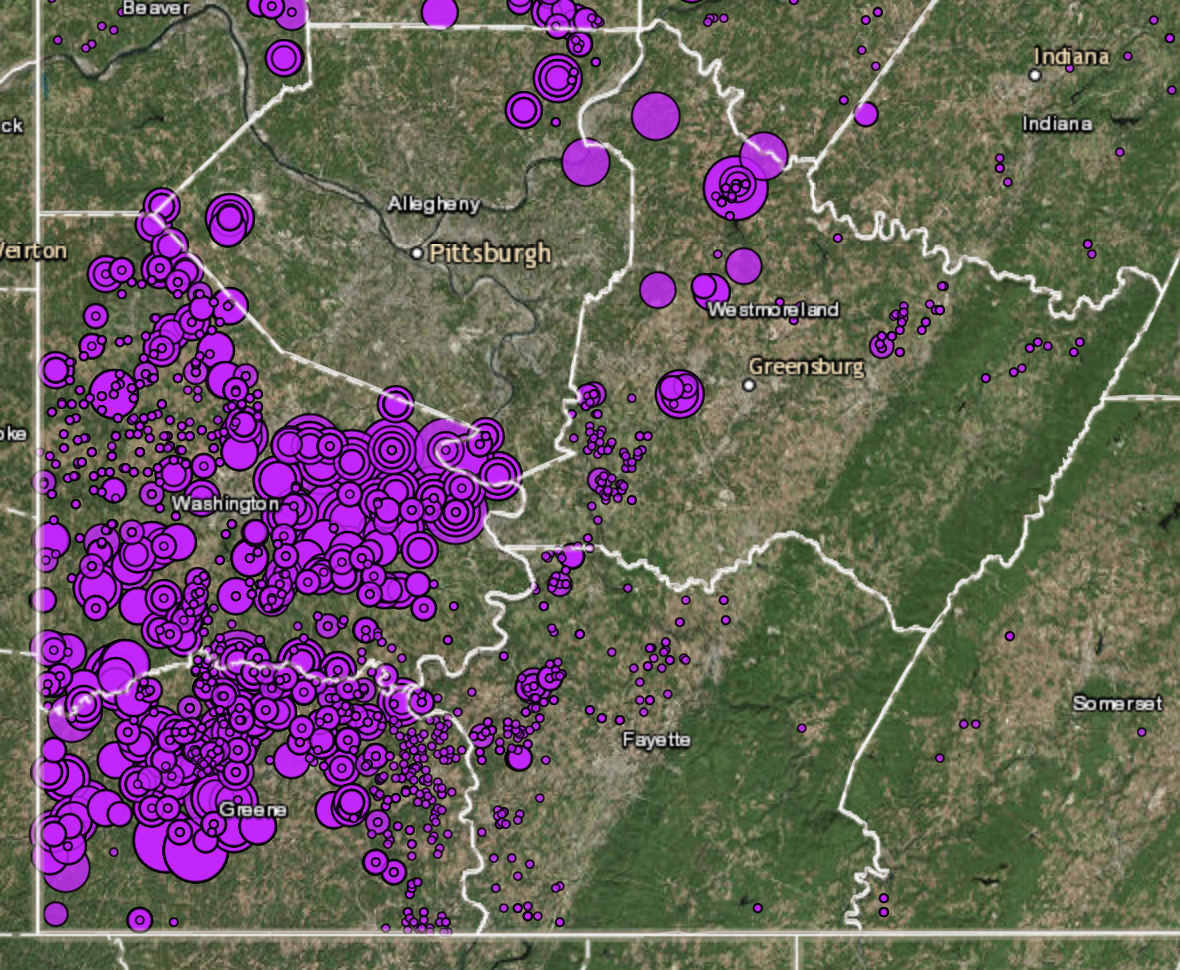
Washington County Case study
Washington County can be used as a window into the abandoned well crisis in Pennsylvania. This county sits in the middle of the Marcellus Shale formation, making it a key site for unconventional oil and gas development. According to the DEP, there are 215 abandoned, orphaned wells in Washington county, but realistically we know that there are likely many more than that.
The Pennsylvania Spatial Data Access (PASDA) has derived a dataset from historical sources to determine the possible locations of other abandoned wells. These historical documents include the WPA, Ksheet, and Hsheet collections. This data set highlights over 6,000 locations where an abandoned oil and gas well could be located.
View map fullscreen | How FracTracker maps work
This is a testament to how many of these wells exist without our knowledge. If this difference in DEP records and possible wells is this great in Washington County, then we face the enormous potential problem of tens of thousands of additional abandoned wells that need to be resolved. The effects of these wells are real and they must be identified quickly.
These are some of the physical effects of abandoned wells:
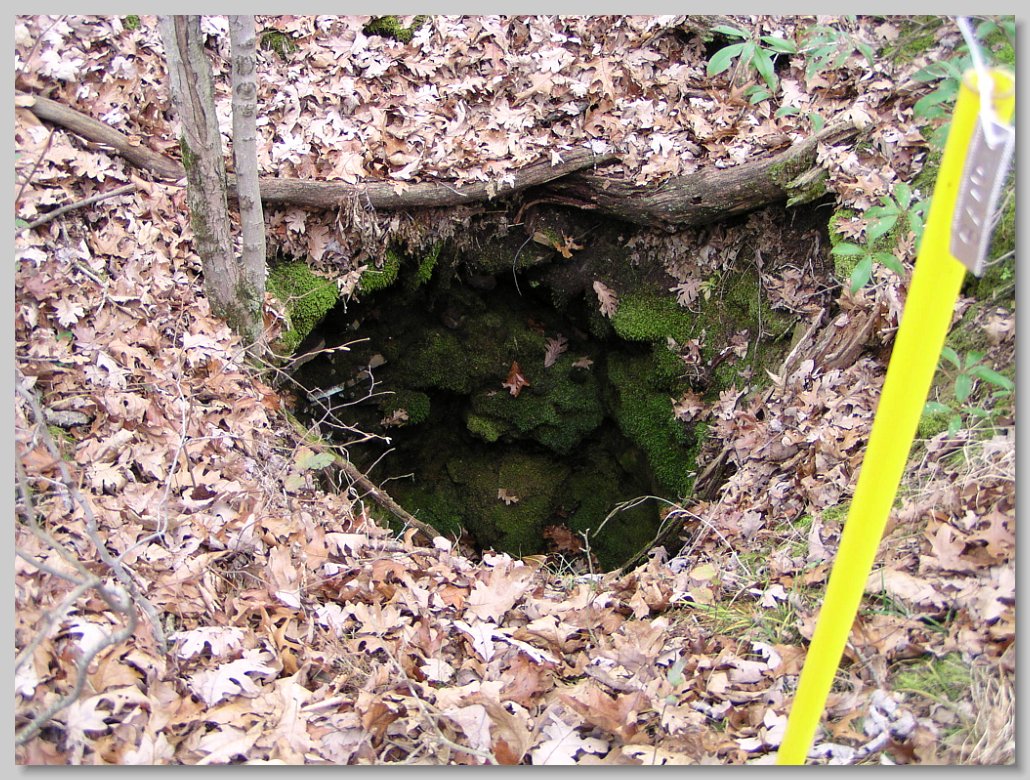
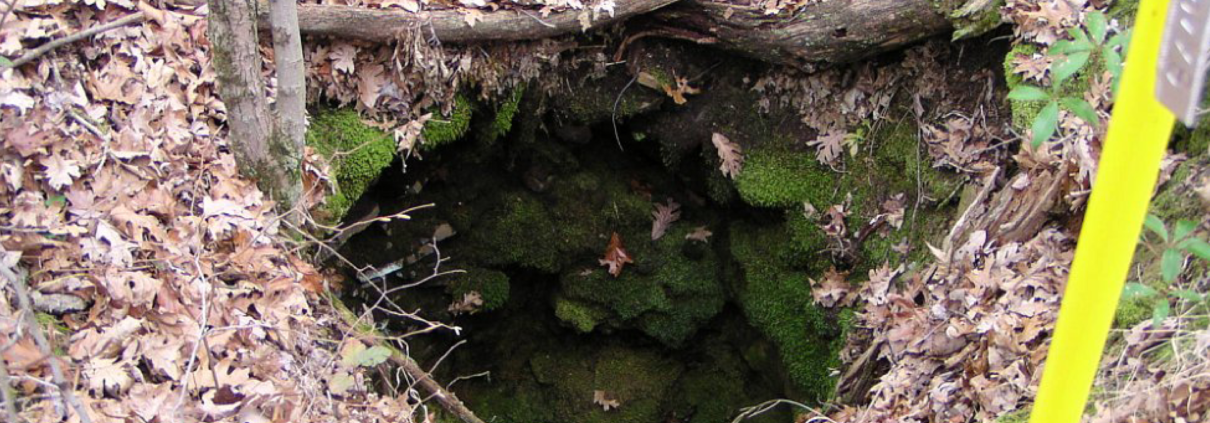
Fig 1. A Collapsed Well Opening – A Physical Hazard (photo credit: Friends of Oil Creek State Park)
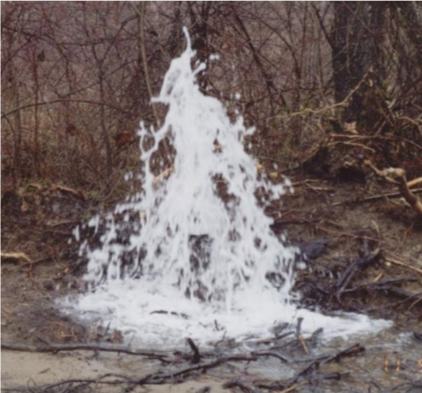
Fig. 2. Well Spouting Acid Water. Well later plugged by DEP (photo credit: Friends of Oil Creek State Park)
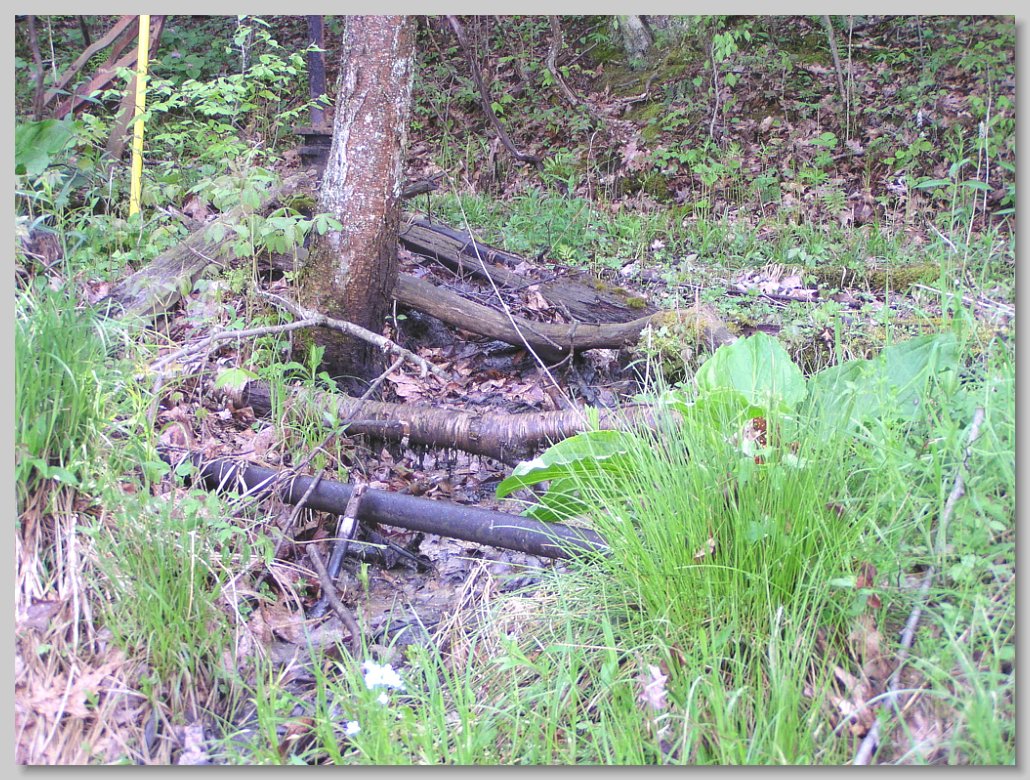
Fig. 3. Oil Seepage (photo credit:(photo credit: Friends of Oil Creek State Park)
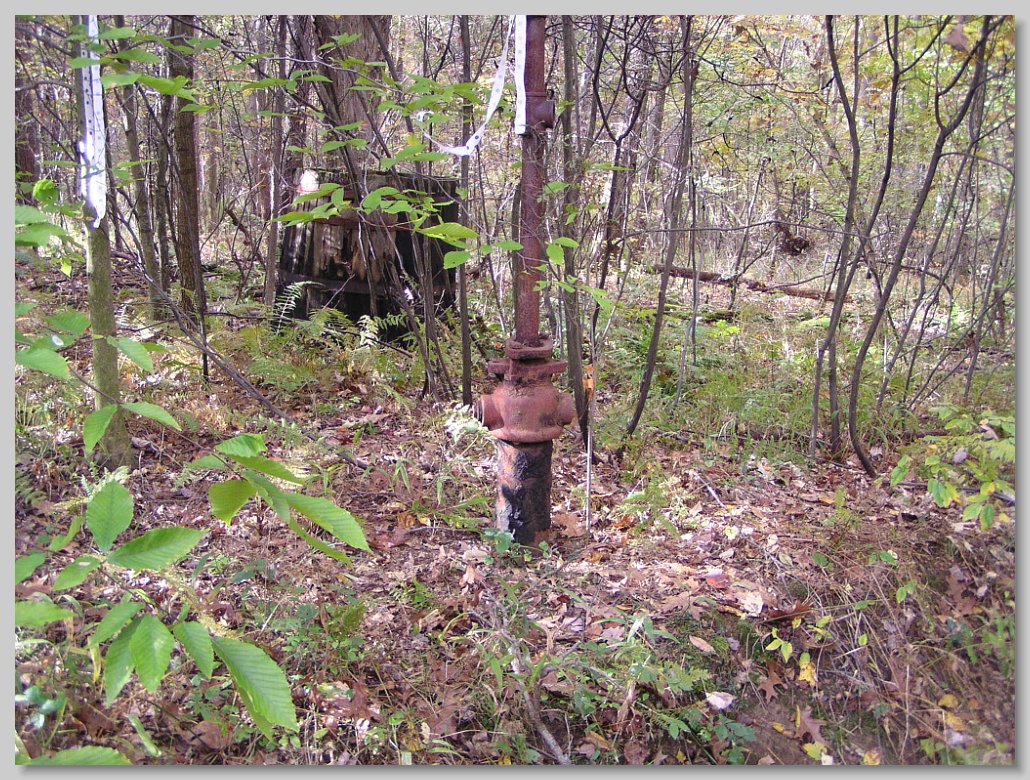
Fig. 4. Abandoned Well and Storage Tank (photo credit: Friends of Oil Creek State Park)
Conclusion
Pennsylvania is facing a mountain of an issue with decades of work ahead. The state must act quickly to ensure the health and protection of our people and our environment, which entails taking active steps to secure an adequate budget to resolve this issue. To start, the state should identify where all of the wells are, set up a financial plan that puts the cost of the plugging process for these wells back onto the oil and gas companies, and begin to take active measures to plug the wells quickly and efficiently.