How close are schools and hospitals to drilling activity in West Virginia and Ohio?
A review of WV and OH drilling activity and its proximity to schools and medical facilities
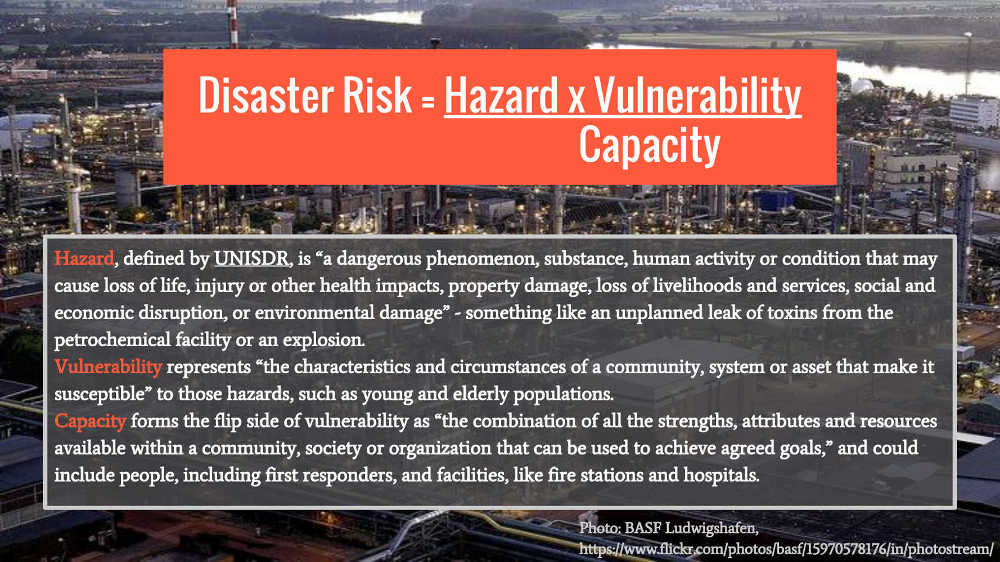
Schools and hospitals represent places where vulnerable populations may be put at risk if they are located close to oil and gas activity. Piggybacking on some elegant work from PennEnvironment (2013) and Physicians, Scientists, and Engineers (PSE) Healthy Energy (PDF) in Pennsylvania, below is an in-depth look at the proximity of unconventional oil and gas (O&G) activity to schools and hospitals in Ohio and West Virginia.
Ohio Schools and Medical Facilities
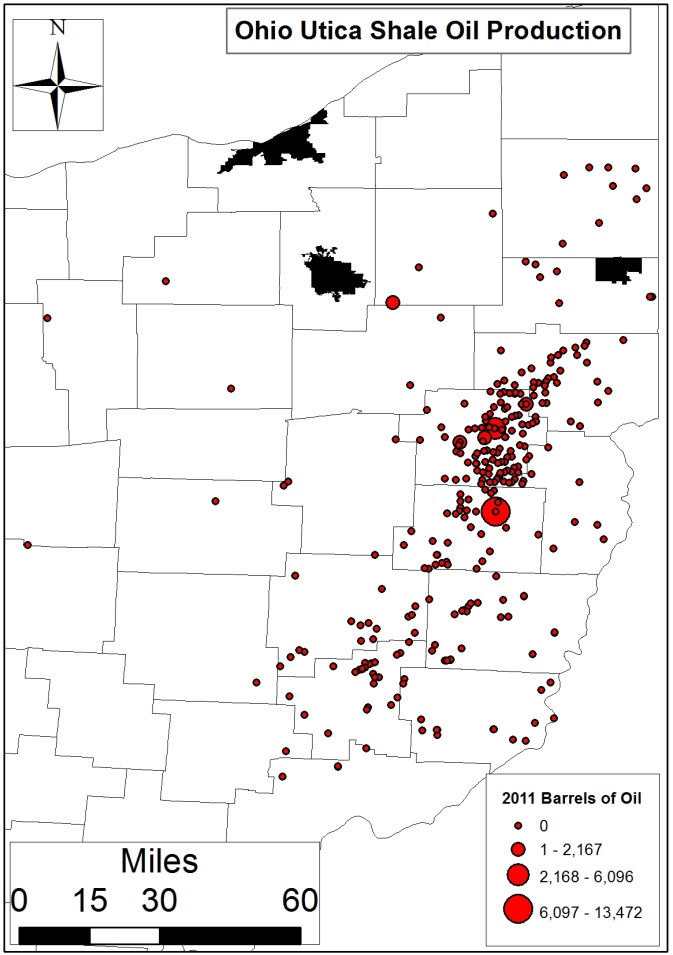
In Ohio, presently there are 13 schools or medical facilities within a half-mile of a Utica and/or Class II injection well and an additional 344 within 2 miles (Table 1 and map below). This number increases to 1,221 schools or medical facilities when you consider those within four miles of O&G related activity.
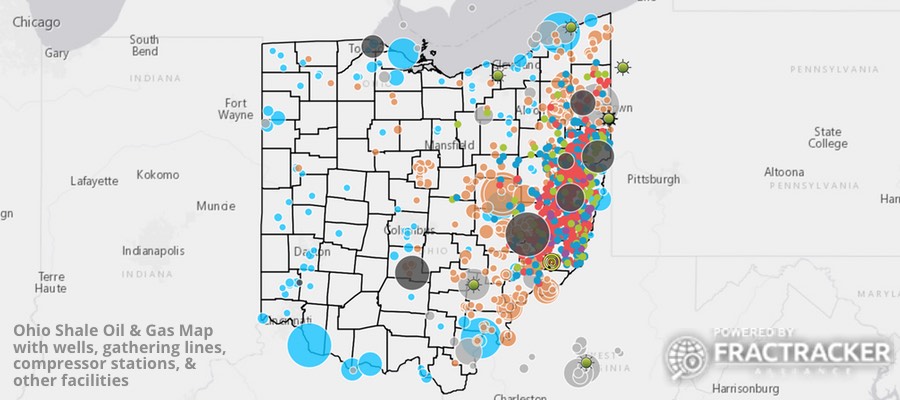
Map of OH Drilling and Disposal Activity Near Schools, Medical Facilities
View map fullscreen | How FracTracker maps work
Explore the data used to make this map in the “Data Downloads” section at the end of this article.
Table 1. Number of OH schools and hospitals within certain distances from Utica wells
| Utica | Class II Injection | |||
| Well Distance (Miles) | Schools | Medical Facilities | Schools | Medical Facilities |
| 0.5 | 3 | 1 | 9 | 0 |
| 0.5-1 | 19 (22) | 9 (10) | 16 (25) | 13 (13) |
| 1-2 | 79 (101) | 41 (51) | 88 (113) | 79 (92) |
| 2-3 | 84 (185) | 49 (100) | 165 (278) | 122 (214) |
| 3-4 | 85 (270) | 79 (179) | 168 (446) | 112 (326) |
| 4-5 | 92 (362) | 63 (242) | 196 (642) | 166 (492) |
| 5-10 | 388 (750) | 338 (580) | 796 (1,438) | 584 (1,076) |
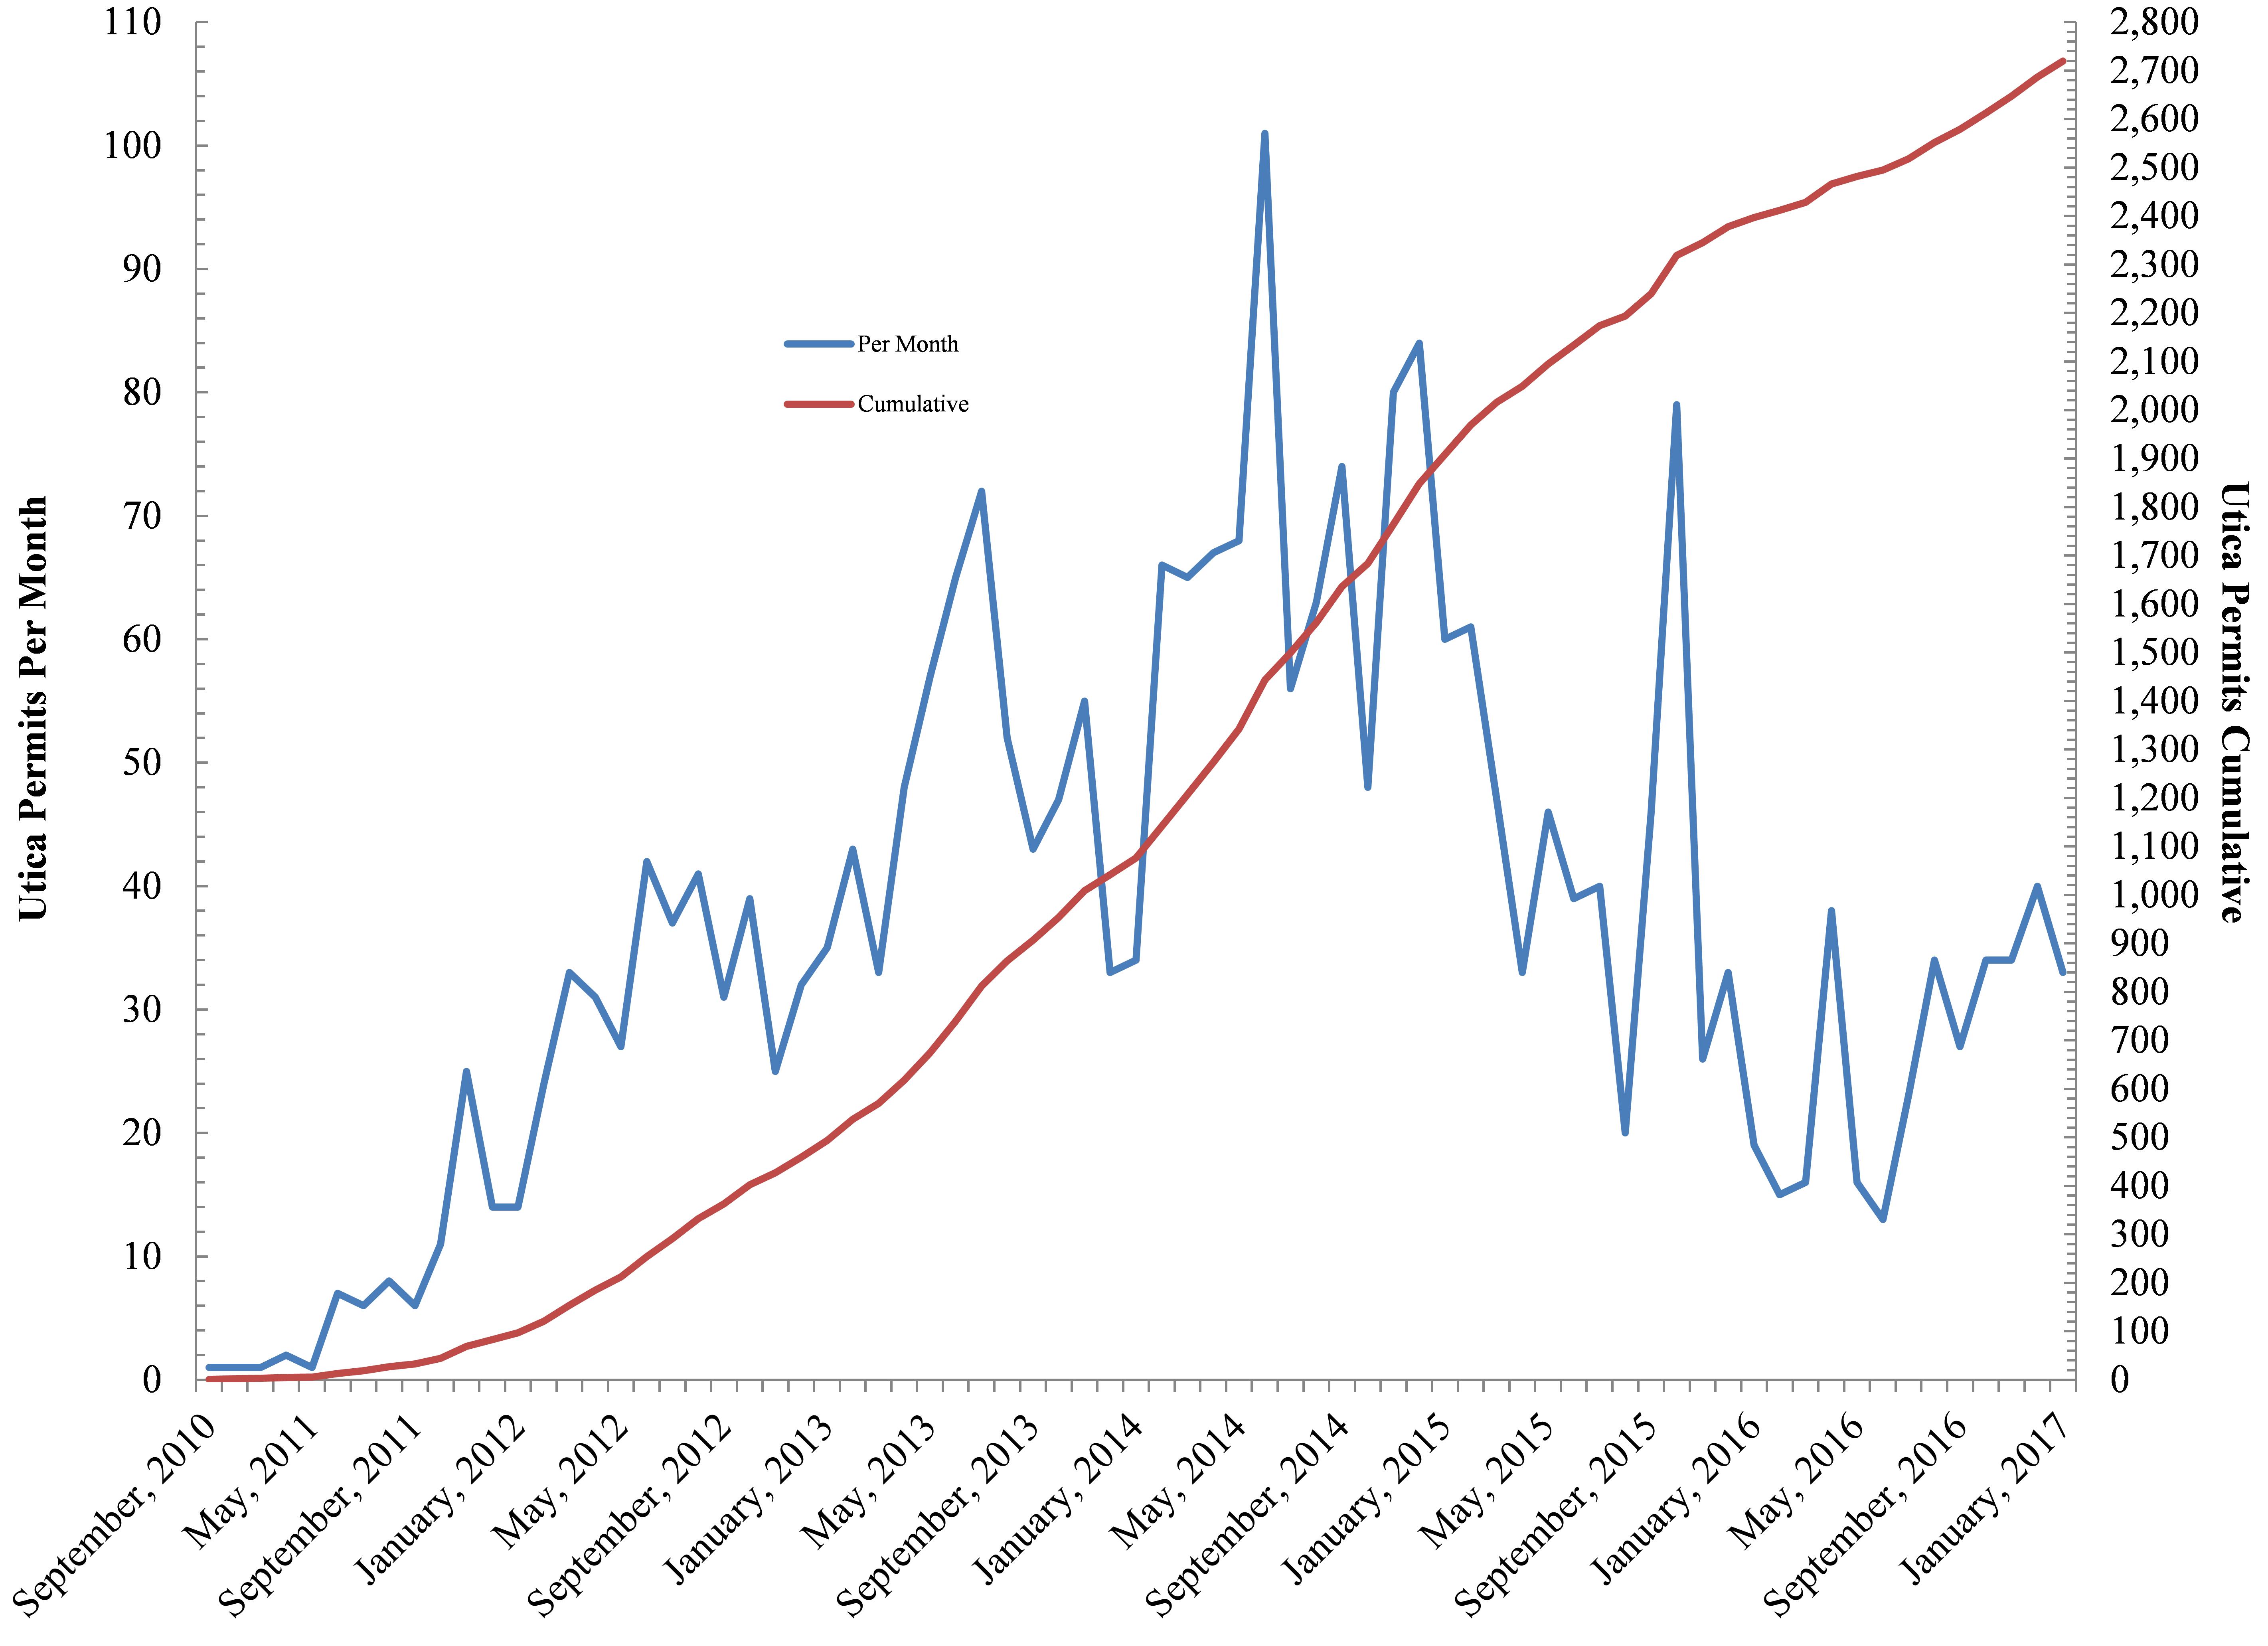
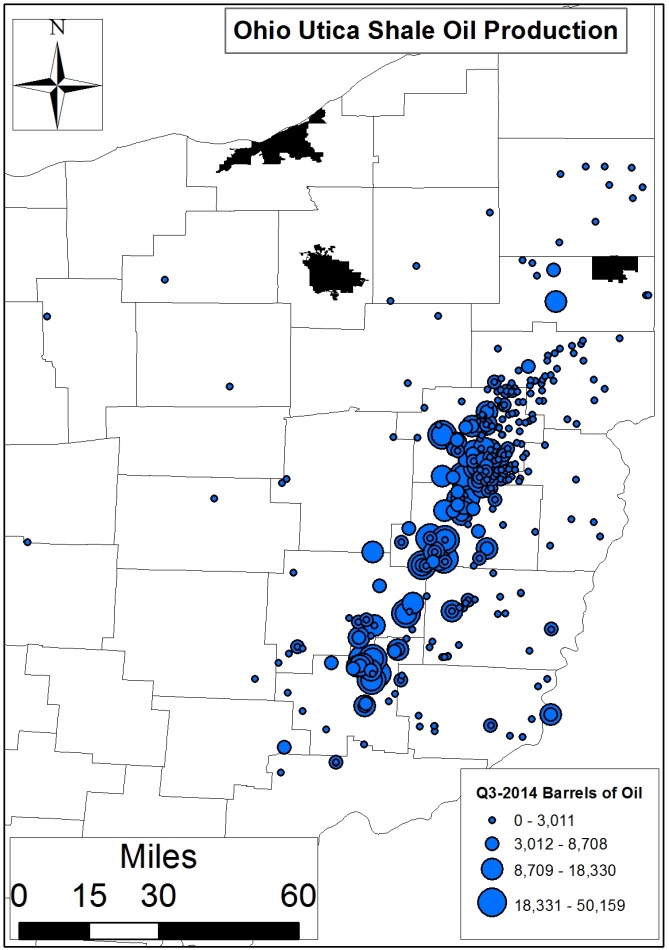
Ohio’s rate of Utica lateral permitting has jumped from an average of 39 per month all-time to 66 per month in the last year. OH’s drilling activity has also begun to spread to outlying counties[1]. As such, we thought a proactive analysis should include a broader geographic area, which is why we quantified the number of schools and medical facilities within 5 and 10 miles of Utica and Class II activity (Figures 1 and 2). To this end we found that ≥50% of Ohio’s schools, both public and private, are within 10 miles of this industry. Similarly 50% of the state’s medical facilities are within 10 miles of Utica permits or Class II wells.
Footnote 1: Eleven counties in Ohio are currently home to >10 Utica permits, while 23 are home to at least 1 Utica permit.

Figures 1, 2a, 2b (above). Click to expand.
Grade Level Comparisons
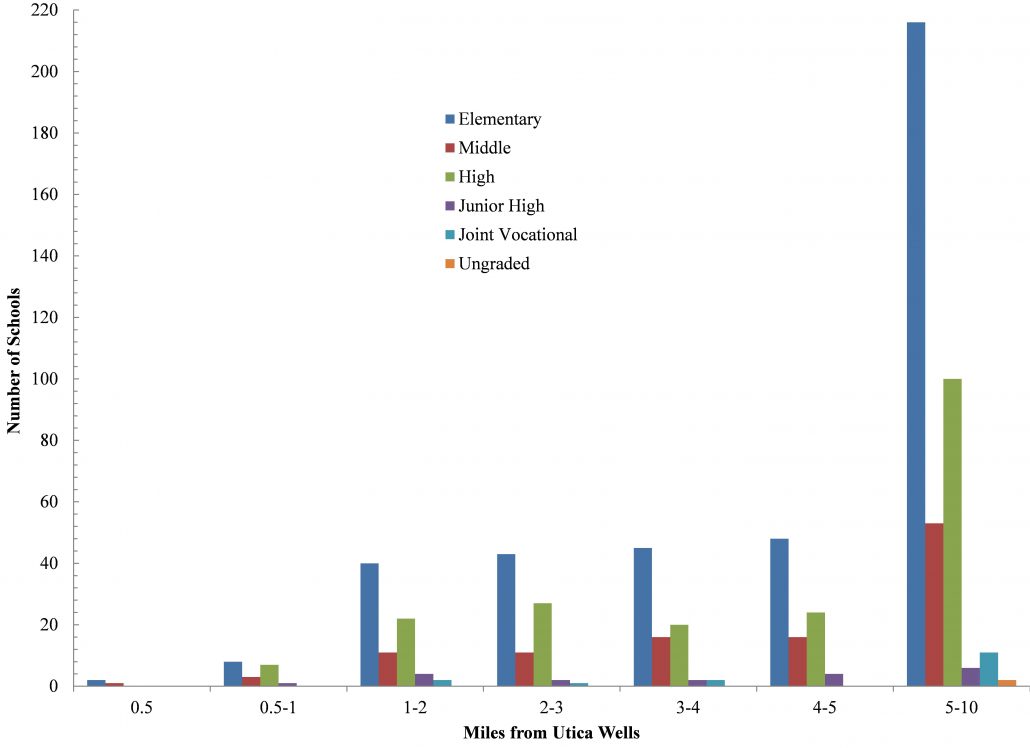
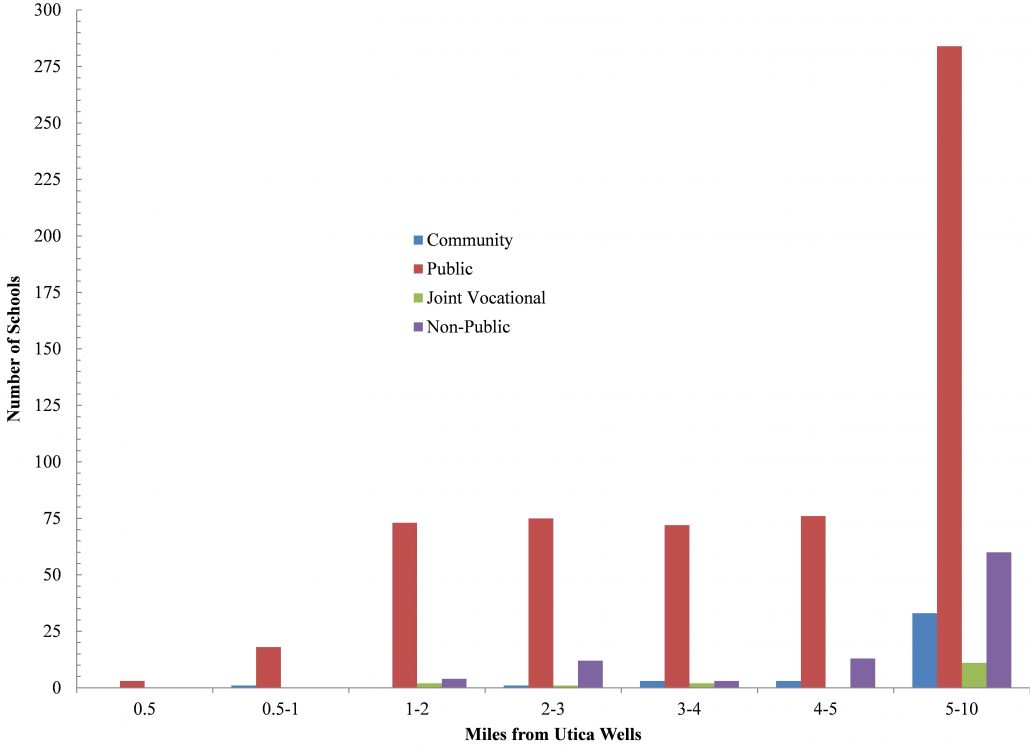
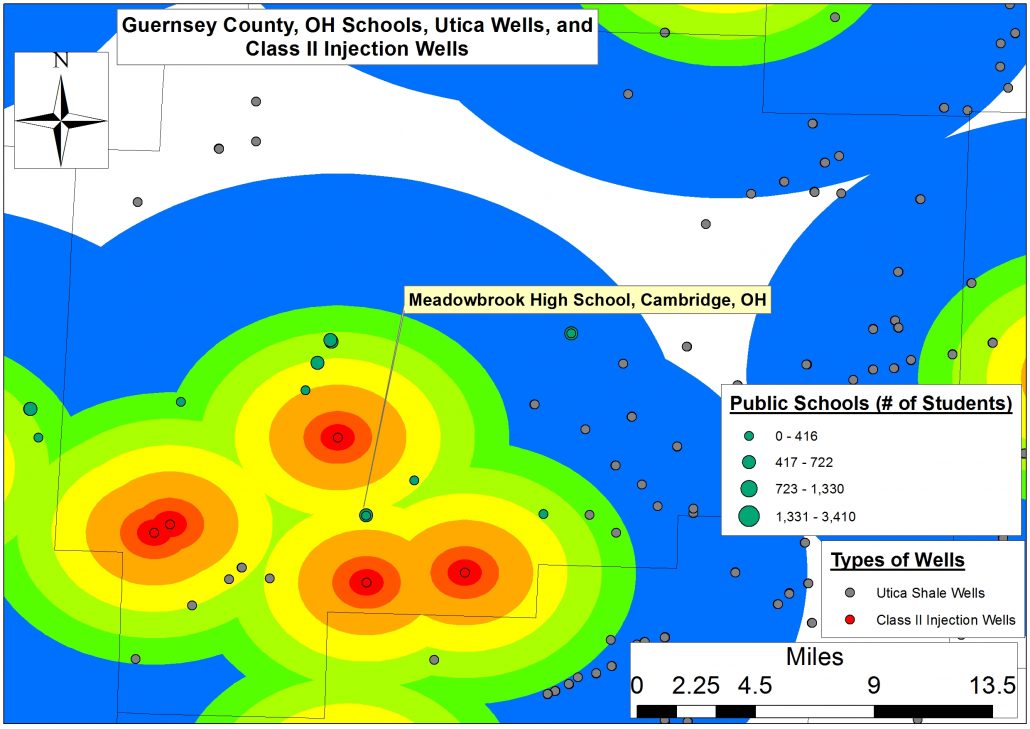
With respect to grade level, the majority of the schools in question are elementary schools, with 40-50 elementary schools within 2-5 miles of Ohio Utica wells. This number spikes to 216 elementary schools within ten miles of Utica permits along with an additional 153 middle or high Schools (Figure 3). Naturally, public schools constitute most of the aforementioned schools; there are approximately 75 within five miles of Utica permits and 284 within ten miles of Utica activity (Figure 4).
Figures 3 and 4 (above). Click to expand.
Public Schools in Ohio
We also found that ~4% of Ohio’s public school students attend a school within 2 miles of the state’s Utica and/or Class II Injection wells (i.e., 76,955 students) (Table 2). An additional 315,362 students or 16% of the total public school student population, live within five miles of O&G activity.
Table 2. Number of students in OH’s public schools within certain distances from Utica and Class II Injection wells
| Utica | Class II Injection | |||||
| Well Distance (Miles) | # Schools | # Students | Avg | # Schools | # Students | Avg |
| 0.5 | 3 | 1,360 | 453 | 7 | 3,312 | 473 |
| <1 | 21 | 7,910 | 377 | 19 | 7,984 | 420 |
| <2 | 96 | 35,390 | 376 | 90 | 41,565 | 462 |
| <3 | 169 | 67,713 | 401 | 215 | 104,752 | 487 |
| <4 | 241 | 97,448 | 404 | 350 | 176,067 | 503 |
| <5 | 317 | 137,911 | 435 | 505 | 254,406 | 504 |
| <10 | 600 | 280,330 | 467 | 1,126 | 569,343 | 506 |
(Note: Ohio’s population currently stands at 11.59 million people; 2,007,667 total students).
The broadest extent of our study indicates that 42% of Ohio students attend school within ten miles of a Utica or Class II Injection well (Figure 5). As the Ohio Utica region expands from the original 11 county core to include upwards of 23-25 counties, we expect these 5-10 mile zones to be more indicative of the type of student-Utica Shale interaction we can expect to see in the near future.
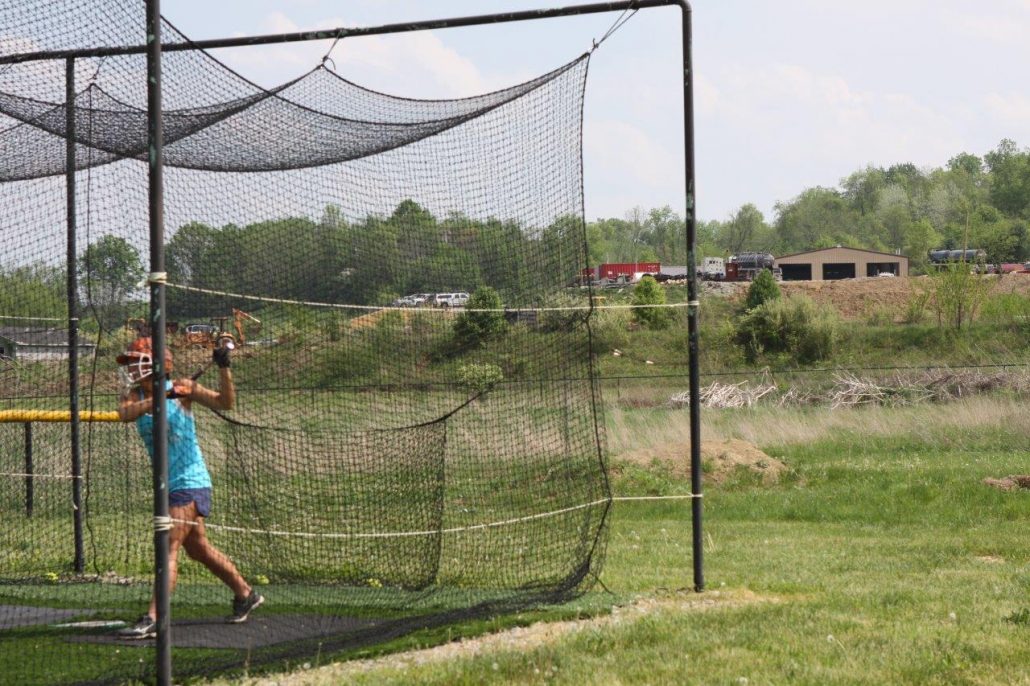
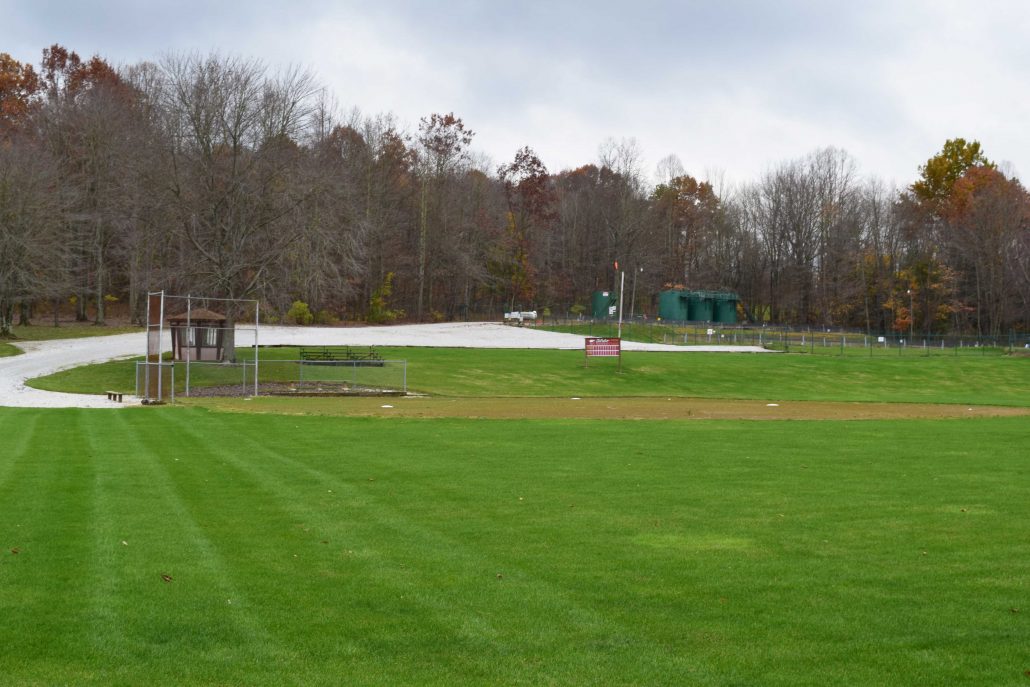
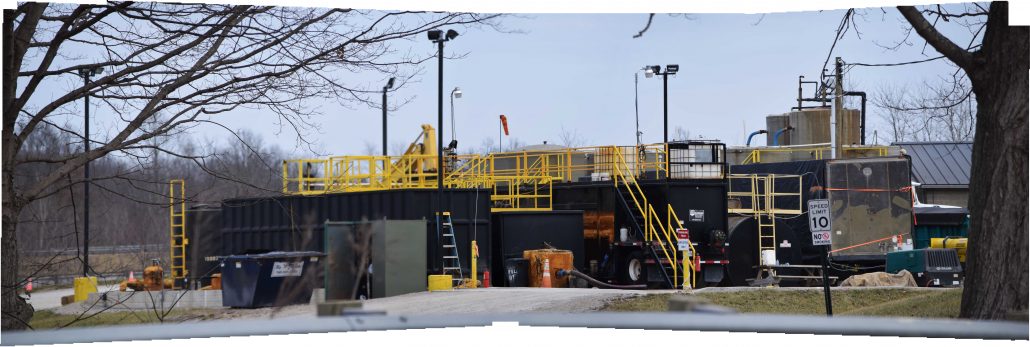
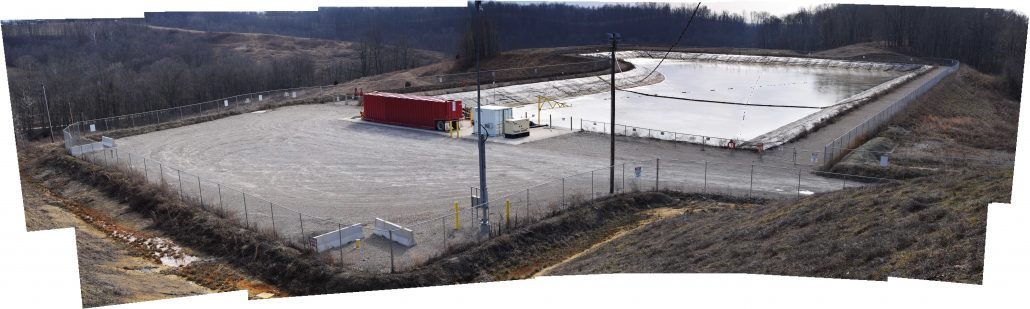
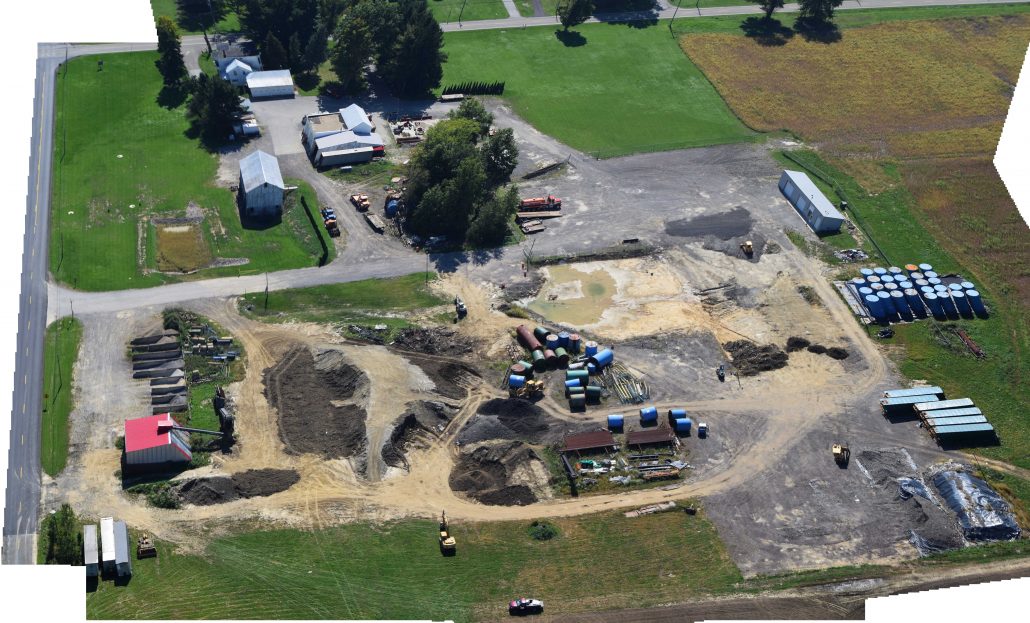
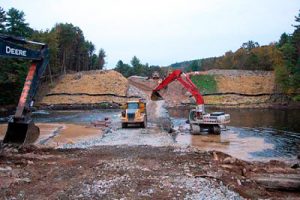
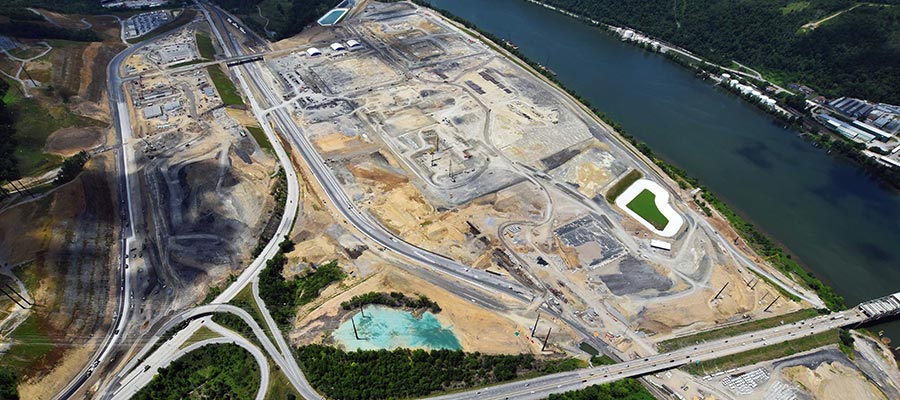
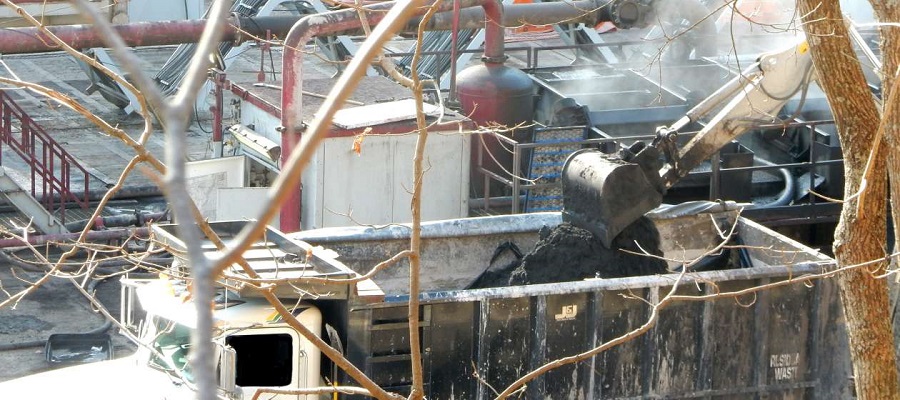
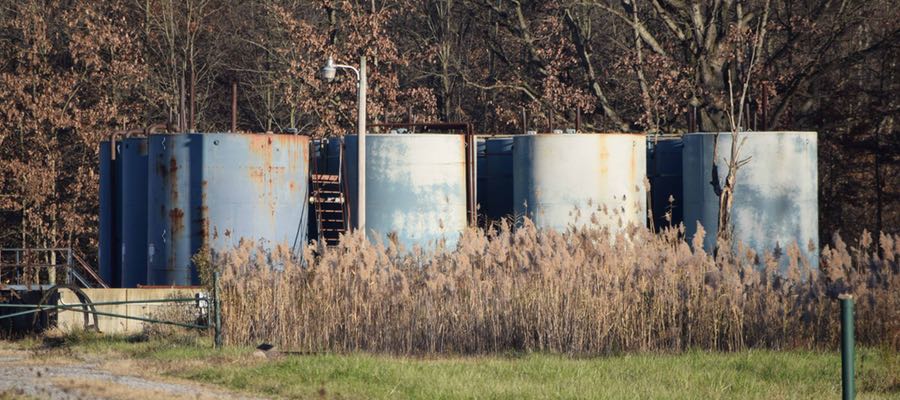
Photos of drilling activity near schools, and Figure 5 (above). Click to expand.
Private Schools in Ohio
At the present time, less than one percent of Ohio’s private school students attend a school within 2 miles of Utica and/or Class II Injection wells (specifically, 208 students). An additional 11,873 students or 11% of the total student population live within five miles. When you broaden the extent, 26% of Ohio’s private primary and secondary school students attend school daily within ten miles of a Utica or Class II Injection well. Additionally, the average size of schools in the immediate vicinity of Utica production and waste activity ranges between 11 and 21 students, while those within 2-10 miles is 112-159 students. Explore Table 3 for more details.
Table 3. Number of students in Ohio’s private schools within certain distances from Utica and Class II Injection.
| Utica | Class II Injection | |||||
| Distance from Well (Miles) | # Schools | # Students | Avg | # Schools | # Students | Avg |
| 0.5 | . | . | . | 1 | . | . |
| <1 | . | . | . | 2 | 25 | 13 |
| <2 | 2 | 22 | 11 | 9 | 186 | 21 |
| <3 | 7 | 874 | 125 | 30 | 4,460 | 149 |
| <4 | 12 | 1,912 | 159 | 45 | 6,303 | 140 |
| <5 | 21 | 2,471 | 118 | 61 | 9,610 | 158 |
| <10 | 60 | 6,727 | 112 | 135 | 20,836 | 154 |
West Virginia Schools and Students
Twenty-eight percent (81,979) of West Virginia’s primary and secondary school students travel to a school every day that is within two miles of the state’s Marcellus and/or Class II Injection wells.
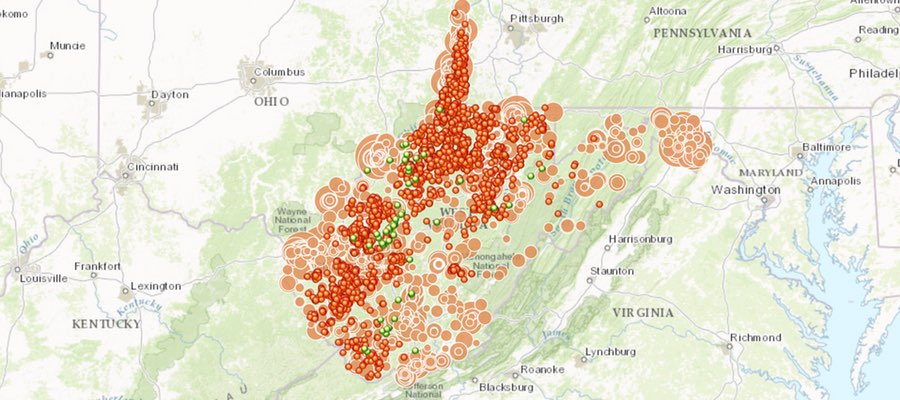
Map of WV Marcellus Activity and Schools
View map fullscreen | How FracTracker maps work
Explore the data used to make this map in the “Data Downloads” section at the end of this article.
Compared with Ohio, 5,024 more WV students live near this industry (Table 4). An additional 97,114 students, or 34% of the West Virginia student population, live within 5 miles of O&G related wells. The broadest extent of our study indicates that more than 90% of West Virginia students attend school daily within 10 miles of a Marcellus and/or Class II Injection well.
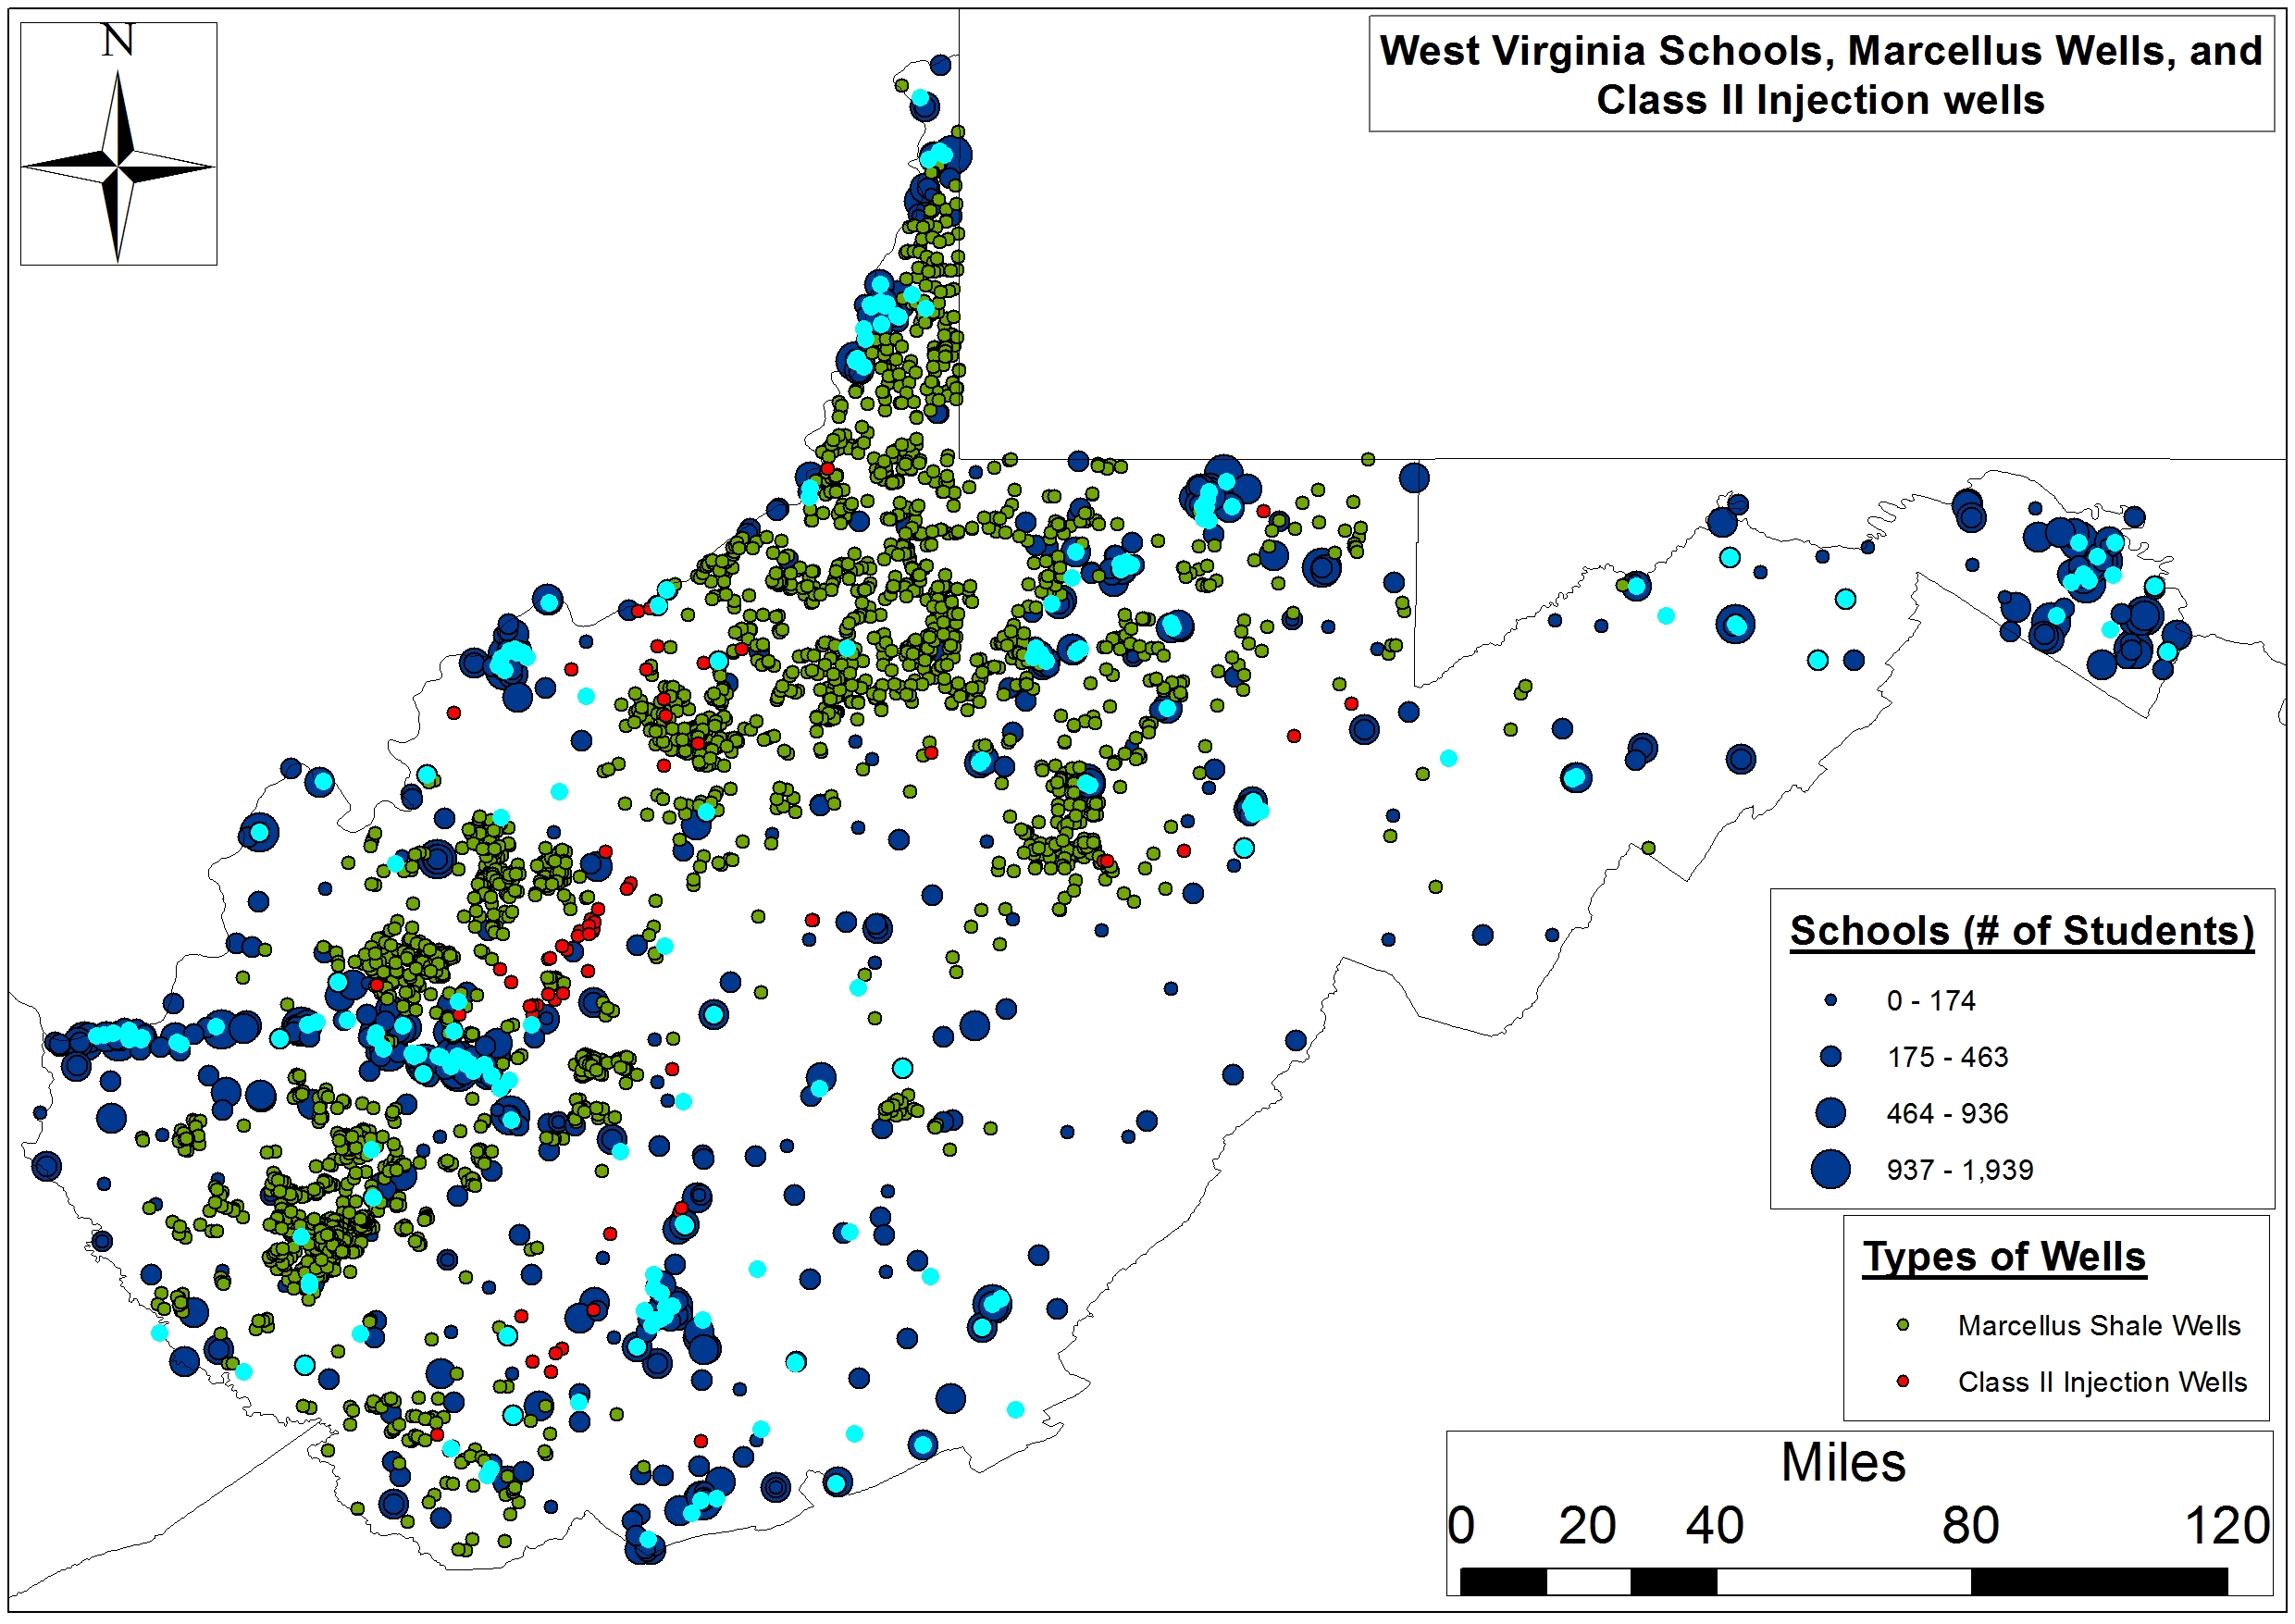
Figure 6. West Virginia primary and secondary schools, Marcellus Shale wells, and Class II Injection wells (Note: Schools that have not reported enrollment figures to the WV Department of Education are highlighted in blue). Click image to expand.
It is worth noting that 248 private schools of 959 total schools do not report attendance to the West Virginia Department of Education, which means there are potentially an additional 69-77,000 students in private/parochial or vocational technology institutions unaccounted for in this analysis (Figure 6). Finally, we were not able to perform an analysis of West Virginia’s medical facility inventory relative to Marcellus activity because the West Virginia Department of Health and Human Resources admittedly did not have an analogous, or remotely complete, list of their facilities. The WV DHHR was only able to provide a list of Medicaid providers and the only list we were able to find was not verifiable and was limited to hospitals only.
Table 4. Number of students in WV schools within certain distances from Shale and Class II Injection wells
| Marcellus | Class II Injection | |||||
| Distance from Well (Miles) | # | Sum | Avg | # | Sum | Avg |
| 0.5 | 19 | 5,674 | 299 | 1 | . | . |
| <1 | 52 (71) | 16,992 (22,666) | 319 | 5 (6) | 1,544 | 257 |
| <2 | 169 (240) | 52,737 (75,403) | 314 | 16 (22) | 5,032 (6,576) | 299 |
| <3 | 133 (373) | 36,112 (111,515) | 299 | 18 (40) | 6,132 (12,708) | 318 |
| <4 | 88 (461) | 25,037 (136,552) | 296 | 21 (61) | 5,235 (17,943) | 294 |
| <5 | 56 (517) | 15,685 (152,237) | 295 | 26 (87) | 8,913 (26,856) | 309 |
| <10 | 118 (635) | 37,131 (189,368) | 298 | 228 (315) | 69,339 (96,195) | 305 |
| Note: West Virginia population currently stands at 1.85 million people; 289,700 total students with 248 private schools of 959 total schools not reporting attendance, which means there are likely an additional 69-77,000 students in Private/Parochial or Vocational Technology institutions unaccounted for in this analysis. | ||||||
Conclusion
A Trump White House will likely mean an expansion of unconventional oil and gas activity and concomitant changes in fracking waste production, transport, and disposal. As such, it seems likely that more complex and broad issues related to watershed security and/or resilience, as well as related environmental concerns, will be disproportionately forced on Central Appalachian communities throughout Ohio and West Virginia.
Will young and vulnerable populations be monitored, protected, and educated or will a Pruitt-lead EPA pursue more laissez-faire tactics with respect to environmental monitoring? Stay Tuned!
Analysis Methods
The radii we used to conduct this assessment ranged between ≤ 0.5 and 5-10 miles from a Utica or Marcellus lateral. This range is larger than the aforementioned studies. The point of using larger radii was to attempt to determine how many schools and students, as well as medical facilities, may find themselves in a more concentrated shale activity zone due to increased permitting. Another important, related issue is the fact that shale O&G exploration is proving to be more diffuse, with the industry exploring the fringes of the Utica and Marcellus shale plays. An additional difference between our analysis and that of PennEnvironment and PSE Healthy Energy is that we looked at identical radii around each state’s Class II Injection well inventory. We included these wells given the safety concerns regarding:
- their role in induced seismicity,
- potential water and air quality issues, and
- concomitant increases in truck volumes and speeds.
Data Downloads for Maps Above
By Ted Auch, Great Lakes Program Coordinator, FracTracker Alliance
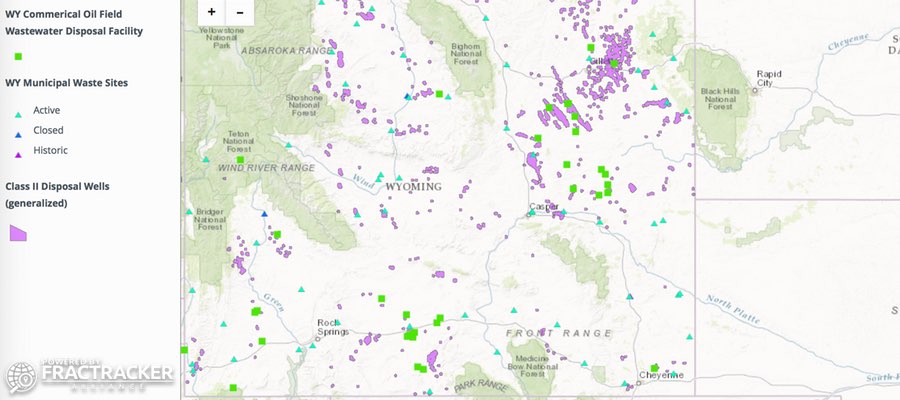


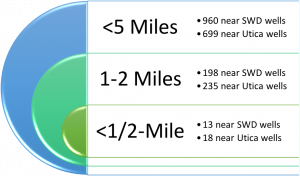 Just how close are public water supplies to Class II waste disposal wells and permitted Utica wells? As of January 15, 2017, there are 13 PWS’s within a half-mile of Ohio’s Class II SWD wells, and 18 within a half-mile of permitted Utica wells. These facilities serve approximately 2,000 Ohioans each, with an average of 112-153 people per PWS (Tables 1 and 5). Within one mile from these wells there are 64 to 66 PWSs serving 18 to 61 thousand Ohioans. That’s an average of 285-925 residents.