Air Pollution in the Bay Area’s Refinery Corridor
Emissions from Refineries and other Sources
By
Kyle Ferrar, Western Program Coordinator &
Kirk Jalbert, Manager of Community Based Research & Engagement
Key Takeaways
- Refineries and petrochemical industry in the Bay Area’s refinery corridor are responsible for the majority of the risk-driving point source emissions in this region.
- The Chevron Richmond refinery has the largest refining capacity and emits the most hazardous air pollutants (HAPs).
- The Tesoro refinery in Martinez and the Shell refinery in Martinez emit the most HAPs per barrel of oil (based on refining capacity).
- The Valero refinery in Benicia, the Tesoro refinery in Martinez, and the Shell refinery in Martinez emit the most criteria air pollutants (CAPs).
- If refineries increase their capacity and process more crude, the emissions of these various pollutants will invariably increase.
- New emissions rules need to prioritize ambient air quality and hold the Air District and elected officials accountable for policies that increase risk.
Overview of the Bay Area’s Refinery Corridor
The Bay Area Air Quality Management District is revising the rules for facilities that emit a variety of hazardous pollutants into the air. The current draft of the new rules could actually increase the amount polluters are allowed to emit. The communities at risk are speaking out to support policies that would reduce the amount of air pollutants rather than increase the limits. In support of these communities, the FracTracker Alliance has focused on analyzing the sources of air pollutants in the region. The East Bay Oil Refinery Corridor is located along the North Shore of the East Bay, stretching from Richmond, CA east to Antioch, CA. The region has been named a “sacrifice zone” for the heavy concentration of petrochemical industrial sites. In addition to the five refineries along the north coast, these communities host a variety of other heavy industries and waste sites. The locations of these facilities have been mapped previously by the FracTracker Alliance, here. In the report we found that people of color, specifically African Americans, are disproportionately represented in the community demographics. Novel results indicate that Hispanic students may be disproportionately impacted by the presence of the petrochemical industry. In this post, we continue the analysis of risk in the region by providing an analysis of the contributions to air pollution from these facilities.
Regulations
Refineries and other sources of air pollution are regulated by the U.S. EPA’s Clean Air Act (CAA). The CAA regulates two classes of pollutants:
- Criteria air pollutants (CAPs) – including sulfur dioxide, oxides of nitrogen, carbon monoxide, and particulate matter; and
- Hazardous air pollutants (HAPs), which includes a list of 594 carcinogenic and non-carcinogenic chemicals that pose a risk to those exposed.
In addition, California regulates green-house-gas (GHG) emissions, and refineries are the second largest industrial source of GHGs. These regulations get applied when facilities need to obtain a permit for a new source of air pollution, or if a facility is making a structural change that could significantly affect emissions. Facilities are required to use “Maximum Available Control Technology” as it relates to industry best practices to control emissions. With these existing engineering controls, refinery emissions are released into the air from the multiple sources/processes shown below in Figure 1. Notice that a large amount of emissions are simply from “Leaks.”
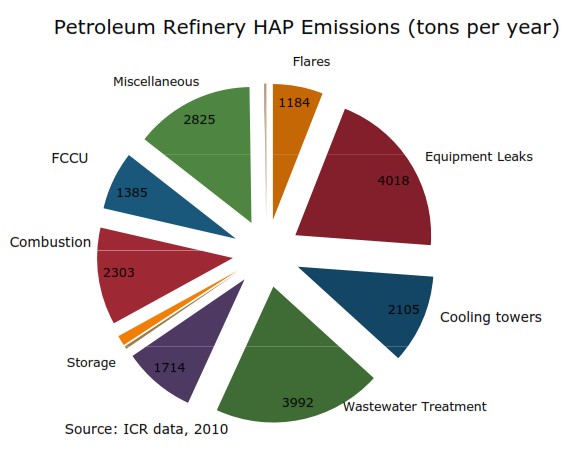
Figure 1. Breakdown of emissions from petroleum refineries (US EPA, 2011)
The new rules drafted by the BAAQMD to regulate emissions from the East Bay Oil Refinery Corridor would not cap emissions at any level. The current proposal outlines limits on emissions per barrel, promoting efficiency rather than focusing on emissions reductions. Air quality in the refinery corridor could be improved only if this approach was proposed in conjunction with emission limits or reductions. But as the currently proposed rules stand, emissions could actually increase. Enforcement procedures for infractions are also limited. If a refinery’s emissions violate the per barrel standards, the refinery has a whole 3 years to address the violation. Also, these new rules come at a time when refineries are moving to increase the volume of crude coming in from other regions, such as Canada’s tar sands and the Bakken Shale. These regions produce much lower “quality” crude oil, with much higher emissions. This all amounts to more air pollution rather than less.
Community and environmental activist groups such as the Communities for a Better Environment (CBE) and the Bay Area Refinery Corridor Coalition have raised specific issues with the proposed rules as they stand. First, they allow for increase emissions when Air District data forecasts increasing refinery emissions, despite declining local and domestic fuels demand. Refining the lower quality crude is more energy intensive, which also results in increased emissions. In order to offset the increased emissions, CBE reports that refineries can just increase total refining production to decrease per barrel averages. This would in affect increase emissions to meet regulatory requirements. In addition, transporting the crude via new shipping routes would put additional communities at elevated risk of railway accidents (CBE, 2015).
Ambient Air Quality
Air quality in the Bay Area has been continuously improving over the last few decades, but these refinery communities are still at a significantly higher risk of dying from heart disease and strokes. The largest disparity is felt by the African-American populations. Data for Richmond, CA shows they are 1.5 times more likely to die from these diseases than the Contra Costa county average (Casanova, Diemoz, Lifshay, McKetney, 2010). Emissions reductions not only favor the local communities such as the refinery corridor that are most impacted, but also all of the downwind communities, specifically the Central Valley. The Air District’s 2012 report of PM provides a summary of these trends. PM is an important because it is “the air pollutant that causes by far the greatest harm to public health in the bay area. It is a useful indices because there is a linear correlation between increasing ambient concentrations and mortality. Figure 2 shows the progress the Bay Area has made, overall. This graph is based on regional monitors and not those in the refinery communities, where improvements have not been as drastic. In Figure 3 below, the graph shows major pollutant drivers of seven health risks and how health impacts have been reduced over this time period. What we see from the bar graph, is that non-diesel anthropogenic point sources of PM contribute the most to risk for the majority of health endpoints considered. Across the entire bay area, refineries account for 6% of all PM (BAAQMD, 2012).
An overview of other chemicals associated with the petrochemical industry in ambient air and their resulting health effects are outlined in tables 1-3 below. This is by no means a comprehensive list, but these are chemicals of primary concern, specific to petroleum refinery emissions, and are known risk drivers for the region.
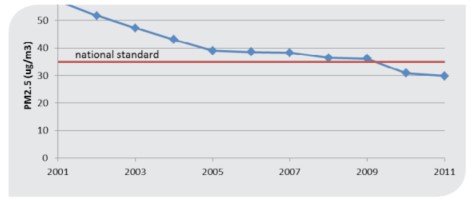
Figure 2. Measurements of PM, averaged across the entire bay area, over time – showing an overall improvement in air quality.
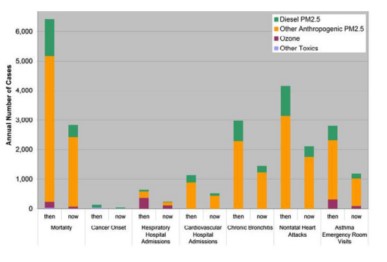
Figure 3. Contribution of different species of air pollution to health impacts. The analysis is specific to the bay area and compares health risks estimates from the past (1980s) to estimates in 2012.
Table 1. Health impacts from criteria air pollutants
| Criteria Air Pollutants | |
| Compound | Health Effect |
| Sulfur Dioxide (SO2) and Oxides of Nitrogen (NOx) | Array of adverse respiratory effects, airway inflammation in healthy people, increased respiratory symptoms in people with asthma |
| Carbon Monoxide (CO) | Harmful health effects associated with the reduction of oxygen delivery to the body’s organs (heart and brain) and tissues |
| Particulate Matter | Increased respiratory symptoms, irritation of the airways, coughing, or difficulty breathing, decreased lung function; aggravated asthma; development of chronic bronchitis; irregular heartbeat; nonfatal heart attacks; and premature death in people with heart or lung disease |
Table 2. Health impacts from hazardous air pollutants known to be emitted from petroleum refineries
| Hazardous Air Pollutants | ||
| Compound | Acute | Chronic |
| Benzene, Toluene, Ethylbenzene, Xylenes | Neurological effects, Irritation of the eye, skin and respiratory tract | Blood disorders (reduced number of red blood cells and aplastic anemia), cancer. |
| 1,3-Butadiene | Irritation of the eyes, throat and respiratory tract | Cardiovascular effects, leukemia, cancer |
| Naphthalene | Hemolytic anemia, damage to the liver, neurological effects | Cataracts, damage to the retina, hemolytic anemia, cancer |
| PAHs | Skin disorders, depression of the immune system | Skin disorders (dermatitis, photosensitization), depression of the immune system, damage to the respiratory tract, cataracts, cancer |
Table 3. Health impacts from other pollutants emitted from petroleum refineries
| Other Pollutants | ||
| Compound | Mechanism | Health Effect |
| Volatile Organic Compounds (VOC) | Combine with NOx in sunlight to create ozone | Significantly reduce lung function and induce respiratory inflammation in normal. Healthy people during periods of moderate exercise, symptoms include chest pain, coughing, nausea, and pulmonary congestion |
| Greenhouse Gases (GHG), including Methane (CH4), Carbon Dioxide (CO2), Nitrous Oxide (N2O) | Compounds with high global warming potential contribute to climate change | Increase in average temperatures, higher levels of ground-level ozone, increased drought, harm to water resources, ecosystems and wildlife, health risk to sensitive populations |
North Coast Emissions
With these gains in ambient air quality it is hard to fathom why regulators would consider allowing refineries to increase emissions inventories. For this analysis, the focus was to map and compare emissions inventories from numerous industrial sites, with a particular focus on the petroleum refineries.
Current refinery capacities as of 2014 are shown in Figure 4, below. The Richmond Chevron has the largest refining capacity in the region, by far. Refining capacity is the maximum amount of crude oil the refinery is allowed to refine, according to their permit. Refining capacity numbers are used in place of actual refined crude volumes for this analysis, because actual crude volumes are considered proprietary information and are not published by the California Energy Commission (CEC).
The Richmond refinery has a raw crude (atmospheric crude is the technical term) refinement capacity over twice as large as the Phillips 66 San Francisco Refinery, and almost 40% larger than the Tesoro (Golden Eagle) refinery, which is the second largest in the region. According to the newly proposed rules, this would allow the Richmond refinery to emit the most pollutants.
The raw total emissions data is shown in Figure 5. The Phillips 66 refinery in Rodeo contributes the least to ambient air quality degradation. The Chevron Richmond refinery processes 40 – 100% more than the four other refineries, and emits 10 – 570% more than the other refiners. This large difference in capacity and emissions means that Chevron Richmond is more efficient than some, but much less efficient than others. To understand the efficiency differences between the refineries, the total HAPs emissions were adjusted by the refining capacity, shown below in Figure 6. With this data we can rank the refining efficiency specifically for HAPs emissions, based on facility capacity. The Tesoro refinery in Martinez and the Shell refinery in Martinez emit the most HAPs per barrel oil (based on refining capacity). From highest emitter to lowest emitter per barrel of crude, the facilities can be ranked:
- Tesoro Refining & Marketing Co LLC (Golden Eagle Refinery in Martinez)
- Shell Oil Products (Martinez Refinery)
- Chevron Products Co Richmond Refinery
- Valero Refining Co – California Benicia Refinery
- Phillips 66 San Francisco Refinery (Rodeo Refinery)
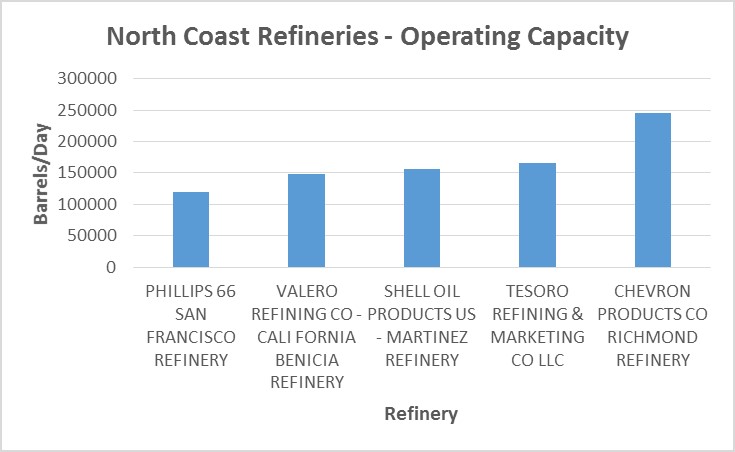
Figure 4. Operating capacity of refineries. The bars show the maximum amount of crude the refineries are allowed to process daily, in barrels (1 barrel = 42 gallons).
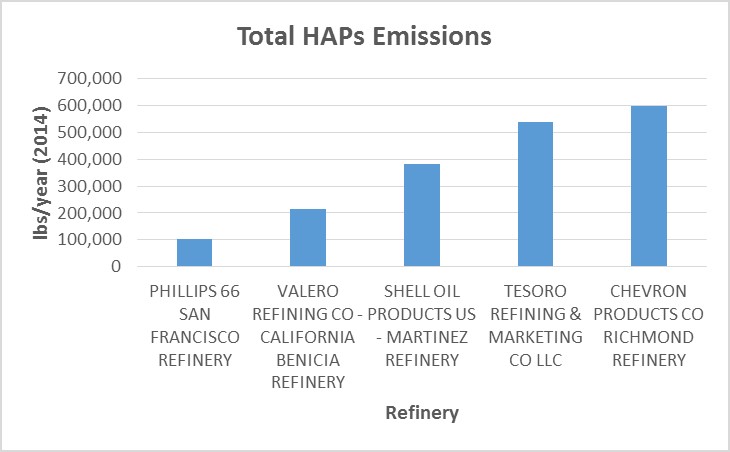
Figure 5. Total amount of HAPs emissions from East Bay refineries
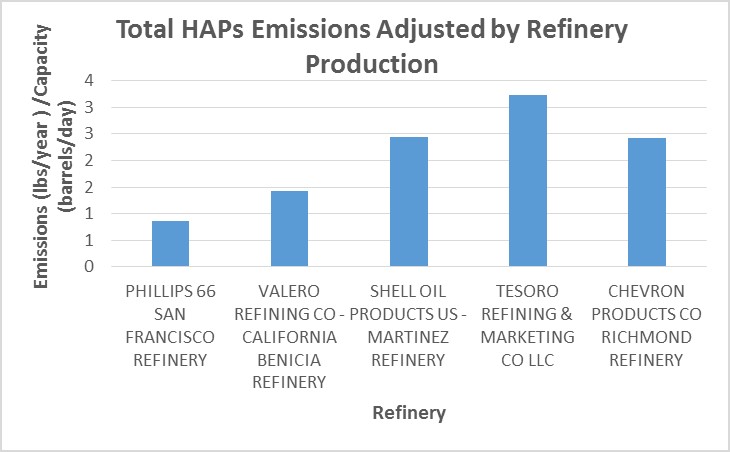
Figure 6. Relative HAPs emitted from each refinery adjusted by the crude capacity
These refineries along with the other industrial sites in the region have been mapped below in Figure 7. The data has been displayed to show the HAPs emissions from these facilities. The amounts of emissions are shown with graduated circles. The larger the circle, the higher the emissions. The cumulative summation of HAPs is a good value for comparing between facilities with diverse emission inventories (the list of all species of emitted pollutants), but different HAP chemicals have very different effects, both in magnitude and in health impacts. Different chemicals will affect different body systems, as described above in Tables 1-3 above. We have therefore incorporated individual chemical data into the map as well (Figure 7, below). The data displayed shows the total sum of HAPs emitted (in lbs/year) from petrochemical industrial facilities in the region. Explore the map to see emission sources for a selection of important pollutants. Smaller industrial sites/sources have been left out of the map.
Figure 7. Map of the East Bay’s Refinery Corridor with emissions data
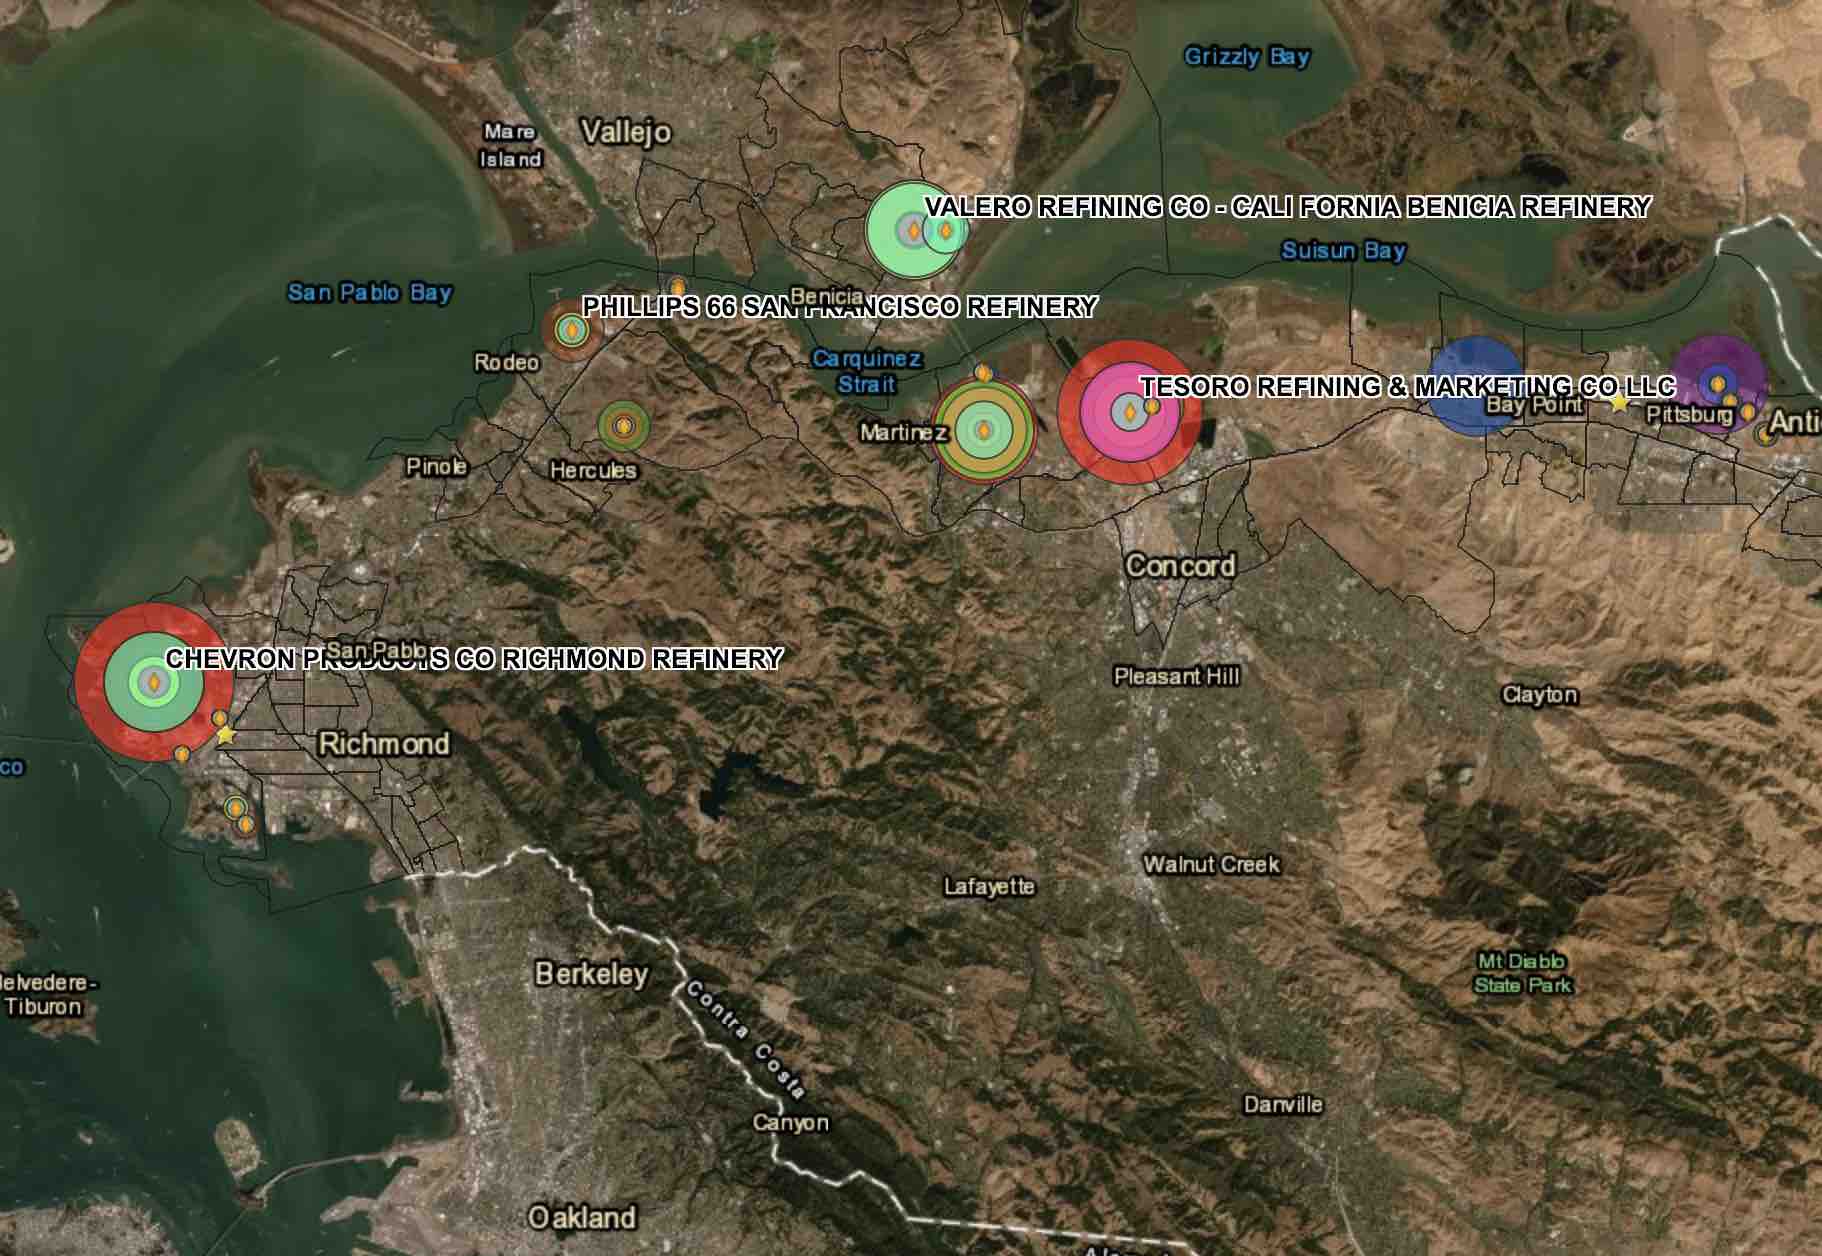
View Map Fullscreen | How Our Maps Work
If you open the map into its own page, you can toggle between individual chemical emissions from these facilities. Use the layers tab to change the chemicals displayed. For more information on the individual chemicals, continue reading below.
This unique selection of pollutants was chosen by identifying the highest health risk drivers in the region. They are known to increase both cancer and non-cancer risk for residents in the bay area. The graphs that follow show the emissions inventories reported by each refinery. The refineries are organized on the X –axis according to increasing refining capacity, as they are in Figure 4, above.
Analysis of the graphs show that the Richmond Chevron facility is a largely responsible for 1,2,4-trimethylbenzene, naphthalene, hydrogen cyanide, PAH’s, vanadium, lead and nickel compounds. The Tesoro refinery is mostly responsible for almost all of the 1,3-butadiene, and most responsible for hydrogen sulfide and VOCs. Shell is mostly responsible for the ethylbenzene, much of the mercury and sulfur dioxide emissions, and the most VOCs. Valero in Benicia is responsible for much of the 1,2,4-trimethylbenzene, all BTEX compounds, the most nickel compounds, and the most oxides of nitrogen. And finally, the Phillips 66 refinery in Rodeo with the lowest operating capacity also had the lowest emissions in almost every case except lead, which was very large compared to all refineries except Chevron Richmond. The Valero refinery in Benicia, the Tesoro refinery in Martinez, and the Shell refinery in Martinez emit the most criteria air pollutants (CAPs), including PM2.5 (particulate matter with a diameter less than 2.5 um), sulfur dioxide, and oxides of nitrogen.
Figure 8 – 22. Emissions totals of various air pollutants from East Bay refineries


Marine Terminals
Emissions from marine terminals are also a significant source of HAPs and particulate matter. In the map in Figure 7, the marine terminals are shown with yellow markers. Their relative contributions of total hazardous pollutants are much less than the refineries and other sources, but when we look at specific risk drivers, such as 1,3-butadiene and benzene, we find that their contributions are quite sizable. Marine terminals are also a key component for the refineries looking to access more low-grade crude. Increasing the refining capacity of the refinery will also increase the emissions from the terminals.
The Tesoro Golden Eagle Refinery in Martinez, CA was recently approved for a 30-year lease on a new marine terminal. The new terminal will allow Tesoro to switch to processing lower-cost, lower-quality crude oil from California, Bakken crude, and Canadian tar sands. When crude is transported via ocean liner, besides the issue of air pollution there is the additional risk of an ocean spill. Tom Griffith, Martinez resident and co-founder of the Martinez Environmental Group and founding member of the Bay Area Refinery Corridor Coalition recently summed up the threat, saying:
When you take a close look at what is going on in the marine oil terminals along the refinery corridor from Richmond to Stockton, it’s chilling to imagine what could happen if a huge oil tanker carrying tar sands crude crashed in the Bay! (Earthjustice, 2015)
Incidents
Figure 23. Fires at Chevron Richmond Refinery 2012. Photo by John Sebastian Russo for the SF Chronicle
Like oil spills from tankers, there are other risks of industrial accidents for refineries that need to be considered. Accidents or incidents may occur that result in a sudden, large release of air pollution. Looking at the emissions data, the Richmond Chevron refinery with the largest production capacity may seem to be an efficient station compared to the other refineries. However, an explosion and large fire in 2012 there sent 15,000 community members to local hospitals with respiratory distress. The SF Chronicle’s coverage of the story can be found here. (Fire shown in photo right.) The incident resulted from pipes corroding and failing, and the facility failing to make the decision to shut down the process. The resulting plume of smoke is shown in the cover photo of this article. Other major explosions and fires have occurred in the recent past, as well, including a flaring incident in 2014, a fire in 2007, and two other explosion and fire events in 1999 and 1989.
Of course these events are not unique to the Chevron refinery. The Tesoro Golden Eagle refinery has a reputation of being the most dangerous refinery in the country for occupational hazards, and has one of the worst track records of violations.
Conclusions
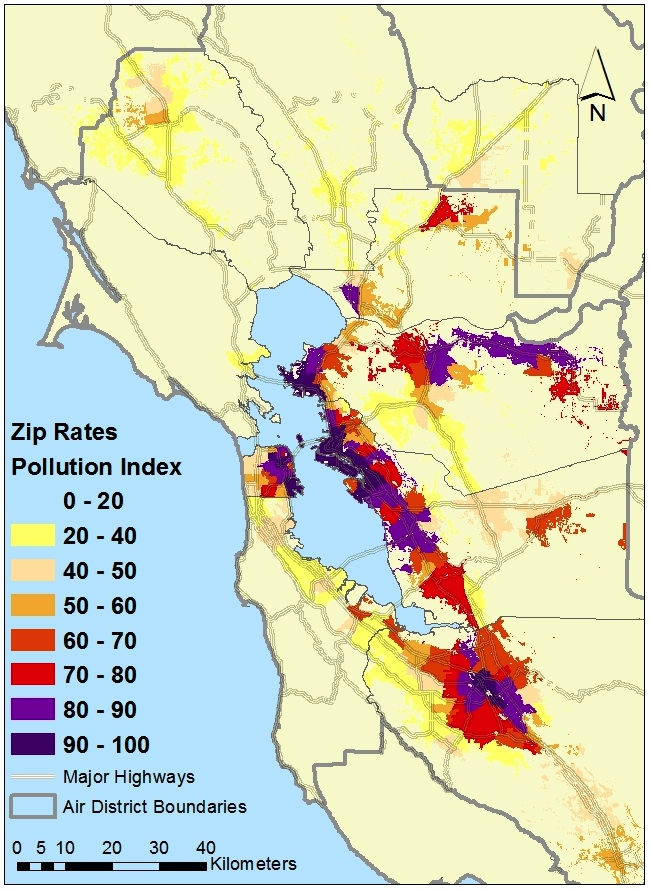
If refineries increase their capacity and process more crude, the emissions of these various pollutants will invariably increase. Increased emissions elevate risk for surrounding communities, and in the bay area these communities already bare a disparate burden. Additionally, many of the pollutants will be transported with the prevailing wind that blows from the coast up the river delta and into the central valley. In FracTracker’s recent analysis of impacted communities in the refinery corridor, maps of air quality showed that the refinery communities are some of the most impacted in the entire bay area.
In addition, California’s Central Valley has some of the worst air quality in the U.S. Click here to view maps of state air quality of disproportionate impacts by us using CalEnviroScreen 2.0. While many of the HAPs have a greater local impact, others such as ozone have regional impacts, while others like mercury are transported globally.
What we find in this report is that the refineries and petrochemical industry in the refinery corridor are responsible for the majority of the risk-driving emissions in this region. When the risk and total emissions are averaged for the entire Bay Area, the risk outcomes are much less than for those living in the communities hosting the industries. New emissions rules should prioritize contributions of emissions to ambient air pollution loads. The biggest issue with using a “per barrel” emissions limit is that it prioritizes the refining capacity rather than mitigating the existing health impacts. These types of policy decisions deal directly with risk management. The Air Management District must decide what amount of cancer and disease are acceptable to keep the refineries in the communities. An upper limit on emissions makes it easier to set a risk limit, an upper bound for health impacts. The upper limit also holds the Air Management District and elected officials accountable for their policy decisions.
References
- U.S.EPA. 2011. Addressing Air Emissions from the Petroleum Refinery Sector U.S. EPA. Accessed 3/15/16.
- CBE. 2015. Playing It Safe: Supplemental comment on air district staff proposal, rules 12-15 and 12-16; Evidence of increasing bay area refinery GHG and pm2.5 emissions.. Communities for a Better Environment
- Casanova, D. Diemoz, L. Lifshay, J. McKetney, C. 2010. Community Heath Indicators for Contra Costa County. Community Health Assessment, Planning and Evaluation (CHAPE) Unit of Contra Costa Health Services’ Public Health division. Accessed 4/15/16.
- BAAQMD. 2012. Summary of PM Report. Bay Area Air Quality Management District. Accessed 4/15/16.
** Feature image of the Richmond Chevron Refinery courtesy of D.H. Parks


