The majority of FracTracker’s posts are generally considered articles. These may include analysis around data, embedded maps, summaries of partner collaborations, highlights of a publication or project, guest posts, etc.
Over 38,000 oil and gas wells have likely been hydraulically fractured in California. The last permitted hydraulic fracturing operation in CA was approved in June 2015. Additionally, new aquifer exemption proposals will make it easier for operators to obtain hydraulic fracturing permits. One of the most interesting and troubling issues we found when analyzing the data on violations is that operators with the highest number of new well permits are also responsible for the majority of violations. In this article, we provide a look at these and other the trends of unconventional drilling in CA.
Updated CA Shale Viewer
First of all, the CA Shale Viewer has been updated! New data has been uploaded into the map about unconventional drilling in California, and new data resources have been used to identify shale gas activity (Fig. 1). Recent reports in CA have exposed what many researchers expected – hydraulic fracturing has been occurring in the state without any oversight or documentation for a long time.
In this presentation of the Updated CA Shale Viewer we showcase an analysis of these new data sources that better describe unconventional drilling in CA. We then look to new well permitting data to see what current spatial trends may mean for future oil and gas development. We also look at a sample of operator violations issued by the state regulatory agency to tell us a bit about who the bad actors may be.
Figure 1. CA Shale Viewer – Location of well stimulation & other unconventional oil & gas activity
Fracking in California has been put on hold at the moment as a result of low oil prices combined with the new permitting requirements for groundwater monitoring. In 2015, the CA Council on Science and Technology (CCST) released a report on hydraulic fracturing, as required by State Bill 4, proposed by Senator Pavley. The legislation required the Division of Oil, Gas and Geothermal Resources to create regulations for hydraulic fracturing and other stimulation activities such as acidizing. The report highlighted the necessity of protecting California’s groundwater resources. As another requirement of SB4, the state water resources control board adopted Model Criteria for Groundwater Monitoring in areas of Oil and Gas Well Stimulation, which includes three main components:
Area-specific required groundwater monitoring near stimulation wells by operators
Requirements for designated contractor sampling and testing
Regional scale groundwater monitoring to be implemented by the State Water Board
With these requirements in place to protect groundwater, using hydraulic fracturing and other “extreme” high energy input techniques to extract oil is not currently economical in California. Operators have not submitted a permit application for hydraulic fracturing in CA since June 2015.
This status may change in the near future, though, as DOGGR has proposed groundwater monitoring exemptions for 3 large aquifer systems in Kern and Arroyo Grande counties. Such a proposal would mean that operators would not have to monitor for groundwater contamination in these areas when using hydraulic fracturing or other stimulation technologies like acidizing.
Previous Fracking Activity
One outcome of the aforementioned CCST report on hydraulic fracturing was a review of stimulation activity that has occurred in CA but went undocumented. Researchers at Lawrence Berkeley National Laboratory (LBNL) screened thousands of oil and gas well logs and records to calculate the extent to which hydraulic fracturing was actually being used in California’s oil fields. LBNL derived “Well Stimulation Treatment” probabilities based on the number of well records that reported utilizing hydraulic fracturing.
Probabilities were then derived for each pool, which is a geographically isolated formation within an oil field. Using these probabilities, FracTracker calculated a conservative estimate for the number of stimulated wells in the state at over 38,000. There are 228,010 unique Well ID’s listed in the DOGGR database. This puts the proportion of hydraulically fractured wells in California at 16.7% of the total 228,090 wells known.
New Wells
Whereas many other states break down their oil and gas data to show in what phase of development a well may be, CA identifies all wells between the permitted and producing/injecting phase as “new.” In Figure 2 below you can see the wells identified in 2016 as “new.” The DOGGR dataset shows there are currently 6,561 new wells in California as of July 2016. Counts of new well permits were calculated for individual operators and are listed below in Table 1.
Table 1. Top 10 operators according to new well permit counts in California, along with the number of new well permits currently active, the percent those permits represent of total new well permits in the state, and the percentage of violations the operator is responsible in the DOGGR dataset provided to FracTracker Alliance.
Order
Operator
Permit Count
Permit %
Violations %
1
Aera Energy LLC
2012
30.67%
22.34%
2
Chevron U.S.A. Inc.
968
14.75%
20.35%
3
California Resources Production Corporation
768
11.70%
5.89%
4
Linn Operating, Inc.
574
8.75%
12.04%
5
E & B Natural Resources Management Corporation
572
8.71%
1%
6
California Resources Elk Hills, LLC
374
5.70%
5.52%
7
Seneca Resources Corporation
185
2.82%
2.83%
8
Freeport-McMoRan Oil & Gas LLC
164
2.50%
15.22%
9
Vaquero Energy, Inc.
154
2.35%
0.22%
10
Macpherson Oil Company
116
1.77%
2.09%
There are 68 fields in CA that have added new wells in the new DOGGR dataset published in July 2016. The top 10 fields are listed in Table 2 below.
Table 2. Top 10 Oil Fields by Permit (New Well) Count
Order
Oil Field
Well Count
1
Belridge, South
1518
2
Midway-Sunset
903
3
Poso Creek
553
4
Lost Hills
488
5
Cymric
336
6
Kern River
294
7
Elk Hills
276
8
Kern Front
233
9
McKittrick
186
10
Belridge, North
174
In Figure 2 below, the counts of new wells in fields are shown in shades of yellow/red. The fields with the highest number of new wells are located in the Central Valley. The top 10 operators’ wells are also identified. The majority of new well permits are located in the South Belridge oil field, and the majority of those wells are operated by Aera Energy. As can be seen in the map, most new wells are located in fields in Kern county, but Santa Barbara and Fresno, and even Salinas counties have fields with 40 or more new well permits.
Figure 2. New Well Permitting Map of Unconventional Drilling in California
In most states with heavy oil and gas drilling, data on violations is collected by the state regulatory agency, aggregated in datasets and spreadsheets, and made available to the public. FracTracker has done analyses with such data in the past.
In Pennsylvania for instance, a 2011 look at the data showed us that as the number of inspectors on the ground in the Marcellus Shale fields increases, the number of violations/well actually decrease. This was important information that challenged the cynical hypothesis: that more inspectors mean additional eyes on the ground to identify more violations during inspections. In reality, more inspectors actually mean that operators are held to higher standards, and further best management practices (BMPs) are employed. This trend at least seemed to be the case in Pennsylvania. As a regulatory agency, such knowledge is incredibly important, and even validates increased spending and budgets for more personnel.
In California, the issue of publishing violations data is again met with a similar response from the Division of Oil Gas and Geothermal Resources (DOGGR), specifically the “Oh, is that my job?” question.
How is it shared?
At FracTracker, we spent time working with regulatory officials at DOGGR to get some data on violations. We were informed that at some point in the future, the data may be aggregated and available digitally. Until then, however, a request for the data would have to be made to each of the six district offices individually and would take approximately a year to pull together scanned copies of violations notices in PDF format. Unfortunately, we at FracTracker do not have the capacity to process such files. Instead we asked for anything DOGGR had digitally available, and we were provided with a sample subset of 2,825 violations dating mostly from 2013 and 2014 and only in District 2, the Los Angeles Basin.
What does CA violations data look like?
Looking at the sample of data in Table 2, we see that the majority of violations are caused by the operators that also have the most new well permits. Aera Energy, in particular, is responsible for over 1/5 of all violations in our sample set. Limiting factors and sampling bias of the sample set of violations may impact this analysis, though, as all violations are limited to Los Angeles County. Operators that mostly operate in the Central Valley will be under represented in the violations count. When more violations data becomes available we will be sure to expand this analysis.
Bans and Regulations on Unconventional Drilling in California
Although every state regulatory agency lambasts that they have the most comprehensive and conservative set of oil and gas extraction regulations, California regulators may actually be right. That is, save for New York which has banned hydraulic fracturing outright.
As the price of oil rebounds closer to $100/barrel, there will be more interest by operators to increase unconventional drilling in California. The addition of new aquifer exemptions will make it all the more appealing. These local movements are therefore incredibly important to ensure that “extreme” extraction methods like fracking don’t expand in the future.
Feature Photo: South Belridge field by Sarah Leen, National Geographic
https://www.fractracker.org/a5ej20sjfwe/wp-content/uploads/2016/07/southbelridge_NatGeo_re.jpg400900Kyle Ferrar, MPHhttps://www.fractracker.org/a5ej20sjfwe/wp-content/uploads/2025/09/2025-Wordmark-Logo.pngKyle Ferrar, MPH2016-07-26 04:35:192020-03-12 17:18:14Trends in California’s Oil and Gas Development
From 2011-2013, the PA Department of Environmental Protection (DEP) required air emission data to be conducted and reported by oil and gas drillers in Pennsylvania. We have tried to look at this data in aggregate to give you a sense of the types and quantities of different pollutants. Corresponding to their degree of oil and gas drilling activity, Washington, Susquehanna, Bradford, Greene, and Lycoming counties are the highest emitters of overall pollutants between the specified years. Despite the department’s attempt to increase transparency, the data submitted by the operators severely underestimates the actual amount of pollutants released, especially with regard to methane emissions. Furthermore, gaps such as inconsistent monitoring systems, missing data, and a lack of a verification process of the self-reported data weaken the integrity and reliability of the submitted data. This article explores the data submitted and its implications in further detail.
Why Emissions Are Reported
The U.S. Energy Information Administration (EIA) estimates that U.S. natural gas production will increase from 23 trillion cubic feet in 2011 to over 33 trillion cubic feet in 2040.Pennsylvania, in particular, is one of the states with the highest amount of drilling activity at present. This statistic can be attributed to resource-rich geologic formations such as the Marcellus Shale, which extends throughout much of Appalachia. While New York has banned drilling using high-volume hydraulic fracturing (fracking), Pennsylvania continues to expand its operations with 9,775 active unconventional wells as of June 10, 2016.
Between 2000-2016, drillers in Pennsylvania incurred 5,773 violations and $47.2 million in fines. The PA DEP, which oversees drilling permits and citations, has undergone criticism for their lack of action with complaints related to oil and gas drilling, as well aspoor communication to the public*. In order to increase transparency and to monitor air emissions from wells, the DEP now requires unconventional natural gas operators to submit air emission data each year. The data submitted by operators are intended to be publicly accessible and downloadable by county, emission, or well operator.
* Interestingly, PA scored the highest when we rated states on a variety of data transparency metrics in a study published in 2015.
Importance of Data Collected
PA’s continual growth in oil and gas drilling activity is concerning for the environment and public health. Pollutants such as methane, carbon dioxide (CO2), and nitrous oxides (NOx) are all major contributors to climate change, and these are among the more common emissions found near oil and gas activities. Long-term exposure to benzene, also commonly associated with drilling sites, can result in harmful effects on the bone marrow and the decrease in red blood cells. Vomiting, convulsions, dizziness, and even death can occur within minutes to several hours with high levels of benzene.
With such risks, it is crucial for residents to understand how many wells are within their vicinity, and the levels of these pollutants emitted.
Air Monitoring Data Findings & Gaps
Although the DEP collects emission data on other important pollutants such as sulfur oxides (SOx), particulate matter (PM10 and PM2.5), and toluene, this article focuses only on a few select pollutants that have shown the highest emission levels from natural gas activity. The following graphs illustrate emissions of methane, carbon dioxide (CO2), carbon monoxide (CO), nitrogen oxides (NOx), benzene, and volatile organic compounds (VOCs) for the top 10 counties with the highest amounts of natural gas activity. PA wells drilled data (often called SPUD data) will also be referenced throughout the article. Data source: PA SPUD Data.
PA DEP’s Calculation Methods Codes for Emissions
Well operators self-report an estimate of total emissions in tons per year through either an online or paper reporting system. They must also indicate the method they used to generate this estimate with the Calculation Methods Codes for Emissions (table shown right).
Overall, Washington, Susquehanna, Bradford, Greene, and Lycoming counties were the main emitters of all selected pollutants (methane, CO2, CO, NOx, VOCs, and benzene) throughout Pennsylvania based on tons per year (Fig 1). This trend may be correlated to the amount of natural gas activity that exists within each state as shown in the graph above. Thetop three Pennsylvania counties with the highest amount of oil and gas activity since 2000 are Washington, Susquehanna, and Bradford with 1,347; 1,187; and 1,091 unconventional active wells, respectively.
Methane Emissions
Figure 2
In 2012, Susquehanna, Bradford, and Lycoming counties reported the highest amount of methane released with levels at 36,607, 23,350, and 14,648 tons, respectively (Fig 2). In 2013, Bradford, Lycoming, and Greene counties reported the highest amount of methane released with levels at 17,805, 17,265, and 15,296 tons, respectively.
Although the overall trend of methane emission declines from 2012 to 2013, there is an unusual drop in Susquehanna County’s methane emissions from 2012 to 2013. Susquehanna’s levels went from 36,607 tons to 12,269 tons in that timeframe. However, the DEP SPUD data recorded an increase of 190 active wells to 214 active wells from 2012 to 2013 in that same county. Though the well operators did not provide details for this shift, possible reasons may be because of improved methods of preventing methane leaks over the year, well equipment may be less robust as it once was, operators may have had less of a reason to monitor for leaky wells, or operators themselves could have changed.
Lackawanna and Luzerne counties reported zero tons of methane released during the year of 2012 (not shown on graph). There are two possible reasons for this: both counties did not have any unconventional wells recorded in the 2012 SPUD data, which may explain why the two counties reported zero tons for methane emissions, or the levels submitted are a significant underestimation of the actual methane level in the counties. (While there were no new wells, there are existing wells in production in those counties.)
Considering that methane is the primary component of natural gas activity, the non-existent level of methane reported seem highly implausible even with inactive wells on site. Typically, an old or inactive gas well can either be abandoned, orphaned, or plugged. By definition, abandoned wells have been inactive for more than a year, and orphaned wells were abandoned prior to 1985. (Because of this distinction, however, no unconventional wells can be considered “orphaned.”) To plug a well, cement plugs are used to cover up wellbores in order to cease all flow of gas. The act of physically plugging up the wells paints an illusion that it is no longer functioning and has ceased all emissions.
Because of this flawed impression, systematic monitoring of air emissions is often not conducted and the wells are often ignored. Several studies have shown even abandoned and plugged wells are still spewing out small and at times large quantities of methane and CO2. One study published in 2014 in particular measured 19 abandoned wells throughout Pennsylvania, and concluded that abandoned wells were significant contributors to methane emissions – contributing 4-7% of total anthropogenic (man-made) methane emissions in PA.
In 2012, Bradford County reported 682,302 tons of CO2 emitted; Washington County reported 680,979 tons; and Susquehanna reported 560,881 tons (Fig. 3). In 2013, Washington continued to lead with 730,674 tons, Bradford at 721,274 tons, and Lycoming with 537,585 tons of CO2 emitted.
What’s intriguing is according to SPUD data, Armstrong, Westmoreland, and Fayette also had considerable natural gas activity between the two years as shown on the map. Yet, their levels of CO2 emission are significantly lower compared to Lycoming or Susquehanna Counties. Greene County, in particular, had lower levels of CO2 reported. Yet, they had 106 active wells in 2012 and 117 in 2013. What is even more unusual is that Bradford County had 9 more wells than Greene County in 2013, yet, Greene County still had significantly higher CO2 levels reported.
Reasons for this difference may be that Greene County lacked the staff or resources to accurately monitor for CO2, the county may have forgotten to record emissions from compressor stations or other fugitive emission sources, or the method of monitoring may have differed between counties. Whatever the reason is, it is evident that the levels reported by Greene County may not actually be an accurate depiction of the true level of CO2 emitted.
Spudded wells in PA with reported CO emissions by county 2011-13
Figure 4
According to the PA SPUD data, the number of new wells drilled in Bradford County dropped from 389 in 2011 to 163 in 2012 to 108 to 2013. The diminishing number of newly drilled wells in this particular county may explain the noticeable outlier in CO emission as seen on the graph (Fig 4).
Compressor stations are also known to emit VOC, NOx, and various greenhouse gases; they run 24/7 and serve multiple wells. Compressor stations are necessary to move the natural gas along the pipelines, and thus, may still be required to function even after some wells have ceased operation. Furthermore, there can be multiple compressor stations in a region because they are installed at intervals of about 40 to 100 miles. This suggests that in addition to drilled wells, compressor stations provide additional avenues for NOx or VOC to leak into the air.
Spudded wells in PA with reported benzene emissions by county 2011-13
Figure 7
The levels of benzene emitted varied the most when compared to the other pollutants presented previously. Generally, the high levels of methane, CO2, and NOx emitted correlate with the high amount of natural gas activity recorded for each county’s number of drilled unconventional wells. However, it is interesting that both Westmoreland and Fayette counties had fewer active wells than Bradford County, yet, still reported higher levels of benzene (Fig 1, Fig 7).
An explanation for this may be the different monitoring techniques, the equipment used on each site which may vary by contractor or well access, or that there are other external sources of benzene captured in the monitoring process.
Although the collection and monitoring of air emission from wells is a step in the right direction, the data itself reveals several gaps that render the information questionable.
The DEP did not require operators to report methane, carbon dioxide, and nitrous oxide in 2011. Considering that all three components are potent greenhouse gases and that methane is the primary component in natural gas production, the data could have been more reliable and robust if the amount of the highest pollutants were provided from the start.
Systematic air monitoring around abandoned, orphaned, and plugged wells should still be conducted and data reported because of their significant impact to air quality. The DEP estimates there are approximately 200,000 wells that have been abandoned and unaccounted for. This figure includes older, abandoned wells that had outdated methods of plugging, such as wood plugs, wood well casings, or no plug at all. Without a consistent monitoring system for fugitive air emissions, the public’s true risk of the exposure to air pollutants will remain ambiguous.
All emissions submitted to the DEP are self-reported data from the operators. The DEP lacks a proper verification process to confirm whether the submitted data from operators are accurate.
The finalized data for 2014 has yet to be released despite the DEP’s April 2016 deadline. The DEP inadvertently posted the reports in March 2016, but quickly removed them without any notification or explanation as to why this information was removed. When we inquired about the release date, a DEP representative stated the data should be uploaded within the next couple of weeks. We will provide updates to this post when that data is posted but the DEP.
Overall, PA DEP’s valiant attempt to collect air data from operators and to increase transparency is constrained by the inconsistency and inaccuracy of the dataset. The gaps in the data strongly suggest that the department’s collection process and/or the industry’s reporting protocol still require major improvements in order to better monitor and communicate this information to the public.
August 23, 2016 Update
The 2014 air emissions data are now available on PA DEP’s website.
https://www.fractracker.org/a5ej20sjfwe/wp-content/uploads/2016/07/Air-Wellpad-Feature.jpg400900FracTracker Alliancehttps://www.fractracker.org/a5ej20sjfwe/wp-content/uploads/2025/09/2025-Wordmark-Logo.pngFracTracker Alliance2016-07-25 14:20:552020-03-12 17:18:42A Review of Oil and Gas Emissions Data in Pennsylvania
By Ted Auch, PhD – Great Lakes Program Coordinator
Hydraulic Fracturing “Fracking” at a well-pad outside Barnesville, Ohio operated by Halliburton
The industrial practice of disposing of oil and gas drilling waste into Class II injection wells causes a lot of strife for people on both sides of the fracking debate. This process has exposed many “hidden [geologic] faults” across the US as a result of induced seismicity. It has been linked in recent months and years with increases in earthquake activity in states like Arkansas, Kansas, Texas, and Ohio.
Locally, there is growing evidence in counties – from Ashtabula to Washington – that Ohio Class II injection well volumes and quarterly rates of change are related to upticks in seismic activity (Figs. 1-3). But exactly how much waste are these sites receiving, and where is it coming from? Since it has been a little over a year since last we looked at the injection well landscape here in Ohio, we decided to revisit the issue here.
Figures 1-3. Ohio Class II Injection Well disposal during Q3-2010, Q2-2012, and Q2-2015
The Class II Landscape in Ohio
In Ohio 245+ Class II Salt Water Disposal (SWD) Disposal Wells are permitted to accept unconventional oil and gas waste. Their disposal capacity and number of wells served is by far the most of any state across the Marcellus and Utica Shale plays.
Ohio’s Class II Injection wells have accepted an average of 22,750 barrels per quarter per well (BPQPW) (662,632 gallons) of oil and gas wastewater over the last year. In comparison, our last analysis uncovered a higher quarterly average (29,571 BPQPW) between the initiation of frack waste injection in 2010 and Q2-2015 (Fig. 4). This shift is likely due to the significant decrease in overall drilling activity from 2012 to 2015. Between Q3-2010 and Q1-2016, however, OH’s Class II injection wells saw an exponential increase in injection activity. In total, 109.4 million barrels (3.8-4.6 billion gallons) of waste was disposed in Ohio. From a financial perspective this waste has generated $3.4 million in revenue for the state or 00.014% of the average state budget (Note: 2.5% of ODNR’s annual budget).
The more important point is that even in slow times (i.e., Q2-2015 to the present) the trend continues to migrate from the bottom-left to the top-right, with each of Ohio’s Class II injection wells seeing quarterly demand increases of 972 BPQPW (34,017-40,821 gallons). This means that the total volume coming into our Class II Wells is increasing at a rate of 8.2-9.8 MGs per year, or the equivalent to the water demand of several high volume hydraulically fractured wells.
With respect to the source of this waste, the story isn’t as clear as we had once thought. Slightly more than half the waste came from out-of-state during the first two years for which we have data, but this statistic plummeted to as low as 32% in the last year-to-date (Fig. 5). This change is likely do to the high levels of brine being produced in Ohio as the industry migrates towards the perimeter of the Utica Shale.
Figures 4 and 5
Freshwater Demand and Brine Production
Map of Ohio Utica Brine Production and Class II Injection Well Disposal
Figure 6. Ohio Class II Injection Well disposal as a function of freshwater demand by the shale industry in Ohio between Q3-2010 and Q1-2015
To gain a more comprehensive understanding of what’s going on with Class II wastewater disposal in Ohio, it’s important to look into the relationship between brine and freshwater demand by the hydraulic fracturing industry. The average freshwater demand during the fracking process, accounts for 87% of the trend in brine disposal in Ohio (Fig. 6).
As we mentioned, demand for freshwater is growing to the tune of 405-410,000 gallons PQPW in Ohio, which means brine production is growing by roughly 12,000 gallons PQPW. This says nothing for the 450,000 gallons of freshwater PQPW increase in West Virginia and their likely demand for injection sites that can accommodate their 13,500 gallons PQPW increase.
Conclusion
Essentially, the seismic center of Ohio has migrated eastward in recent years; originally it was focused on Western counties like Shelby, Logan, Auglaize, Darke, and Miami on the Indiana border, but it has recently moved to injection well hotbed counties like Ashtabula, Trumbull, and Washington along the Pennsylvania and West Virginia borders. This growth in “induced seismicity” resulting from the uptick in frack waste disposal puts Ohio in the company of Oklahoma, Arkansas, Colorado, Kansas, New Mexico, and Texas. Each of those states have reported ≥4.0 magnitude “man-made” quakes since 2008. Between 1973 and 2008 an average of 21 earthquakes of ≥M3 were reported in the Central/Eastern US. This number jumped to 99 between 2009 and 2013, with 659 of M3+ in 2014 alone according to the USGS and Virginia Tech Seismological Observatory (VTSO). This “hockey stick moment” is exemplified in the below figure from a recent USGS publication (Fig. 7). Figure 8 illustrates the spatial relationship between recent seismic activity and Class II Injection well volumes here in Ohio. The USGS even went so far as to declare the following:
An unprecedented increase in earthquakes in the U.S. mid-continent began in 2009. Many of these earthquakes have been documented as induced by wastewater injection…We find that the entire increase in earthquake rate is associated with fluid injection wells. High-rate injection wells (>300,000 barrels per month) are much more likely to be associated with earthquakes than lower-rate wells.
– From USGS Report High-rate injection is associated with the increase in U.S. mid-continent seismicity
Figures 7 and 8
The sentiment here in Ohio regarding Class II Injection wells is best summed up by Dr. Ray Beiersdorfer, Distinguished Professor of Geology, Youngstown State University and his wife geologist Susie Beiersdorfer who jointly submitted the following quote regarding the North Star (SWIW #10) Class II Injection Well in Mahoning County, which processed 555,030 barrels (21,368,655 gallons) of fracking waste between Q4-2010 and Q4-2011[1].
The operator, D&L, and the ODNR denied the correlation in space and time between the injection of toxic fracking fluids into the well and earthquakes for over eight months in 2011. The well was shut down on December 30 and the largest seismic event, a 4.0 happened at 3:04 p.m. on December 31, 2011. Though the rules say that a “shut-in” well must be plugged after 60 days, this well is still “open” after 1656 days (July 12, 2016). This well must be plugged [and abandoned] to prevent further risks to the health and safety of the Youngstown community… According to Rick Simmers, the only thing holding this up is bankruptcy procedures. It was drilled into a fault, triggered over five hundred earthquakes, including a Magnitude 4.0 that caused damage to homes. [It is likely] that any other use of this well would trigger additional hazardous earthquakes.
Images From Across Ohio
Click on the images below to explore visual documentation and volumes disposed (as of Q1-2016) into Class II Injection wells in Ohio.
https://www.fractracker.org/a5ej20sjfwe/wp-content/uploads/2016/07/ClassIIOhio-Feature.jpg400900Ted Auch, PhDhttps://www.fractracker.org/a5ej20sjfwe/wp-content/uploads/2025/09/2025-Wordmark-Logo.pngTed Auch, PhD2016-07-15 14:03:162020-03-12 17:19:05OH Class II Injection Wells – Waste Disposal Trends and Images From Around Ohio
Sierra Shamer, Visiting Scholar, FracTracker Alliance
While neighboring states New York and Maryland work to regulate the natural gas industry, Pennsylvania makes way for a pipeline build-out and continued unconventional oil and gas drilling. The industry, legislature, and state agencies claim that continued natural gas development is necessary, can be carried out safely, and will provide money, jobs, and energy to Pennsylvania. However, the price is increasingly evident, and the realization of these claims is yet to come.
PA residents are quickly learning that pipelines come with a cost; their permitting, construction, and supporting facilities infringe on private property rights, cause water and air pollution, and threaten public safety. On Friday April 29th in Westmoreland County, for example, Spectra Energy’s Texas Eastern 30″ gas pipeline exploded, severely burning one man, destroying his home, and damaging homes nearby. The local fire chief recounted his awe at the explosion. For him, it was “… like you were looking down into hell.” These costs prompt communities to consider whether the advertised benefits of pipelines will actually outweigh the costs. Active grassroots resistance has emerged throughout the state, and as it grows, it is consistently met with industry aggression and state repression.
This article provides an overview of the pipeline build-out in Pennsylvania, the political and economic environment promoting it, growing community activism, and, how the industry and state respond. An interactive map of existing and proposed pipelines in PA is featured at the end of the article.
The Shale in Pennsylvania
Extent of the Utica (brown) and Marcellus (orange) shale formations. Click to expand.
The existing interstate pipeline network moves domestic and imported oil and gas to consumers and markets within North America. These pipelines extend from regions of conventional drilling to domestic and foreign energy markets. The recent development and expansion of unconventional drilling provides access to energy reservoirs that could not be extracted before. Within the past five years, the US overtook Russia to become the largest producer of natural gas in the world.
The Marcellus and Utica shale formations exist below the Appalachian Mountains in the northeast U.S. and into Canada. The Marcellus lies beneath Pennsylvania, Virginia, Maryland, West Virginia, Ohio, and New York. The Marcellus is now the largest region of natural gas production in the United States. Geologists estimate that 4-8,000 ft. underground, over 600 trillion cubic ft. of natural gas is accessible. The Utica formation lies underneath the Marcellus, extending north into Ontario and New York, and south into Virginia, Kentucky, and Tennessee. Geologists estimate over 38 trillion cubic ft. of natural gas is accessible – in some locations over 10,000 feet underground.
Extraction in Pennsylvania
Almost 10,000 unconventional wells in Pennsylvania produce millions of cubic feet of gas each day. This rapid extraction flooded the market, causing natural gas prices to drop dramatically. Marcellus production also outpaced the capacity of the current pipeline network. The location and flow direction of existing pipelines is not ideal for transporting Marcellus gas to markets with higher demand. Additionally, well productivity drops 70% within the first year, so new wells must be drilled to keep the gas flowing. However, the low price of gas reduced revenues, and the cost of drilling new wells remains high. Combined, these factors have paused drilling activity throughout the state. In order to overcome this, gas companies are proposing construction of new pipelines and expansions of existing ones, resulting in the current pipeline build-out.
The Economics of Pipelines
The dominant narrative, promoted by industry and state, weaves a story of economic prosperity gained by drilling the Marcellus, eclipsing concerns of pipeline necessity and safety. Each pipeline project claims an economic impact in dollar amounts and jobs. Williams claims that their proposed Atlantic Sunrise pipeline will “increase economic activity by $1.6 billion in project regions” and create job opportunities. Sunoco Logistics claims that the Mariner East pipeline will “add $4.2 billion to Pennsylvania’s economy, supporting more than 30,000 jobs during the construction period and … 300-400 permanent jobs.” Often, the specifics of money and jobs are not explained, and when construction begins, communities are invaded by out of state workers and left with little economic benefit.
Response to this buildout arises at all levels. Support pours down from federal and state government while resistance pushes up from the grassroots. The EPA and Obama administration work to shut down coal and promote natural gas, claiming it’s a “bridge fuel” to renewable energy. Pennsylvania’s legislature and Dept. of Environmental Protection (DEP) have battled over drilling regulations, and the push for pipelines presents a different set of challenges. While some consider the build-out necessary to maintain the natural gas industry in PA, others, such as Phil Rinaldi, envision ways in which pipelines can bring money to the state.
Philadelphia Energy Hub
Aware that interstate pipelines carry Pennsylvania shale to out-of-state markets, Phil Rinaldi, the CEO of Philadelphia Energy Solutions (PES) views the shale boom as an opportunity to maintain resource and revenue in state. In 2013 he established the Greater Philadelphia Energy Action Team (GPEAT), a group of over 80 industry, manufacturing, labor, and government stakeholders. Their objective is to capitalize on shale by promoting pipeline construction and bringing energy-intensive manufacturing to the Greater Philadelphia area. In March of this year, the GPEAT released a report titled, “A Pipeline for Growth: Fueling Economic Revitalization with Marcellus and Utica Shale Gas.” This reports details strategies to hasten the transformation of Philly into the “energy hub” of the East by inviting chemical manufacturing industries, and supporting pipeline projects to Philadelphia.
At Ground Level
2016: Columbia 26″ pipeline construction near a home in Northern Maryland (Photo: Sierra Shamer)
At a ground level, impacted communities, public health professionals, and environmental organizations face a ravenous industry. Unaccountable for property takings, fair compensation, and pollution, it as an industry that disregards public health and ecosystems within the shalefields. As a result, grassroots and advocacy groups organize and mobilize throughout Pennsylvania to amplify the voices of impacted residents and communities and to hold the industry and government accountable to the people.
Although pipelines bring large revenues for companies, industry, and the state, the story on the ground is different. New pipelines are either constructed on existing land easements, or new ones must be purchased from landowners along the proposed right-of-way. Pipeline operators have one goal: to find the most direct and least complicated route from supply to demand. While this lower their bottom line, new pipeline routes often disregard nearness to homes, schools, and other populated areas, and cause significant damage to farmland and ecosystems.
Frontline Communities
Pipeline companies often have the power of eminent domain, the ability to take possession of land in court if the property owner refuses a contract. Negotiating fair agreements requires landowners to hire their own appraiser and lawyer, which is not an option for everyone. Unlike drilling wells, landowners do not receive royalties for the pressurized gas flowing underneath their property, facing instead declines in property values and an inability to sell their home. As a result, landowners are left undercompensated, their land forcibly taken away in an unjust process.
Landowners along the right-of-way are the most immediately impacted, but neighbors and communities are affected as well. Each pipeline has a “potential impact radius” or “hazard zone,” the area within which an explosion causes immediate destruction. Residents within this distance experience a decrease in their property values, but currently have no legal recourse for compensation. Pipelines also require numerous compressor stations, facilities that operate 24-7 to maintain the pressure of the gas within the pipeline. Compressor stations are industrial, air polluting facilities that release greenhouse gases, neurotoxins, cancer causing agents, and other pollutants that negatively impact human health and the environment. Residents living near compressor stations experience various respiratory, sinus, and nervous system health issues. These are caused by both everyday operation and periodical gas blowdowns – facility operations when large amounts of methane and other chemicals are released directly into the air for station maintenance or emergencies.
Pipeline Regulation
FERC holds Public Meetings for the Atlantic Sunrise Pipeline (Photo: Justin Engle/The Daily Item)
In Pennsylvania, no single agency is responsible for permitting, monitoring, or regulating pipelines. The Federal Energy Regulatory Commission (FERC) permits interstate pipelines, those that cross state boundaries or carry product that does. Pipelines within the state are under the jurisdiction of the Public Utility Commission (PUC), the DEP, and/or the Dept. of Conservation and Natural Resources (DCNR).
Typically, the PUC is responsible for pipelines that provide directly to consumers. However, in 2011 Act 127 gave the PUC authority to permit and inspect gathering lines, those that move gas from well pads to larger transmission pipelines. All gathering lines have national safety standards except Class 1, those with no more than ten buildings within 220 yards. The PUC maintains a registry of the location, size, and length of gathering lines, but is only includes length for Class 1. Over 12,000 miles of Class 1 pipelines currently exist in PA, a number expected to quadruple by 2030.
Pipeline Infrastructure Task Force
The complex regulation and unprecedented increase in proposals prompted Governor Wolf to create the Pipeline Infrastructure Task Force (PITF) in 2015. Headed by former Secretary of the DEP, John Quigley, the Task Force included regulatory agencies, industry representatives, and government officials. Their mission: to “engage stakeholders in a collaborative process to achieve a world-class pipeline infrastructure system” and to develop “policies, guidelines, and tools to assist in pipeline development.” The DEP offered live stream of meetings, provided public information, and opportunity for public input in an attempt to be transparent.
Task Force meetings eventually resulted in a final report, outlining challenges and providing suggestions for pipeline construction. First, the Task Force recommended an increase meaningful public participation and the development of long term maintenance plans to ensure safety. Second, they suggested reducing environmental impact by improving pipeline siting and construction and maximizing efficient permitting. Finally, they recommended enhancing the workforce and economic development from pipeline projects.
The Task Force openly acknowledged problems of the pipeline build-out, stating that “permits are not reviewed for the cumulative and long term impacts at a landscape level…they do not necessarily avoid sensitive lands, habitats, and natural features, nor are the impacts to natural and cultural resources, landowners, and communities…always minimized or mitigated.” Despite this, the administration and the Task Force maintain that pipelines can be built responsibly.
Community Opposition and Criticism
2016: Landowners and supporters protest the Constitution Pipeline in Northeast PA. (Photo: DC Media Group)
Challenges to the pipeline build-out exist in many forms. Landowners challenge the bullying, harassment, and eminent domain condemnations of pipeline companies. Communities criticize the acceptance of industry funding and pipelines by local representatives. Additionally, grassroots groups and environmental non-profits challenge the minimal regulation, permitting process, and lack of public participation allowed by the DEP, and the FERC “rubber stamp” permitting process.
Awareness and opposition grow with each proposal, condemnation, rupture, and explosion. This rapid construction is compromising pipeline quality and public safety, according to a report conducted by the Pipeline Safety Trust. They found that pipelines built after 2010 had higher rates of failure than those in decades past. Whistleblowers who worked for Spectra Energy have attested to the neglect of proper inspection in the haste to construct pipelines. Spectra’s Texas Eastern pipeline, completed in 1981, was built in a decade when pipelines failed at one-sixth the rate they do today. However, their preliminary investigation indicates that the explosion in Salem Township was likely the result of corrosion due to a “possible flaw in the coating material applied to the weld joints.”
The FERC is a regular target of criticism. Funded through fees received by the companies and industries it oversees, FERC rarely denies permits for pipelines. The Delaware Riverkeeper Network has filed a lawsuit against the FERC challenging the constitutionality of its decision-making.
The DEP’s dedication to protecting Pennsylvania’s environment from the natural gas industry at large is continuously questioned due to its infrastructure permitting, negligent response to water contamination complaints, and unwillingness to hold companies accountable. The DEP’s poor record on drilling regulation continues with regard to the pipeline build-out.
Pipeline Infrastructure Task Force
The Task Force is criticized for its overwhelming industry influence and lack of public inclusion. Of the 48 Infrastructure Task Force members, 56% are tied to the oil and gas industry. Specifically, 92% of the non-governmental members have industry ties. In fact, potential opposition to the build-out was intentionally absent. PA resident and documentary filmmaker Scott Cannon of the Gas Drilling Awareness Coalition (GDAC) was invited to the PITF, only to receive a letter rescinding his invitation a few days later. Additionally, concerned residents were allowed 2 minutes to make a statement, a limit strictly enforced by Secretary Quigley. While affected landowners recounted their fight for their livelihoods, the roundtable of apathetic Task Force members stared blankly. These problems resulted in escalating activist presence increasing from comments and protests outside the DEP building, to meeting disruptions and arrests.
Residents and activists weren’t the only ones unhappy with the PIFT. Cindy Ivey, representative for Williams, and Sarah Battisti, with SouthWest Energy, spoke of their frustrations. The fact that interstate pipeline projects are regulated by federal agencies, and state level organizations have a minor role caused tension in the group. According to Ivey, these issues are “hard things to try to explain gracefully.” Additionally, Battisti added that the 184 recommendations in the report wouldn’t “impact any of us in the near future.”
Despite recommendations of the Task Force, the DEP continues to issue permits that neglect cumulative impacts and complete environmental review. Unlike New York, which denied the 401 Water Quality certificate and prevented the construction of Constitution pipeline, the PA DEP granted the 401 certificate to the Atlantic Sunrise pipeline. As a result, it is under appeal by environmental groups, who argue that it violates the Clean Water Act and the Pennsylvania Code.
PA’s Political Climate
Regulations
Unfortunately, meaningful updates to oil and gas regulations in Pennsylvania are consistently challenged. Although Act 13 passed in 2012, critical components were appealed repeatedly, specifically the issue of local zoning authority of oil and gas infrastructure. Lawmakers who oppose any restriction on the industry dominate the current legislature. Recently, the House panel voted a second time to block increased DEP oil and gas regulations, in the making since 2011.
Frustrations in the process peaked when John Quigley resigned as secretary of the DEP after sending a profane email chastising environmental groups for their lack of support. Weeks later, Governor Wolf signed a bill that eliminates current regulations, aiming to start new and in agreement with the legislature. As a result, many environmentalists feel that the Governor has consistently compromised on the environment, putting the lives of PA residents at risk.
Political Campaigns
The relationship between the state and the drilling industry is evident and problematic in Pennsylvania. The Marcellus Money project has tracked campaign contributions and lobbying expenses from the natural gas industry, revealing over $8 million in political contributions and $46 million for lobbying efforts. In 2013 the Public Accountability Initiative released a report revealing the “revolving door” between state government and the oil and gas industry. The report identifies individuals who have moved from the public sector to industry jobs or vice versa, and how often this occurs over the course of their careers.
NPR StateImpact Pennsylvania created an interactive webpage called, “Blurred Lines” that provides a visual exploration of the “revolving door.” As you scroll through the years, individuals slide back and forth between the private and public sector. Additionally, lawmakers have, for a third time, earmarked fiscal code legislation to fund an industry-supported non-profit Shale Alliance for Energy Research PA, (SAFER PA).
State Agencies
Financial gains from drilling support other aspect of the public sector as well. The DCNR’s annual budget became increasingly reliant upon revenues from gas leases within public lands. In 2013, oil and gas lease royalties and other payments provided one-third of the DCNR’s budget. Act 13 implemented a mandatory impact fee whereby the PUC collects money from companies based on the number of oil and gas wells in the state. This money is directed to local municipalities based on the number of wells within their boundaries. However, while 60% of the fee total goes directly to impacted counties, the remaining 40% can go anywhere in PA. While impact fees totaled over $233 billion dollars in 2014, 2016 is expected to be the lowest amount yet due to the decline in drilling activity. This statistic is one of many that highlights the risk of relying on a fluctuating resource.
Governmental and Industry Responses
2016: Armed U.S. Marshall escort the tree cutting crew for the Constitution pipeline on Megan Holleran’s property (Photo: Alex Lotorto)
Response to community opposition of pipeline projects is often militaristic in nature and exaggerated by the industry and the state. The oil and gas industry views community opposition to infrastructure as an “insurgency.” In 2011, it was revealed that the Army/Marine Corps Counterinsurgency manual is used as a tactical reference. The Gas Drilling Awareness Coalition was classified as a terrorist threat by the PA Office of Homeland security, who hired the Institute of Terrorism Research and Response to track activists provide weekly information on a bulletin sent to law enforcement and gas companies. In 2012, state law enforcement, the FBI, the PA Office of Homeland Security, and the oil and gas industry established the Marcellus Shale Operators’ Crime Committee (MSOCC). This committee actively targeted activists and environmentalists in their homes.
Landowners who refuse to sign easements face an uphill battle against companies, law enforcement, and the state as they advocate for their rights. Megan Holleran of Susquehanna County lost her family’s maple syrup trees to Williams’ proposed Constitution pipeline. After protesting and challenging in court, the judge upheld eminent domain and prohibited the family from being within 150 feet from the right-of-way. Further, armed U.S. Marshalls escorted and guarded the tree cutting crew against peaceful protest. Additionally, in Huntingdon County, Elise and Ellen Gerhart faced tree clearing of their woods for Sunoco’s Mariner East pipeline. Once again, armed police escorted tree cutting crews and made several arrests of protesters, who faced bails of up to $200,000.
Pipeline Build-Out Map
The map below shows the existing major pipeline infrastructure in Pennsylvania and proposed pipelines, with the option of also viewing the unconventional wells in the Marcellus and Utica shale. For more information on pipeline regulation and public information, please view our Intro to Pipelines resource page. It includes details about current and proposed pipeline projects in Pennsylvania and throughout the country. Additionally, the intro links to a map of all proposed pipeline projects in North America.
While it is clear that companies go to every length to construct pipelines, it is equally clear that state agencies, courts, and law enforcement support pipeline development. The direction of drilling, pipelines, and politics in the state of Pennsylvania serves the bottom line of the natural gas industry. This is evidenced by the proposed pipeline built-out, state support, and state suppression of public backlash. However, continued challenges to public health and environment will only serve to increase the resilience and strength of community opposition.
https://www.fractracker.org/a5ej20sjfwe/wp-content/uploads/2016/06/Pipeline-Build-Out-Feature.jpg400900FracTracker Alliancehttps://www.fractracker.org/a5ej20sjfwe/wp-content/uploads/2025/09/2025-Wordmark-Logo.pngFracTracker Alliance2016-06-28 09:29:382020-03-12 17:19:41Infrastructural Challenges: The Direction of Drilling, Pipelines, and Politics in Pennsylvania
Each state has its own definition of what it means for an oil or gas well to be “fracked.” In Pennsylvania, these wells are known as “unconventional,” a definition mostly based on the depth of the target formation:
An unconventional gas well is a well that is drilled into an unconventional formation, which is defined as a geologic shale formation below the base of the Elk Sandstone or its geologic equivalent where natural gas generally cannot be produced except by horizontal or vertical well bores stimulated by hydraulic fracturing.
The count of these unconventional wells in PA stands at 9,760 as of June 14, 2016. Their distribution is widespread across the state, but is particularly focused in the northeast and southwest corners of Pennsylvania.
The industry is not drilling at the same torrid pace as it was between 2010 and 2012, however. The busiest month for drill rigs in the Keystone State was August 2011, with 210 unconventional wells drilled. Last month, there were just 32 such wells.
Figure 1. Unconventional oil and gas permits, wells, and violations in Pennsylvania by quarter. Data source: Pennsylvania DEP
Permits
As Figure 1 captures, the number of permits issued per quarter is always greater than the number of wells drilled during the same time period. Even when drilling activity seems to be entering a bust phase, oil and gas operators continue to plan for future development. Altogether, there are 17,492 permitted locations, meaning there are about 7,700 permitted locations where drilling has not yet commenced.
Violations
The number of violations issued by DEP is generally follows the same trends as permits and wells. It is usually the smallest of the three numbers. In the first quarter of 2016, however, is one of a few instances on the chart above where the number of violations issued outpaced wells drilled. There could be any number of reasons for this anomaly; it could have been due to to unusual compliance issued in the field or aggressive regulatory blitzes. It could also be due to some other factor that can’t be determined by the available published data source.
Interestingly, this phenomenon has not occurred since the first quarter of 2010, when the industry was in full swing.
About VpW
One of the best ways to understand the impact of the industry is to look at violations per well (VpW). Unfortunately, there are a number of important caveats to that discussion. First of all, not all items that appear on the compliance report receive their own Violation ID number. It is clear from the DEP workload report that violations are tallied internally by the number of Violation ID numbers. This is as opposed to the number of items on the compliance report. As of June 14, 2016, there were 6,706 rows of data and 5,755 distinct Violation ID numbers that were issued to 2,080 different oil and gas wells. This discrepancy means that about 21% of unconventional wells are issued violations in Pennsylvania. Those that are cited receive an average of 2.8 to 3.2 violations per well, depending on how you count them.
Table 1. Violations per well (VpW) of the 20 companies with the most unconventional wells in PA.
Determining the violations per well by operator comes with additional caveats. The drilled wells data comes from the spud report, which lists the current operator of each of the wells. The compliance report, however, lists the operator that was in charge of the well at the time of the infraction. This poses a problem for analysis, however. The ownership of the wells is quite fluid when taken in aggregate, as companies fold, are bought out, or change their names to something else.
VpW Results
We calculated VpW figures for the 20 operators with the largest inventory of drilled wells wells in Pennsylvania, found in Table 1. In some instances, we were able to reunite operators with violations that were issued under a different name but are in fact the same company. Specifically, we combined Rex Energy’s violations with RE Gas Dev, CONSOL violations with CNX, and Southwestern with SWN Productions, as the company is now known.
SWN’s violation-per-well score appears to be quite low. Their statistic, however, does not take into account wells that it purchased from Chesapeake in 2014, for example. In this transaction, 435 wells changed hands, with an unknown number of those in Pennsylvania. Any violations on these wells that Chesapeake had would stay with that company even as their well count was reduced. Such a change would thereby artificially inflate Chesapeake’s VpW score. On the other hand, SWN is now in possession of a number of wells which might have been problematic during the early stages of operation. Those violations, alternatively, are not associated with SWN, making their inventory of wells appear to be less problematic.
Data Caveats and Takeaways
Alas, we do not live in a world of perfect data. As such, these results must be taken with a grain of salt. Still, we can see that there are some trends that persist among operators that have been active in Pennsylvania for many years. Chief, Cabon, and EXCO, for example, all average more than one violation per well drilled. Chevron, CNX, and RE Gas Development, on the other hand, have much better rates of compliance, on the order of one violation per every five wells drilled.
https://www.fractracker.org/a5ej20sjfwe/wp-content/uploads/2016/06/PAUpdate-Feature.jpg400900Matt Kelso, BAhttps://www.fractracker.org/a5ej20sjfwe/wp-content/uploads/2025/09/2025-Wordmark-Logo.pngMatt Kelso, BA2016-06-22 10:05:472020-03-12 17:20:08Approaching 10K Unconventional Wells in PA
By Kirk Jalbert, Manager of Community Based Research & Engagement Kyle Ferrar, Western Program Coordinator
Weld County, Colorado, is one of the top producing shale oil and gas regions in the United States, boasting more than 12,000 active horizontal or directional wells, which account for 50% of all horizontal or directional wells in the state. To put this into perspective, the entire state of Pennsylvania has ten times the land area with “only” 9,663 horizontal or directional wells. At the center of Weld County is the city of Greeley, population 92,889. Greeley has experienced dramatic changes in the past decade as extraction companies compete to acquire oil and gas mineral rights. Extensive housing developments on the outskirts of the city are being built to accommodate future well pads on neighboring lots. Meanwhile, a number of massive well pads are proposed within or on the border of city limits.
FracTracker visited Colorado back in November 2015 and met with regional advocacy organizations including Coloradans Against Fracking, Protect our Loveland, Weld Air and Water, and Our Longmont to determine how we could assist with data analysis, mapping, and digital storytelling. FracTracker returned in June 2016 to explore conditions unique to Weld County’s oil and gas fields. During our visit we interviewed residents of Greeley and found that one of their greatest concerns was the dangers of siting oil and gas wells near schools. While there is much more we will be publishing in coming weeks about our visit, this article focuses on one troubling project that would bring gas drilling to within 1,300ft of a public school. The proposal goes before the Weld County Commissioners on Wednesday, June 29th for final approval. As such, we will be brief in pointing out what is at stake in siting industrial oil and gas facilities near schools in Colorado and why residents of Greeley have cause for concern.
Drilling Bella Romero
On June 7th, the Weld County Planning Commission unanimously approved a proposal from Denver-based Extraction Oil & Gas to develop “Vetting 15H”—a 24-head directional well pad in close proximity to Bella Romero Academy, a middle school just outside Greeley city limits. In addition to the 24-head well pad would be a battery of wastewater tanks, separators, and vapor recovery units on an adjacent lot. The permit submitted to the Colorado Oil & Gas Conservation Commission (COGCC) also states that six more wells may be drilled on the site in the future.
As was detailed in a recent FracTracker article, Colorado regulations require a minimum setback distance of 500ft from buildings and an additional 350ft from outdoor recreational areas. In more populated areas, or where a well pad would be within 1,000ft of high occupancy buildings, schools, and hospitals, drilling companies must apply for special variances to minimize community impacts. Setbacks are measured from the well head to the nearest wall of the building. For well pads with multiple heads, each well must comply with the respective setback requirements.
Bella Romero’s playground with Vetting 15H’s proposed site just beyond the fence.
Vetting 15H would prove to be one of the larger well pads in the county. And while its well heads remain just beyond the 1,000ft setback requirement from Bella Romero buildings, a significant portion of the school’s ballfields are within 1,000ft of the proposed site. When setbacks for the well pad and the processing facility are taken together—something not explicitly demonstrated in the permit—almost the entirety of school grounds are within 1,000ft and the school itself lies only 1,300ft from the pad. The below figures show the images supplied by Extraction Oil & Gas in their permit as well as a more detailed graphic generated by FracTracker.
Youth: A High Risk Population
The difference between 1,000ft and 1,300ft may be negligible when considering the risks of locating industrial scale oil and gas facilities near populated areas. The COGCC has issued 1,262 regulatory violations to drilling companies since 2010 (Extraction Oil & Gas ranks 51st of 305 operators in the state for number of violations). Some of these violations are for minor infractions such as failing to file proper paperwork. Others are for major incidents; these issues most often occur during the construction phases of drilling, where a number have resulted in explosions and emergency evacuations. Toxic releases of air and water pollution are not uncommon at these sites. In fact, the permit shows drainage and potential spills from the site would flow directly towards Bella Romero school grounds as is shown in the figure below.
Vetting 15H post-development drainage map.
A host of recent research suggests that people in close proximity to oil and gas wells experience disproportionate health impacts. Emissions from diesel engine exhaust contribute to excessive levels of particular matter, and fumes from separators generate high levels of volatile organic compounds. These pollutants decrease lung capacity and increase the likelihood of asthma attacks, cardiovascular disease, and cancer (read more on that issue here). Exposure to oil and gas facilities is also linked to skin rashes and nose bleeds.
As we’ve mentioned in our analysis of oil and gas drilling near schools in California, children are more vulnerable to these pollutants. The same amount of contaminants entering a child’s body, as opposed to an adult body, can be far more toxic due to differences in body size and respiratory rates. A child’s developing endocrine system and neural pathways are also more susceptible to chemical interactions. These risks are increased by children’s lifestyles, as they tend to spend more hours playing outdoors than adults and, when at school, the rest of their day is spent at a central location.
At the June 7th public hearing Extraction Oil & Gas noted that they intend to use pipelines instead of trucks to transport water and gas to and from Vetting 15H to reduce possible exposures. But, as residents of Greeley noted of other projects where similar promises were made and later rescinded, this is dependent on additional approvals for pipelines. Extraction Oil & Gas also said they would use electric drilling techniques rather than diesel engines, but this would not eliminate the need for an estimated 22,000 trucking runs over 520 days of construction.
Below is a table from the Vetting 15H permit that shows daily anticipated truck traffic associated with each phase of drilling. The estimated duration and operational hours of each activity are based on only 12 wells since construction is planned in two phases of 12 wells at a time. These numbers do not account for the trucking of water for completions activities, however. The figures could be much higher if pipelines are not approved, as well as if long-term trucking activities needed to maintain the site are included in the estimates.
Vetting 15H daily vehicle estimates from permit
At the Top of the Most Vulnerable List
Bella Romero Academy has the unfortunate distinction of being one of the few schools in Colorado in close proximity to a horizontal or directional well amongst 1,750 public and 90 private schools in the state. Based on our analysis, there are six public schools within 1,000ft of a horizontal or directional well. At 2,500ft we found 39 public schools and five private schools. Bella Romero is presently at the top of the list of all schools when ranked by number of well heads located within a 1,000ft buffer. An 8-head well pad is only 800ft across the street from its front door. If the Vetting 15H 24-head well pad was to be constructed, Bella Romero would be far and above the most vulnerable school within 1,000ft of a well. It would also rank 3rd in the state for well heads located within 2,500ft of a school. The tables below summarize our findings of this proximity analysis.
Colorado public schools within 1,000ft of a horizontal or directional well
Colorado public schools within 2,500ft of a horizontal or directional well with 5 or more well heads. There are 39 schools in total
Colorado private schools within 2,500ft of a horizontal or directional well
The following interactive map shows which schools in Colorado are within a range of 2,500ft from a directional and horizontal well. Additional buffer rings show 1,000ft and 500ft buffers for comparison. 1,000ft was selected as this is the minimum distance required by Colorado regulations from densely populated areas and schools without requiring special variances. Environmental advocacy groups are presently working to change this number to 2,500ft. The map is zoomed in to show the area around Bella Romero. Zoom out see additional schools and click on features to see more details. [NOTE: The Colorado school dataset lists Bella Romero Academy as an elementary/middle school. Bella Romero was recently split, with the elementary school moving a few blocks west.]
Drilling near Bella Romero is also arguably an environmental justice issue, as its student population has some of the highest minority rates in the county and are amongst the poorest. According to coloradoschoolgrades.com, Bella Romero is 89% Hispanic or Latino and 3% African American whereas, according to the U.S. Census Bureau, Greeley as a whole is 59% White and 36% Hispanic or Latino. 92% of Bella Romero’s students are also from low income families. Furthermore, according to the EPA’s Environmental Justice Screening Tool, which is used by the agency to assess high risk populations and environments, the community surrounding Bella Romero is within the 90-95% percentile range nationally for linguistically isolated communities.
Many of Bella Romero’s students come from low-income communities surrounding Greeley.
Implications
These statistics are significant for a number of reasons. Firstly, oil and gas permitting in Colorado only requires operators to notify residents immediately surrounding proposed well pads. This rule does not include residents who may live further from the site but send their students to schools like Bella Romero. Parents who might comment on the project would need to hear about it from local papers or neighbors, but language barriers can prevent this from occurring. Another factor we witnessed in our June visit to Latino communities in Weld County is that many students have undocumented family members who are hesitant to speak out in public, leaving them with no voice to question risks to their children.
Residents of Greeley speak out at the June 7th Planning Commission meeting
Nevertheless, at the June 7th Planning Commission hearing, Weld County administrators insisted that their decisions would not take race and poverty into consideration, which is a blatant disregard for EPA guidelines in siting industrial development in poor minority communities. Weld County’s Planning Commission claimed that their ruling on the site would be the same regardless of the school’s demographics. By comparison, another proposed Extraction Oil & Gas site that would have brought a 22-head well pad to within 1,000ft of homes in a more well off part of town was denied on a 0-6 vote by the City of Greeley’s Planning Commission earlier this year after nearby residents voiced concerns about the potential impacts. Extraction Oil & Gas appealed the ruling and Greeley City Council passed the proposal in a 5-2 vote pending additional urban mitigation area permit approval. While the Greeley Planning Commission and the Weld County Planning Commission are distinct entities, the contrast of these two decisions should emphasize concerns about fair treatment.
Conclusion
There are very real health concerns associated with siting oil and gas wells near schools. When evaluating this project, county administrators should assess not only the immediate impacts of constructing the well pad but also the long-term effects of allowing an industrial facility to operate so close to a sensitive youth population. There are obvious environmental justice issues at stake, as well. Public institutions have a responsibility to protect marginalized communities such as those who send their children to Bella Romero. Finally, approving the Vetting 15H project would place Bella Romero far at the top of the list for schools in Colorado within 1,000ft of oil and gas wells. School board administrators should be concerned about this activity, as it will undoubtedly put their students’ health and academic performance at risk. We hope that, when the County Commissions review the proposal, these concerns will be taken into account.
https://www.fractracker.org/a5ej20sjfwe/wp-content/uploads/2016/06/BellaRomeroSchool-Feature.jpg400900FracTracker Alliancehttps://www.fractracker.org/a5ej20sjfwe/wp-content/uploads/2025/09/2025-Wordmark-Logo.pngFracTracker Alliance2016-06-21 13:09:522020-03-11 17:05:19Drilling Bella Romero: Children at Risk in Greeley, Colorado
North America consists of a vast network of inter- and intrastate pipelines that serve a vital role in transporting water, hazardous liquids, and raw materials. There is an estimated 2.6 million miles of pipelines in the nation, and it delivers trillions of cubic feet of natural gas and hundreds of billions of tons of liquid petroleum products each year. Because the pipeline network fuels the nation’s daily functions and livelihoods by delivering resources used for energy purposes, it is crucial to shed light on this transportation system. This article briefly discusses oil and gas pipelines, what they are, why they exist, their potential health and environmental impacts, proposed projects, and who oversees them.
What are pipelines, and what are they used for?
Pipelines in North Dakota. Photo credit: Kathryn Hilton
The pipeline network in the U.S. is a transportation system used to move goods and materials. Pipelines transport a variety of products such as sewage and water. However, the most common products transported are for energy purposes, which include natural gas, biofuels, and liquid petroleum. Pipelines exist throughout the country, and they vary by the goods transported, the size of the pipes, and the material used to make pipes.
While some pipelines are built above ground, the majority of pipelines in the U.S. are buried underground. Because oil and gas pipelines are well concealed from the public, most individuals are unaware of the existence of the vast network of pipelines.
Extent of U.S. Pipeline System
The United States has the most miles of pipelines than any other country, with 1,984,321 km (1,232,999 miles) in natural gas transport and 240,711 km (149,570 miles) in petroleum products. The country with the second most miles of pipelines is Russia with 163,872 km (101,825 miles), and then Canada with 100,000 km (62,137 miles).
Types of Oil and Gas Pipelines
There are two main categories of pipelines used to transport energy products: petroleum pipelines and natural gas pipelines.
Petroleum pipelines transport crude oil or natural gas liquids, and there are three main types of petroleum pipelines involved in this process: gathering systems, crude oil pipeline systems, and refined products pipelines systems. The gathering pipeline systems gather the crude oil or natural gas liquid from the production wells. It is then transported with the crude oil pipeline system to a refinery. Once the petroleum is refined into products such as gasoline or kerosene, it is transported via the refined products pipeline systems to storage or distribution stations.
Natural gas pipelines transport natural gas from stationary facilities such as gas wells or import/export facilities, and deliver to a variety of locations, such as homes or directly to other export facilities. This process also involves three different types of pipelines: gathering systems, transmission systems, and distribution systems. Similar to the petroleum gathering systems, the natural gas gathering pipeline system gathers the raw material from production wells. It is then transported with large lines of transmission pipelines that move natural gas from facilities to ports, refiners, and cities across the country. Lastly, the distribution systems consist of a network that distributes the product to homes and businesses. The two types of distribution systems are the main distribution line, which are larger lines that move products close to cities, and the service distribution lines, which are smaller lines that connect main lines into homes and businesses.
Right-of-Way (ROW)
Before pursuing plans to build new pipelines, a ROW needs to be secured from private and public landowners, which pipeline companies usually will pay for. ROW are easements that must be agreed and signed upon by both the landowner and pipeline company, and permits pipeline operators to go forth with installing and maintaining pipelines on that land. Pipeline operators can obtain ROW by purchasing the property or through a court-ordered procedure. ROW can be permanent or temporary acquisitions, and needs approval from FERC.
Regulatory Oversight
Depending on the type of pipeline, what it is transferring, what it is made of, and where it runs, there are various federal or state agencies that have jurisdiction over its regulatory affairs.
A. Federal Energy Regulatory Commission (FERC)
Interstate pipelines, those that either physically cross state boundaries or carry product that will cross state boundaries, are all permitted by the Federal Energy Regulatory Commission (FERC). The FERC is an independent organization within the U.S. Department of Energy that permits interstate electricity and natural gas infrastructure. The FERC’s authority lies within various acts of energy legislation, beginning with the Natural Gas Act of 1938 to the more recent Energy Policy Act of 2005. The U.S. President appoints its four commissioners. Other agencies such as the Dept. of Transportation, regional authorities such as the River Basin Commissions, and the Army Corps of Engineers may also be involved. FERC approves the location, construction, operation, and abandonment of interstate pipelines. They do not have jurisdiction over the siting of intrastate natural gas pipelines nor hazardous liquids.
B. Pipeline and Hazardous Materials Administration (PHMSA)
Under the U.S. Department of Transportation, the PHMSA oversees, develops, and enforces regulations to ensure the safe and environmentally sound pipeline transportation system. There are two offices within the PHMSA that fulfill these goals. The Office of Hazardous Materials Safety develops regulations and standards for classifying, handling, and packaging hazardous materials. The Office of Pipeline Safety develops regulations and risk management approaches to assure safe pipeline transportation, and ensures safety in the design, construction, operation and maintenance, and spill response of hazardous liquid and natural gas pipeline transportation. Below are some regulations enforced by PHMSA:
1. Pipeline Safety, Regulatory Certainty, and Job Creation Act of 2011 or Pipeline Safety Act 2011
This act reauthorizes PHMSA to continue with the examination and improvement of the pipeline safety regulations. It allows PHMSA to:
Provide the regulatory certainty necessary for pipeline owners and operators to plan infrastructure investments and create jobs
Improve pipeline transportation by strengthening enforcement of current laws and improving existing laws where necessary
Ensure a balanced regulatory approach to improving safety that applies cost-benefit principles
Protect and preserve Congressional authority by ensuring certain key rule-makings are not finalized until Congress has an opportunity to act
2. Federal Pipeline Safety Regulations: Public Awareness Programs
Enforced by PHMSA, the Public Awareness Program mandates that pipeline companies and operators to develop and implement public awareness programs that follow guidance provided by the American Petroleum Institute.
Under this regulation, pipeline operators must provide the public with information on how to recognize, respond, and report to pipeline emergencies.
3. Natural Gas Pipeline Safety Act of 1968
This act authorizes the Department of Transportation to regulate pipeline transportation of flammable, toxic, or corrosive natural gas, or other gases, as well as transportation and storage of liquefied natural gas.
The PHMSA also designed an interactive national pipeline mapping system for the public to access and utilize. However, the map can only be viewed one county at a time, it does not include distribution or gathering lines, and when you zoom in too far, the pipelines disappear. In fact, the site warns that the map should not be used to determine accurate locations of pipelines, stating that the locations can be incorrect by up to 500 ft. PHMSA argues that these restrictions exist in the interest of national security.
C. United States Army Corps of Engineers
Permits must be obtained from the U.S. Army Corps of Engineers if a pipeline is to be constructed through navigable bodies of water, including wetlands. State environmental regulatory agencies, such as PA’s Department of Environmental Protection, are also involved in the approval process of pipeline construction through waterways and wetlands.
Environmental Health and Safety Risks
Although pipeline transportation of natural gas and petroleum is considered safer and cheaper than ground transportation, pipeline failures, failing infrastructure, human error, and natural disasters can result in major pipeline disasters. As such, previous incidents have been shown to cause detrimental effects to the environment and the public’s safety.
A. Land Use and Forest Fragmentation
Construction staging area and the right-of-way of Columbia’s 26″ Pipeline. Photo credit: Sierra Shamer
In order to bury pipelines underground, an extensive amount of forest and land is cleared out to meet the pipe’s size capacity. States, such as Pennsylvania, that consist of rich ecosystem due to their abundance of forests, are at critical risk of diminishing habitats for plant species, and are at risk of the eradication of certain animal species. The U.S. Geological Survey (USGS) aimed to quantify the amount of land disturbance in Bradford and Washington counties in PA as a result of oil and gas activity including pipeline implementation. The USGS report concluded that pipeline construction was one of the highest sources of increasing forest patch numbers. Bradford County, PA had an increase of 306 patches, in which 235 were attributable to pipeline construction. Washington County increased by 1,000 patches, in which half was attributable to pipeline construction.
B. Compressor Stations
Compressor stations play an important role in processing and transporting the materials that pass through the pipeline. However, compressor stations present significant environmental health hazards. Even when the process of drilling and fracking is completed, compressor stations remain in the area to keep the gas in pipelines continually flowing. The stationary nature of this air pollution source means that a combination of pollutants such as volatile organic compounds (VOCs), nitrogen oxides (NOx), formaldehyde, and greenhouse gases are continually being released into the atmosphere. These pollutants are known to produce deleterious health impacts to the respiratory system, nervous system, or lung damage. In addition to pollutants emitted, the noise level generated by compressor stations can reach up to 100 decibels. The Center of Disease Control and Prevention (CDC) reports hearing loss can occur by listening to sounds at or above 85 decibels over an extended period of time.
C. Erosion and Sedimentation
Heavy rainfall or storms can lead to excessive soil disruption, in turn increasing opportunities for erosion and sedimentation to occur. Erosion can uncover pipelines buried underground, and rainfall of more than 5 inches (13 cm) can move or erode berms, and also disrupt mounds of soil used to protect against flooding. Soil erosion increases underground pipelines’ vulnerability to damage from scouring or washouts, and damage from debris, vehicles, or boats.
D. Eminent Domain
Eminent domain allows state or federal government bodies to exercise their power to take private property from residents or citizens for public use and development. In some cases, private companies have exercised power to seize land for their own profit. Owners of the property are then given a compensation in exchange for their land. However, landowners may end up spending more than they receive. In order to receive compensation, owners must hire their own appraiser and lawyer, and they are also not usually compensated for the full value of the land. Furthermore, property values decrease once pipelines are established on their land, making it more difficult to sell their home in the future.
E. Spills and Leaks
Poorly maintained and faulty pipelines that transport liquefied natural gas or crude oil may pose high health and environmental risks should the fluids spill or leak into the soil. Crude oil can contain more than 1,000 chemicals that are known carcinogen to humans, such as benzene. The release of the potentially toxic chemical or oil can infiltrate into the soil, exposing communities to fumes in the atmosphere as well as contaminating groundwater and surface water. Not only are the incidents costly to control and clean up, the chemical or oil spills can also have long lasting impacts to the environment and the public. A ruptured pipeline that leaked 33,000 gallons of crude oil in Salt Lake City, Utah in 2010 exposed residents in a nearby community to chemical fumes, causing them to experience drowsiness and lethargy. After being commissioned in 2010, the TransCanada Keystone Pipeline had reported 35 leaks and spills in its first year alone. In April 2016, the Keystone pipeline leaked 17,000 gallons of oil in South Dakota. Older pipelines are more likely to leak than newer ones, so this issue will only increase as pipeline infrastructure ages.
Natural gas pipelines have also been shown to leak methane, a major component in natural gas, at levels that far exceed what is estimated. Not only does methane contribute to climate change, it puts surrounding communities at risk of gas explosions, and exposes them to dangerously high levels of methane in the air they breathe.
F. Explosions
Pipeline warning sign in Texas. Photo credit: Ecologic Institute US
Explosions are also common with faulty pipelines that leak natural gas. Unlike oil or liquid spills, which generally spread and infiltrate into the soil, gas leaks can explode due to the hydrocarbon’s volatility. A recent pipeline explosion in Westmoreland County, PA, for example, caused a man to incur severe burns, as well as caused dozens of homes to be evacuated. Another pipeline explosion in San Bruno, California resulted in 8 people dead, 6 missing, and 58 injured. Thirty-eight homes were also destroyed and 70 others were damaged. This explosion exposed the haphazard system of record keeping for the tens of thousands of miles of gas pipelines, shoddy construction, and inspection practices.
Upcoming Proposed Projects
An estimated 4,600 miles of new interstate pipelines will be completed by 2018. Below are just a few major projects that are currently being proposed or are in the process of obtaining a permit.
This pipeline will include 194 miles throughout the state of Pennsylvania. It will be constructed to cut through portions of 10 different PA counties, including Columbia, Lancaster, Lebanon, Luzerne, Northumberland, Schuylkill, Susquehanna, Wyoming, Clinton, and Lycoming. This project will require a 125-foot ROW, and will traverse through 52 areas designed as “protected land” in Pennsylvania. This proposed project is still in review by FERC – a decision is expected late 2016 or early 2017.
Spectra Energy (Houston), DTE Energy (Detroit), and Enbridge Inc. (Canada) are partnering to build a $2 billion gas line that would travel from eastern Ohio to Michigan to Ontario. Already applied with FERC and will start construction early 2017. It proposed a 255-mile pipeline and will be 36-inch wide line.
This pipeline will expand the existing pipeline’s capacity from 70,000 barrels a day to 345,000. It has plans to deliver propane, butane, ethane, and other natural gas liquids across state to Delaware, Berks, and Lebanon counties in PA. Currently, the construction is delayed due to push back and permits acquisition.
This project was intended to expand an existing pipeline by 420 miles from Susquehanna County, Pennsylvania and passing through New York, Massachusetts, New Hampshire, and Connecticut. Recently in April 2016, Kinder Morgan decided to suspend further development of this proposed pipeline.
The Atlantic Coast Pipeline had initial plans to establish 550 miles of pipeline from West Virginia to North Carolina, and to cut through dozens of Chesapeake headwater streams, two national forests, and across Appalachian Trail. Their permit to construct this pipeline was denied by the US Forest Service on January 2016; thus, delaying the project at the moment.
With approval by FERC, Spectra Energy has begun 37 miles of pipeline construction through New York, Connecticut, and Massachusetts. The pipeline location is particularly worrisome because it is critically close to the Indian Point nuclear power plant. Ruptures or leaks from the pipeline can threaten the public’s safety, and even result in a power plant meltdown. Spectra Energy has also submitted two additional proposals: the Atlantic Bridge and Access Northeast. Both projects will expand the Algonquin pipeline to reach New England, and both are still in the approval process with FERC.
The Constitution pipeline had initially planned to include 124 miles from Susquehanna County, Pennsylvania to Schoharie County, New York, and was denied by NY State in April 2016.
Preview of North America proposed pipelines map. Click to view fullscreen.
Further Questions
Please email us at info@fractracker.org if there are any unanswered questions you would like us to answer or include.
Update: this article was edited on June 21, 2016 due to reader feedback and suggestions.
https://www.fractracker.org/a5ej20sjfwe/wp-content/uploads/2016/06/Pipeline-Feature.jpg400900FracTracker Alliancehttps://www.fractracker.org/a5ej20sjfwe/wp-content/uploads/2025/09/2025-Wordmark-Logo.pngFracTracker Alliance2016-06-14 16:01:022020-03-12 13:32:32An Introduction to Oil and Gas Pipelines
By Kirk Jalbert, Manager of Community-Based
Research & Engagement, FracTracker Alliance
Missing the Mark in Oil & Gas Communities
Conventional oil and gas drilling for commercial purposes has existed in Pennsylvania for over 150 years. In the past decade, drilling operations have turned to extract these resources from unconventional reservoirs, such as the deep underground Marcellus Shale formation. Proponents of the oil and gas industry’s expansion promise jobs and tax revenue for regions seeking economic revitalization. However, a growing body of research suggests that these processes also negatively impact the environment and pose significant public health risks.
According to the U.S. Environmental Protection Agency, environmental justice is the fair treatment and meaningful involvement of all people regardless of race, color, national origin, or income with respect to the development, implementation, and enforcement of environmental laws, regulations, and policies. How this definition applies to residents of Pennsylvania has become a hotly contested issue as regulatory agencies have begun to investigate whether or not the oil and gas industry targets marginalized communities.
PA Environmental Justice Map
The following interactive article and map illustrates how race and poverty, the two key indicators for determining environmental justice eligibility, fail to capture the nature of the industry. It also suggests that there are other ways we might assess unfair development practices. In doing so, the goal of the article is to shed light on the complexity of environmental justice issues and to offer guidance as PA’s Department of Environmental Protection (DEP) assesses its policies in coming days.
CA Crude by Rail, from the Bakken Shale and Canada’s Tar Sands to California Refineries By Kyle Ferrar, Western Program Coordinator & Kirk Jalbert, Manager of Community Based Research & Engagement
Refineries in California plan to increase capacity and refine more Bakken Shale crude oil and Canadian tar sands bitumen. However, CA’s refinery communities that already bear a disparate amount of the burden (the refinery corridor along the north shore of the East Bay) will be more impacted than they were previously. New crude-by-rail terminals will put additional Californians at risk of accidents such as spills, derailments, and explosions. Additionally, air quality in refinery communities will be further degraded as refineries change to lower quality sources of crude oil. Below we discuss where the raw crude oil originates, why people are concerned about crude-by-rail projects, and what CA communities are doing to protect themselves. We also discuss our GIS analysis, showing the number of Californians living within the half-mile blast zones of the rail lines that currently are or will be supported by the new and existing crude by rail terminal projects.
Sources of Raw Crude Oil
Figure 1. Sources of crude oil feedstock refined in California over time (CA Energy Commission, 2015)
California’s once plentiful oil reserves of locally extracted crude are dwindling and nearing depletion. Since 1985, crude extraction in CA has dropped by half. Production from Alaska has dropped even more, from 2 million B/D (barrels per day) to around 500,000 B/D. The 1.9 million B/D refining capacity in CA is looking for new sources of fuels. Refineries continue to supplement crude feedstock with oil from other sources, and the majority has been coming from overseas, specifically Iraq and Saudi Arabia. This trend is shown in figure 1.
Predictions project that sources of raw crude oil are shifting to the energy intensive Bakken formation and Canadian Tar Sands. The Borealis Centre estimates an 800% increase of tar sands oil in CA refineries over the next 25 years (NRDC, 2015). The increase in raw material from these isolated locations means new routes are necessary to transport the crude to refineries. New pipelines and crude-by-rail facilities would be necessary, specifically in locations where there are not marine terminals such as the Central Valley and Central Coast of CA. The cheapest way for operators in the Canadian Tar Sands and North Dakota’s Bakken Shale to get their raw crude to CA’s refinery markets is by railroad (30% less than shipping by marine routes from ports in Oregon and Washington), but this process also presents several issues.
CA Crude by Rail
More than 1 million children — 250,000 in the East Bay — attend school within one mile of a current or proposed oil train line (CBD, 2015). Using this “oil train blast zone” map developed by ForestEthics (now called Stand) you can explore the various areas at risk in the US if there was an oil train explosion along a rail line. Unfortunately, there are environmental injustices that exist for communities living along the rail lines that would be transporting the crude according to another ForestEthics report.
The specific focus of the map in Figure 2 is the five proposed and eight existing crude-by-rail terminals that allow oil rail cars to unload at the refineries. The eight existing rail terminals have a combined capacity of 496,000 barrels. Combined, the 15 terminals would increase CA’s crude imports to over 1 million B/D by rail. The currently active terminals are shown with red markers. Proposed terminals are shown with orange markers, and inactive terminals with yellow markers. Much of the data on terminals was taken from the Oil Change International Crude by Rail Map, which covers the entire U.S.
The same type of facility is currently operating in the East Bay’s refinery corridor in Richmond, CA. The Kinder Morgan Richmond terminal was repurposed from handling ethanol to crude oil, but with no public notice. The terminal began operating without conducting an Environmental Impact Report (EIR) or public review of the permit. Unfortunately, this anti-transparent process was similar to a tactic used by another facility in Kern County. The relatively new (November 2014) terminal in Taft, CA operated by Plains All American Pipeline LLC also did not conduct an EIR, and the permit is being challenged on the grounds of not following the CA Environmental Quality Act (CEQA).
EIRs are an important component of the permitting process for any hydrocarbon-related facility. In April 2015 in Pittsburg, for example, a proposed 50,000 B/D terminal at the WesPac Midstream LLC’s railyard was abandoned due to community resistance and criticism over the EIR from the State Attorney General, along with the larger proposal of a 192,000 B/D marine terminal.
Crude-by-rail terminals bring with them not only the threat of derailments and the risk of other such accidents, but the terminals are also a source of air emissions. Terminals – both rail and marine – are major sources of PAH’s (polycyclic aromatic hydrocarbons). The Sacramento Valley Railroad (SAV) Patriot rail oil terminal at a business park on the former McClellan Air Force Base property actually had its operating permit withdrawn by Sacramento air quality regulators due to this issue (read more). The terminal was unloading and reloading oil tanker cars.
FracTracker’s recent report, Emissions in the Refinery Corridor, shows that the refineries in this region are the major point source for emissions of both cancer and non-cancer risk drivers in the region. These air pollution sources get worse, however. According to the report by NRDC, changing the source of crude feedstock to increased amounts of Canadian Tar Sands oil and Bakken Shale oil would:
… increase the levels of highly toxic fugitive emissions; heavy emissions of particulate, metals, and benzene; result in a higher risk of refinery accidents; and the accumulation of petroleum coke* (a coal-like, dusty byproduct of heavy oil refining linked to severe respiratory impacts). This possibility would exacerbate the harmful health effects faced by the thousands of low-income families that currently live around the edges of California’s refineries. These effects are likely to include harmful impacts to eyes, skin, and the nervous and respiratory systems. Read NRDC Report
The contribution to climate change from accessing the tar sands also needs to be considered. Extracting tar sands is estimated to release on average 17% average more green-house gas (GHG) emissions than conventional oil extraction operations in the U.S., according to the U.S. Department of State. (Greenhouse gases are gases that trap heat in the atmosphere, contributing to climate change on a global scale.) The refining process, too, has a larger environmental / public health footprint; refining the tar sands to produce gasoline or diesel generates an average of 81% more GHGs (U.S. Dept of State. Appendix W. 2015). In total this results in a much larger climate impact (NRDC, NextGen Climate, Forest Ethics. 2015).
Local Fights
People opposed to CA crude by rail have been fighting the railway terminal proposals on several fronts. In Benicia, Valero’s proposal for a rail terminal was denied by the city’s Planning Commission, and the project’s environmental impact report was denied, as well. The city of Benicia, however, hired lawyers to ensure that the railway projects are built. The legality of railway development is protected regardless of the impacts of what the rails may be used to ship. This legal principle is referred to as “preemption,” which means the federal permitting prevents state or local actions from trying to limit or block development. In this case, community and environmental advocacy groups such as Communities for a Better Environment, the Natural Resources Defense Council, and the Stanford-Mills Law Project all agree the “preemption” doctrine doesn’t apply here. They believe preemption does not disallow the city or other local governments from blocking land use permits for the refinery expansion and crude terminals that unload the train cars at the refinery. The Planning Commission’s decision is being appealed by Valero, and another meeting is scheduled for September, 2016.
The fight for local communities along the rail-lines is more complicated when the refinery is far way, under the jurisdiction of other municipalities. Such is the case for the Phillips 66 Santa Maria Refinery, located on California State Highway 1 on the Nipomo Mesa. The Santa Maria refinery is requesting land use permits to extend track to the Union Pacific Railway that transits CA’s central coast. The extension is necessary to bring the rail cars to the proposed rail terminal. This project would not just increase traffic within San Luis Obispo, but for the entirety of the rail line, which passes directly through the East Bay. The project would mean an 80-car train carrying 2 million gallons of Bakken Crude would travel through the East Bay from Richmond through Berekely and Emeryville to Jack London Square and then south through Oakland and the South Bay. This would occur 3 to 5 times per week. In San Luis Obispo county 88,377 people live within the half-mile blast zone of the railroad tracks.
In January, the San Luis Obispo County Planning Department proposed to deny Phillips 66 the permits necessary for the rail spur and terminals. This decision was not easy, as Phillips 66, a corporation ranked Number 7 on the Fortune 500 list, has fought the decision. The discussion remained open with many days of meetings, but the majority of the San Luis Obispo Planning Commission spoke in favor of the proposal at a meeting Monday, May 16. There is overwhelming opposition to the rail spur project coming from 250 miles away in Berkeley, CA. In 2014, the Berkeley and Richmond city councils voted to oppose all transport of crude oil through the East Bay. Without the rail spur approval, Phillips 66 declared the Santa Maria refinery would otherwise transport oil from Kern County via 100 trucks per day. Learn more about this project.
GIS Analysis
GIS techniques were used to estimate the number of Californians living in the half mile “at risk” blast zone in the communities hosting the crude-by-rail lines. First, we estimated the total population of Californians living a half mile from the BNSF and UP rail lines that could potentially transport crude trains. Next, we limited our study area to just the East Bay refinery corridor, which included Contra Costa and the city of Benicia in Solano County. Then, we estimated the number of Californians that would be living near rail lines if the Phillips 66 Santa Maria refinery crude by rail project is approved and becomes operational. The results are shown below:
Population living within a half mile of rail lines throughout all of California: 6,900,000
Population living within a half mile of rail lines in CA’s East Bay refinery communities: 198,000
Population living within a half mile of rail lines along the UP lines connecting Richmond, CA to the Phillips 66 Santa Maria refinery: 930,000
By Brook Lenker, Executive Director, FracTracker Alliance
Frac sand mining is a growing threat to the agricultural landscapes of the upper Midwest and a health risk to those who live near the mines. With a general slowdown in the oil and gas industry, sand mining may seem a lessening concern in the universe of extraction impacts, but a recent visit to Wisconsin during Earth Week suggested otherwise.
Frac Sand Mining Presentations
Dr. Auch presenting in Wisconsin on frac sand mining issues
I joined my colleague, Dr. Ted Auch, on an informative cross-state tour that started in Milwaukee. We were presenters at the Great Lakes Water Conservation Conference where representatives from breweries around the region and across the country came together to discuss their most precious commodity: clean and abundant water. Extraction affects both the quantity and quality of water – and our insights opened many eyes. Businesses like microbreweries with a focus on sustainability and a strong environmental ethic recognize the urgency and benefit of the renewable energy transformation.
From Milwaukee, we headed west to Madison and the University of Wisconsin where Caitlin Williamson of the Wisconsin Chapter of the Society for Conservation Biology organized the first of two forums entitled “Sifting the Future: The Ecological, Agricultural, and Health Effects of Frac Sand Mining in Wisconsin.” We were joined by Kimberlee Wright of Midwest Environmental Advocates to address an engaged audience of 35 people from the campus and greater community. Thanks to Wisconsin Eye, a public affairs network, the entire program was videotaped.
Brook Lenker presenting at Sifting the Future event in Wisconsin
A long drive to Eau Claire revealed rolling farmland, wooded hills, and prodigious wetlands home to waterfowl and the largest cranberry industry in the nation. At the Plaza Hotel, we met Cheryl Miller of the Save the Hills Alliance, the grantor enabling us to study the regional footprint of sand mining, and Pat Popple, advocate extraordinaire and our host for the second “Sifting the Future” event. The good folks at Public Lab were also in town to facilitate citizen monitoring of silica dust from the mining process, including a free workshop and training that weekend.
The evening program attracted 50 people from as far away as Iowa and Minnesota. Their interest in and knowledge of sand mining issues was impressive, and many were heavily involved in fighting local mines. Dr. Crispin Pierce spoke of his research about airborne particulates around frac sand operations, complementing both FracTracker presentations – mine emphasizing the broad array of environmental and public health perils related to oil and gas extraction and Ted’s examining the scale and scope of sand mining, demand for proppant, and the toll of the industry on agricultural productivity, forests and the carbon cycle.
Mining Photos
During the five day trip, sand mines were visited and documented, their incongruent and expanding presence marring the countryside. Some of them can be seen in this photo gallery:
On Earth Day, while driving east to return to Milwaukee, Sandhill cranes, a timeless symbol of the Wisconsin wild, poked the rich prairie soils searching for food. Joined by Autumn Sabo, a botanist and researcher who assisted our Wisconsin work, we detoured to the nearby Aldo Leopold Center visiting the simple shack that inspired Mr. Leopold to write Sand County Almanac. Considering the reason for my travel, the irony was thick. Ecological consciousness has come a long way, but more evangelism is sorely needed.
Aldo Leopold Center, Wisconsin
https://www.fractracker.org/a5ej20sjfwe/wp-content/uploads/2016/05/WITour-Feature.jpg400900Guest Authorhttps://www.fractracker.org/a5ej20sjfwe/wp-content/uploads/2025/09/2025-Wordmark-Logo.pngGuest Author2016-05-05 15:36:252020-03-11 17:07:10Earth Week in Wisconsin
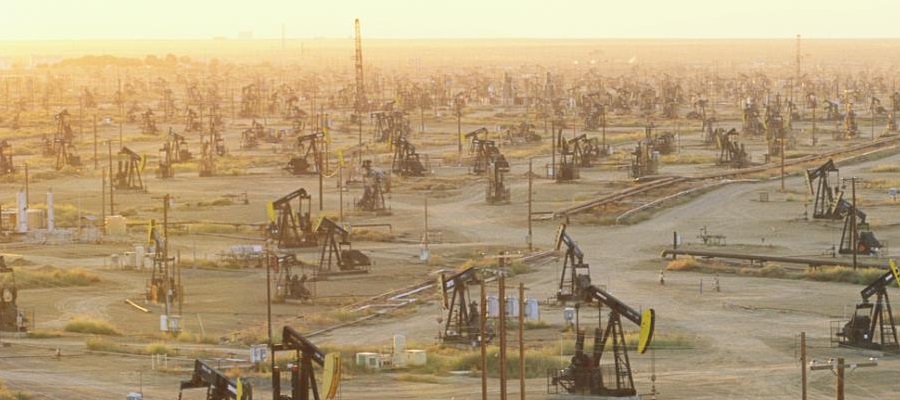
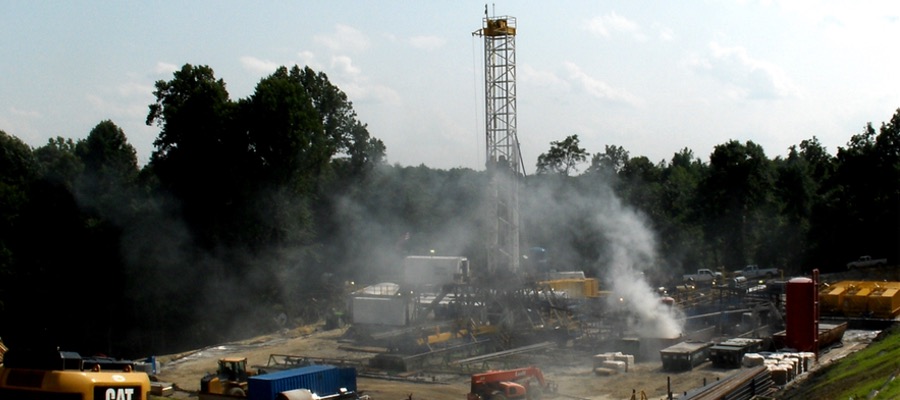
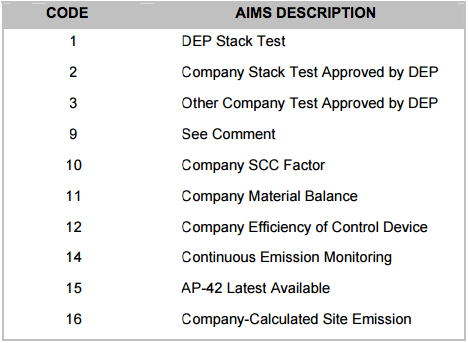
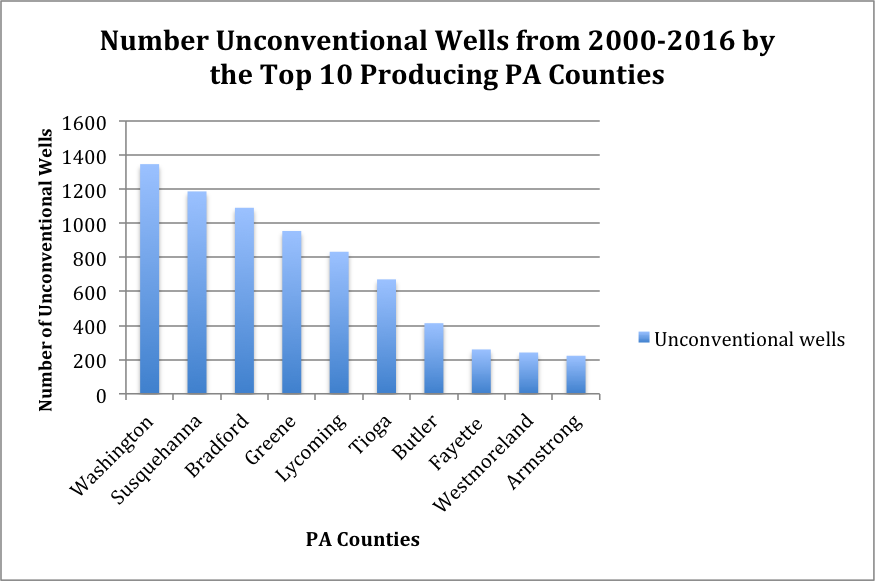
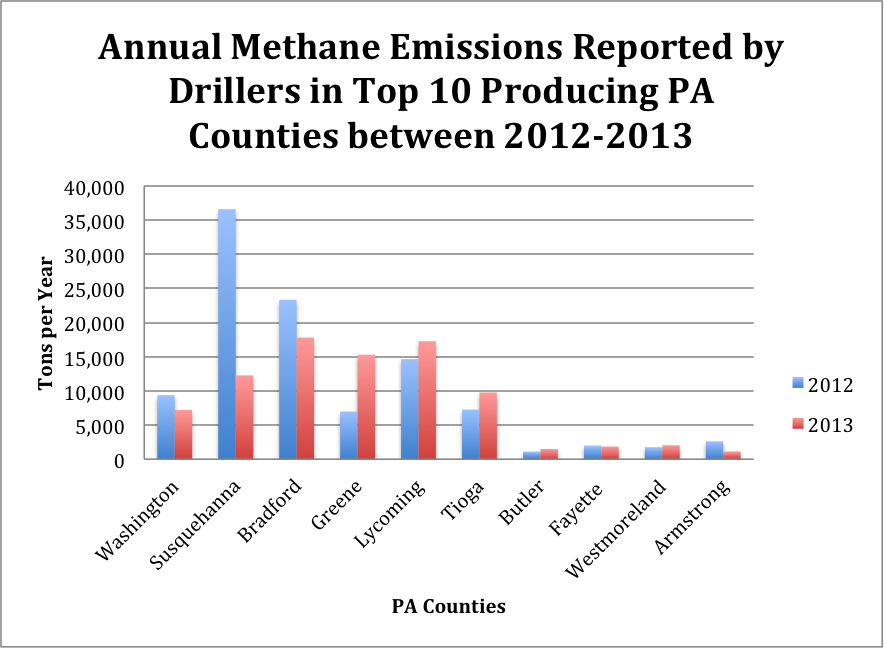
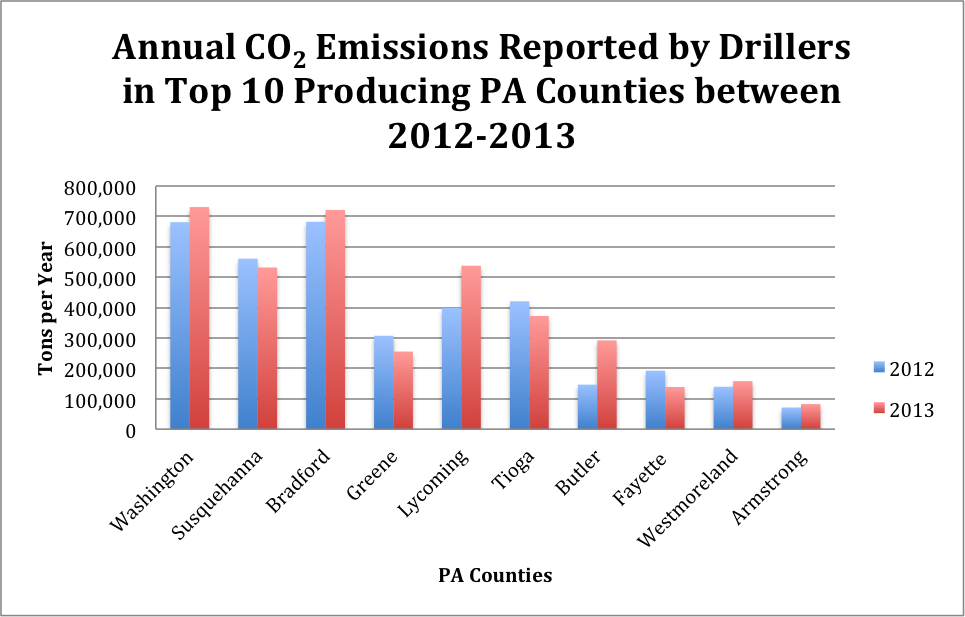
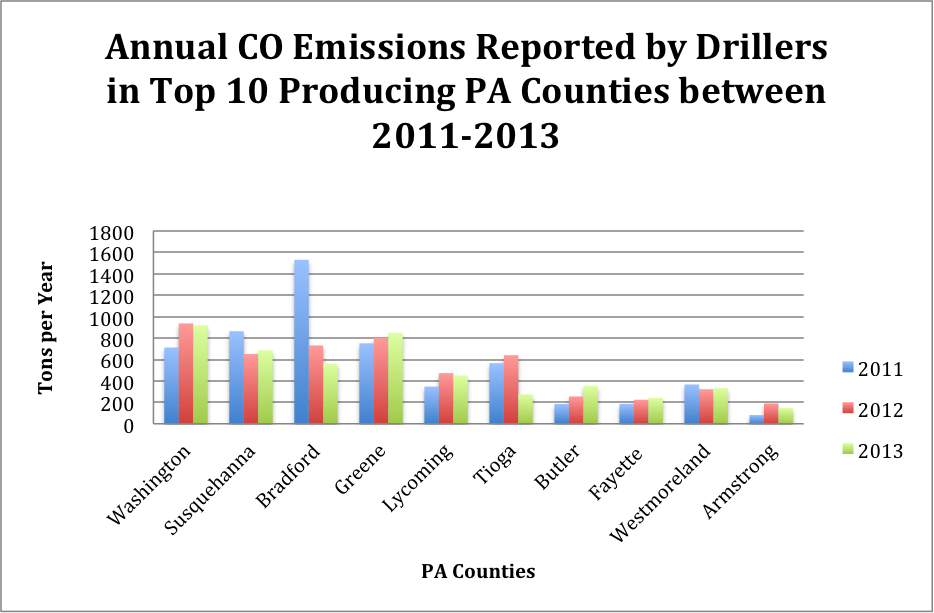
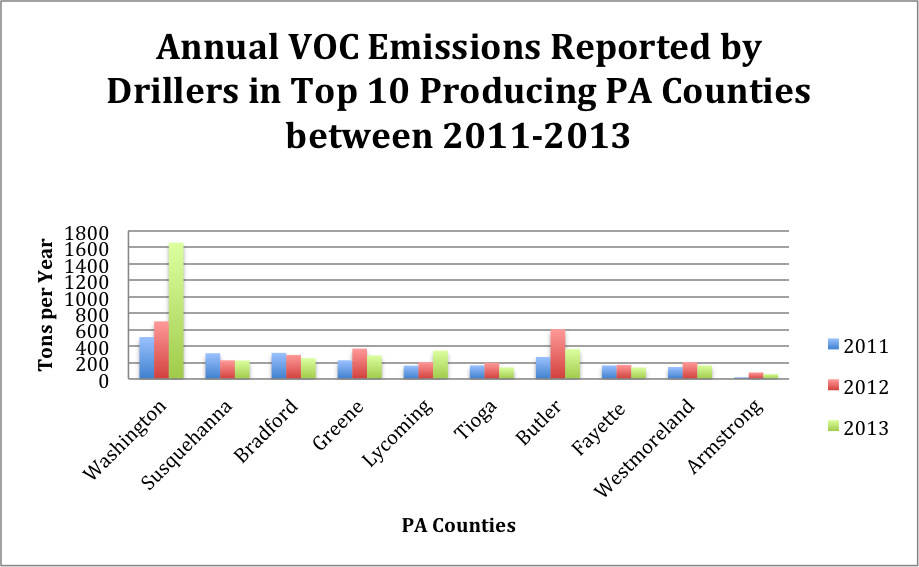
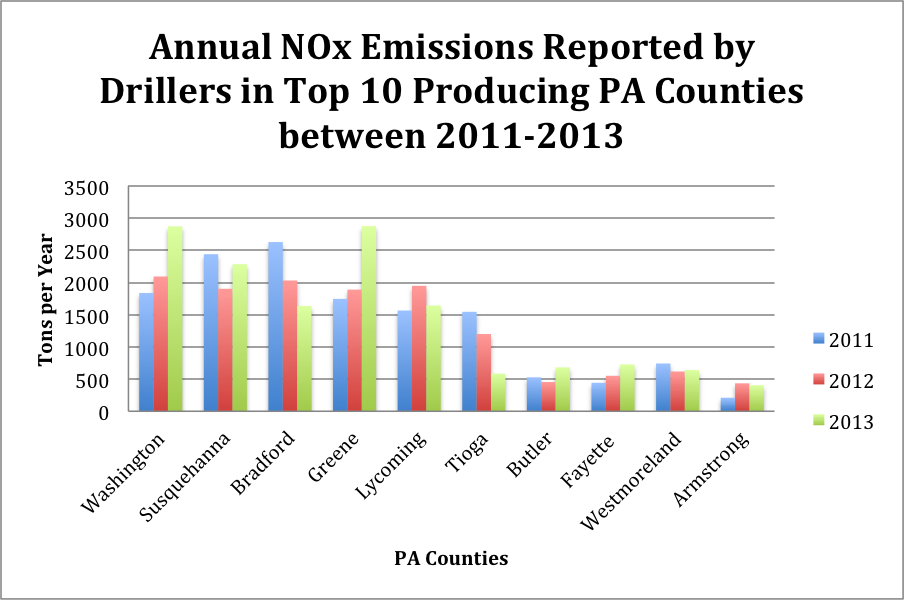
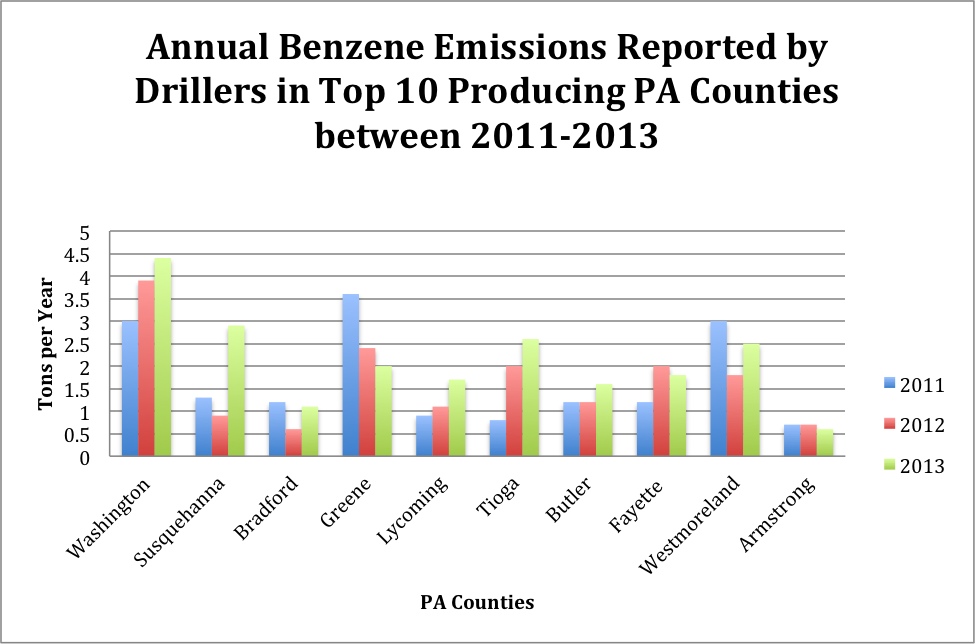
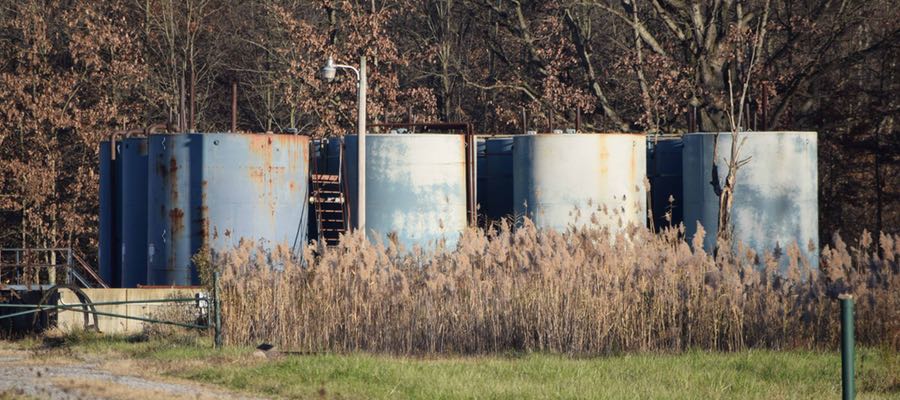
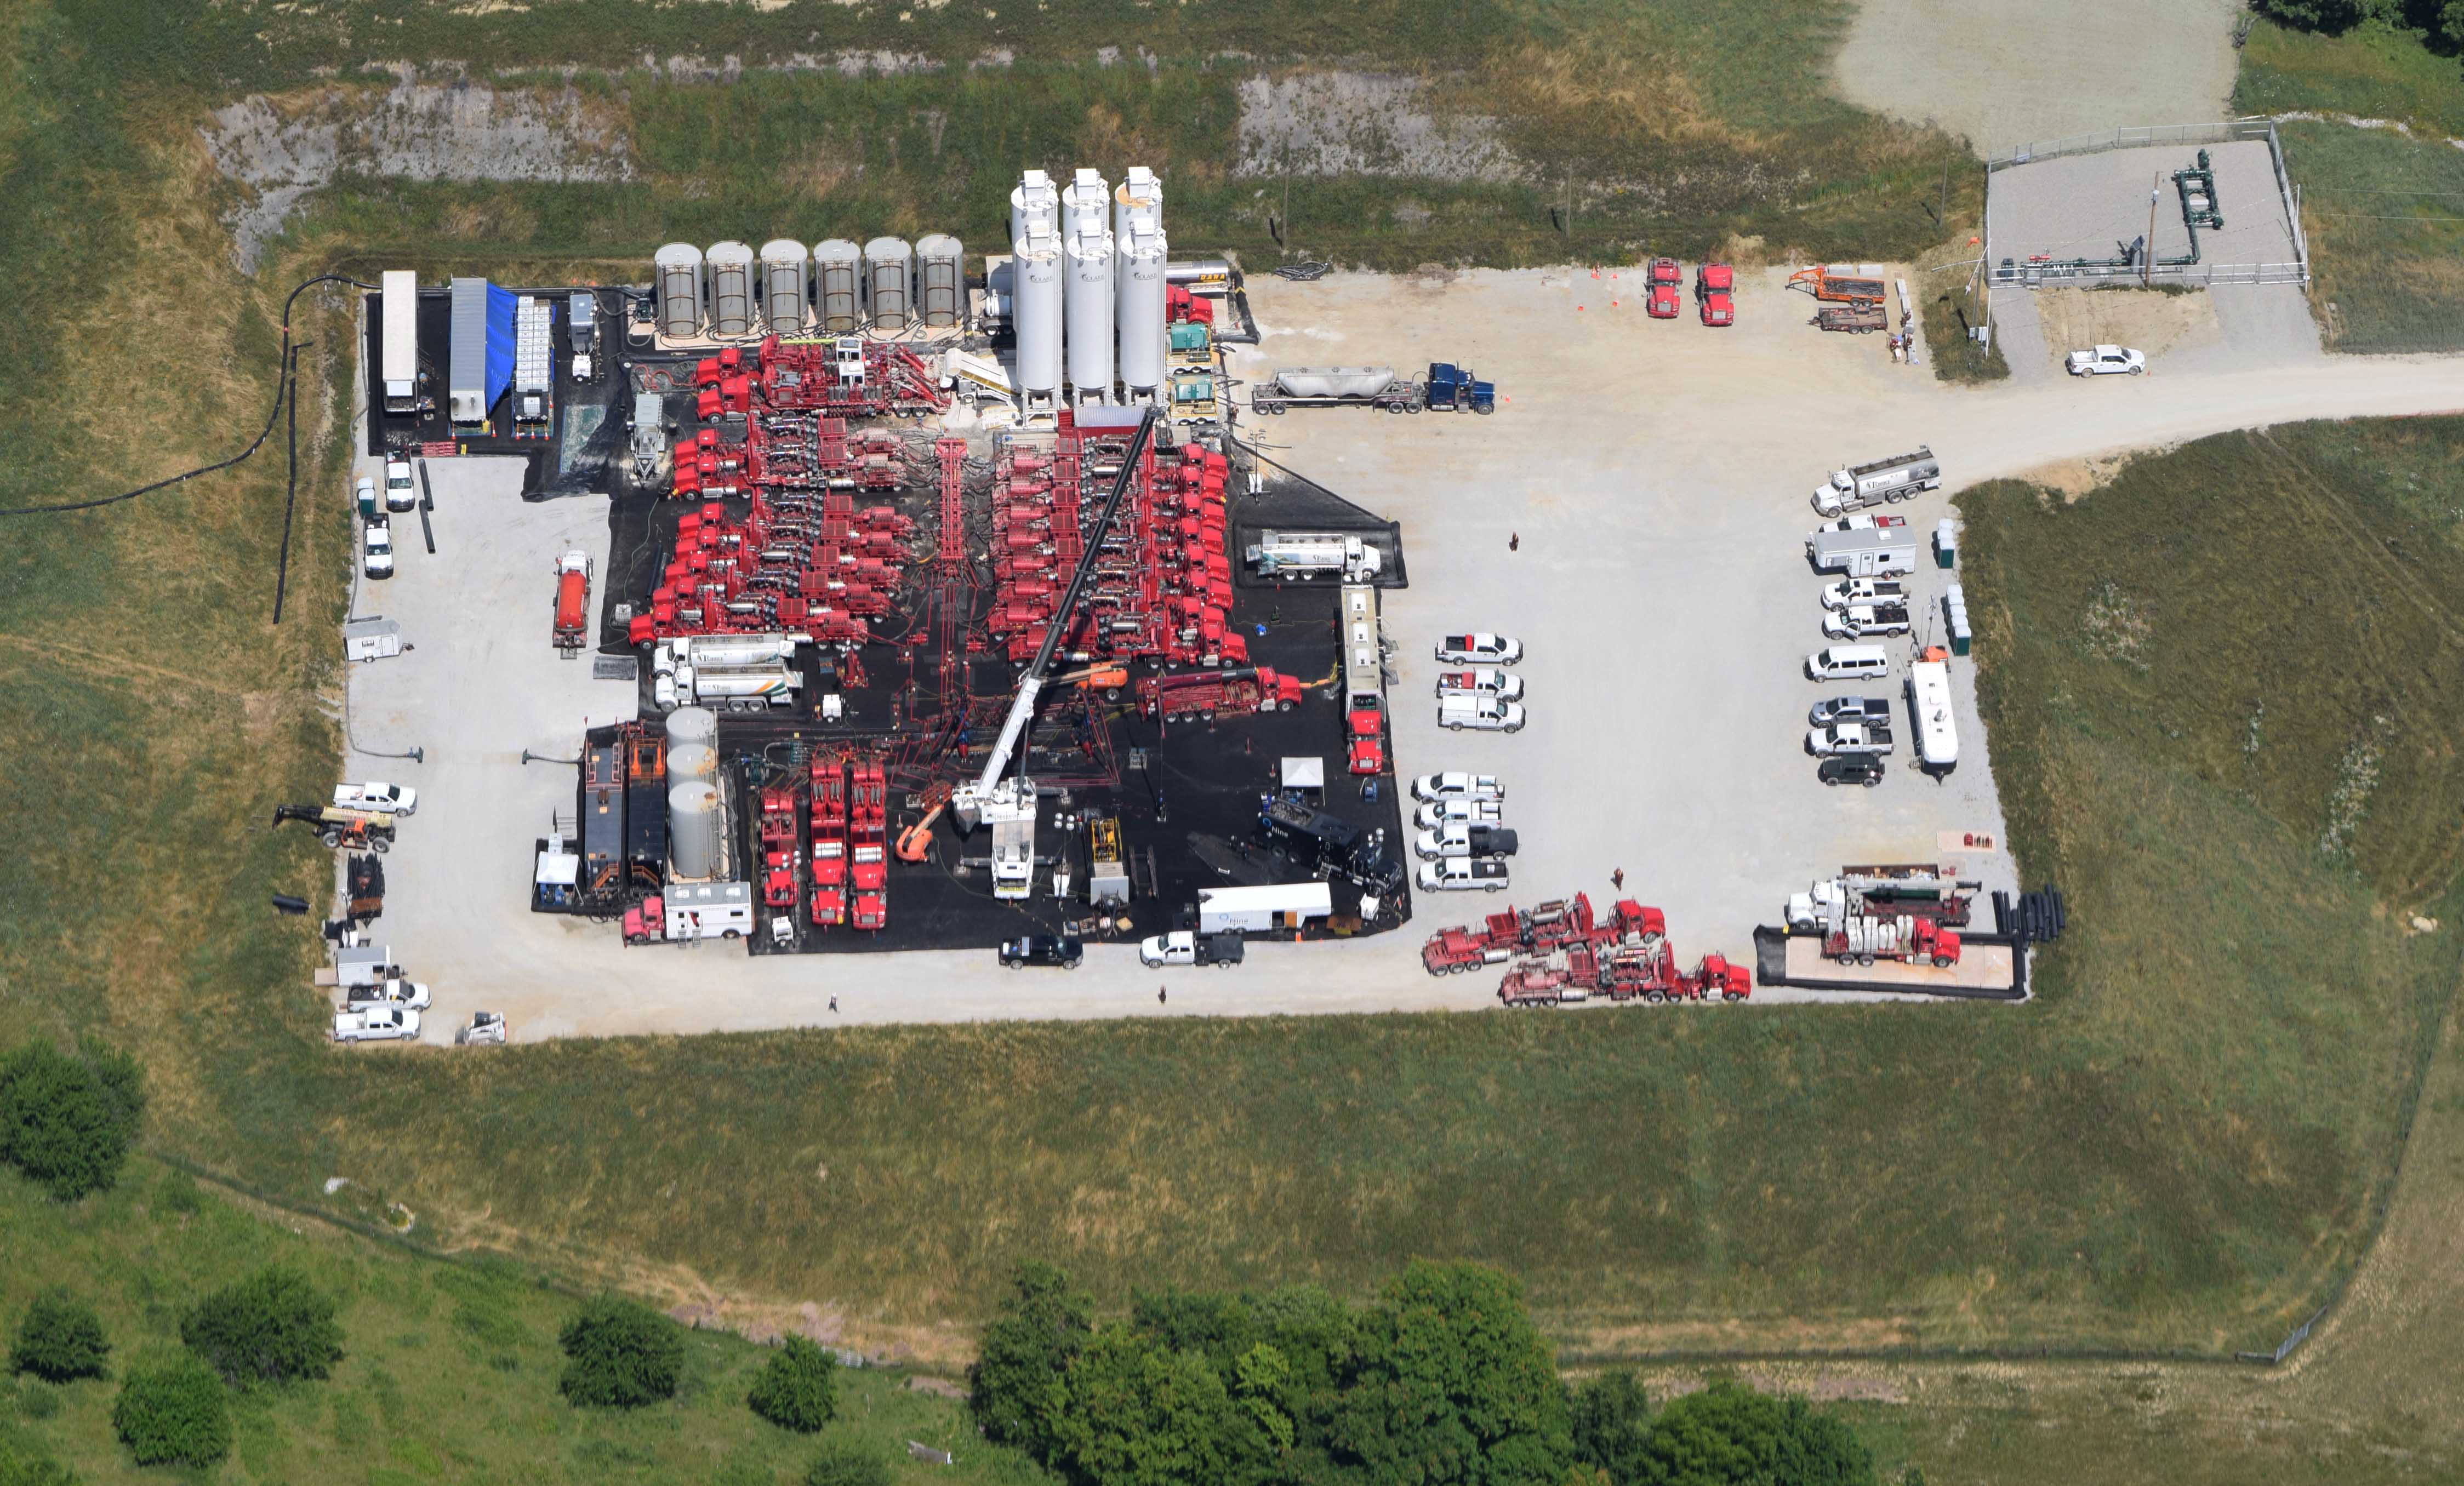


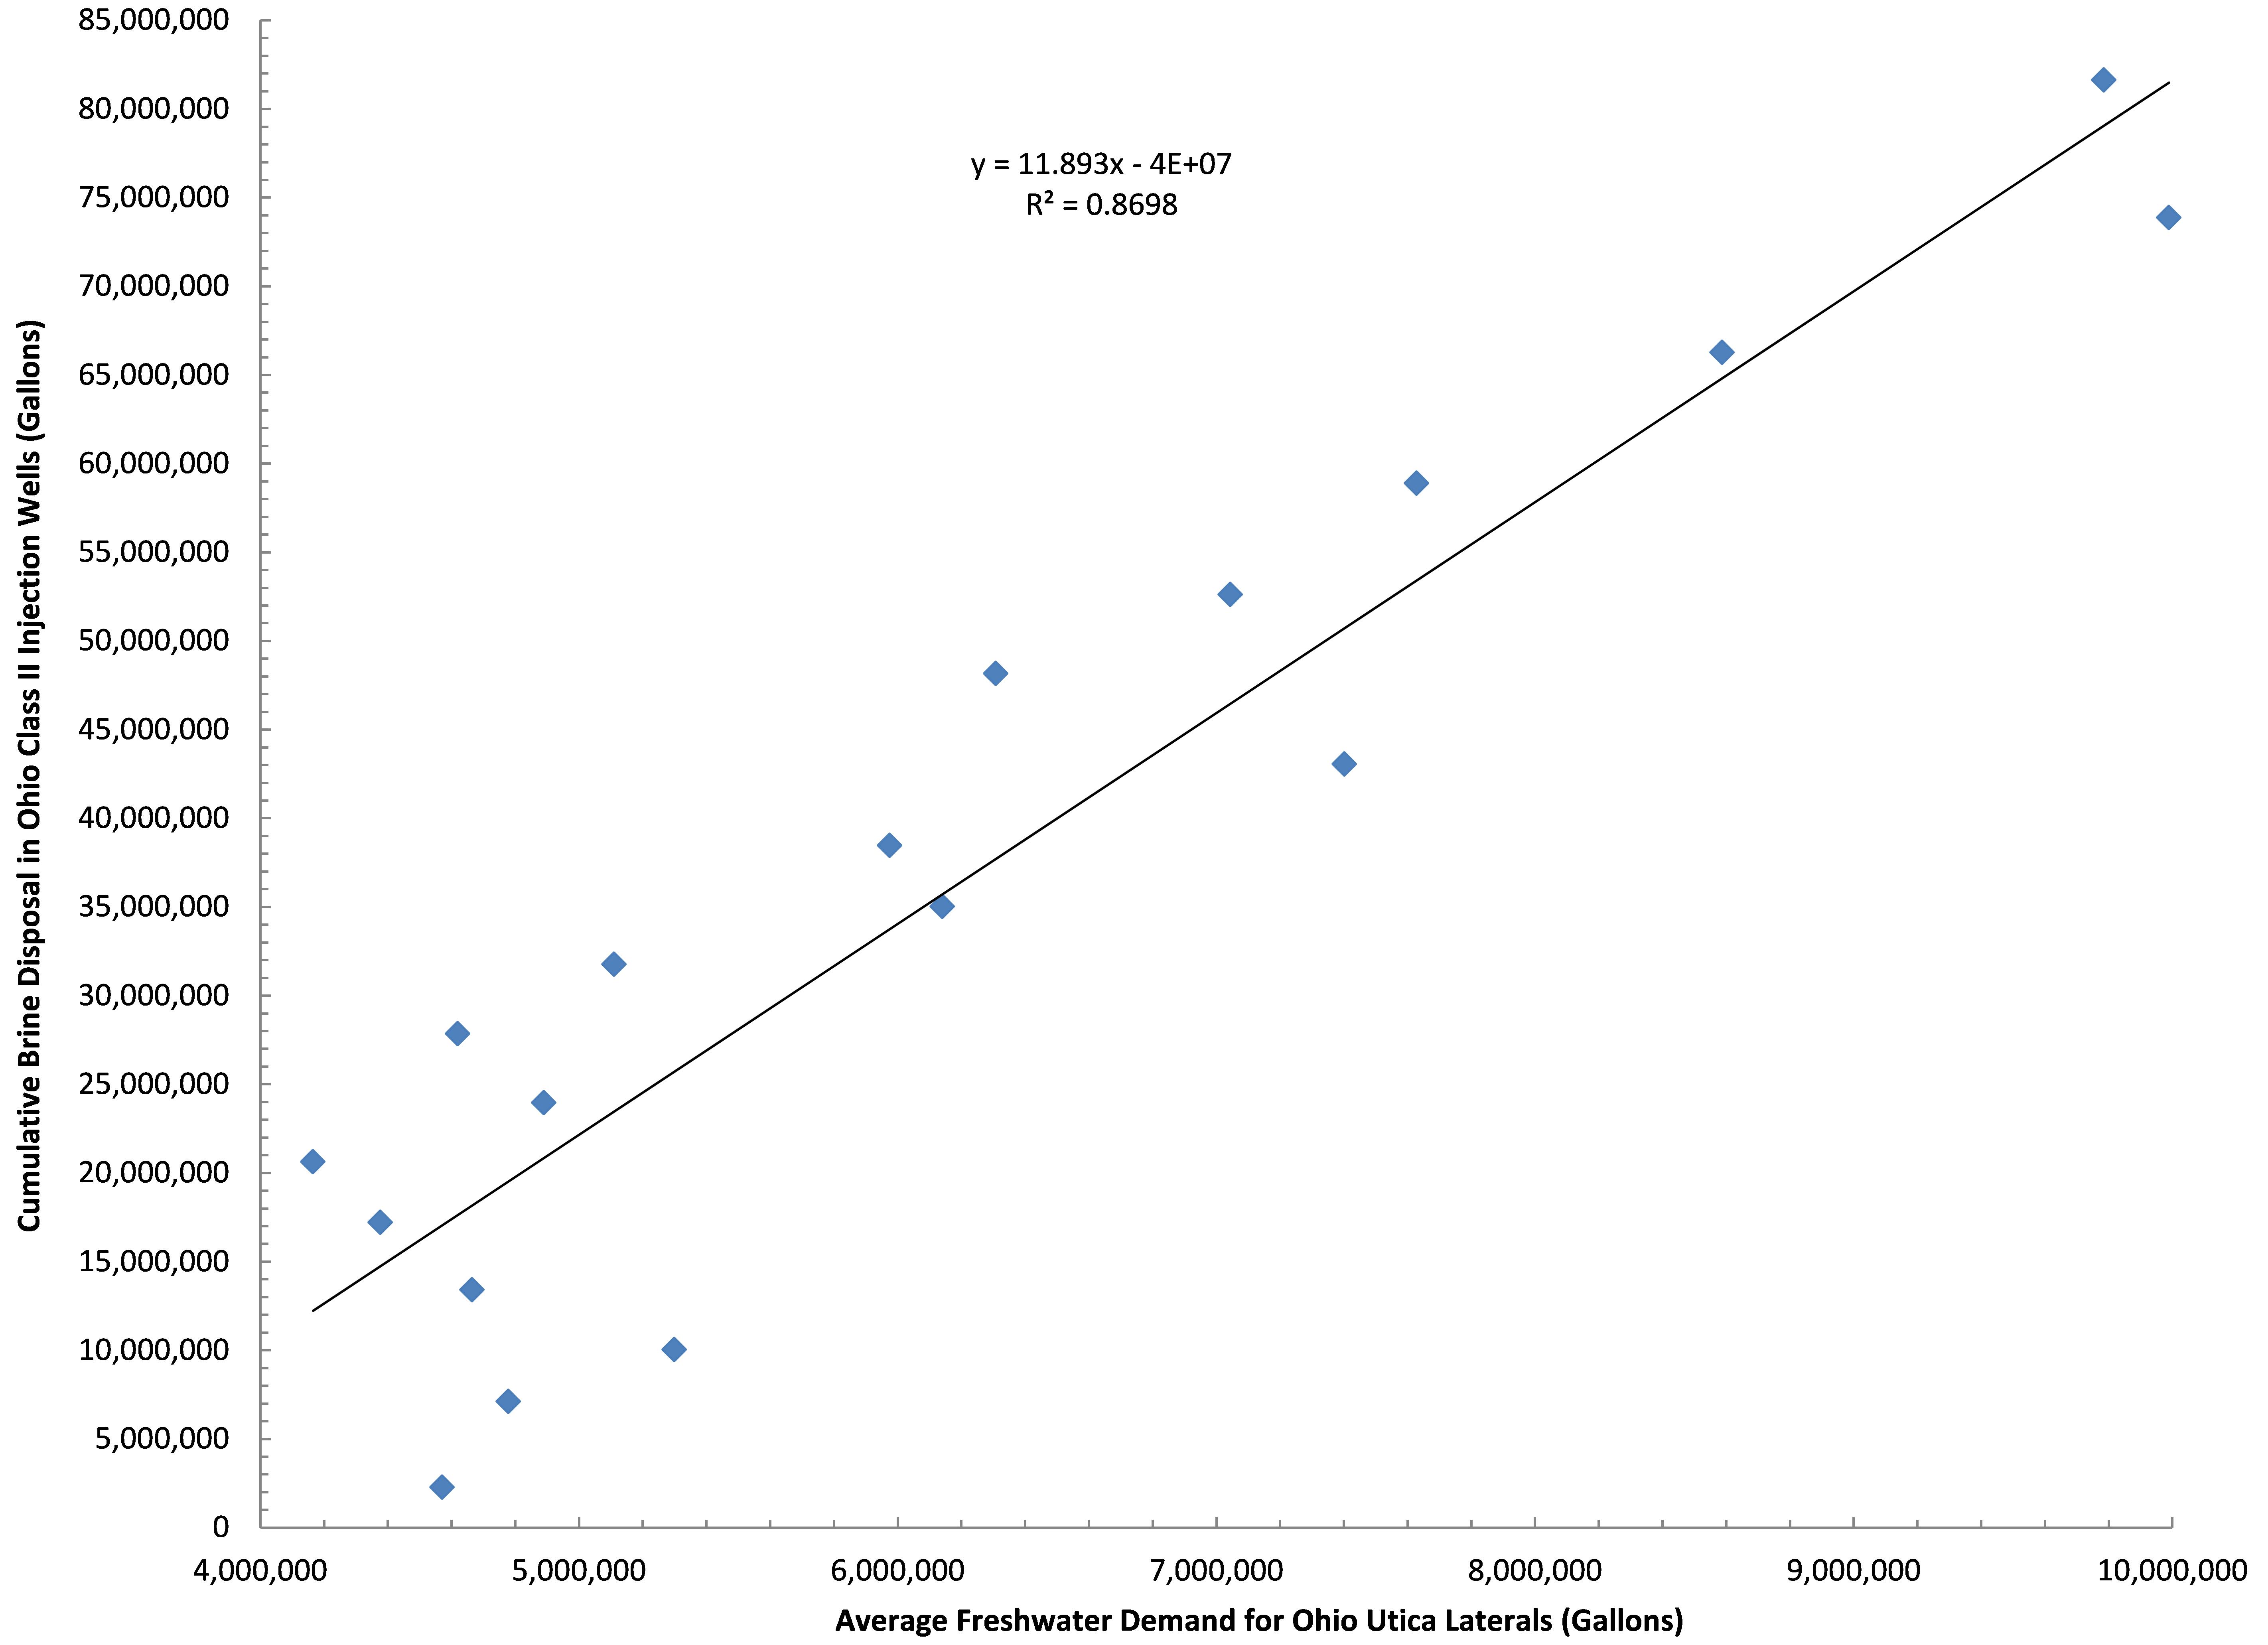


 Class II Injection Well, Ashtabula County, Ohio")
 Class II Injection Well, Ashtabula County, Ohio")
 Class II Injection Well, Lake County, Ohio")
 Class II Injection Well, Lake County, Ohio")


, Knox County, Ohio")

 Class II Injection Well in Mahoning County, Ohio")


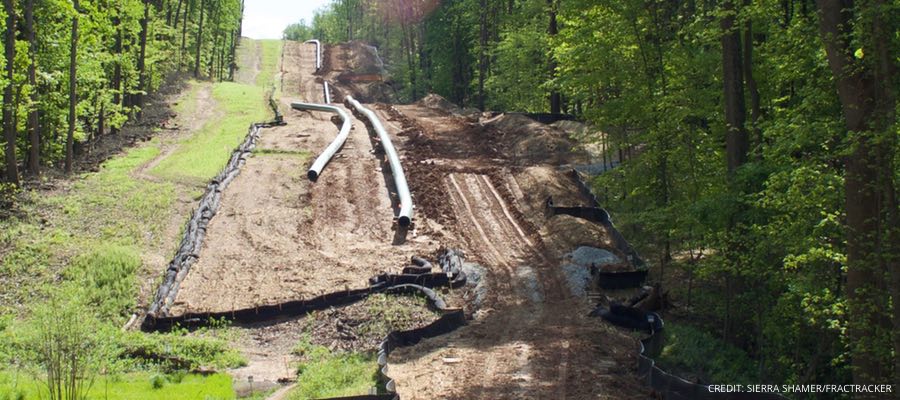
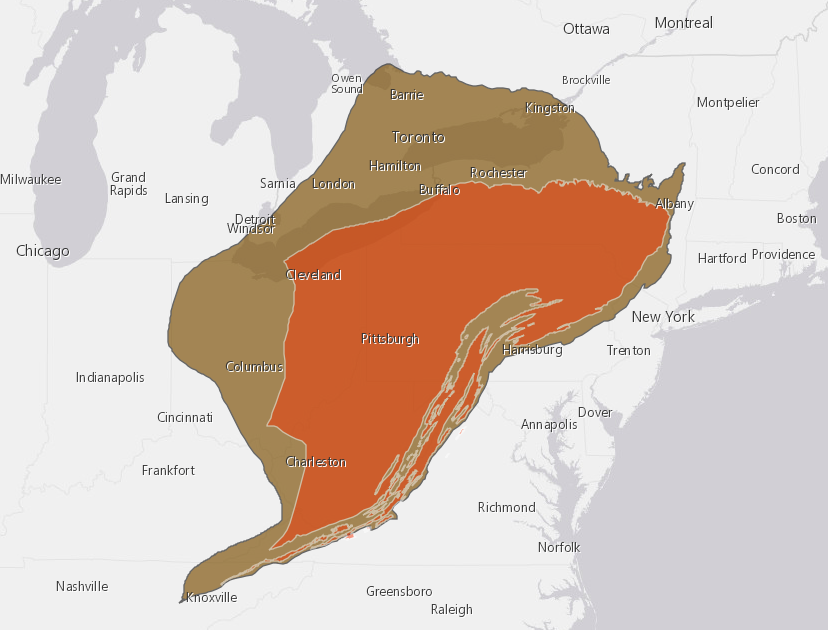
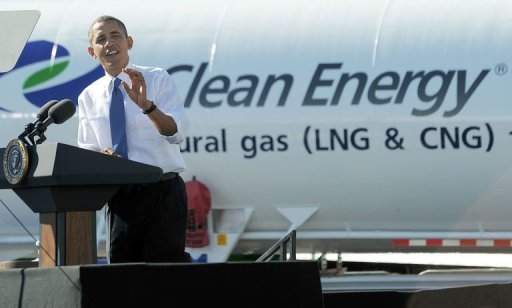
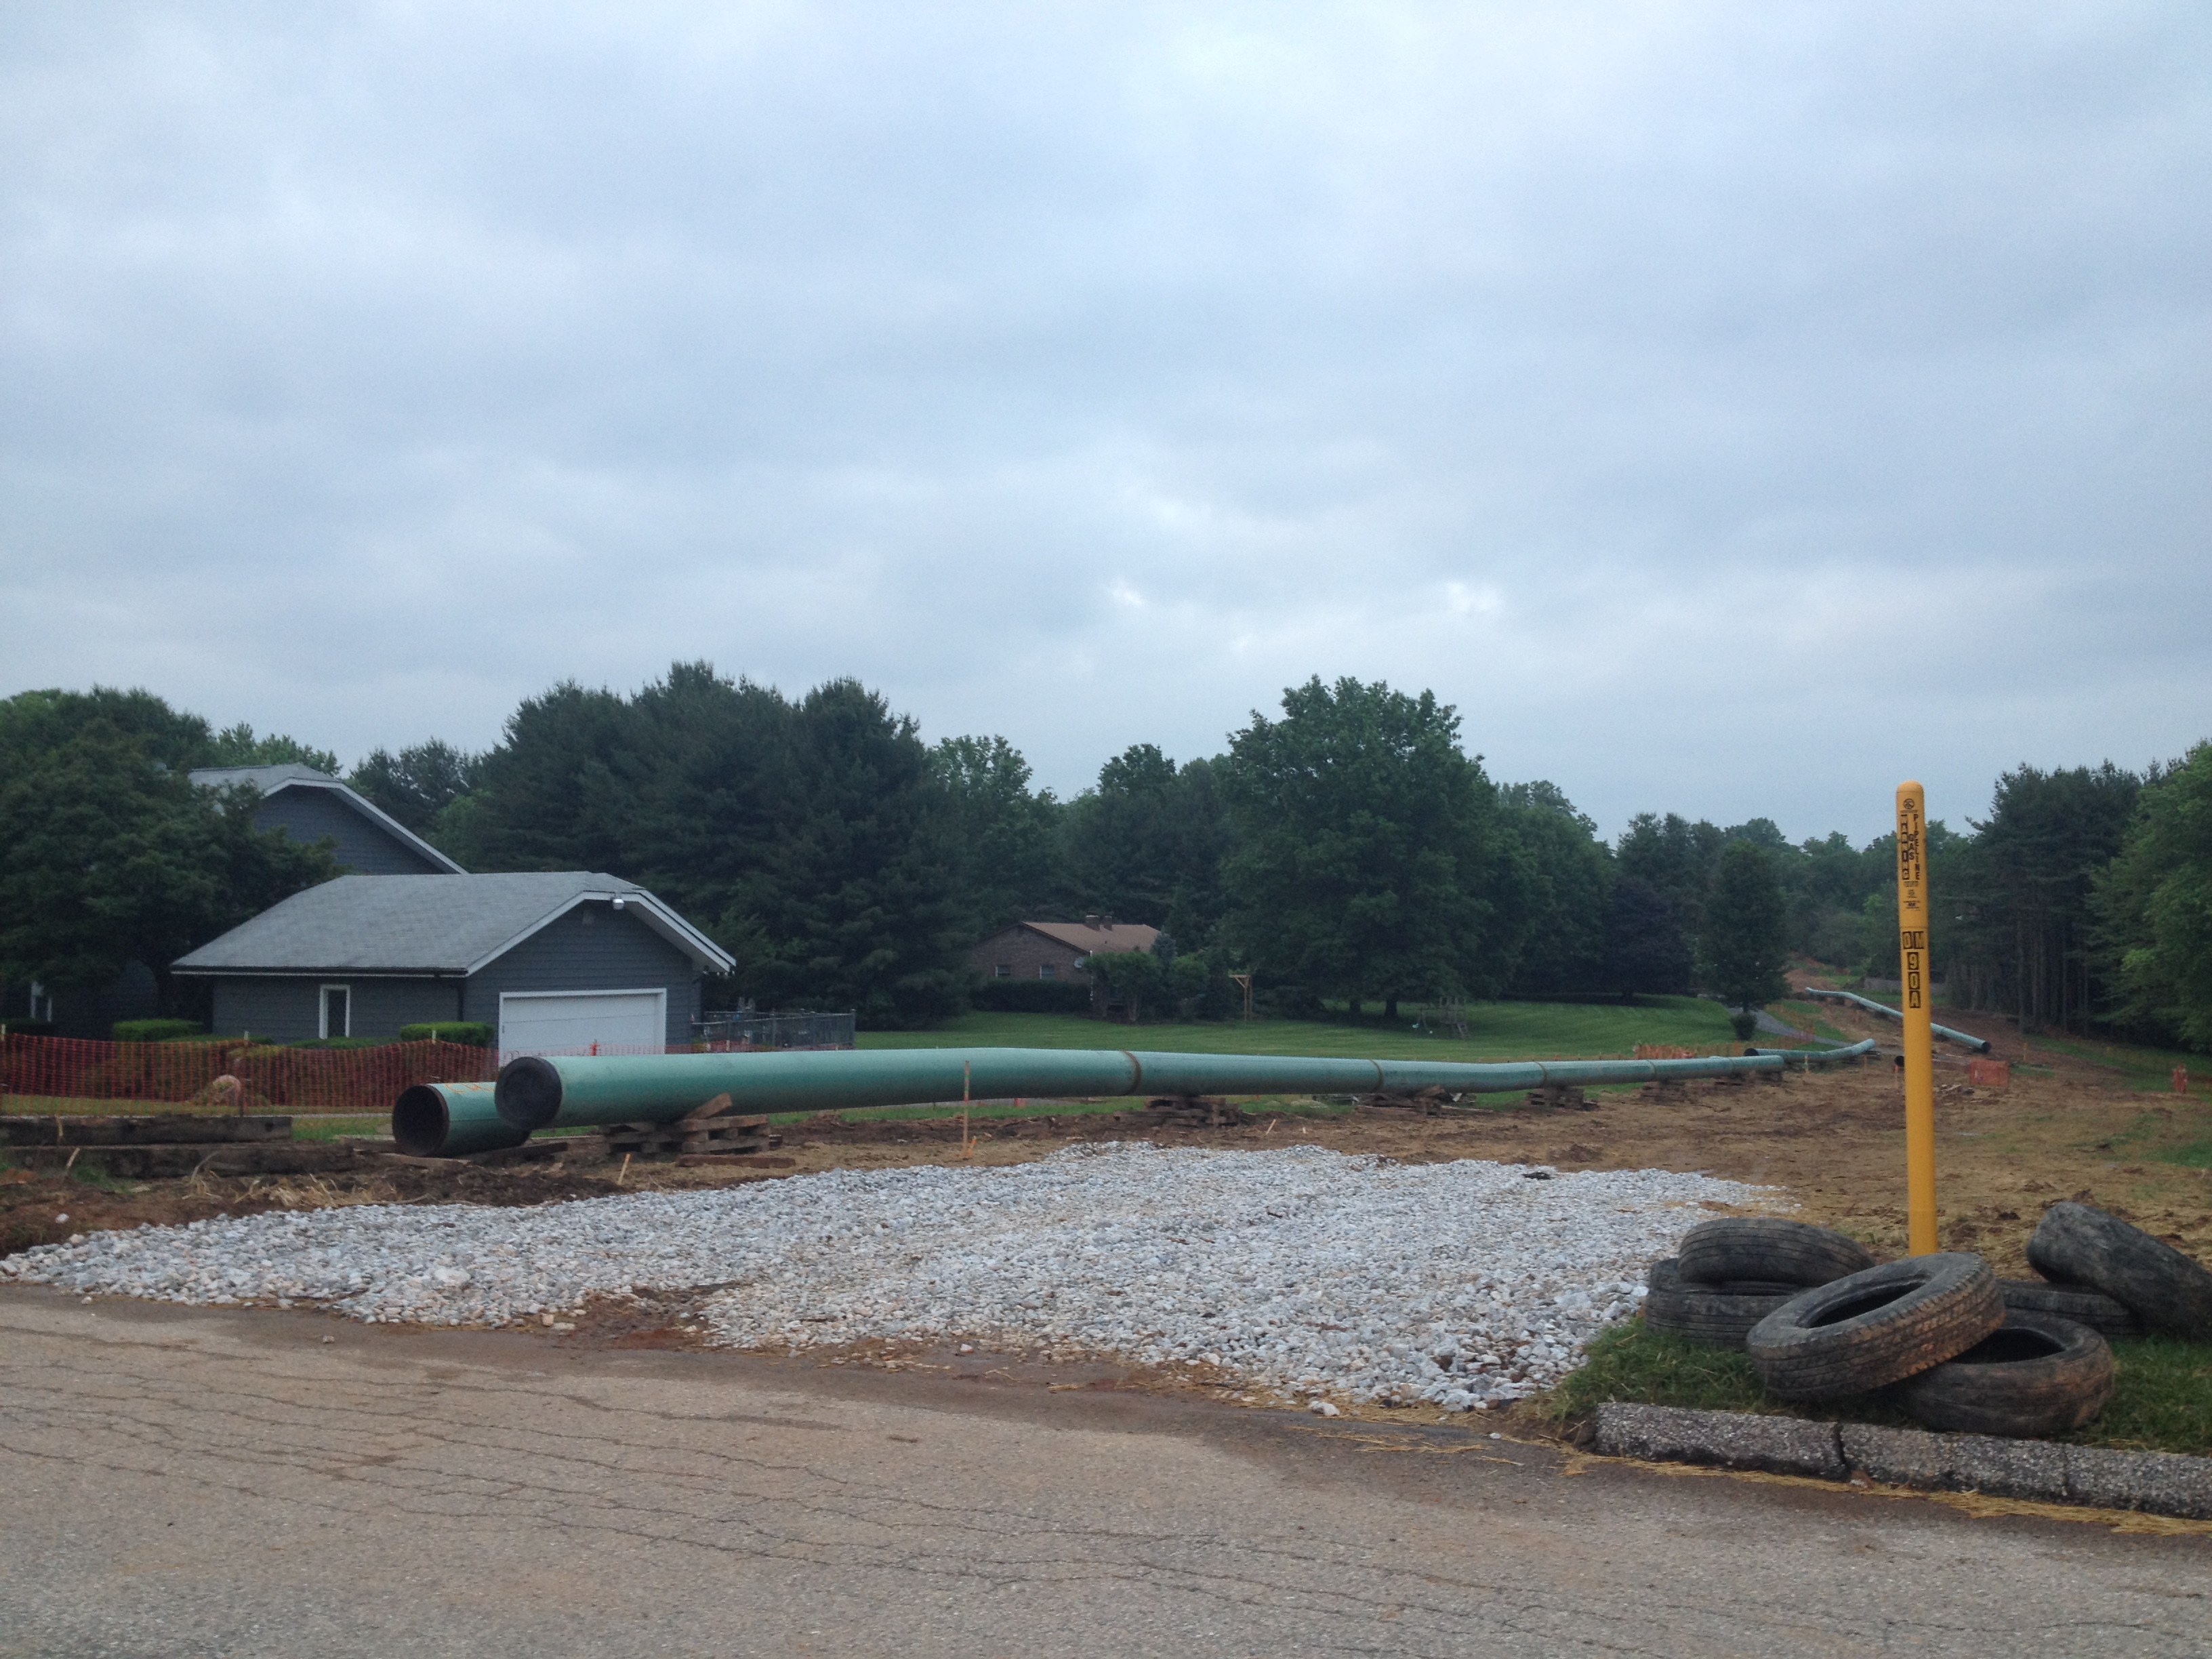

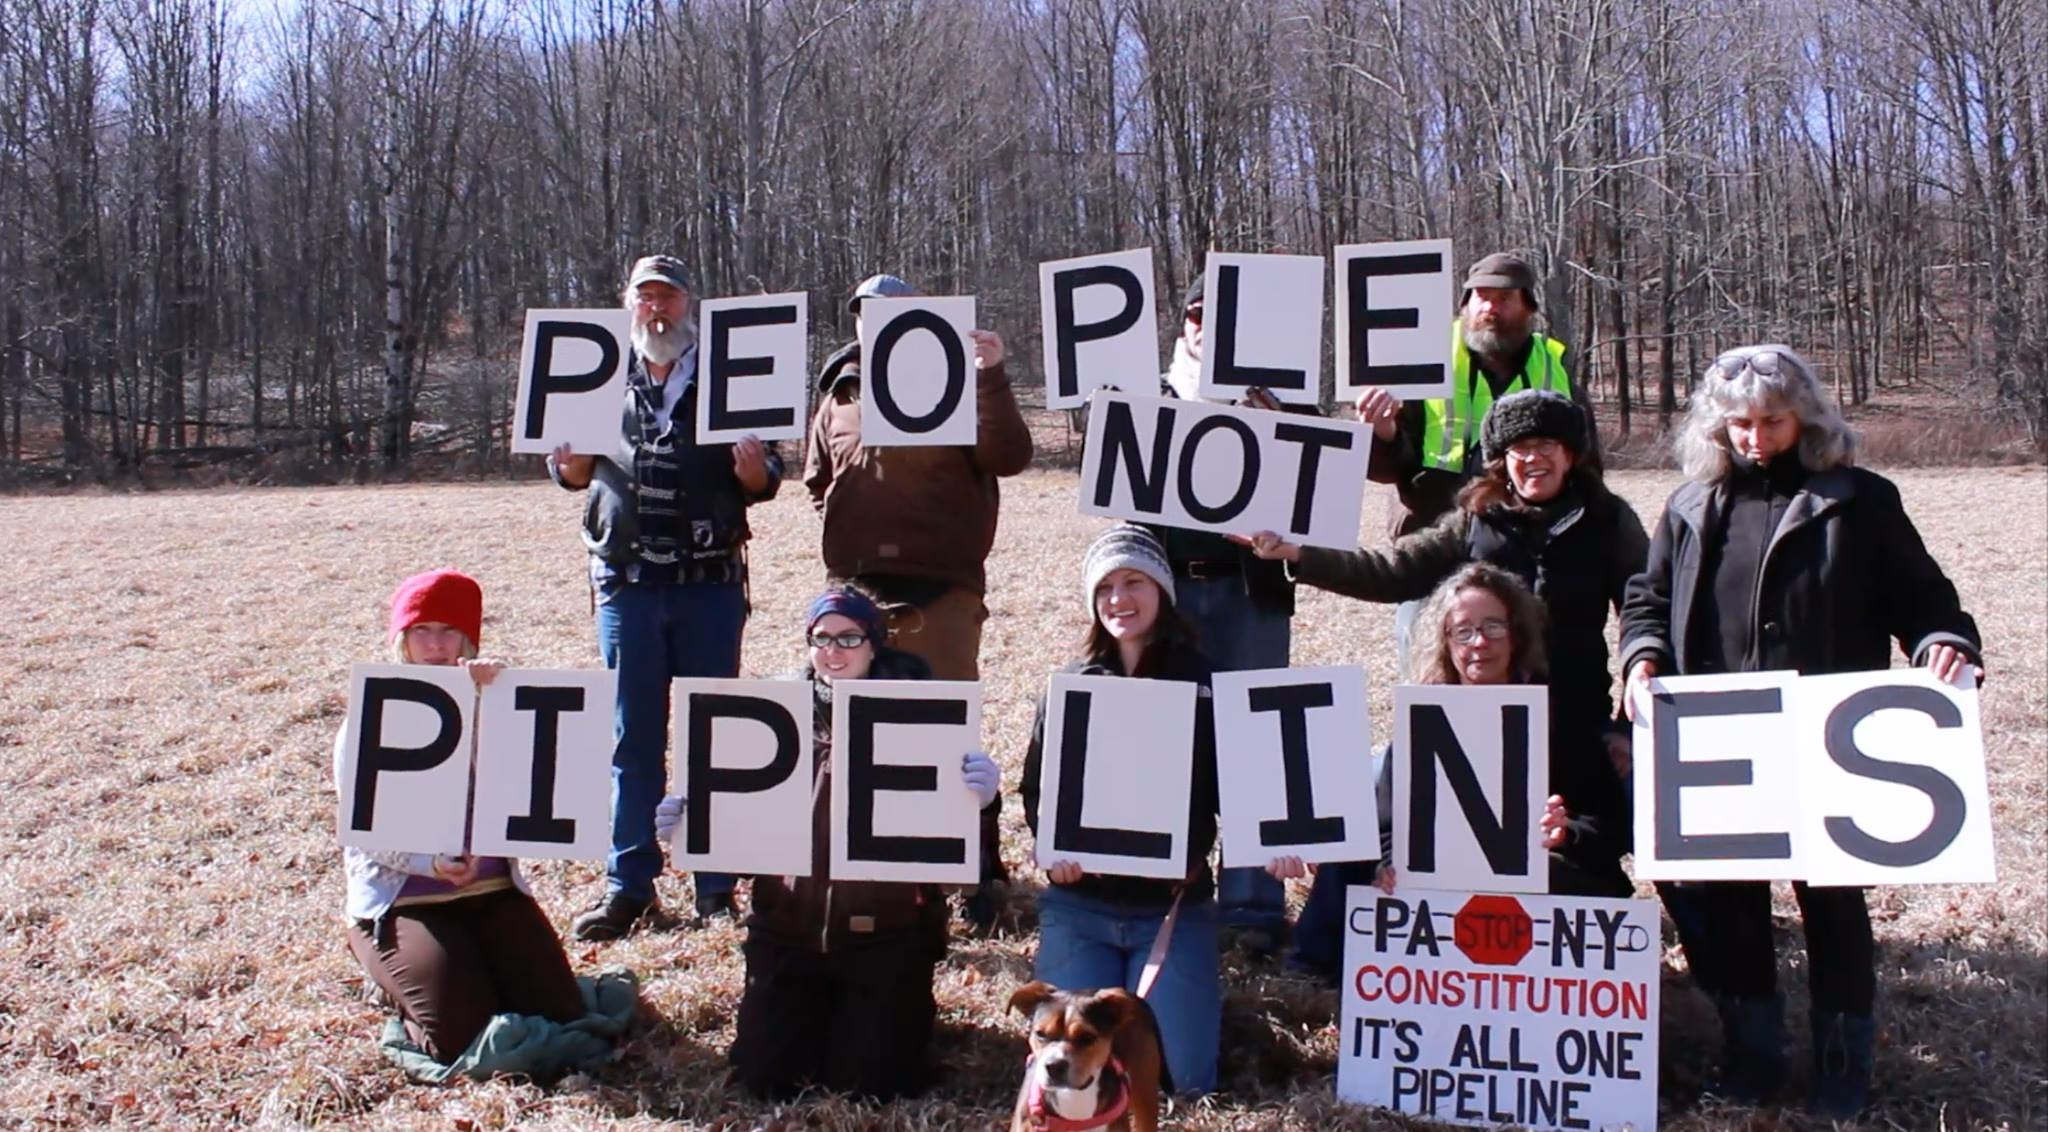
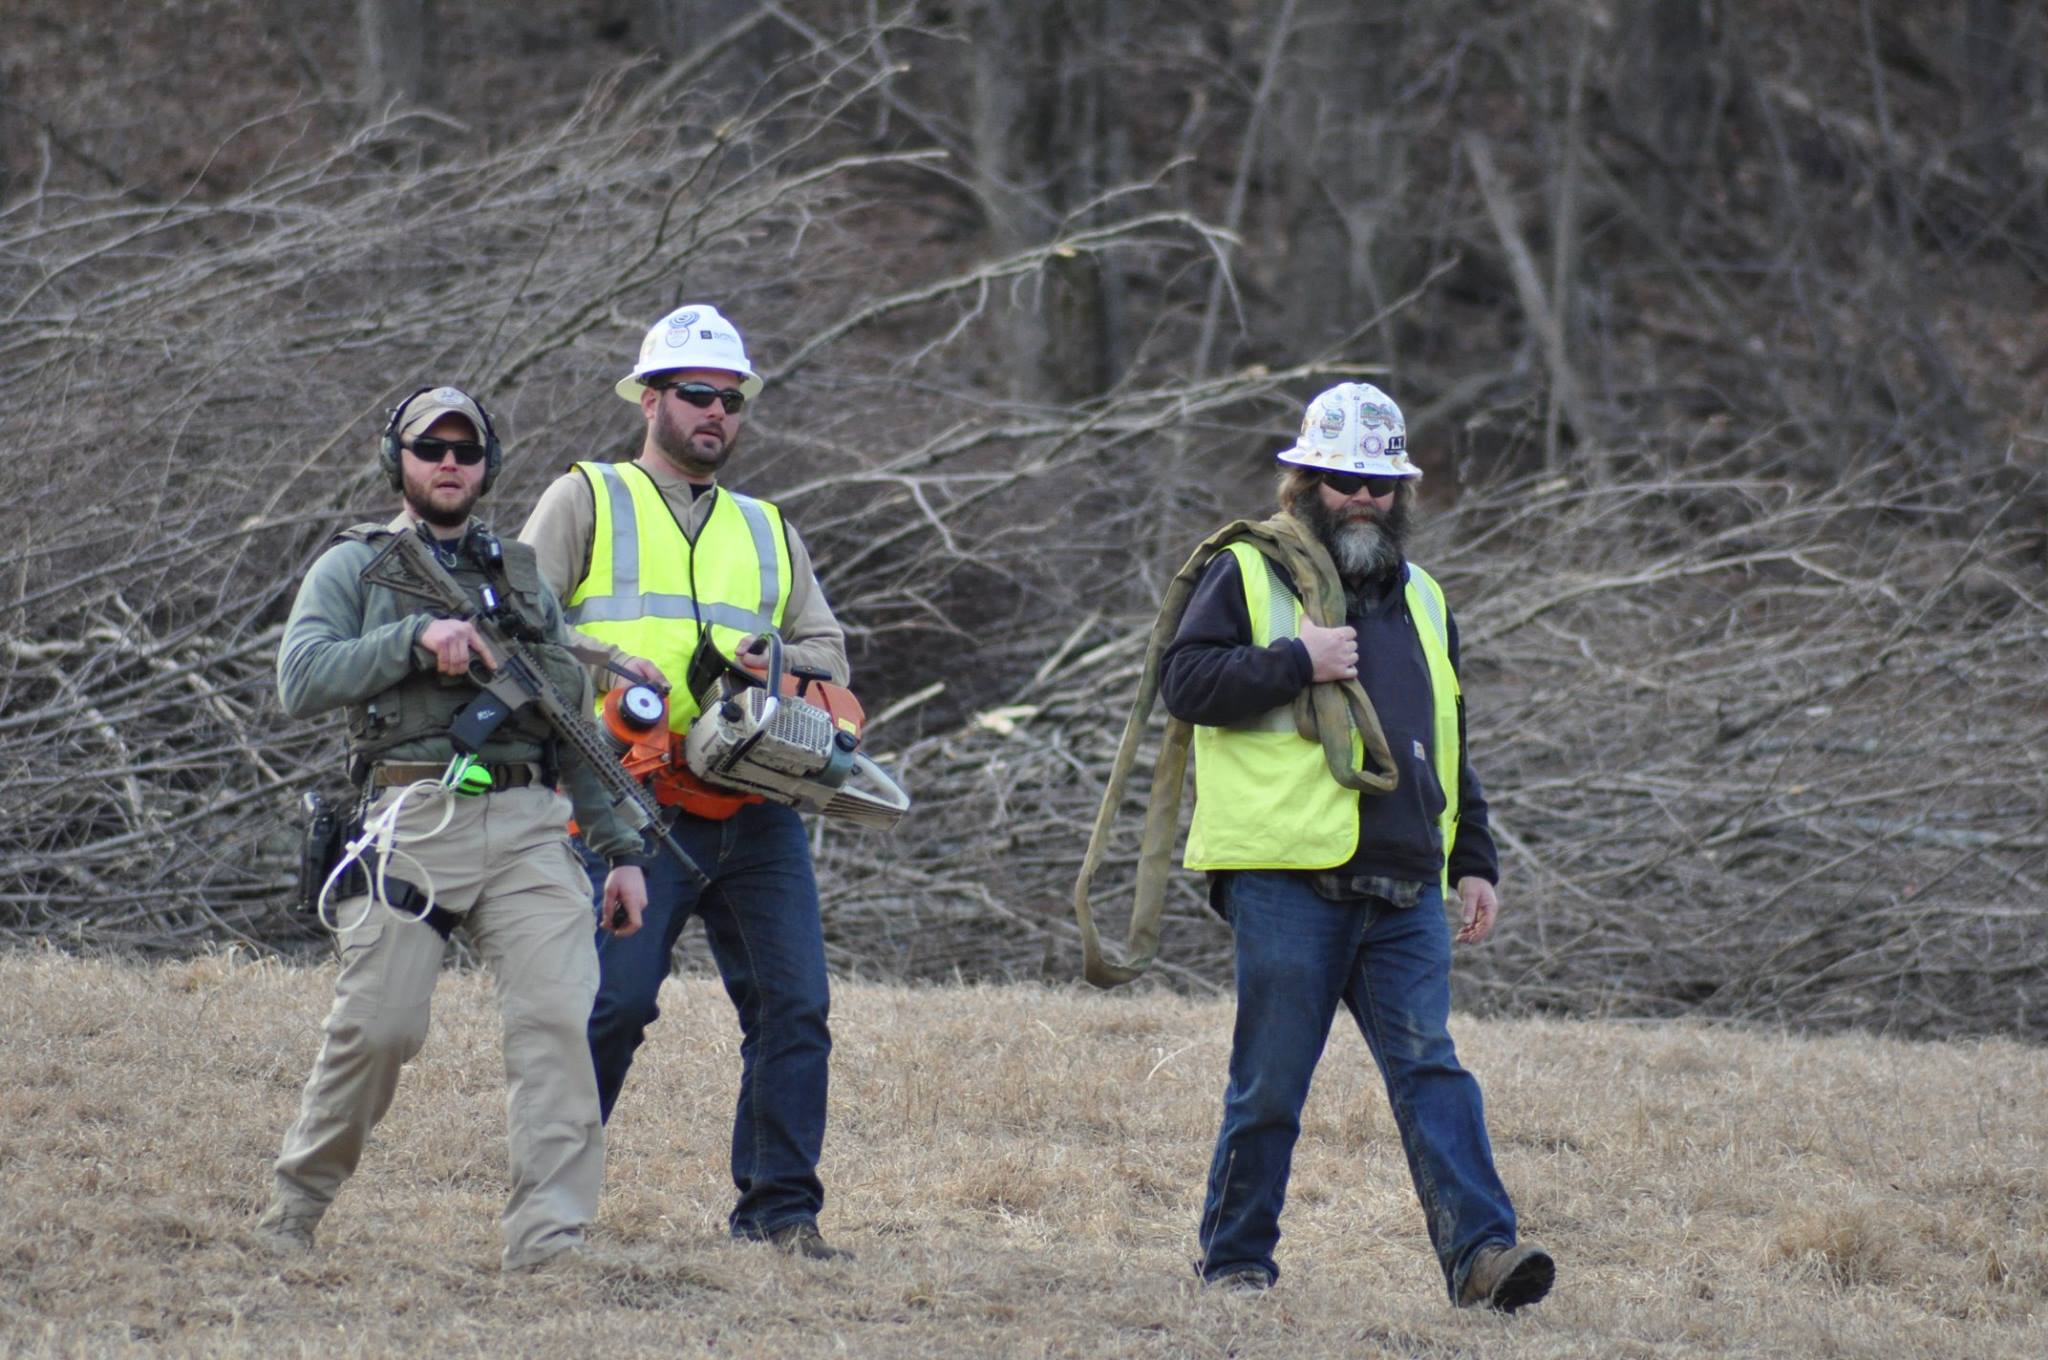
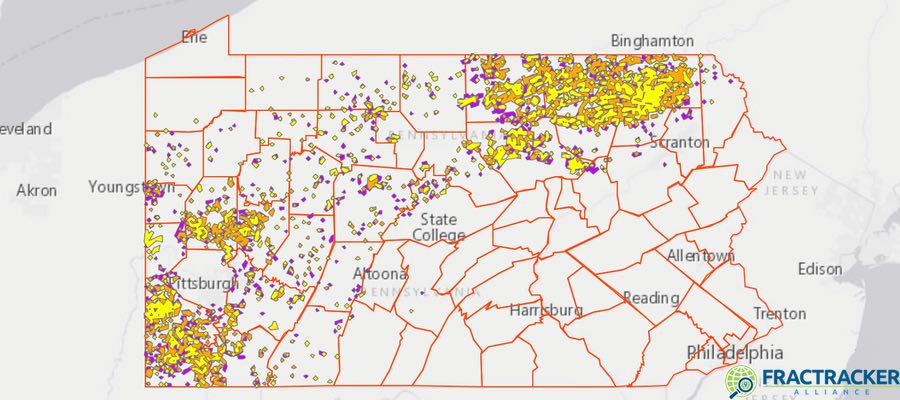
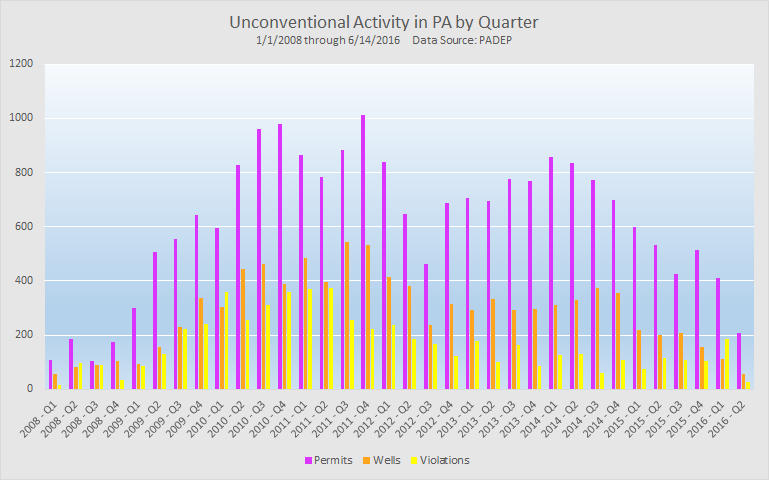
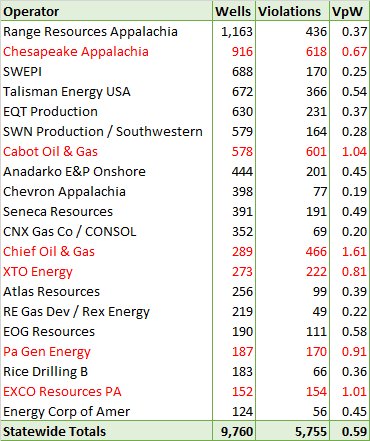
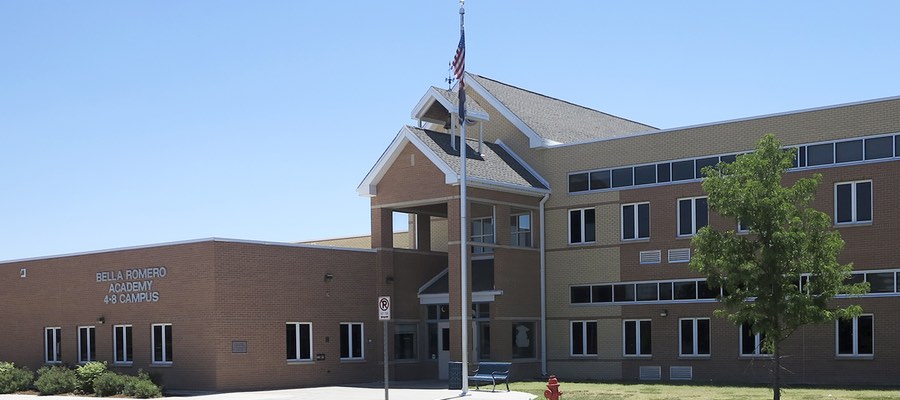
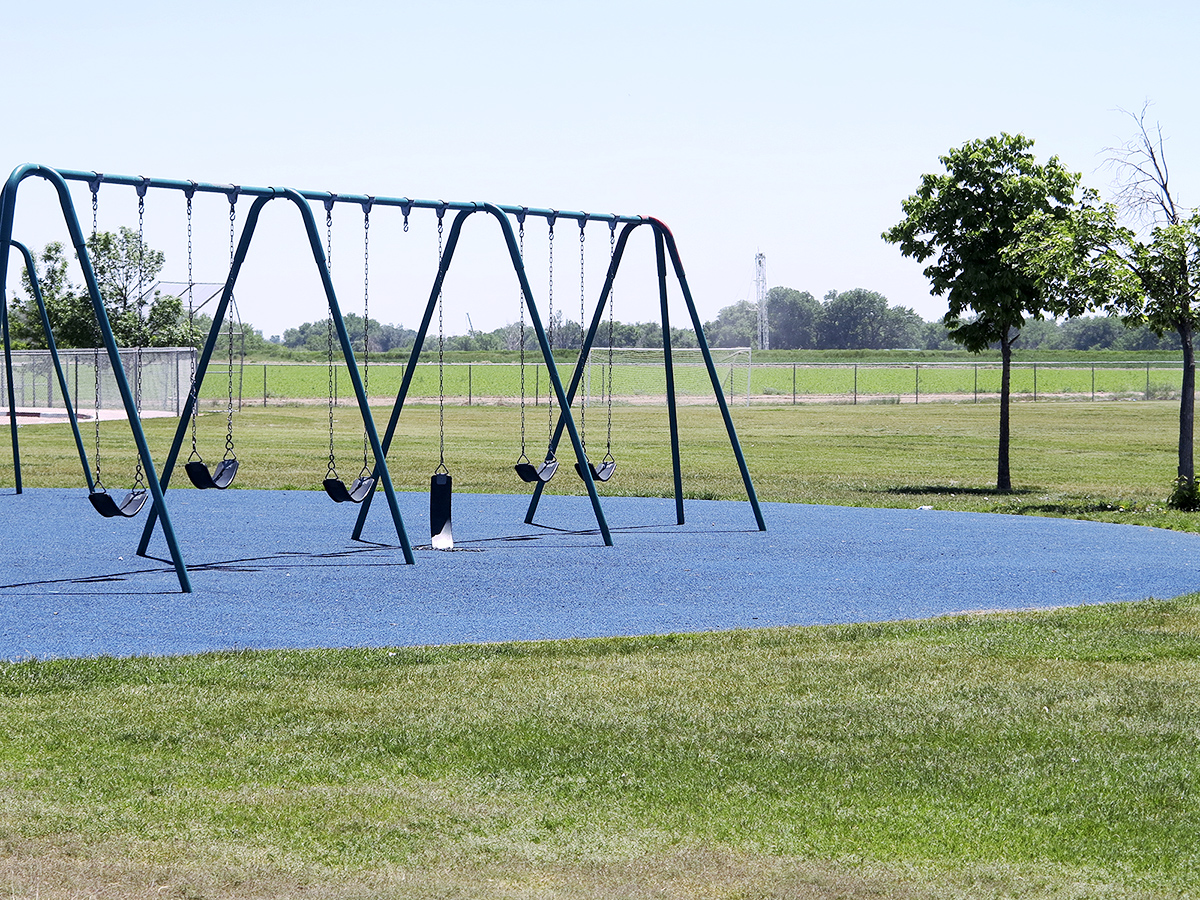


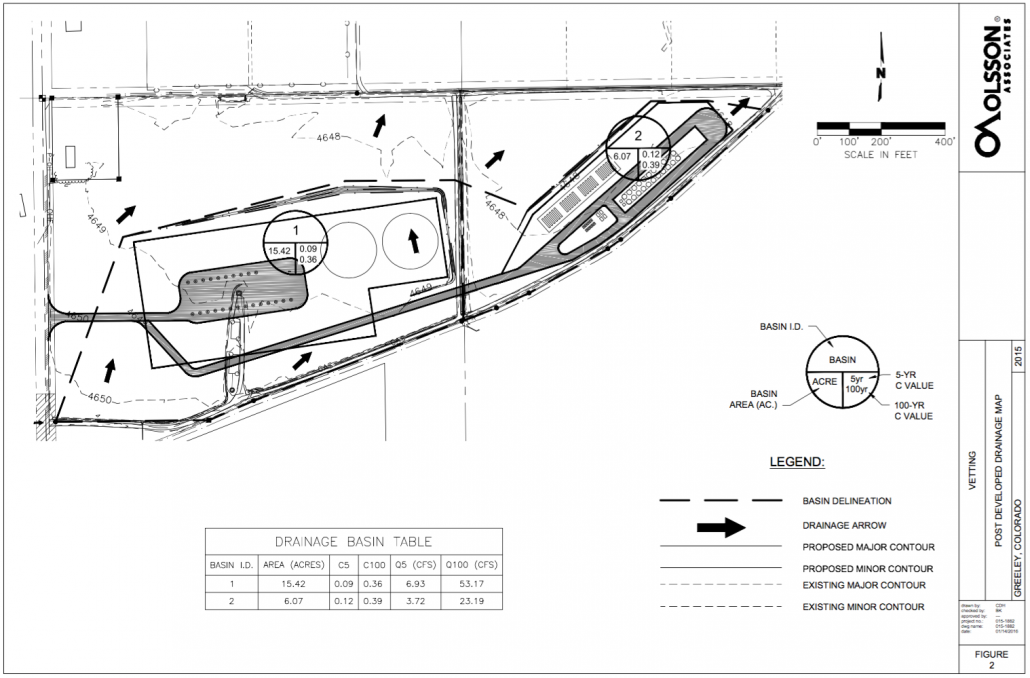
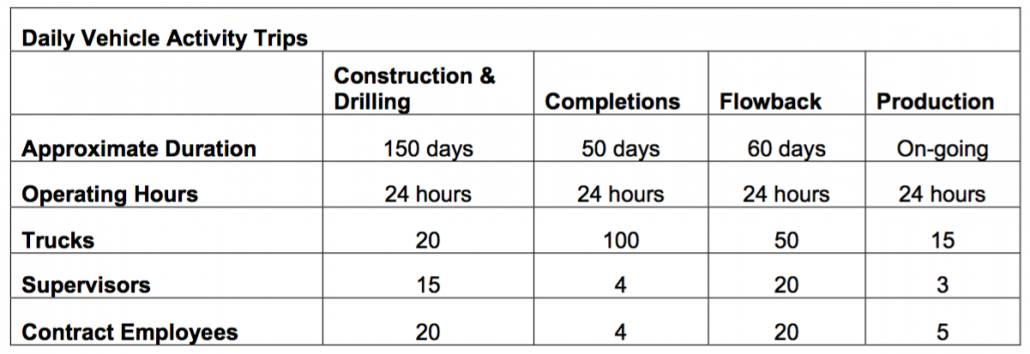
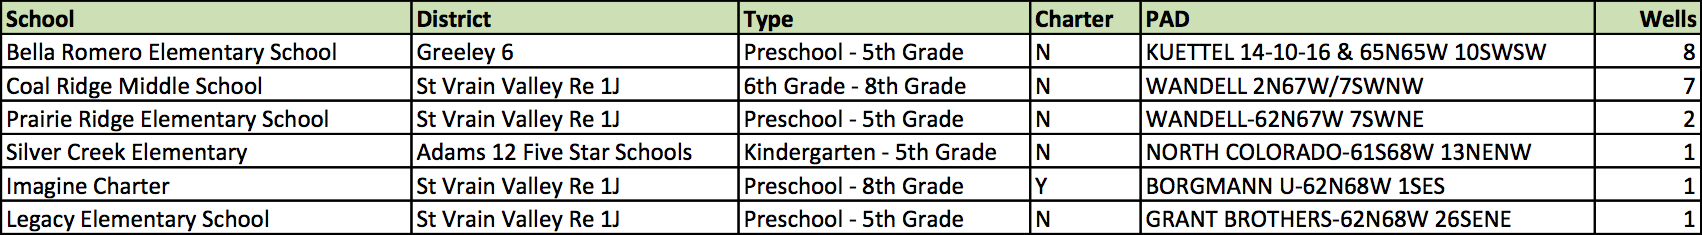
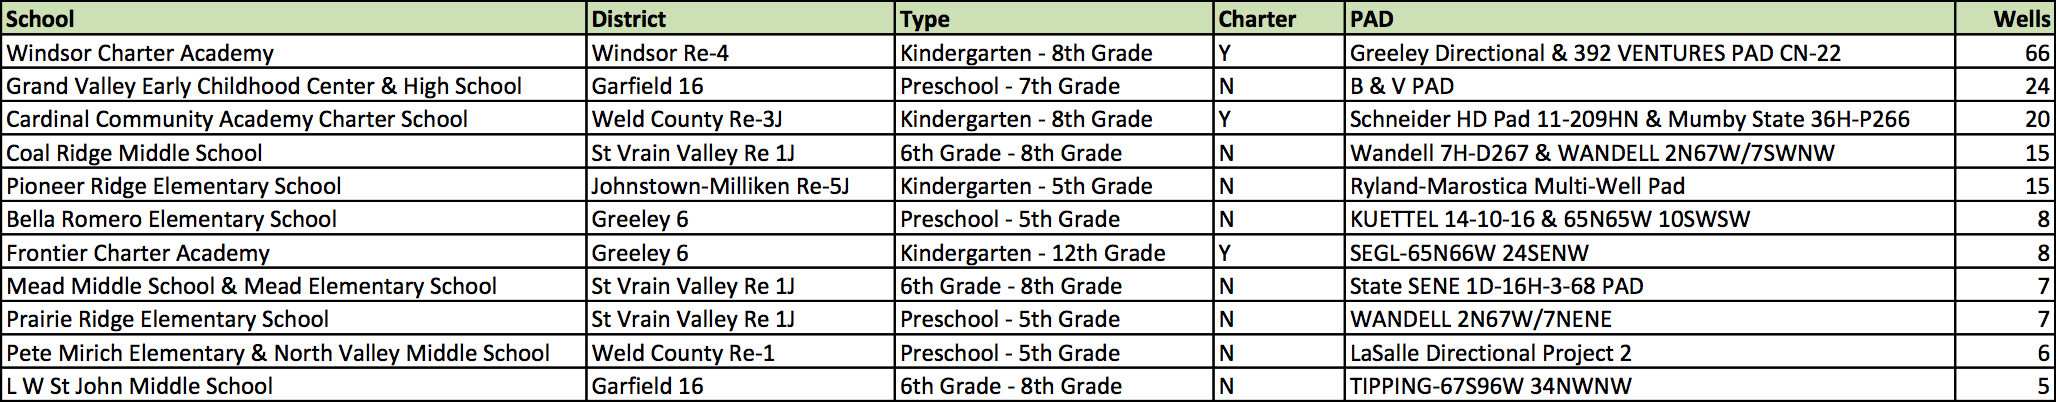
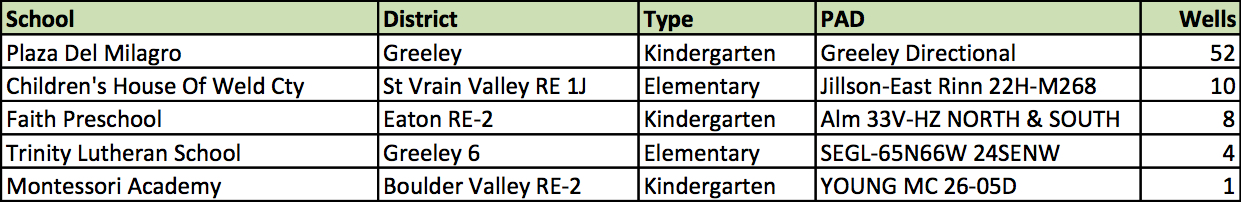
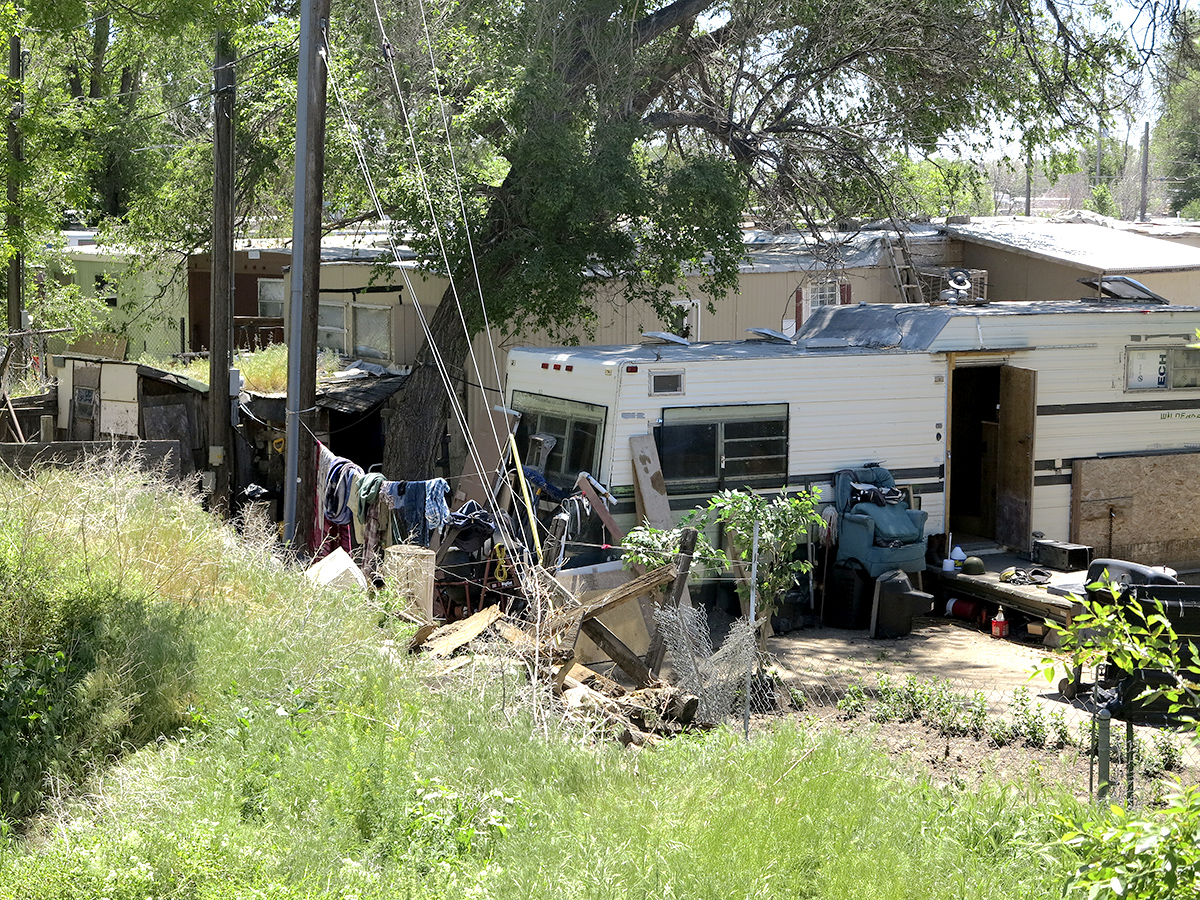
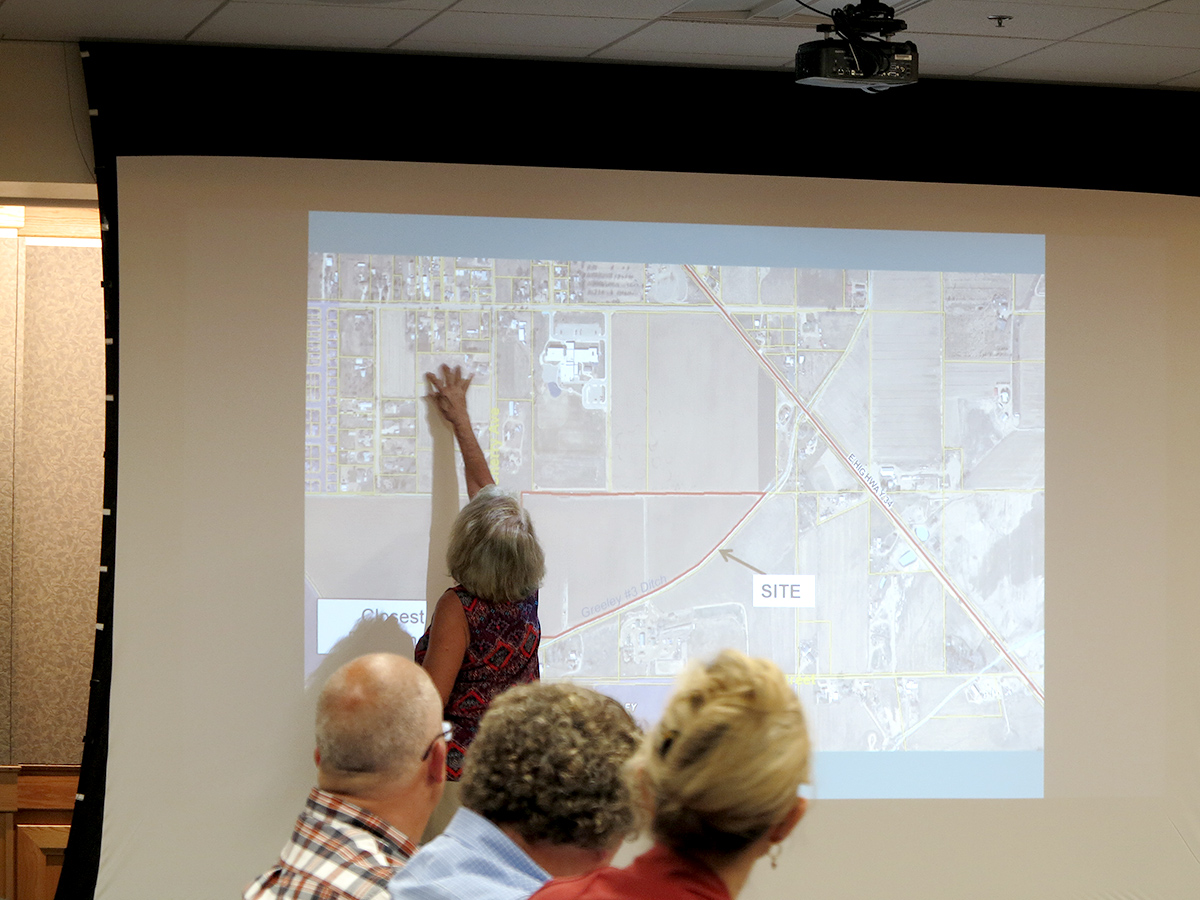
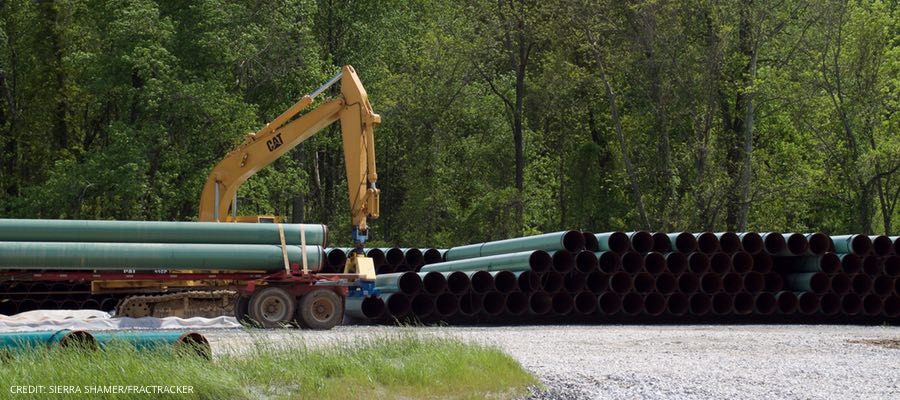
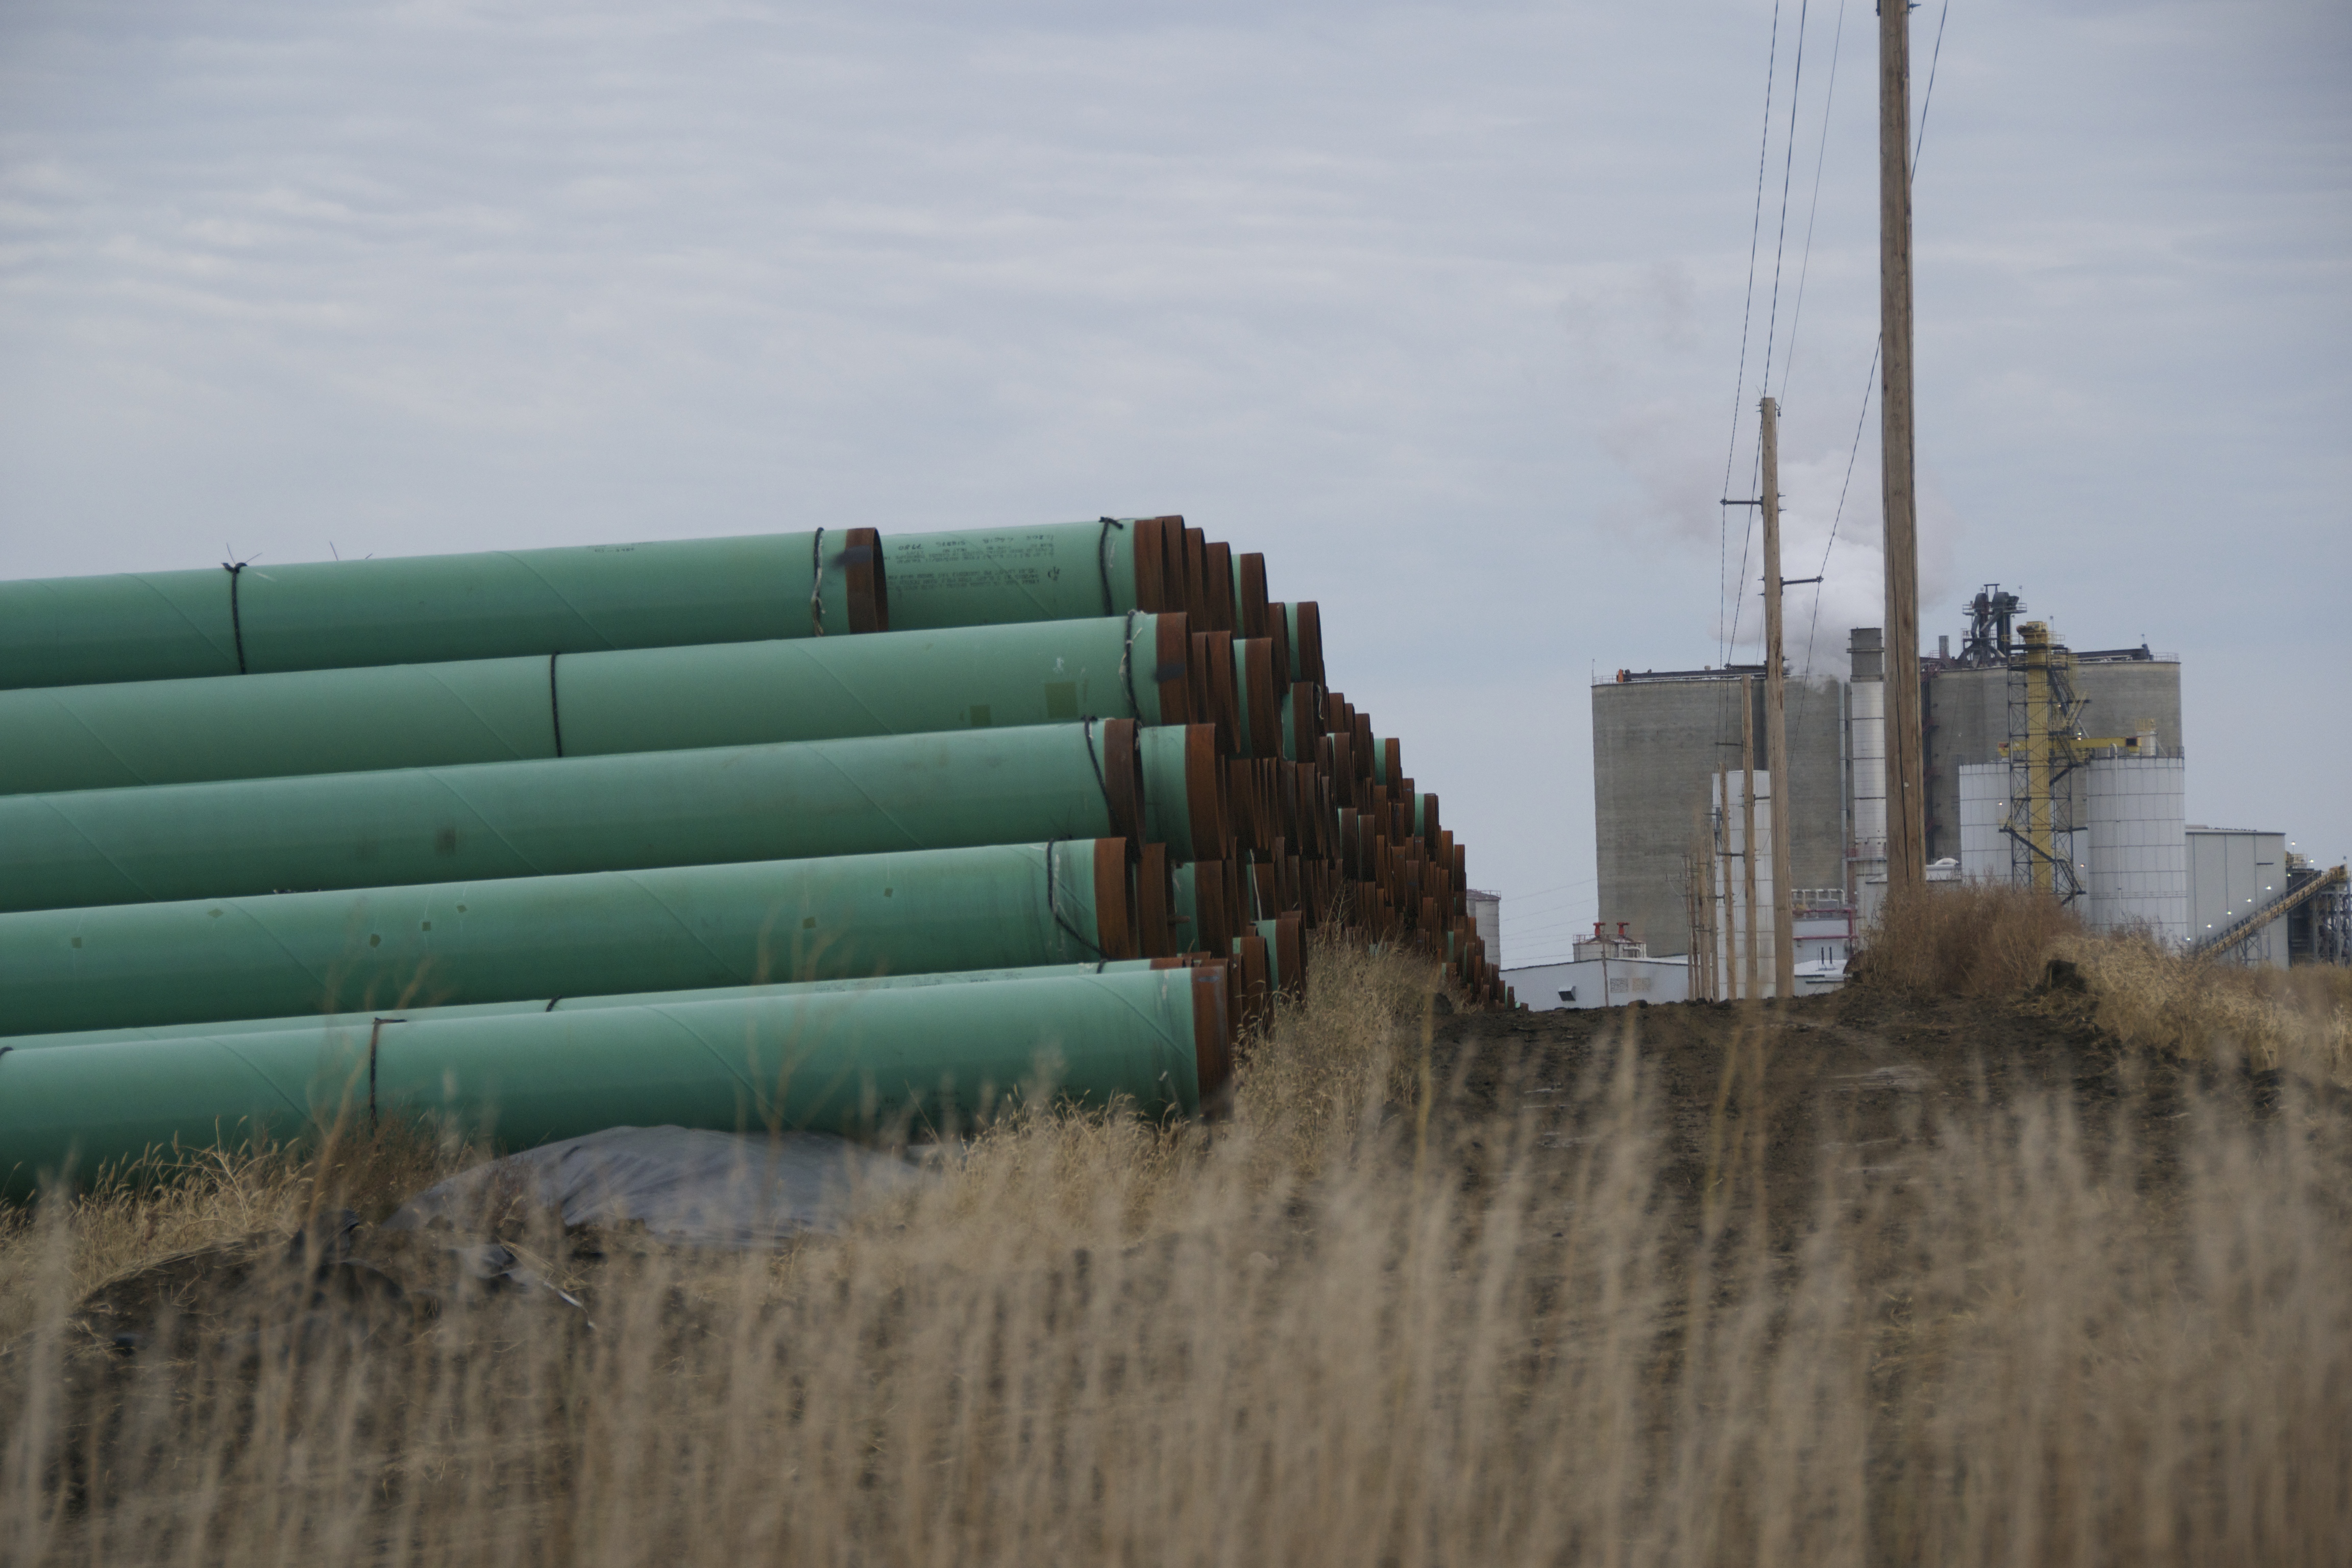
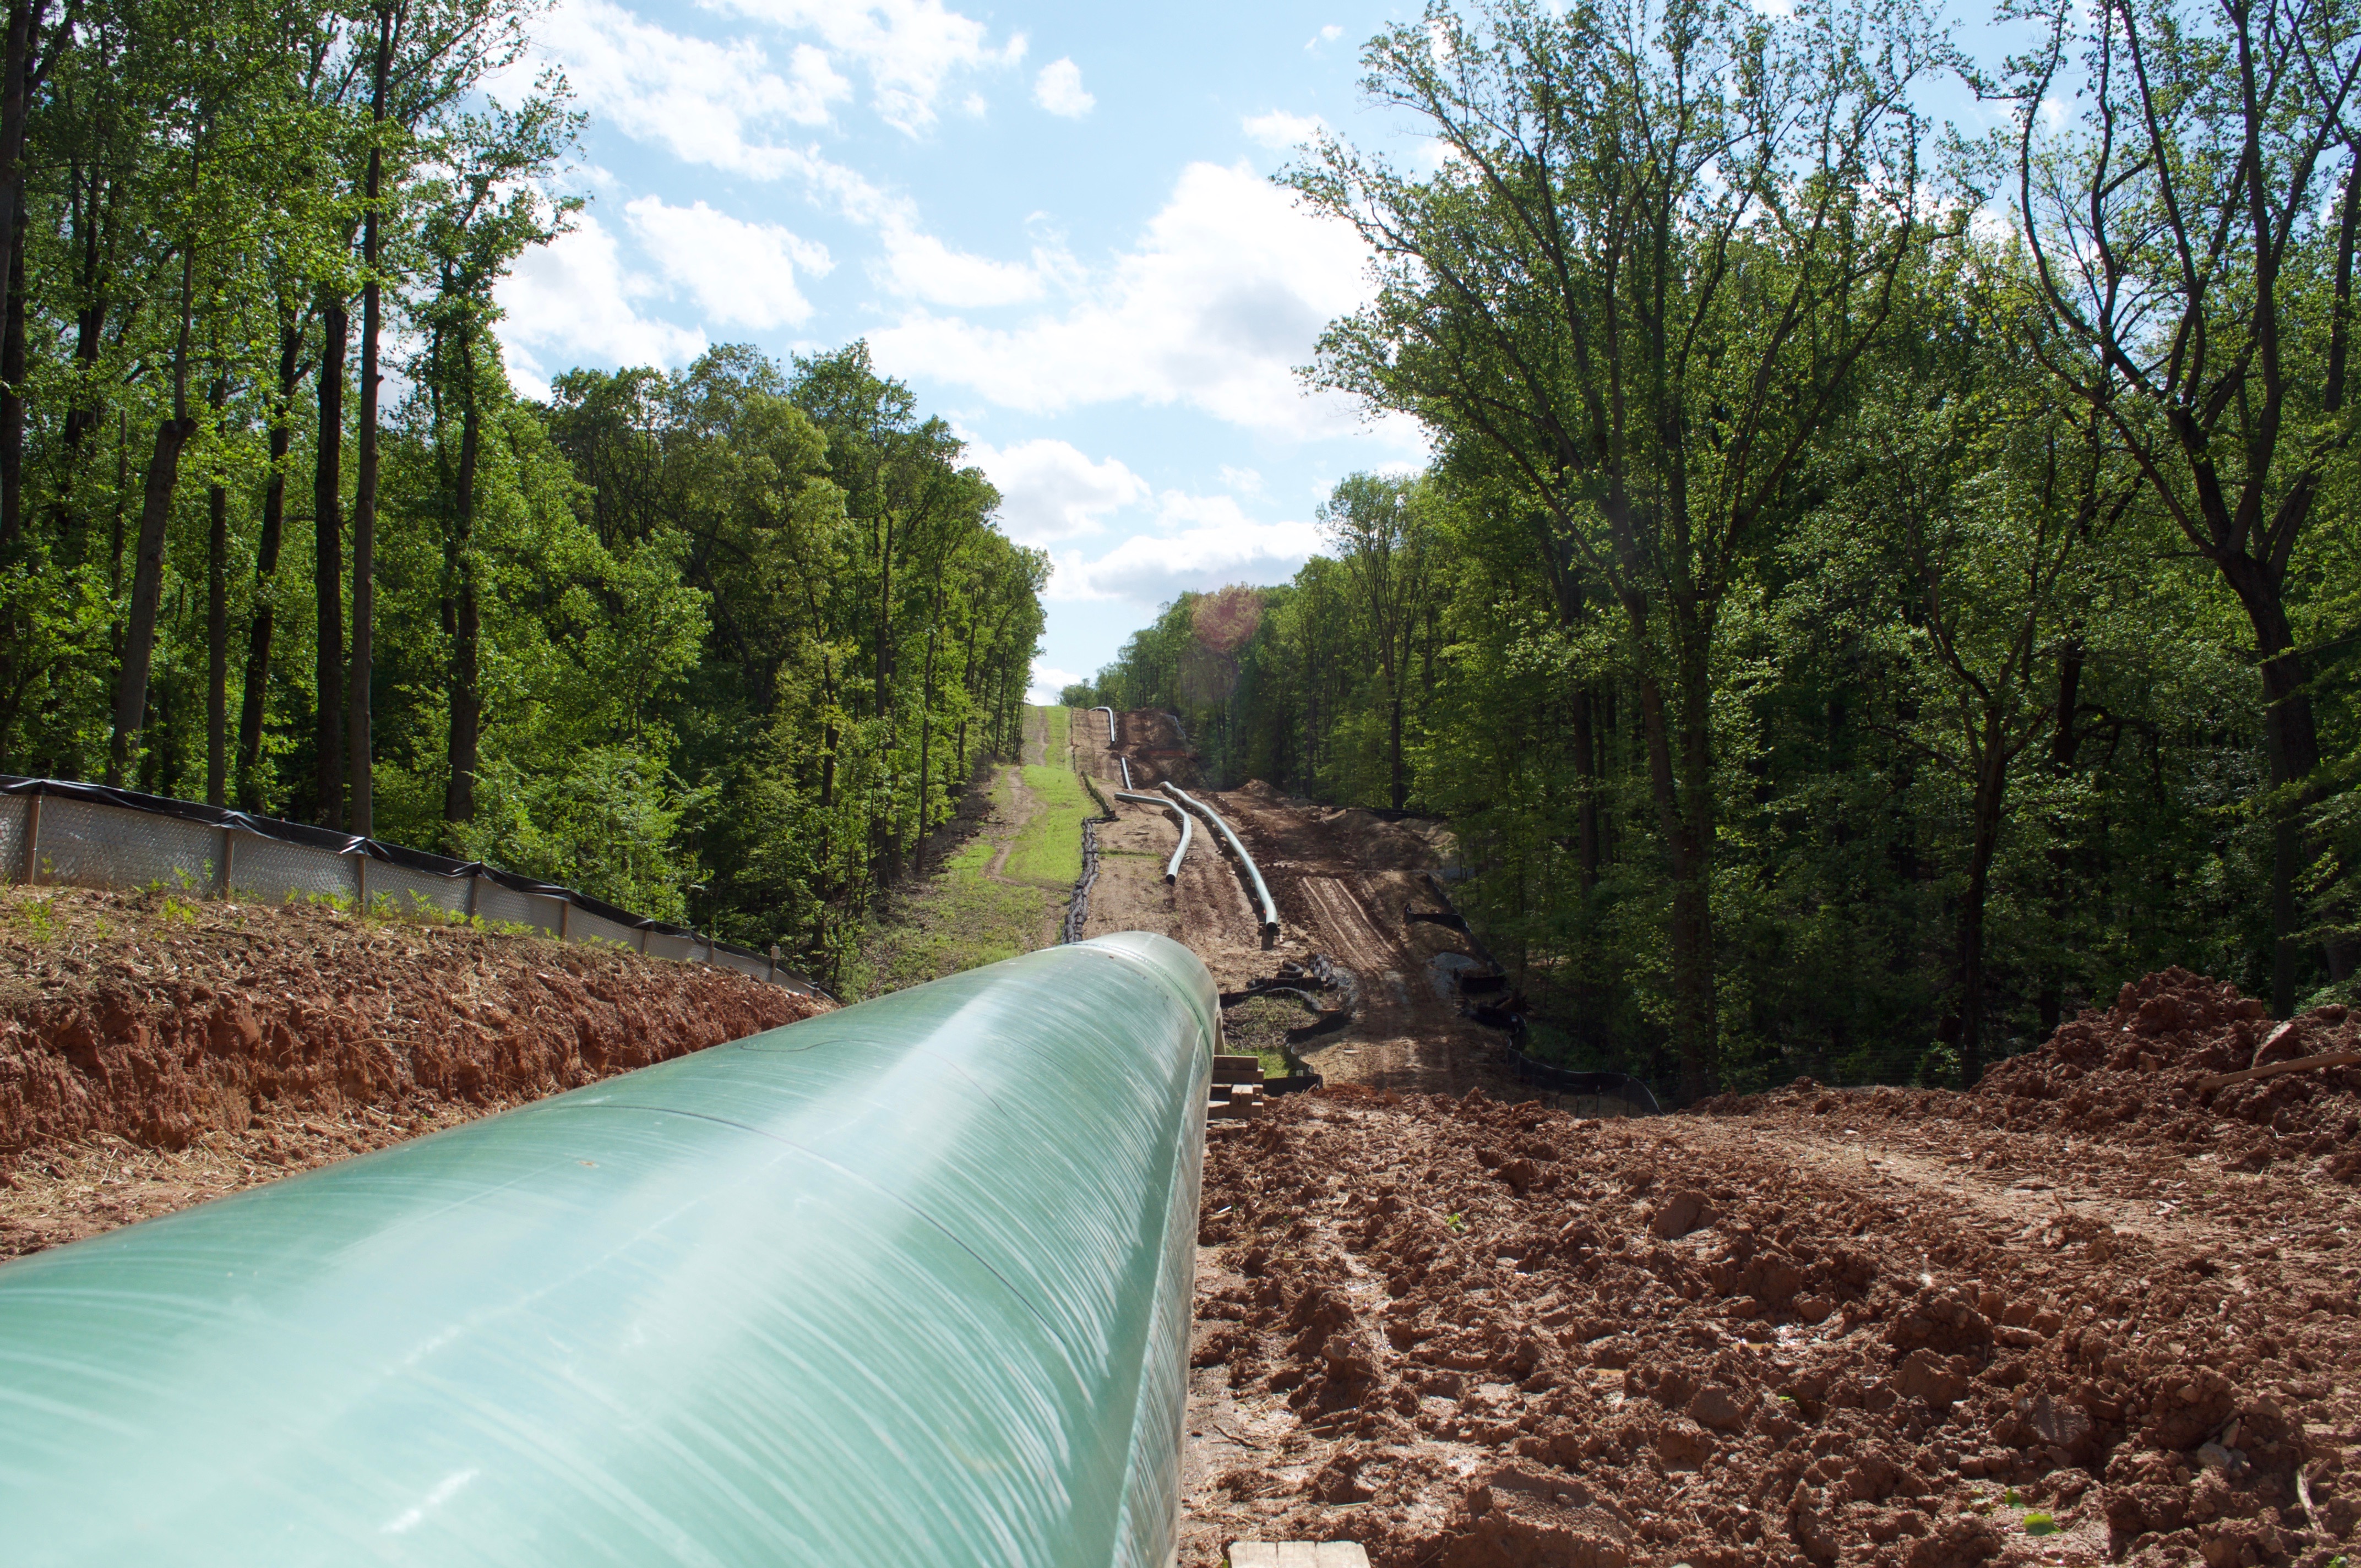
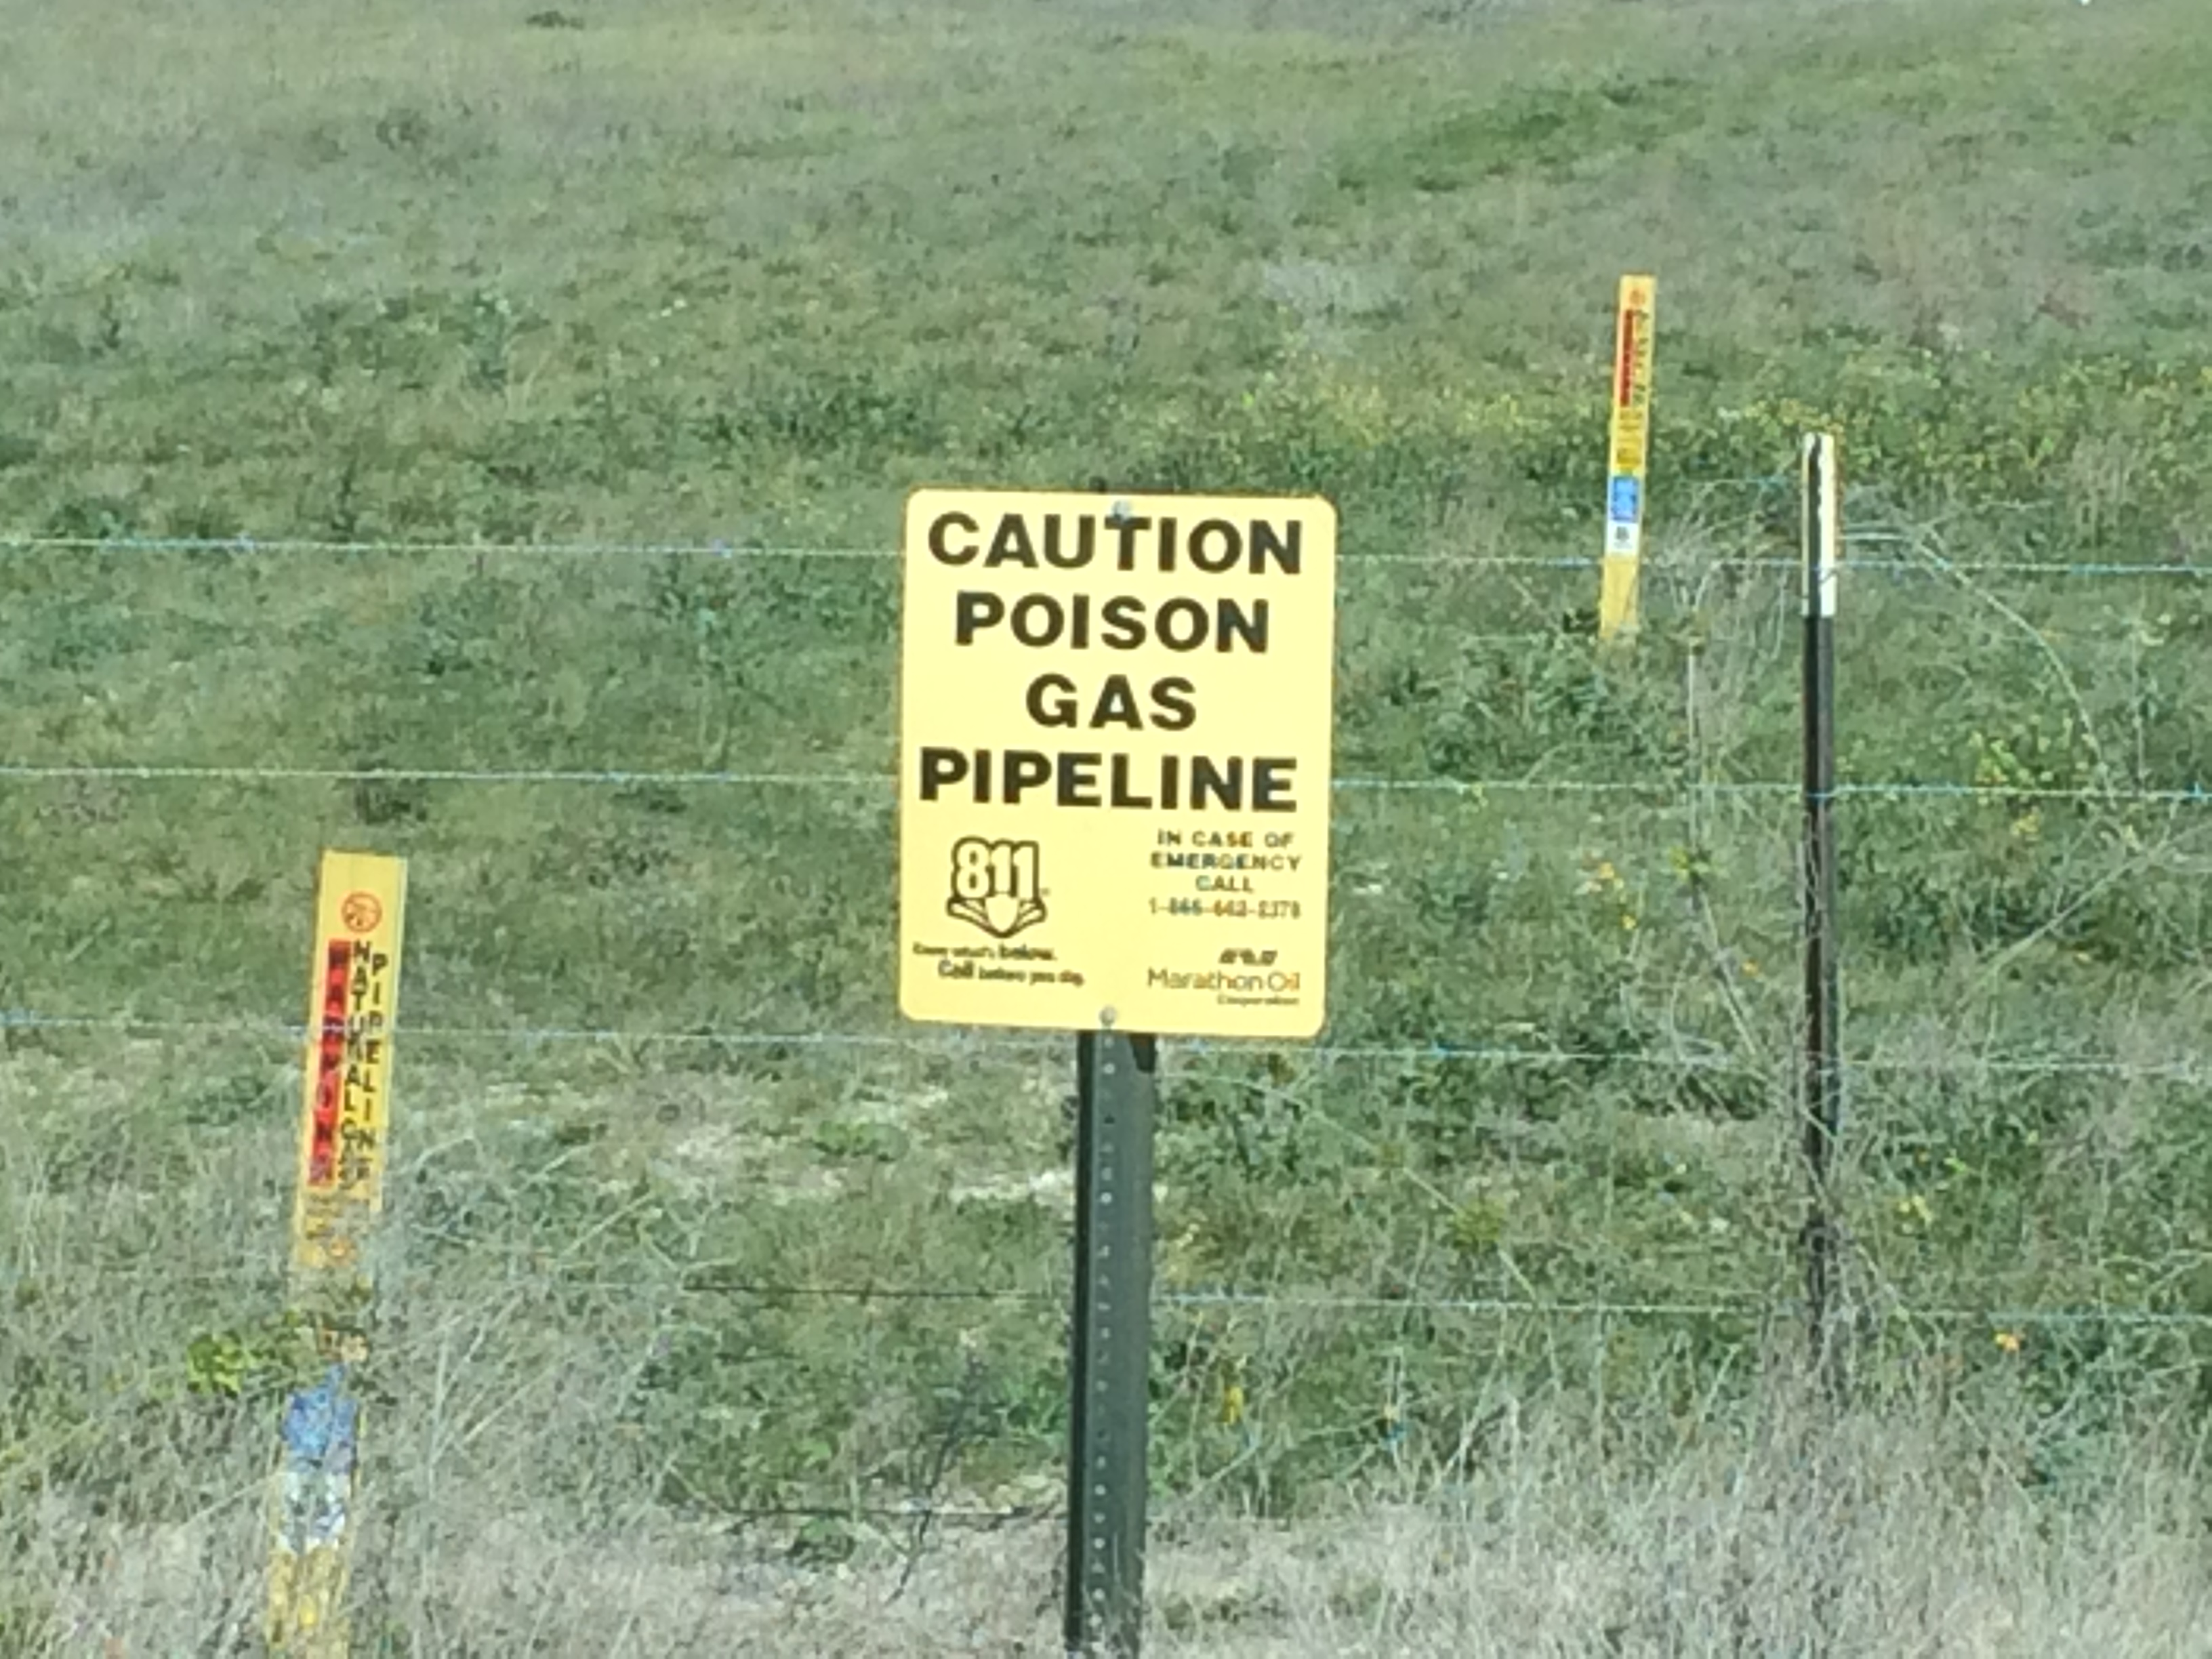
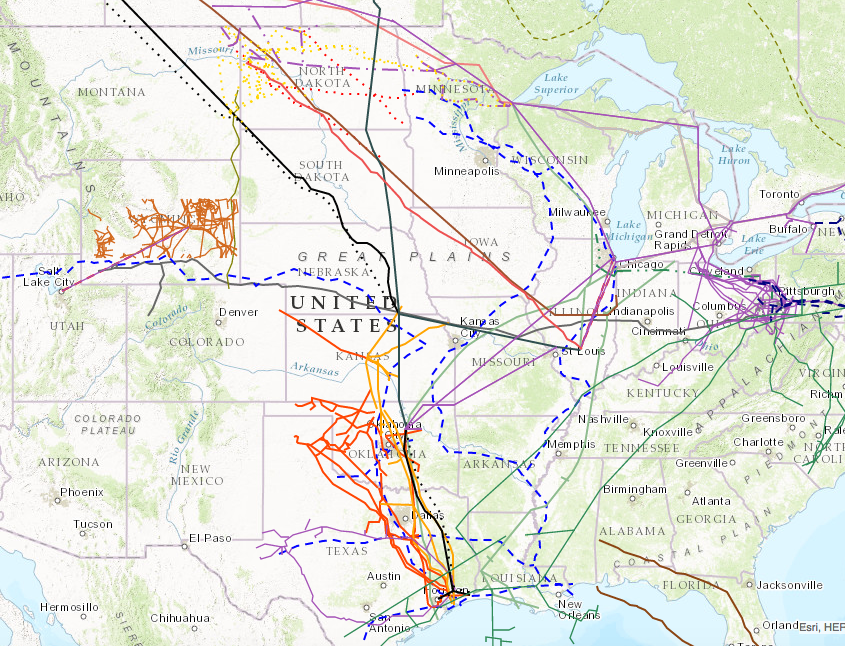
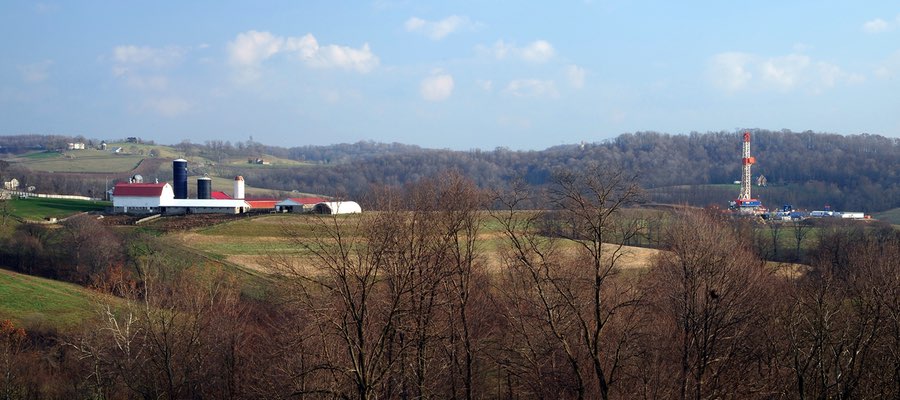
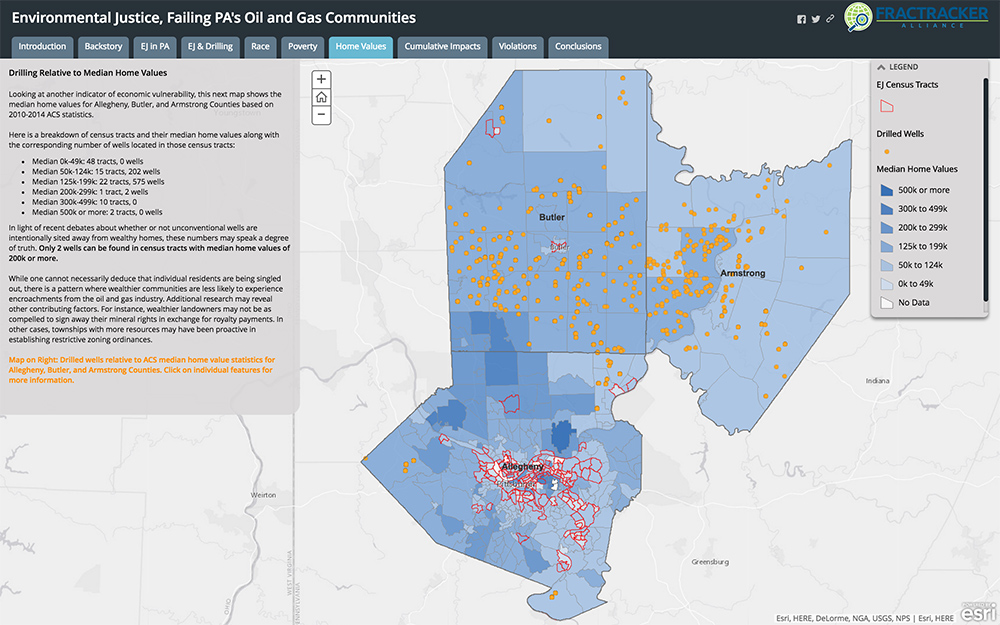
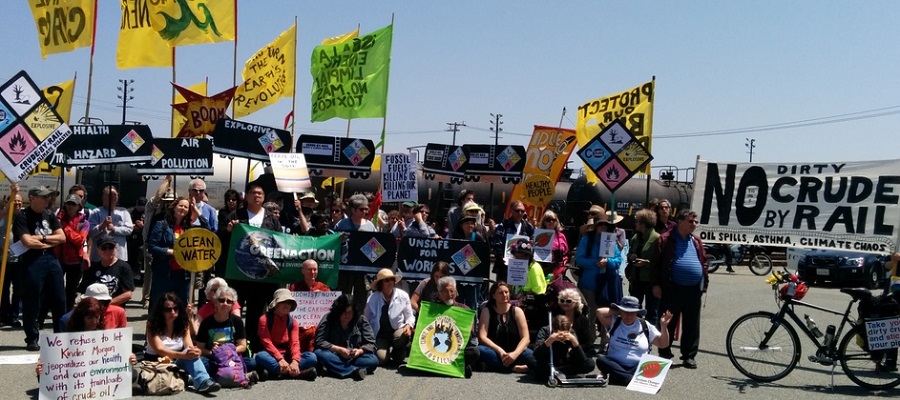
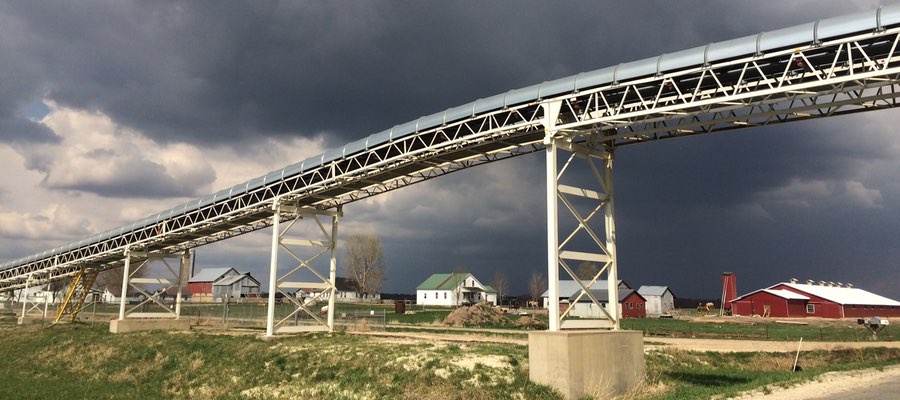
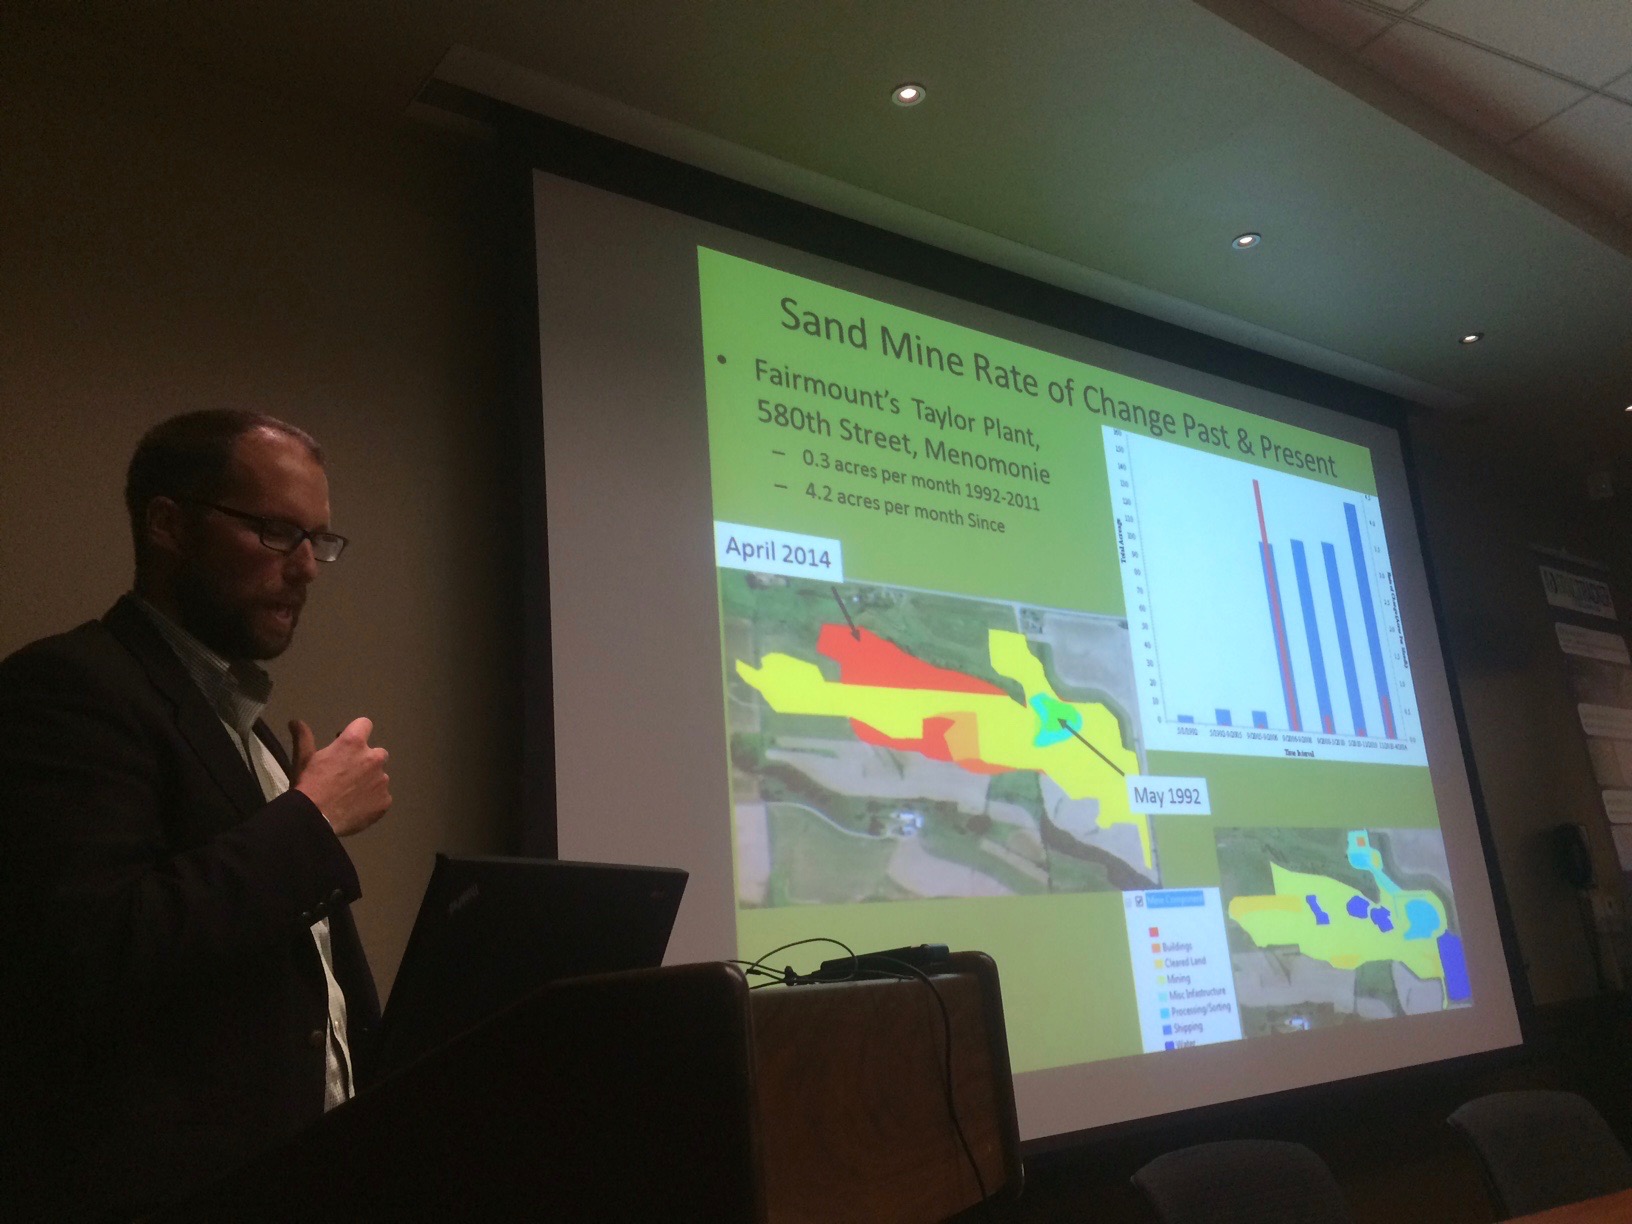
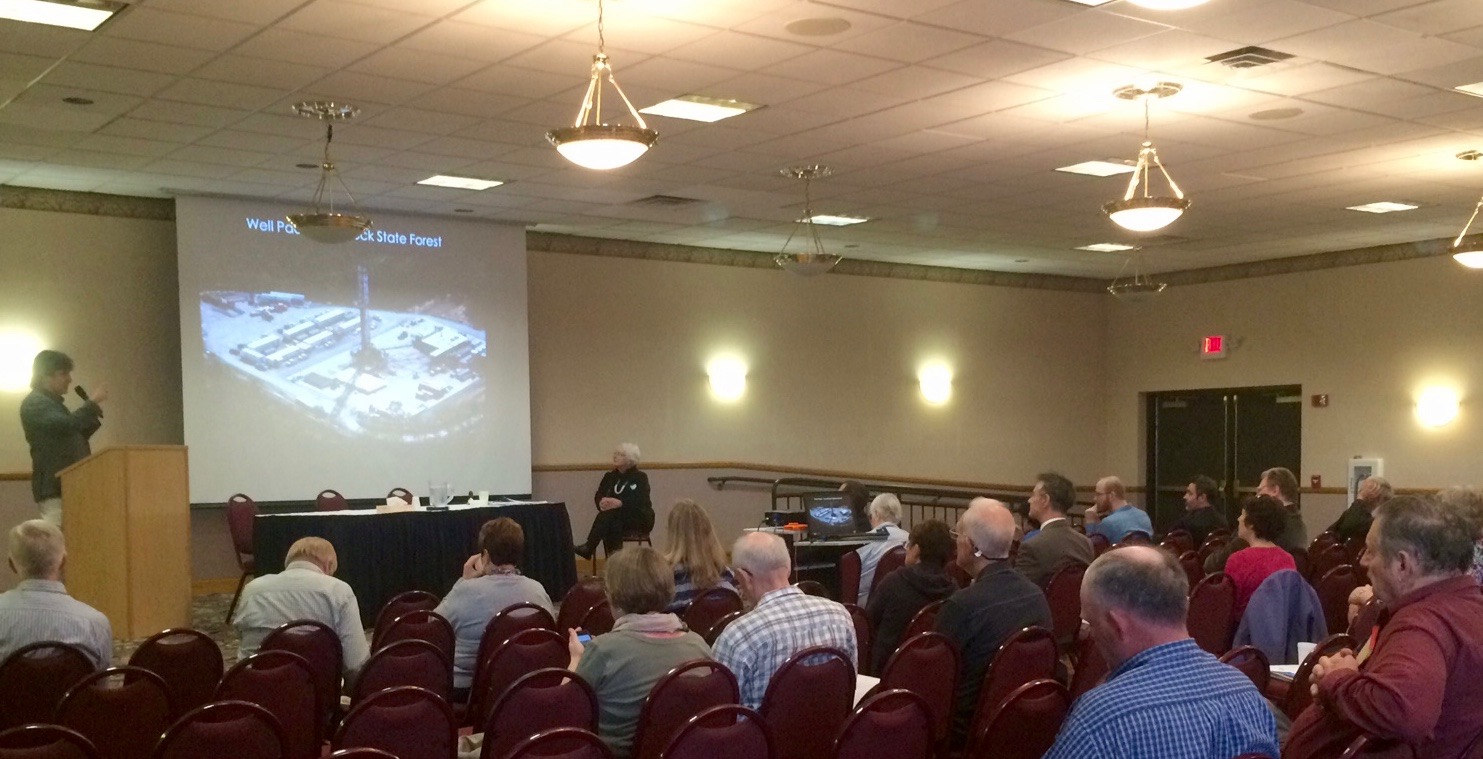


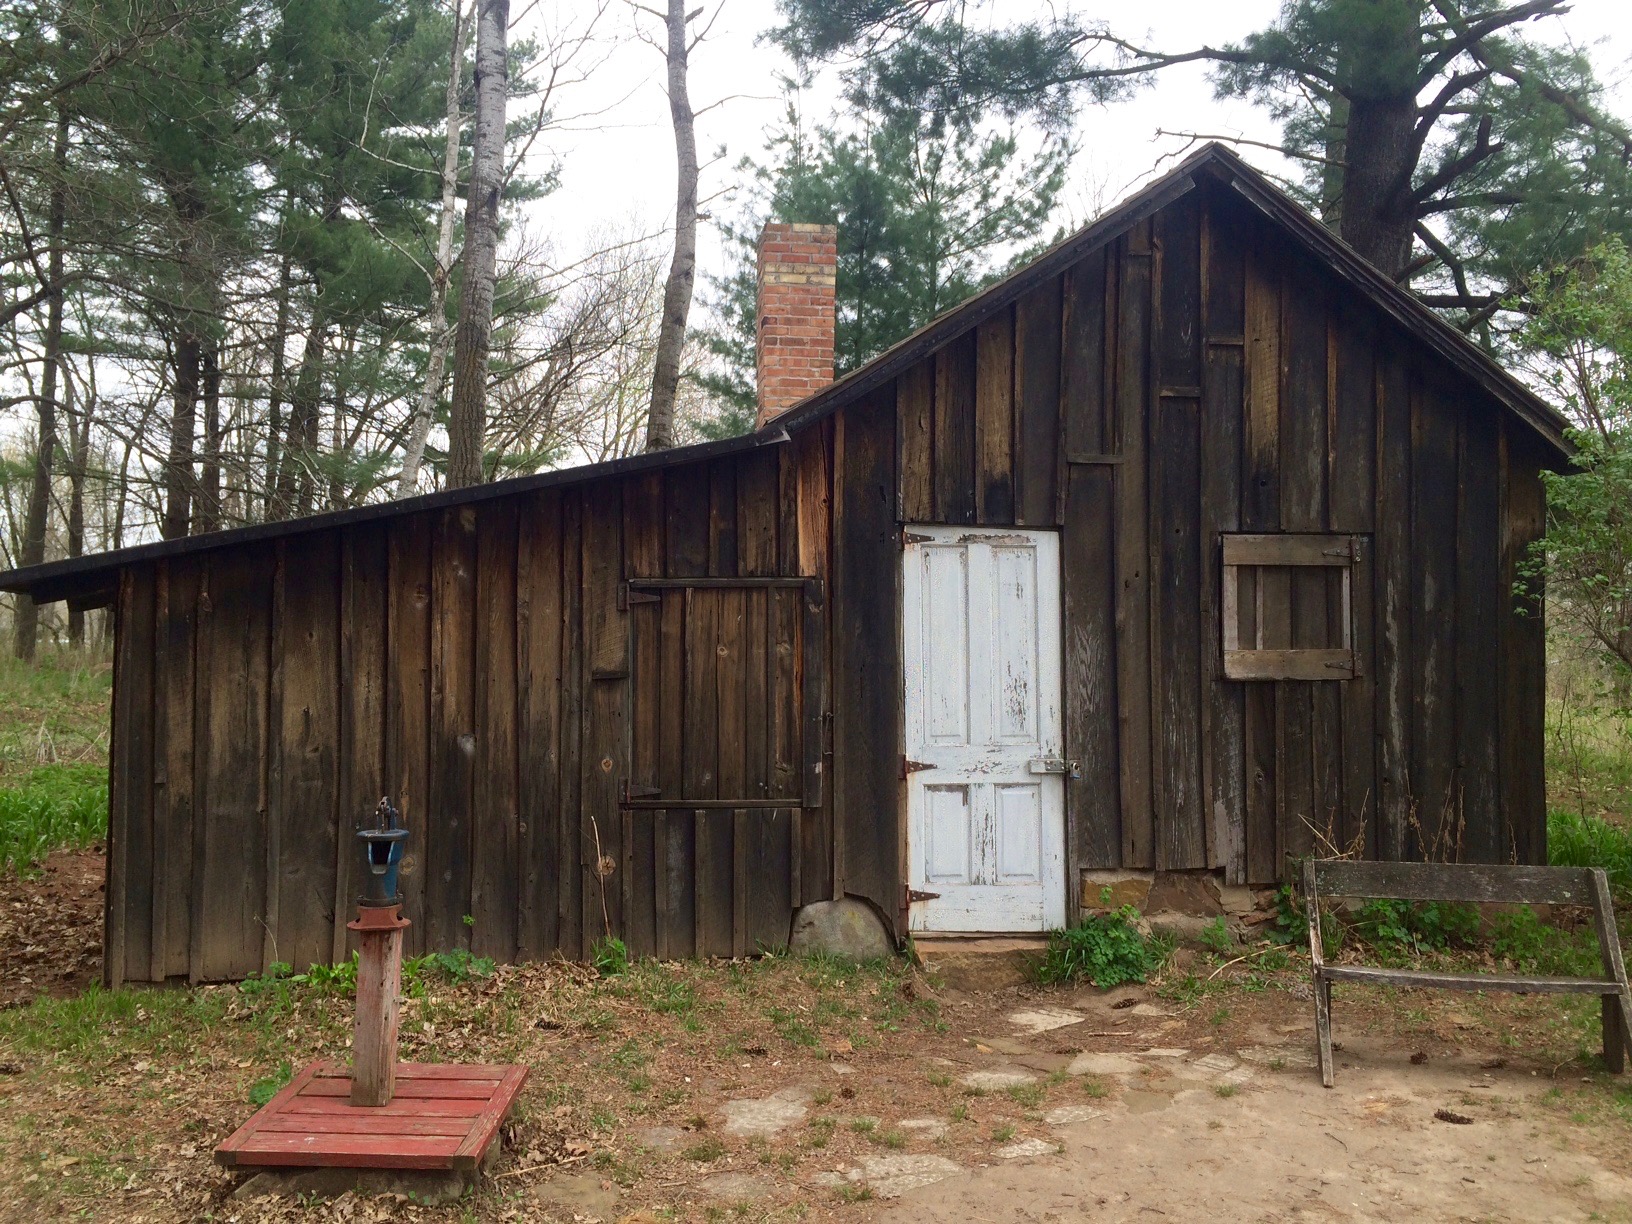
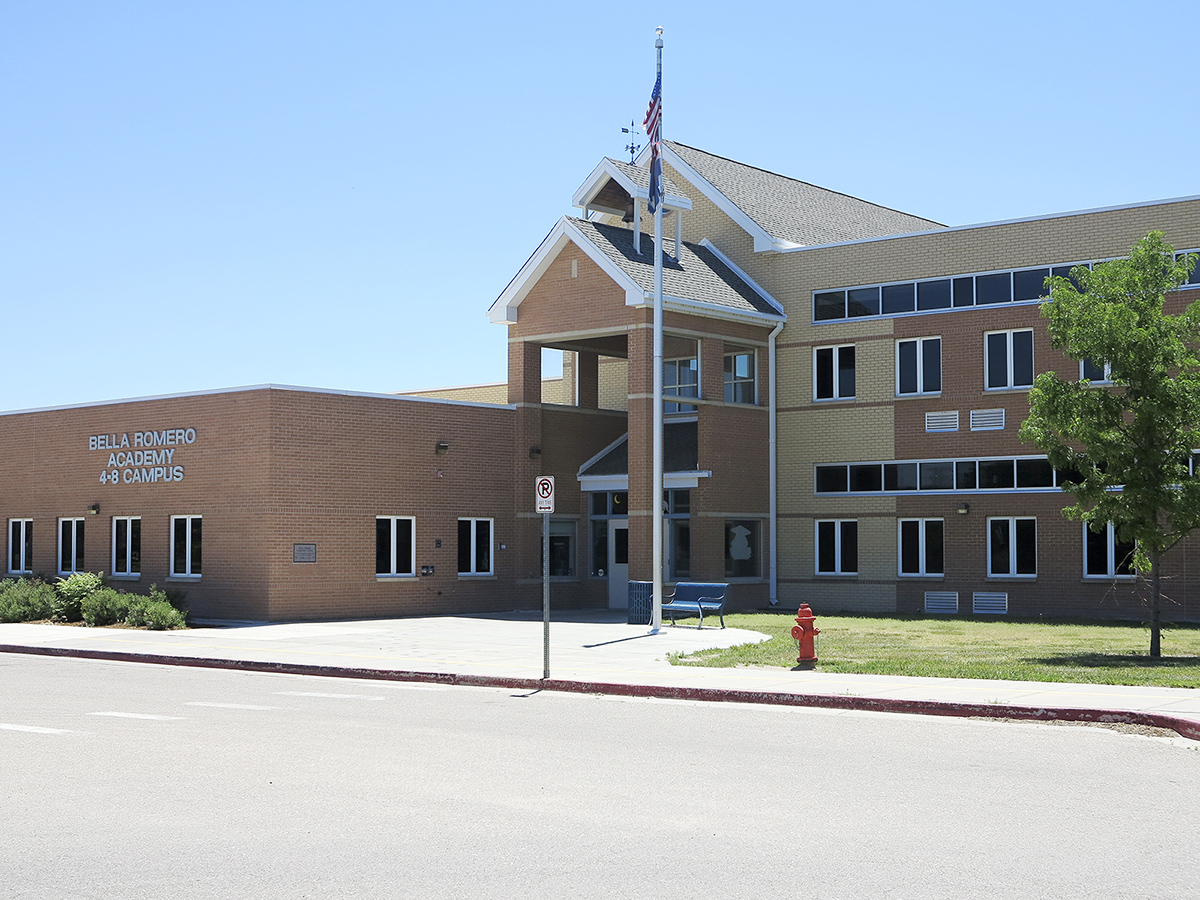