The majority of FracTracker’s posts are generally considered articles. These may include analysis around data, embedded maps, summaries of partner collaborations, highlights of a publication or project, guest posts, etc.
Chieftain’s Wisconsin Frac Sand Mine Proposal
Potential Land-Cover Change and Ecosystem Services
By Ted Auch, Great Lakes Program Coordinator, FracTracker Alliance
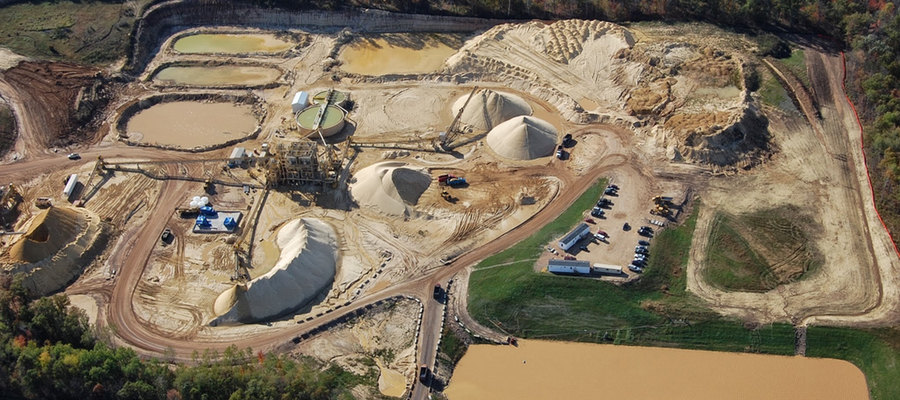
Chieftain Metals Corp, a relatively large mining company, recently proposed to develop nine silica sand mines in the Barron County, Wisconsin towns of Sioux Creek and Dovre, as well as adjacent Public Land Survey System (PLSS) parcels.1 Here we show that the land that Chieftain is proposing to convert into one of the state’s largest collections of adjacent silica sand mine acreage (like the one shown above) currently generates $8-15 million in ecosystem services and commodities per year.
Background
Sand, often silica sand, is used in the hydraulic fracturing process of oil and gas drilling. Including sand in the frac fluid helps to prop open the small cracks that are created during fracking so that the hydrocarbons can be more easily drawn into the well. To supply the growth in the oil and gas industry, bigger and bigger sand mines are being developed with four factors being critical to this expansion:
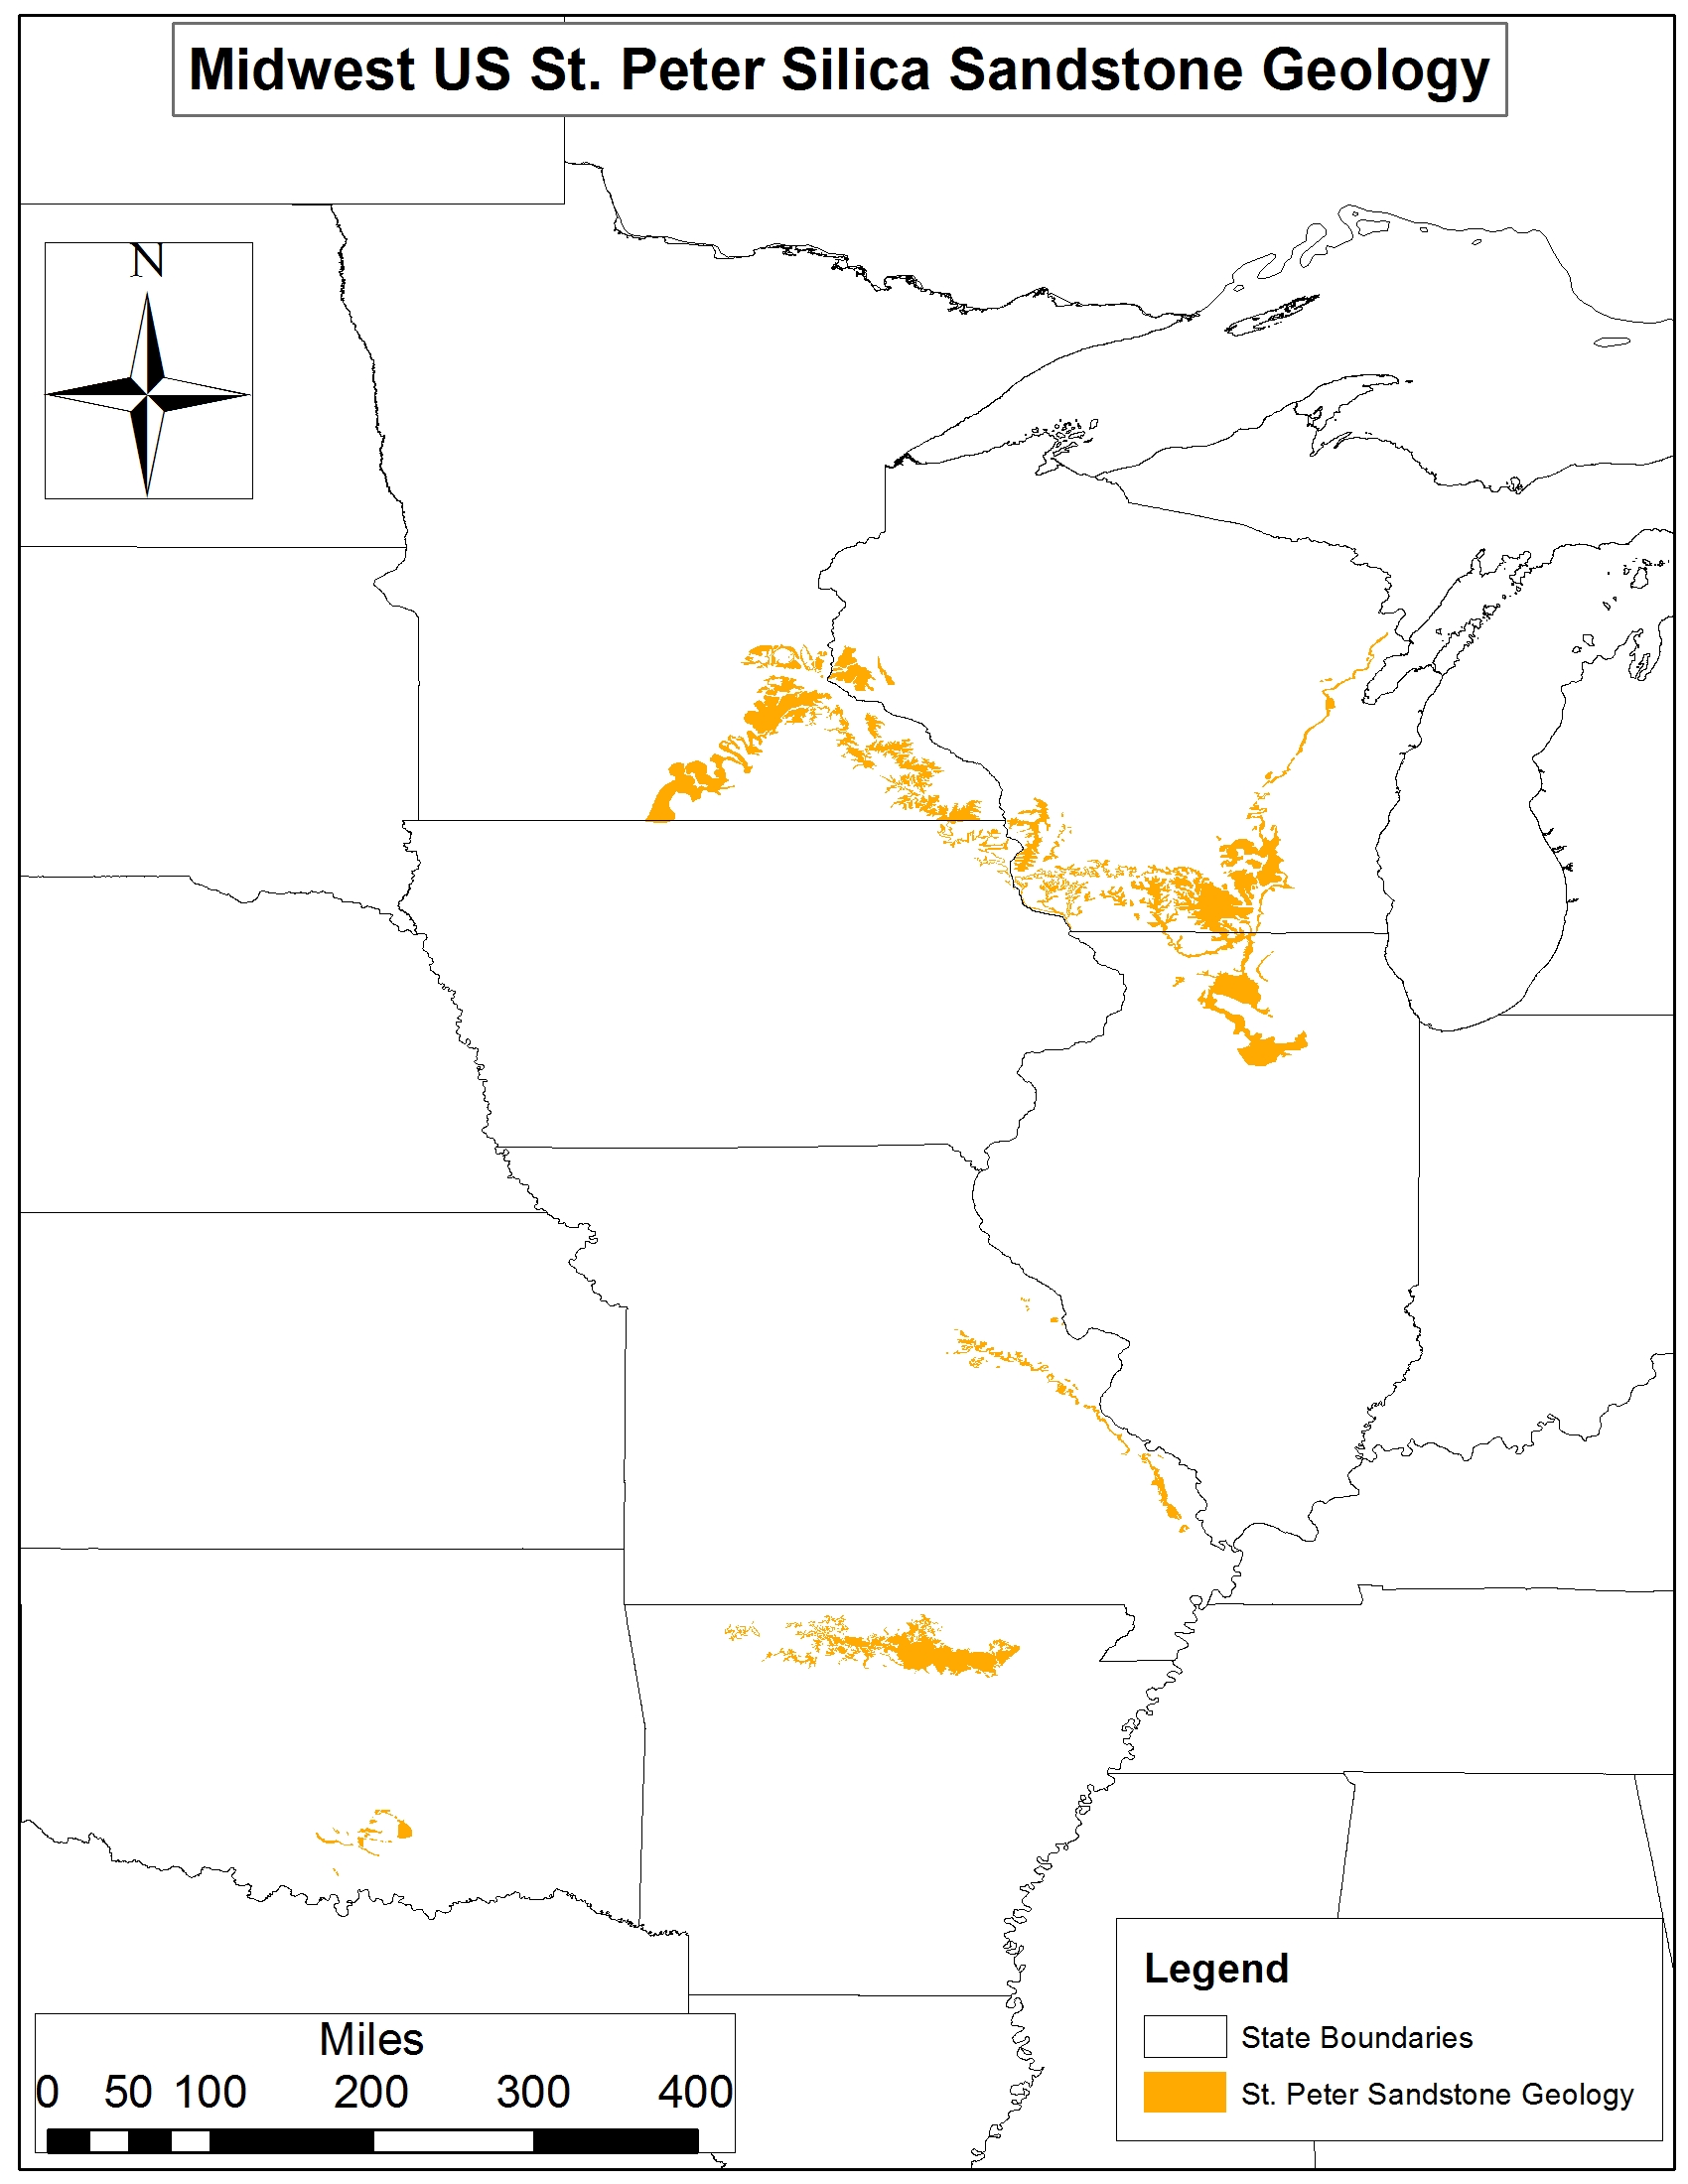
Figure 1. St. Peter Silica Sandstone geology across Minnesota, Wisconsin, Illinois, Missouri, Arkansas, and Oklahoma
- The average shale lateral is getting longer by 50-55 feet per quarter and the average silica sand demand is increasing in parallel by 85-90 tons per lateral per quarter with current averages per lateral in the range of 3,500-4,300 tons (Note: These figures stem from an analysis of 780 and 1,120 Ohio and West Virginia laterals, respectively.)
- The average silica sand mine proposal throughout the Great Lakes is increasing exponentially.
- The average sand mine is targeted at non-agricultural parcels disproportionately. As an example we looked at one of the primary Wisconsin frac sand counties and found that even though 6% of the county was forested and nearly 50% was in some form of agriculture, 98.2% of the frac sand mine area was forested prior to mining. An already fragmented landscape with respect to threatened or endangered ecosystems is becoming even more so, as the price of sand hits an exponential phase and the silica industry all but abandons its positions in Oklahoma and Texas.
- The primary geology of interest to the silica sand industry is the St. Peter Silica sandstone geology, which includes much of Southern Minnesota, West Central and Southern Wisconsin, as well as significant sections of Missouri and Arkansas (Figure 1).
Sand Mine Proposal Land Use Footprint
To quantify the land-cover/land-use change (LULC) of these proposed mines, we extracted the parcel locations from WI DNR’s Surface Water Data Viewer using the company’s construction permit.2 These parcels encompass approximately 5,671 acres along the edge of what US Forest Service calls the Eastern Broadleaf Forest (Minnesota & NE Iowa Morainal, Oak Savannah) and Laurentian Mixed Forest provinces (Southern Superior Uplands).
Using a now-defunct WI DNR program called WISCLAND we were able to determine the land-cover within the aforementioned acreage in an effort to determine potential changes in ecosystem services and watershed resilience. The WISCLAND satellite imagery was generated in 1992, so it provided a nice snapshot of what this region’s landscape looks like absent silica sand mining.
In our joining of the PLSS and WISCLAND data we determined that 2,684 acres (47%) are currently covered by forests, namely:
- Mixed/Other Broad-leaved Deciduous,
- with scattered patches of Sugar Maple (Acer saccharum), and
- Jack Pine (Pinus banksiana) in the northeast sections (Figures 2 and 3).
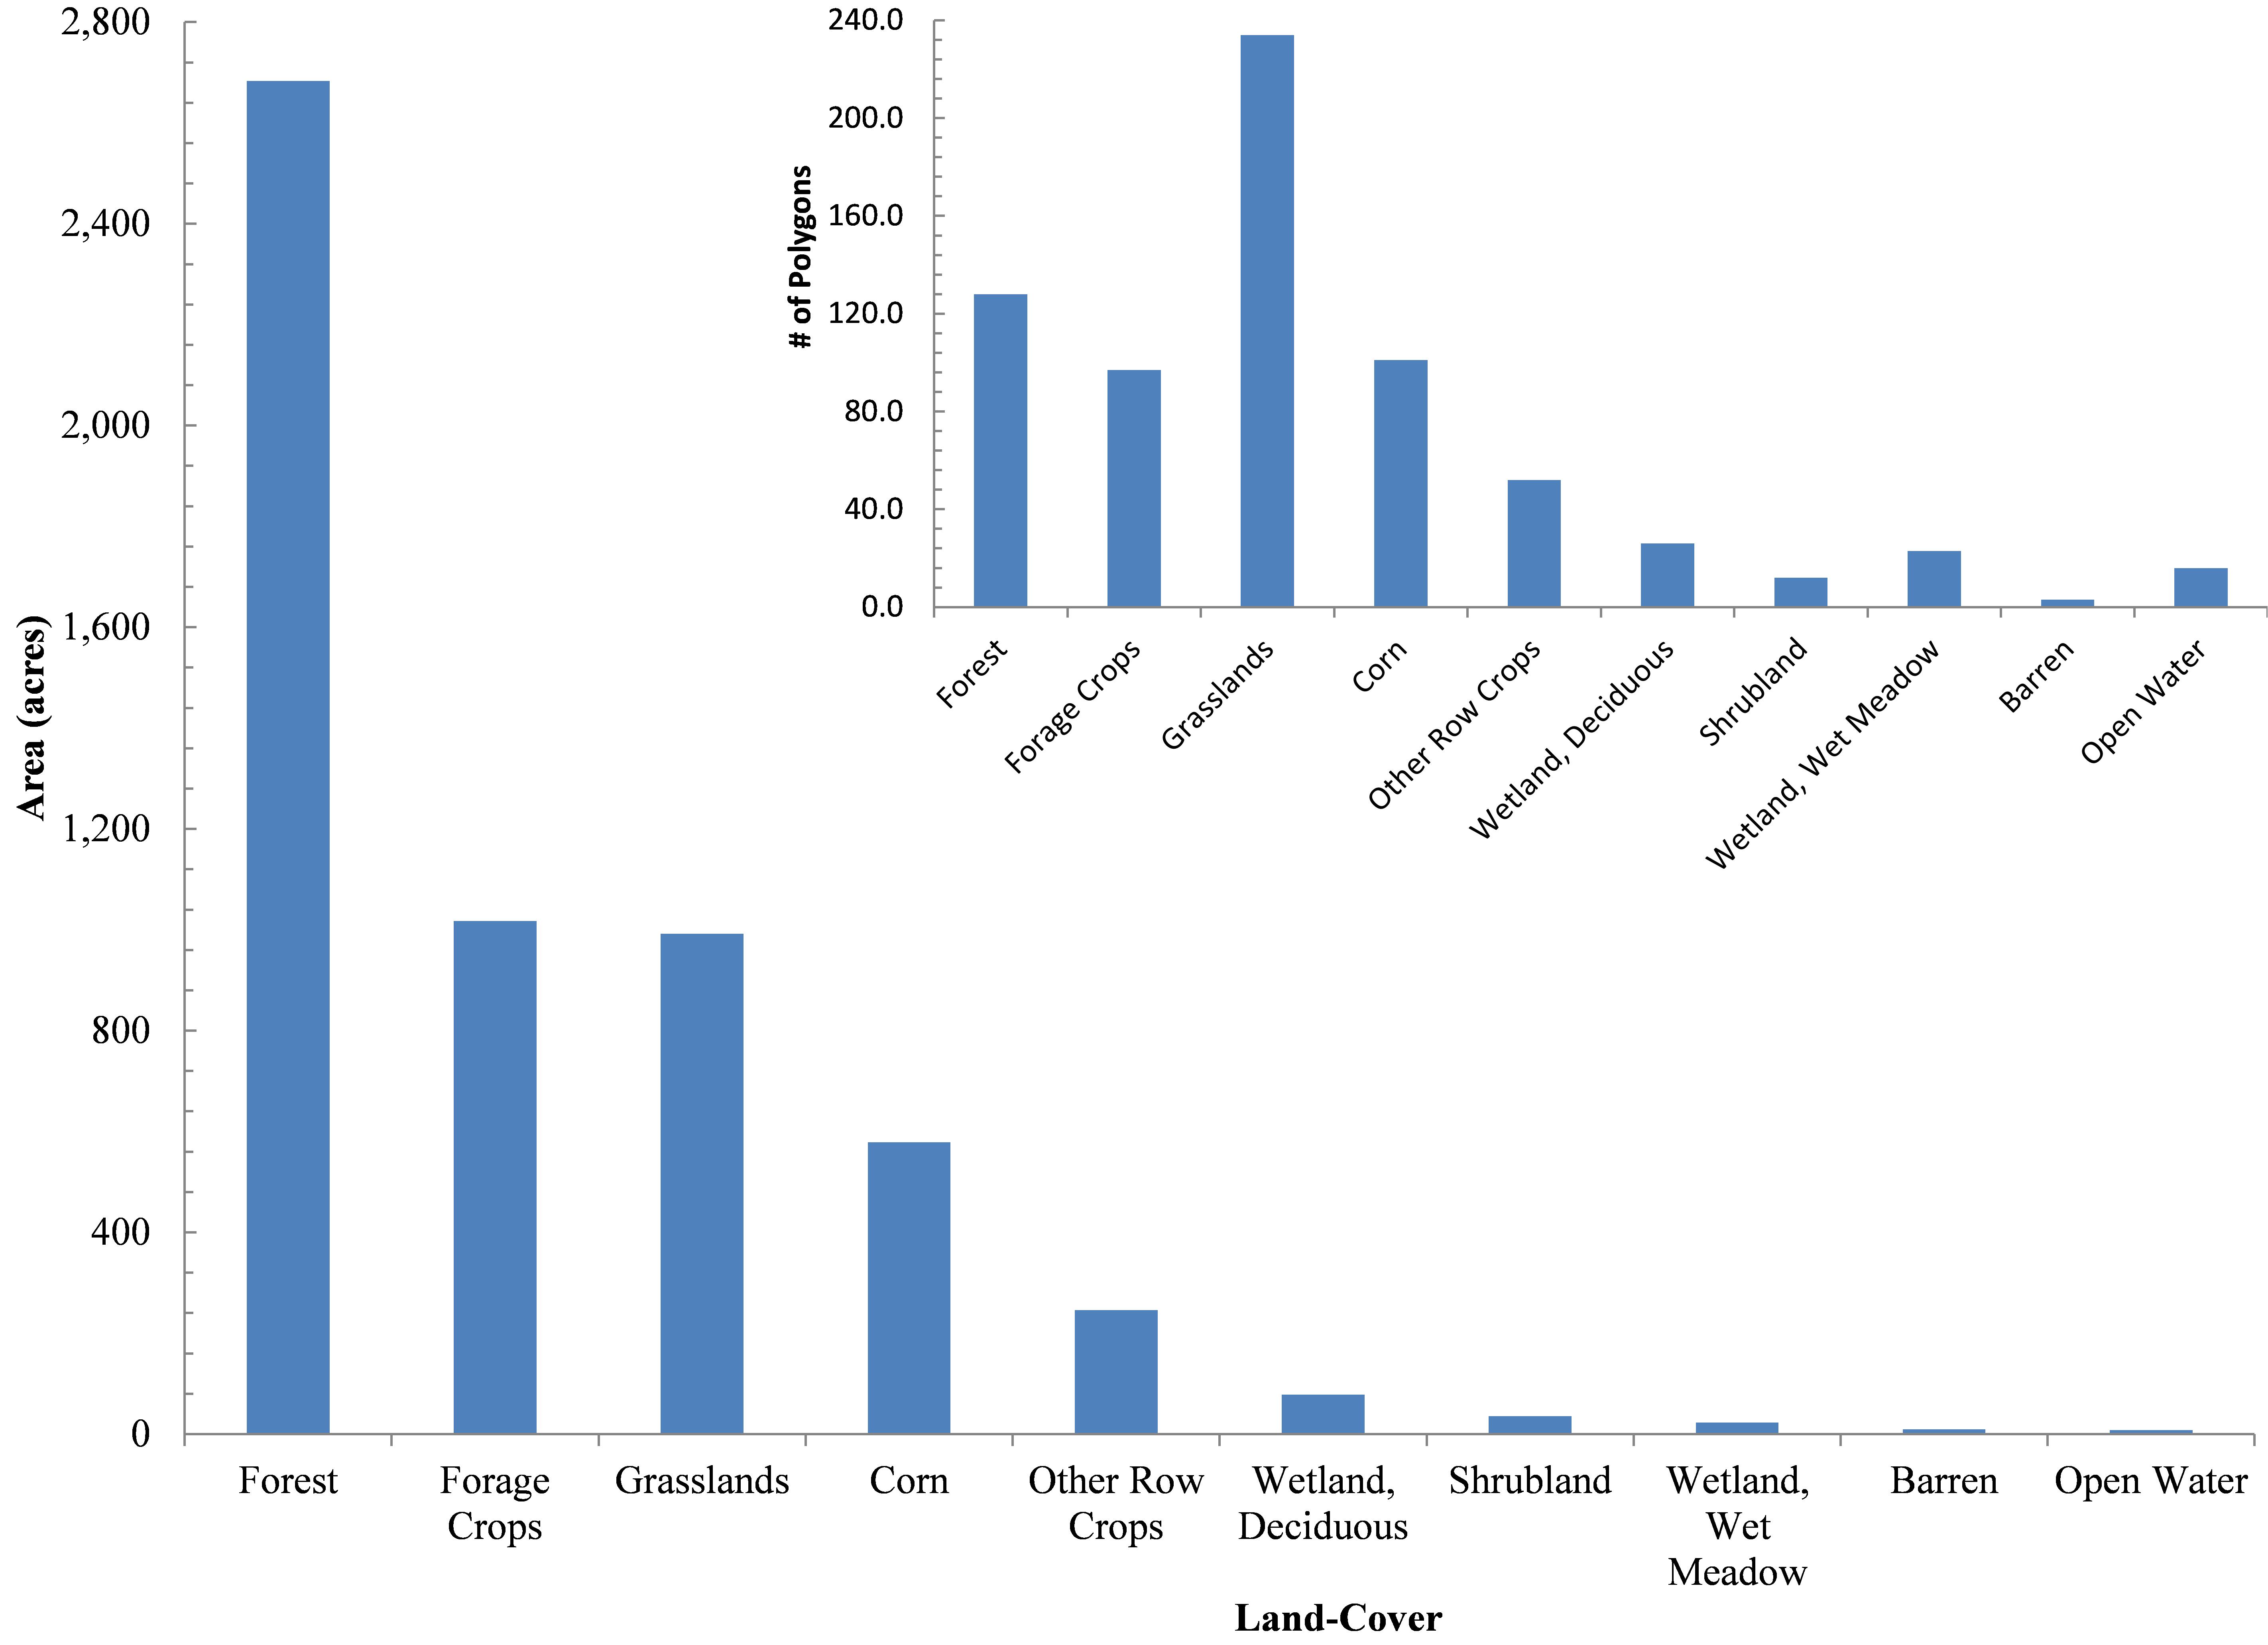 Figure 2. Chieftain silica sand mine proposal’s land-cover across 5,671 acres in Barron County, WI |
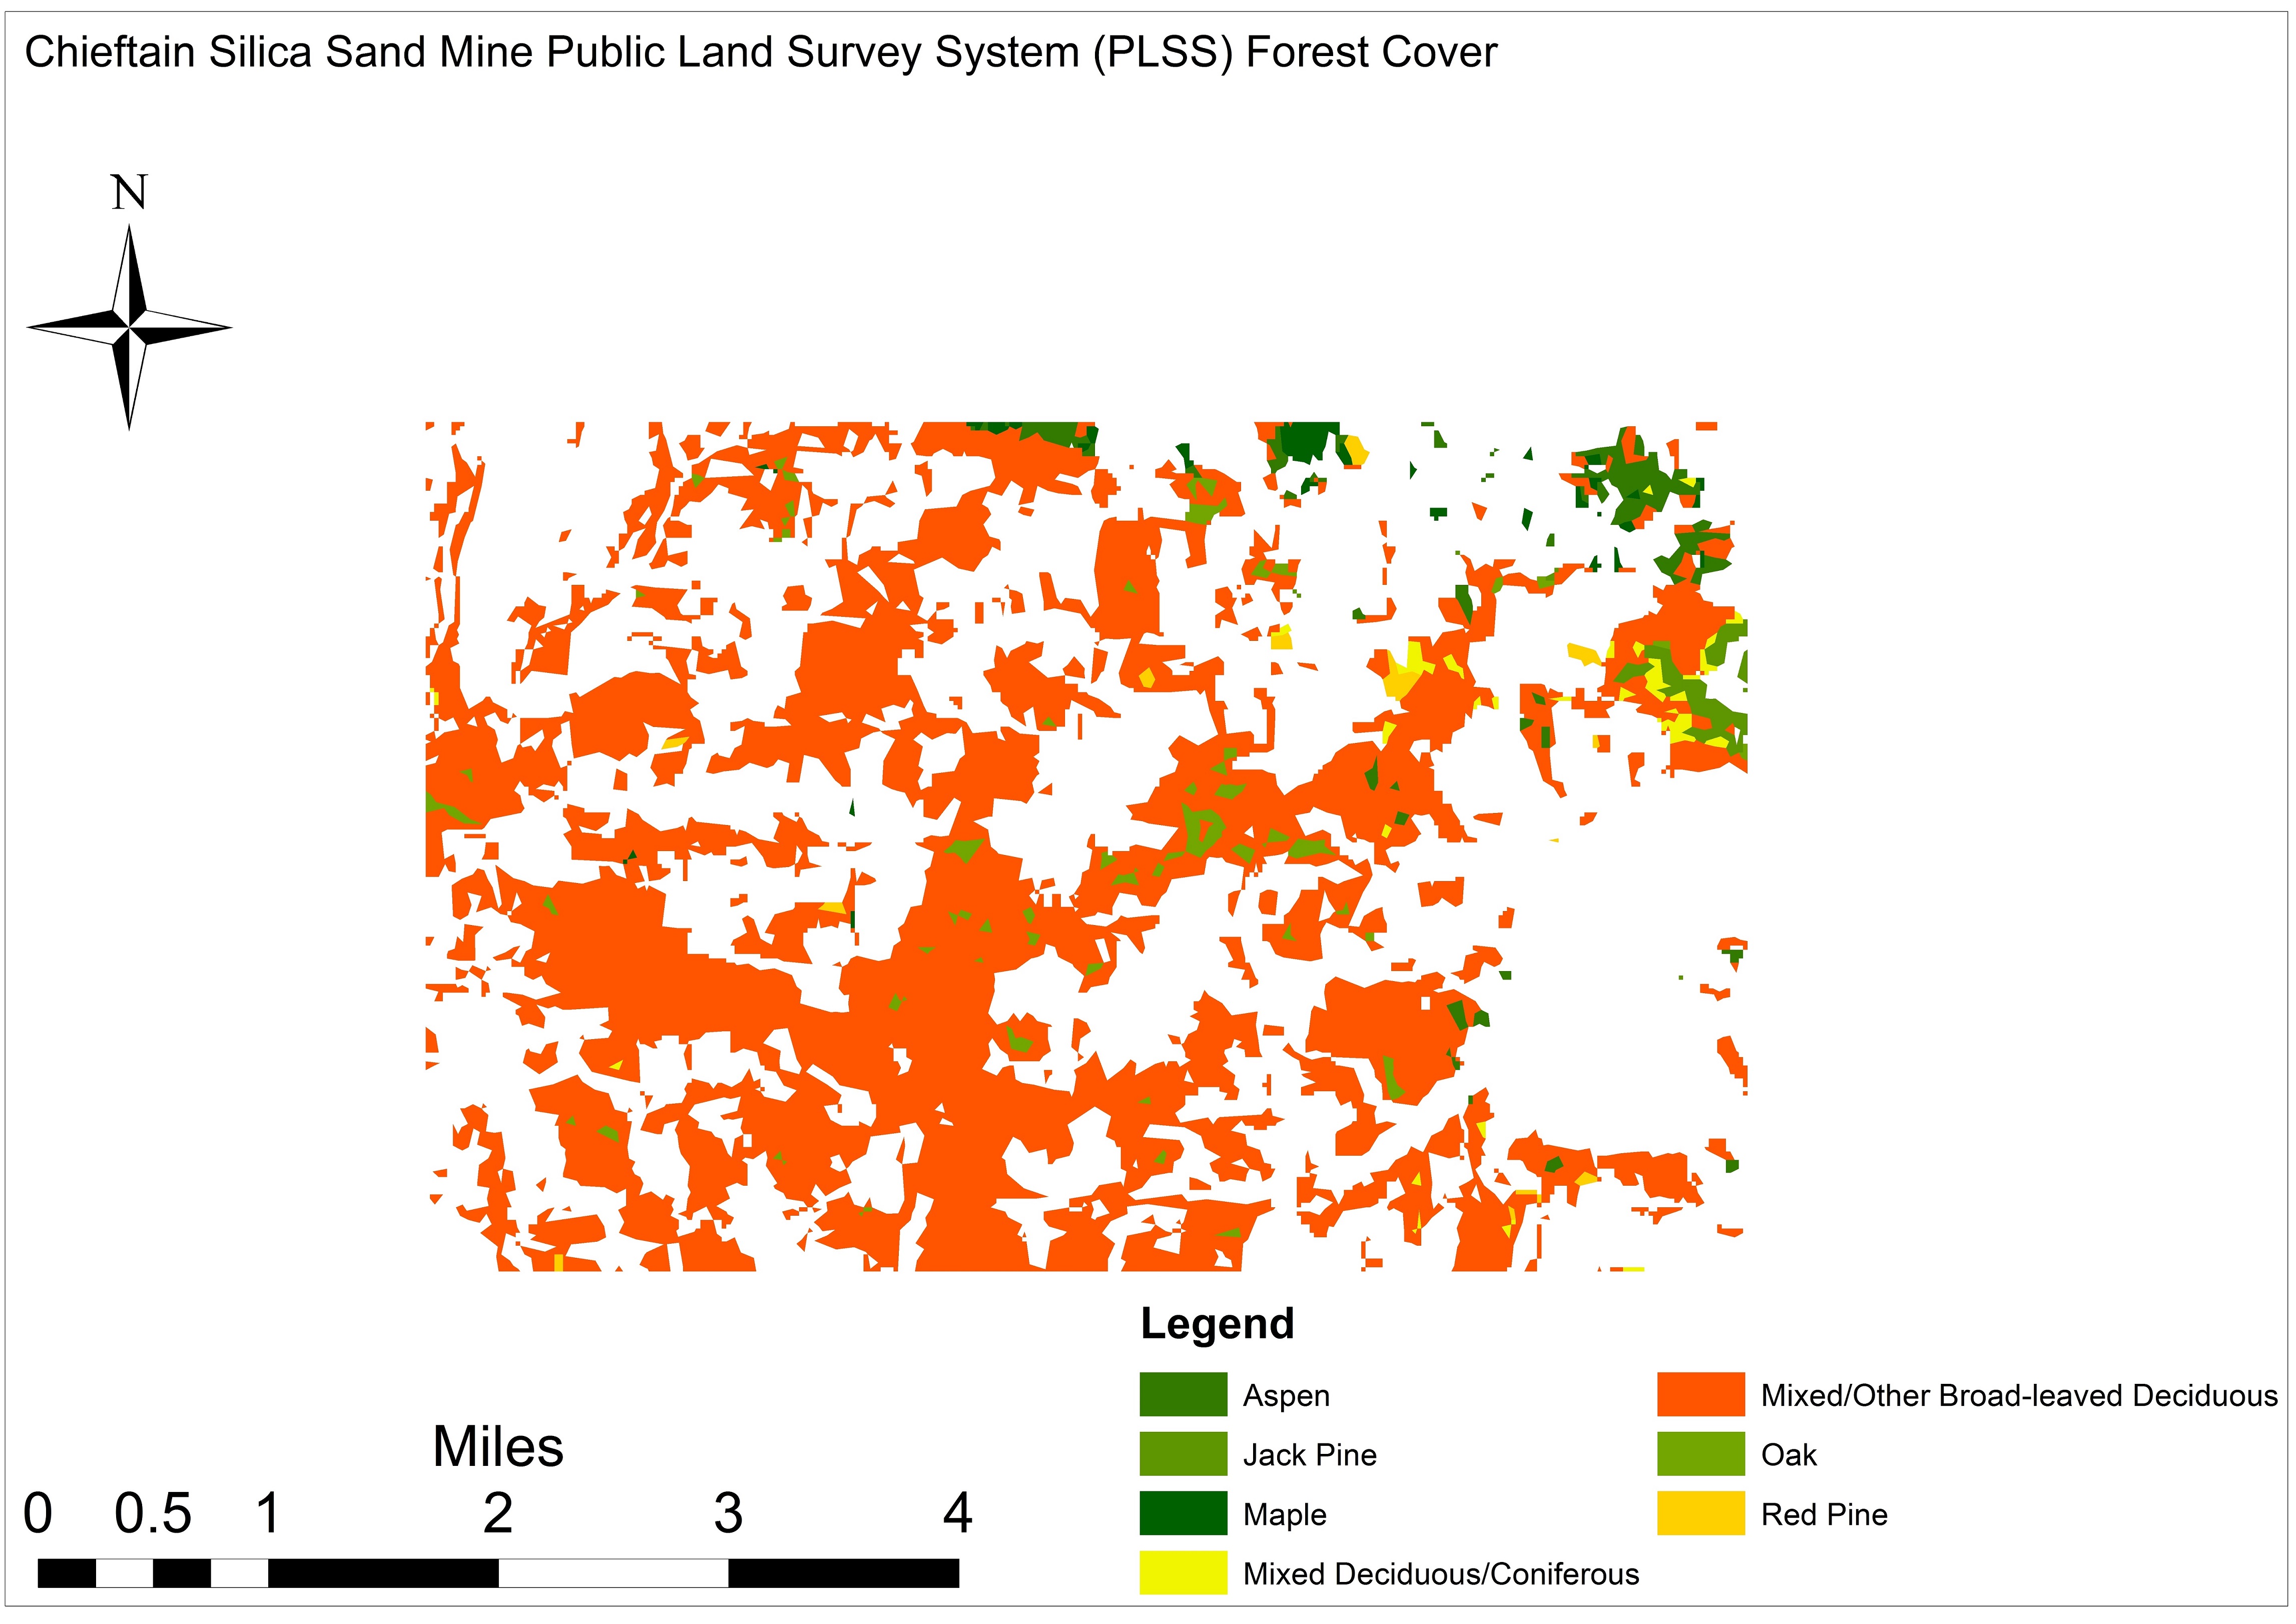 Figure 3. Chieftain proposal’s forest cover across 5,671 acres in Barron County, WI |
Forage crops and grasslands occupy 2,010 acres (35%) across 331 polygons averaging 7 acres scattered across the proposed mining area. Corn and other row crops account for 825 acres (15%) of Chieftain’s proposal, randomly distributed across the area of interest. Collectively, these land-cover types account for 22% of all polygons averaging 5.7 and 4.7 acres, respectively. Shrublands account for ≤1% of the Chieftain proposal (36 acres) averaging 3 acres spread across a mere 12 polygons (Figures 4 and 5).
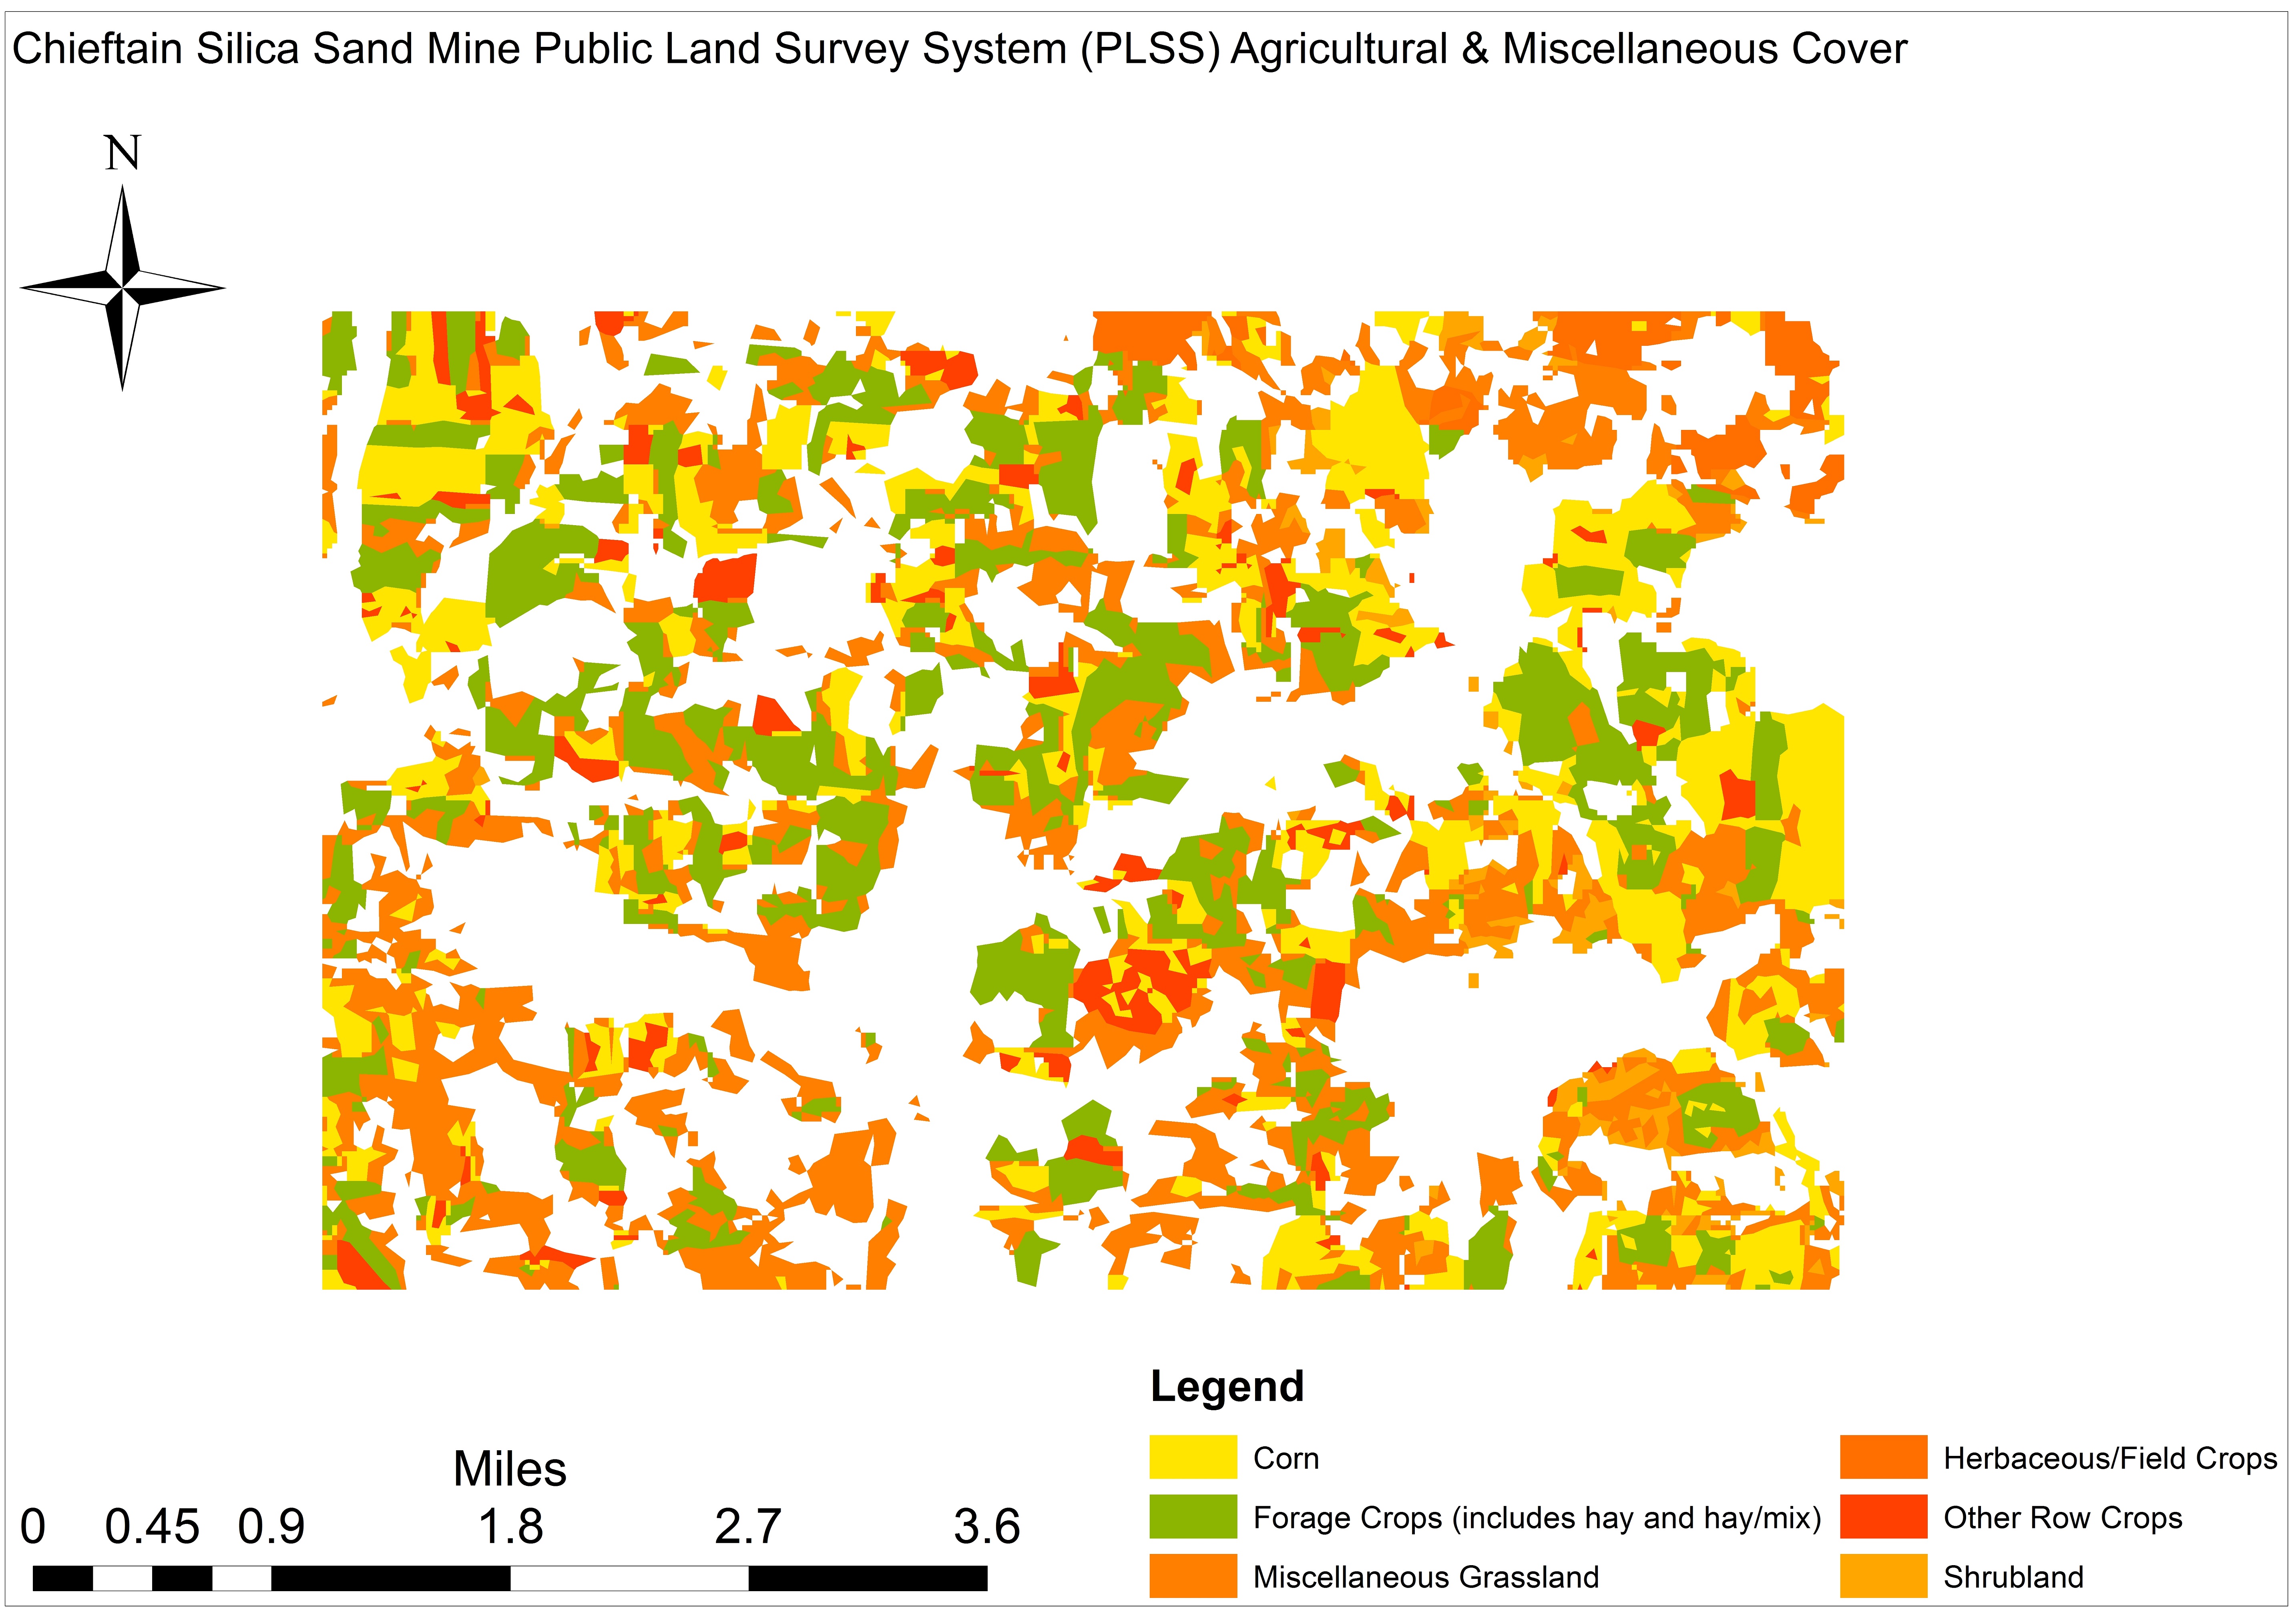 Figure 4. Chieftain proposal’s agricultural & miscellaneous cover across 5,671 acres, Barron County, WI |
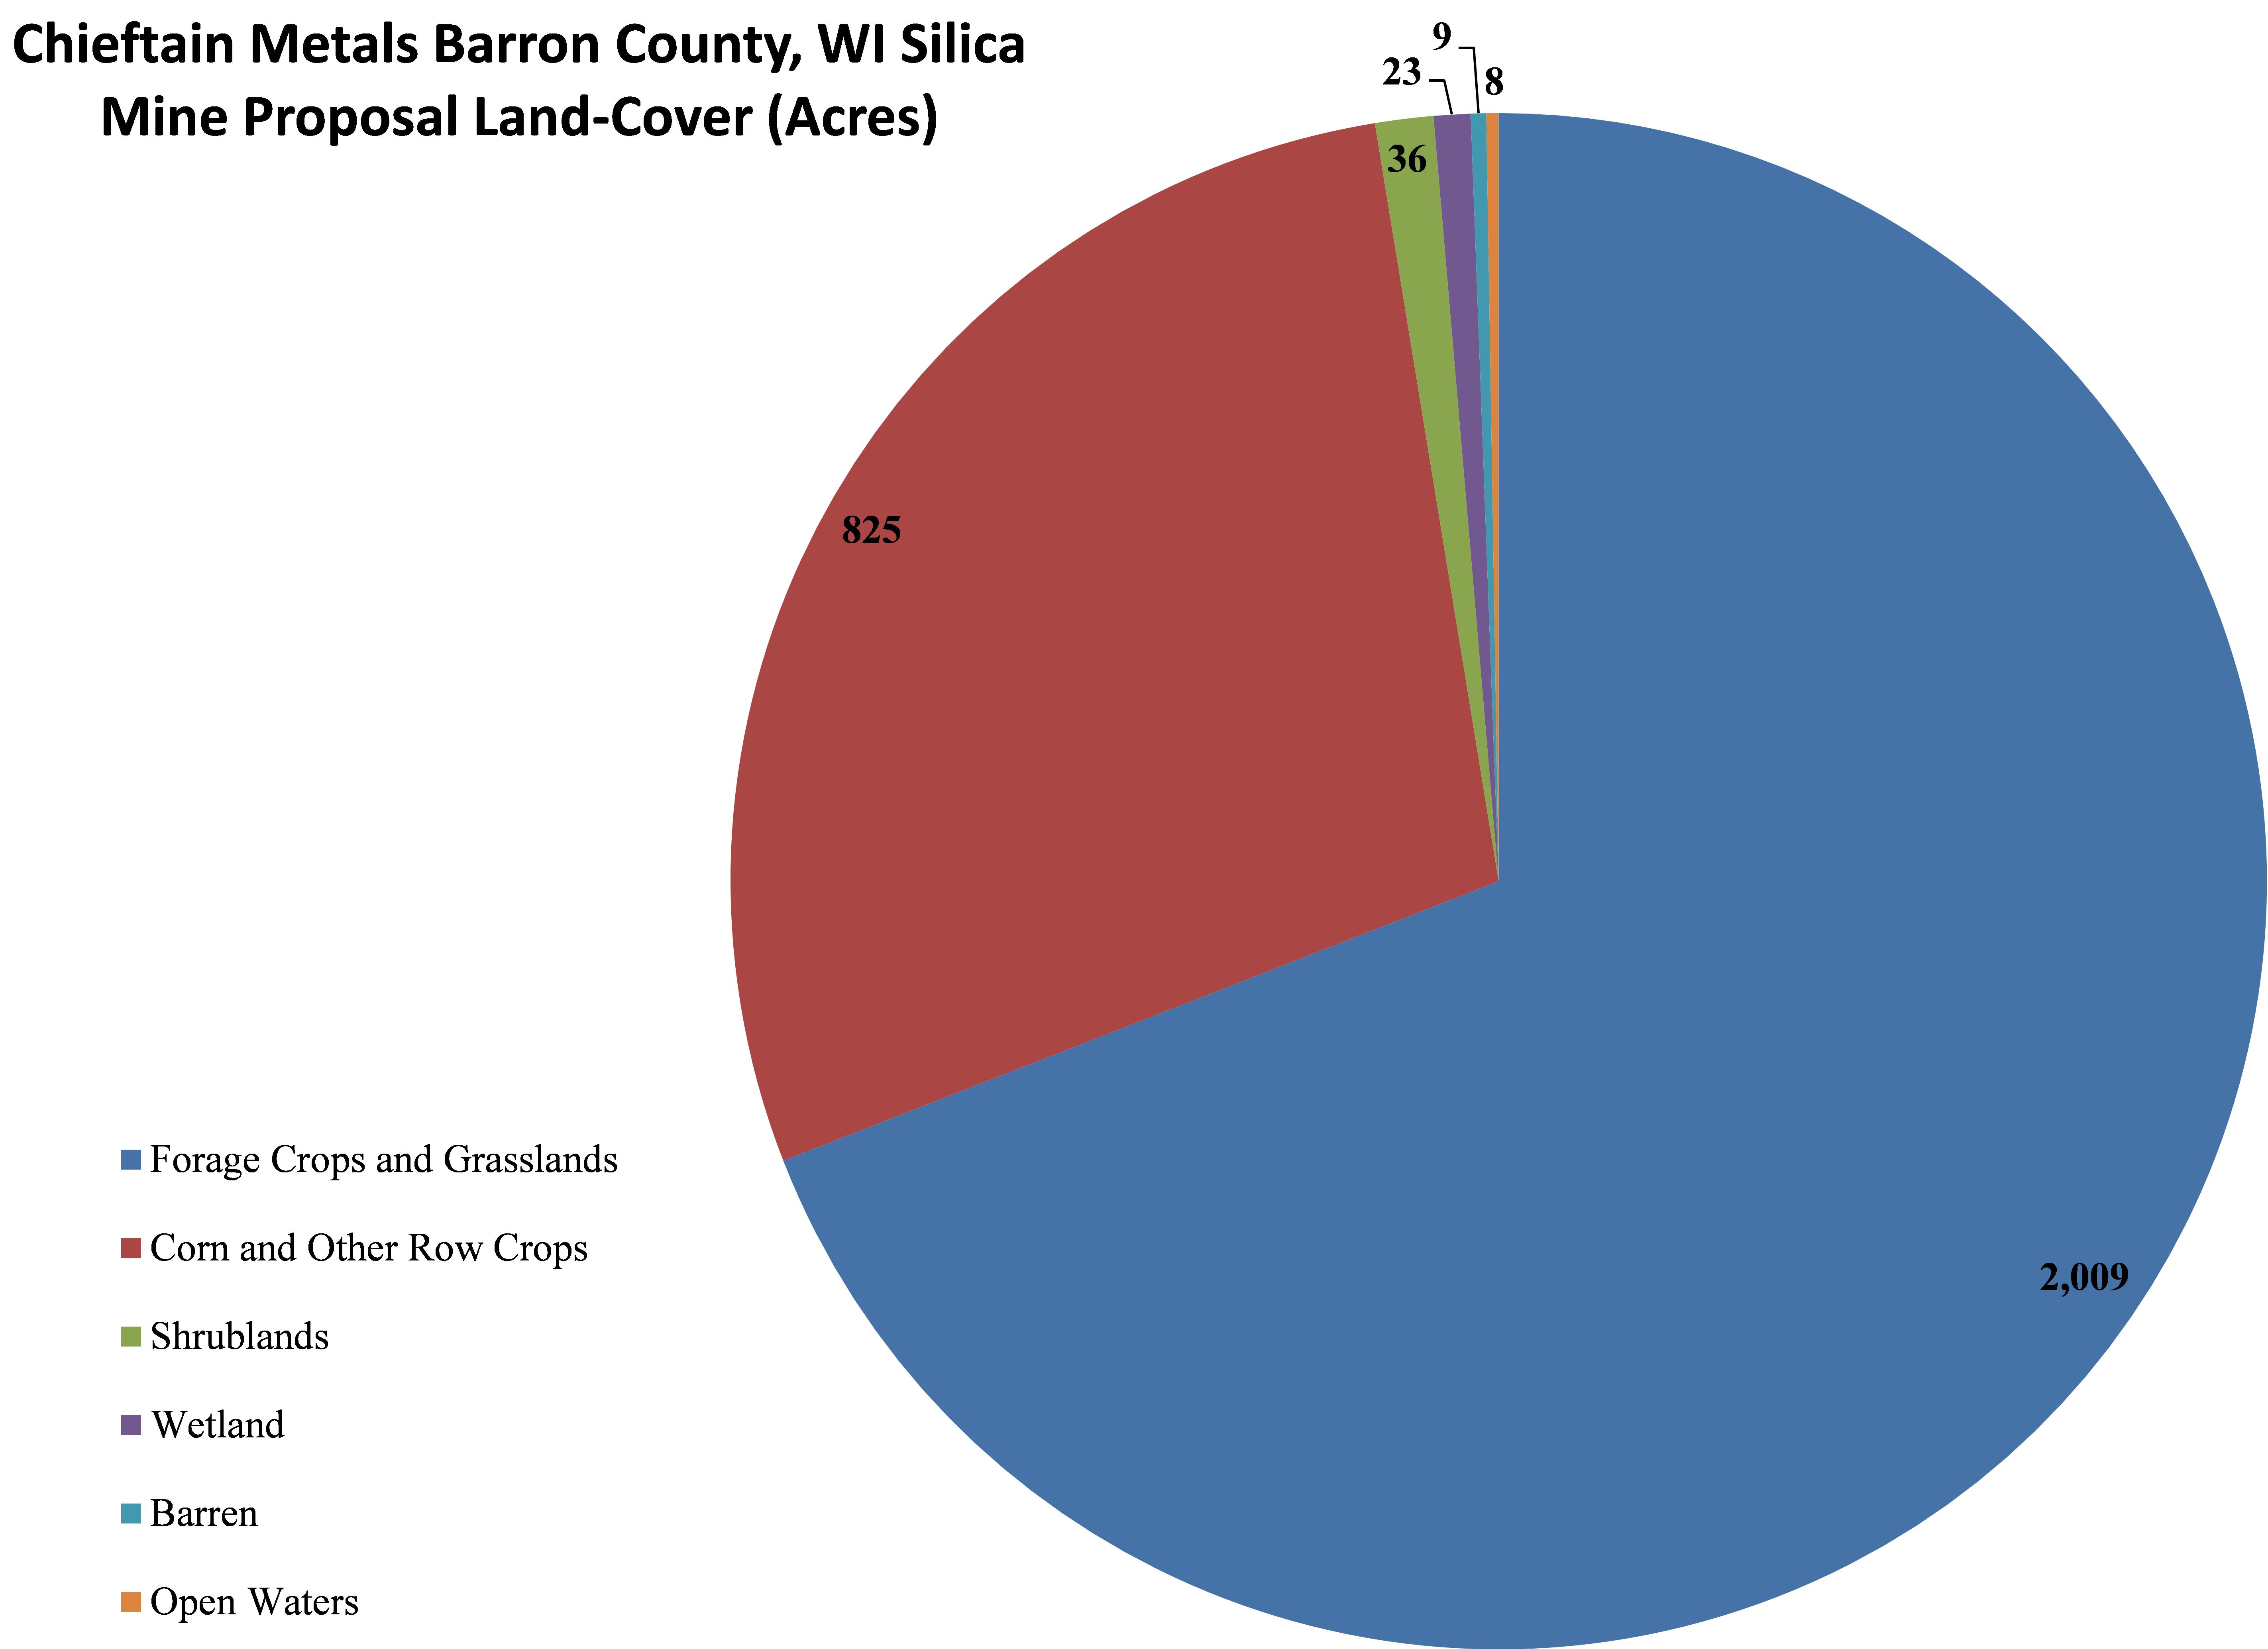 Figure 5. Chieftain proposal’s land-cover by acreage across 5,671 acres, Barron County, WI |
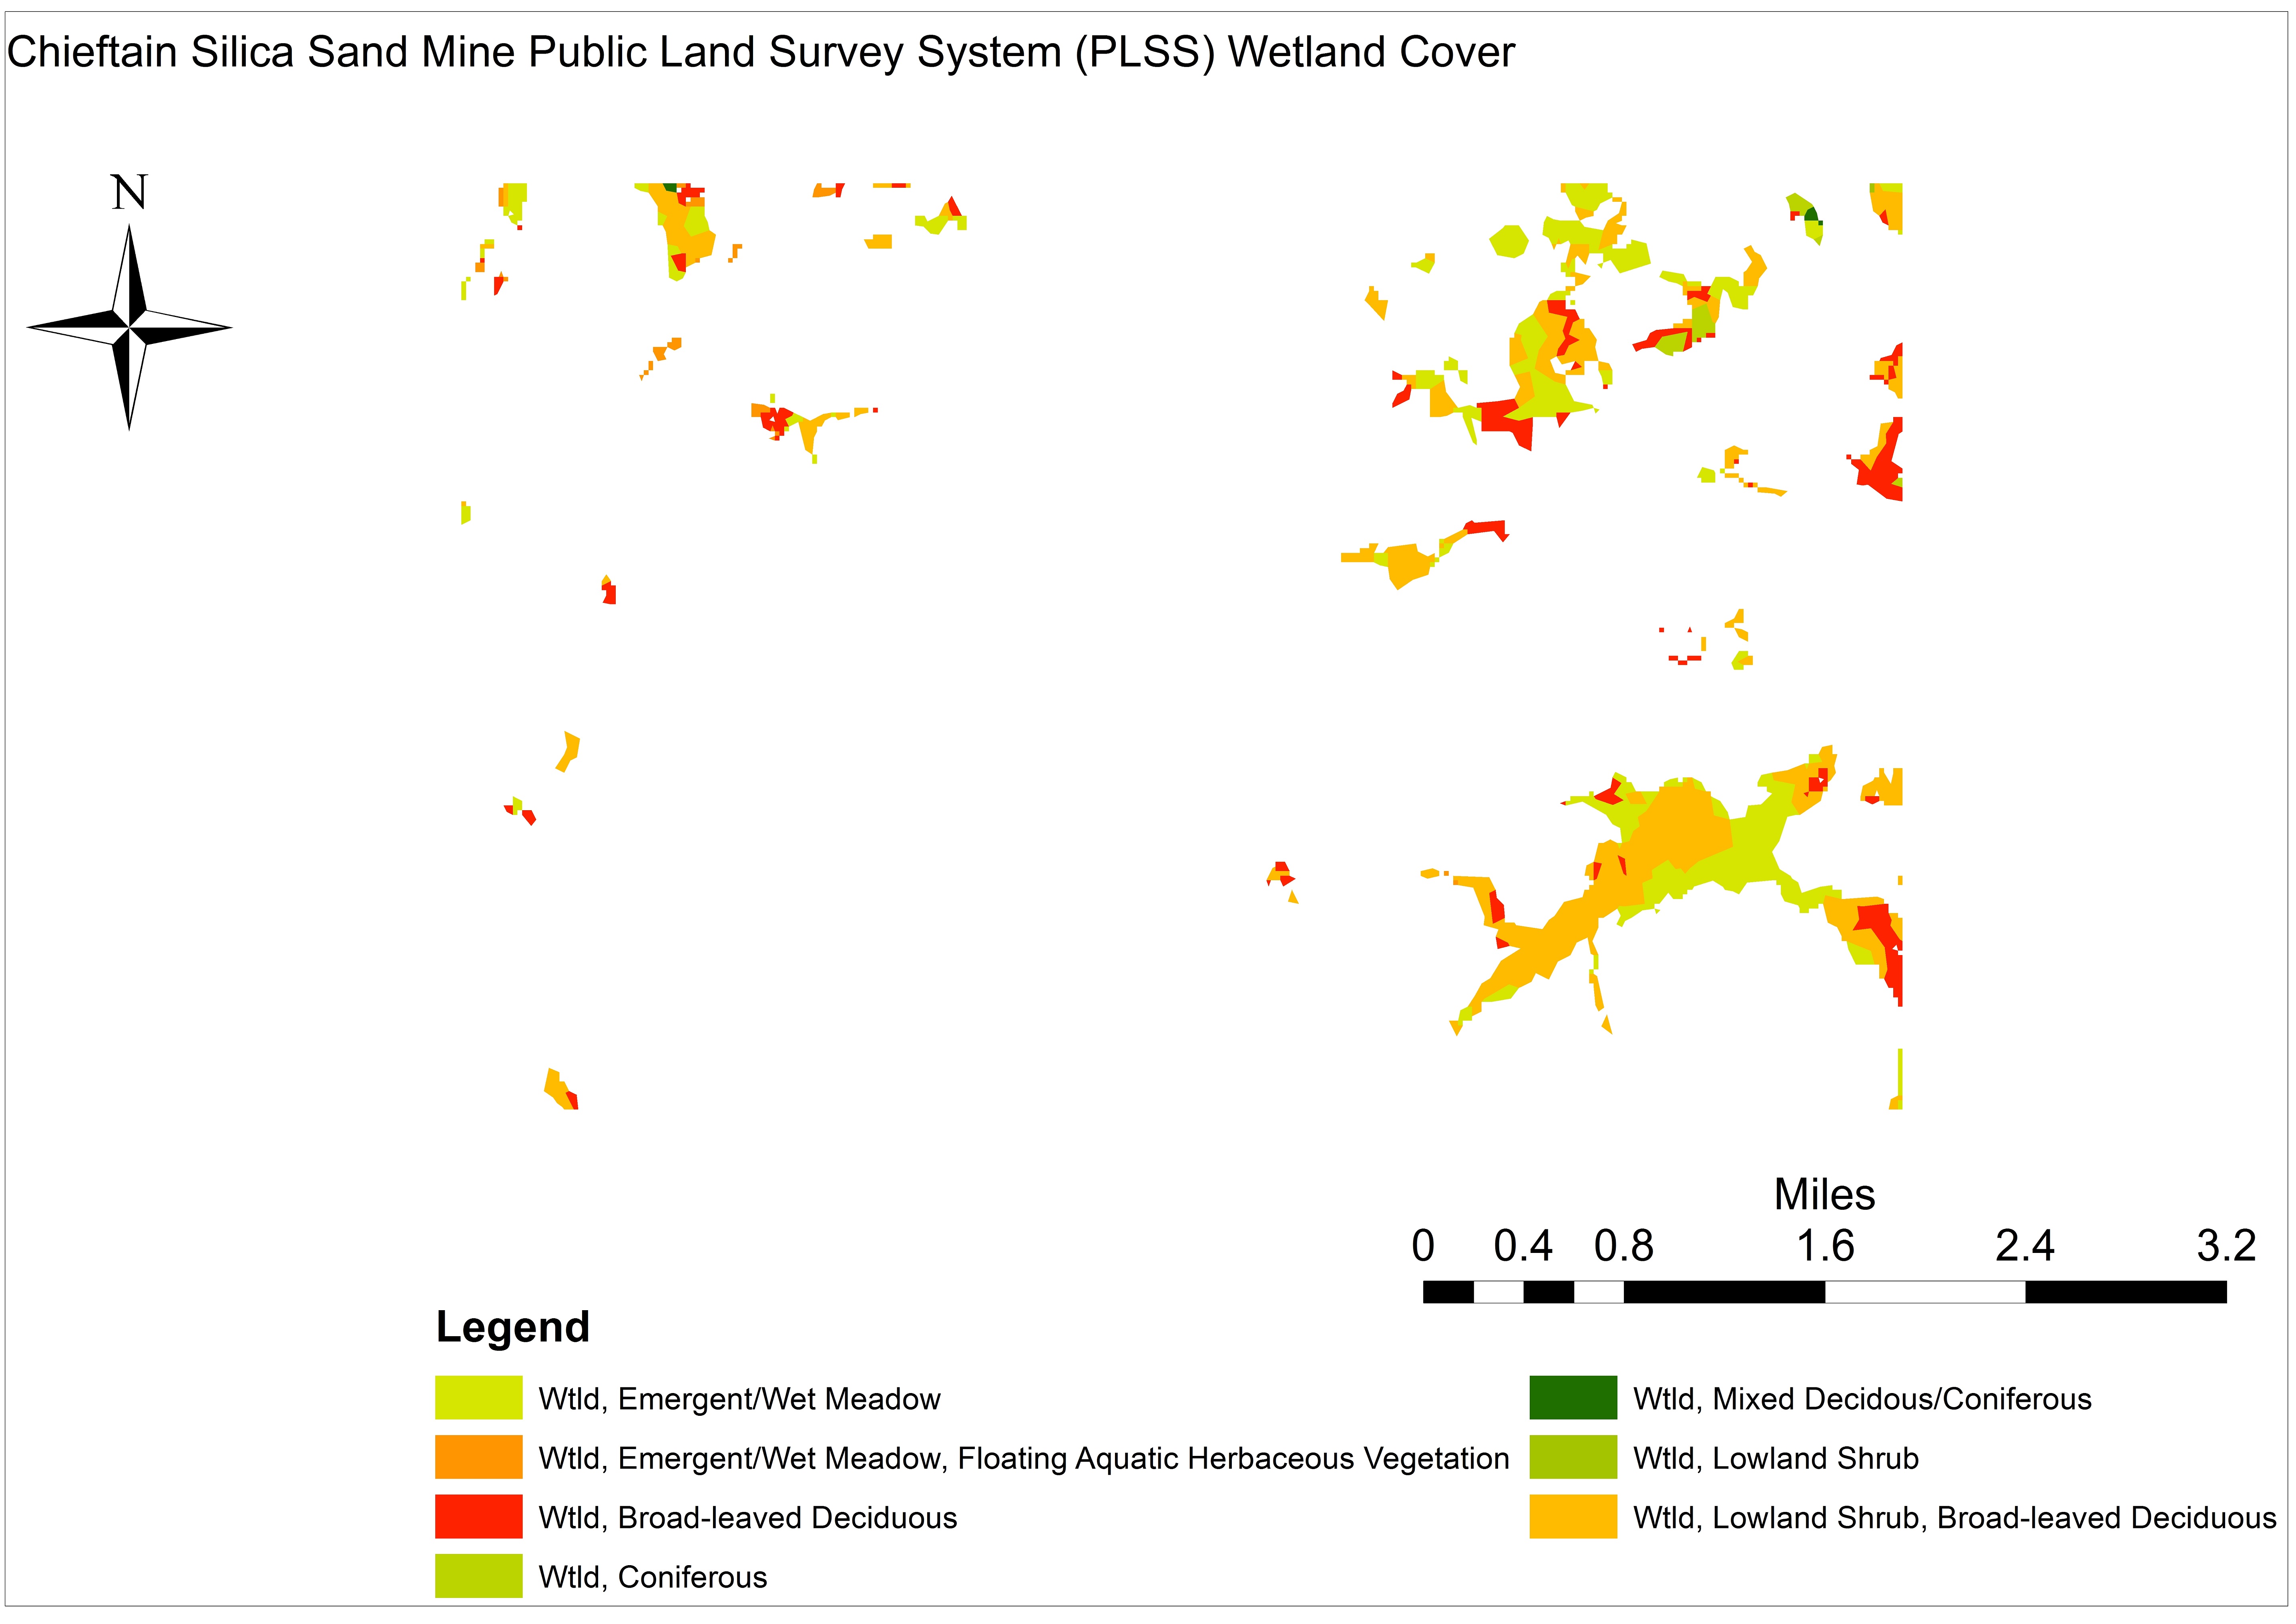
Figure 6. Chieftain silica sand mine proposal’s wetland cover across 5,671 acres in Barron County, WI.
Seven types of forested and shrub-dominated wetlands occupy 101 acres (1.8%) of Chieftain’s PLSS parcels, with an average size of four acres spread across 49 discrete polygons. Wetlands are clustered in three sections of the proposed mining area, with the largest continuous polygons being adjacent 160 acre “Wetland, Lowland Shrub, Broad-leaved Deciduous” and 88 acre “Wetland, Emergent/Wet Meadow” polygons along the area of interest’s eastern edge (See Figure 6 right).
Land Value
In an effort to quantify the value of this aggregation of parcels we calculated annual plant and soil productivity, as well as crop productivity, in terms of tons of carbon and nitrogen3 lost using established WI forest, crop, and freshwater productivity values.4-6
It is worth noting that the following estimates are conservative given that we were not able to determine average above/belowground ecosystem productivity values for the wetland and barren. Additionally, our estimates for crops and grasslands did not include belowground productivity estimates, which likely would increase the following estimates by 20-30%.
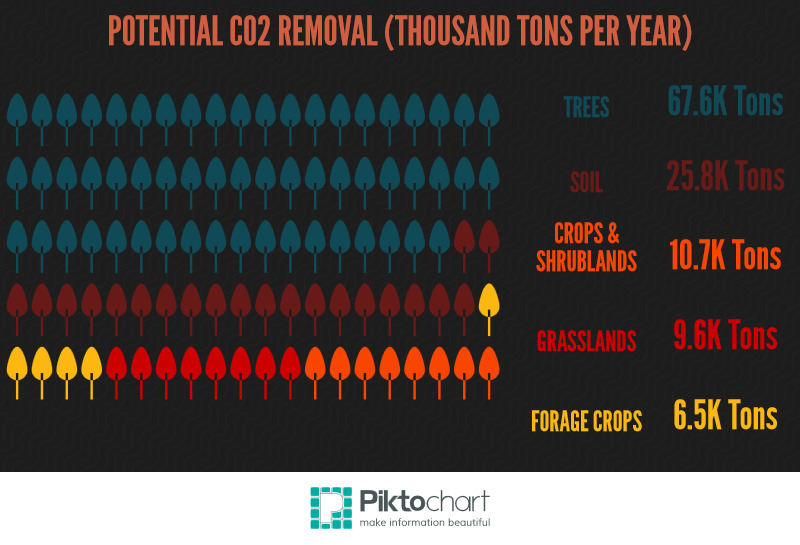
1. Forests
The aforementioned-forested polygons accrue 44,274-90,969 tons of aboveground CO2. This means that if we assume the average forest in this area is 65-85 years old, the Chieftain mine proposal would potentially remove 3.3-6.8 million tons of built up CO2 equivalents. This figure is equal to the per capita CO2 emissions of 202,800-416,700 WI residents. The renewable wood generated on this site has a current market value of $418,516 to $654,125.
If we assume that the price of CO2 is somewhere between $12 and $235 per ton the forested polygons within Chieftain’s proposal currently capture (remove from the atmosphere) $4-17 million worth of CO2 annually.
Additionally, this area generates 23,262-45,447 tons of CO2 via soil processes such as litter decomposition and root production (i.e., 1.8-3.4 million tons over the average 65-85 year lifespan of these forests). The annual value of these belowground processes in terms of soil fertility (i.e., soil organic matter, nitrogen, and phosphorus) is somewhere between $569,962 and $1,029,662 or $43-77 million over the 65-85 year period used in this analysis.
2. Forage Crops and Grasslands
The 1,018 acres of forage crops are currently generating 6,526 CO2 tons per year, which is equivalent to the per capita emissions of 400 WI residents (Note: This carbon has a current value in the range of $417,700-$848,200). The 992 acres of grasslands are capturing 6,600-12,600 tons of CO2 per year and if we assume the average grassland parcel in WI is 5-15 years of age these polygons have captured CO2 equivalent to the per capita emissions of 4,000-7,700 Wisconsinites. Together these two land-cover types capture $840,300-2,518,000 worth of CO2 annually. Again it is worth noting these values do not include any accounting soil processes, which are generally 20-30% of aboveground productivity.
3. Corn, Other Row Crops, Shrublands
The 860 acres of corn, miscellaneous row crops, and shrublands are currently generating 10,450-10,980 CO2 tons per year, which is equivalent to the per capita emissions of 640-670 WI residents. Using the same assumptions about time in grassland (i.e., average Conservation Reserve Program (CRP) tenure) and the 65-85 year assumption used for forests for shrublands we estimate these three land-cover types annually capture CO2 equivalent to the per capita emissions of 8,600-11,030 Wisconsinites. Together these three land-cover types capture $682,420-1,498,030 worth of CO2 annually.
The total average value of commodities produced on the 1,843 acres of cropland is $462 per acre or $851,272 annually.
4. Open Waters
This small fraction of the Chieftain proposal captures 134 tons worth of CO2 annually with a value of $8,590-17,650.
Total Quantifiable Monetary Value
In summary, the nine Chieftain frac sand mines if approved would use land that currently generates $8.77-16.63 million in ecosystem services and commodities per year. Historical and future land-use potential valuations are generally not accounted for in mineral lease agreements. This analysis demonstrates that such values are nontrivial and should at the very least be incorporated into lease agreements, given that post-mining reclamation strategies result in lands that are 40% less productive. If these lands are converted to sand mines, their annual values would drop to $5.0-9.5 million post-development.
Questions about the impact of such operations on LULC in the Mississippi Valley are becoming more and more frequent. For example, families such as the Schultz in Trempealeau County are signing permanent conservation easements. Doing so allows them to continue farming and allocates some acreage to the restoration of oak savanna and dry prairie, considered by the WI Department of Natural Resources (DNR) as “globally imperiled” and “globally rare,” respectively.
References & Footnotes
- It is worth noting that Chieftain is taking a huge gamble with this proposal. It stands to reason that such risky ventures are necessary given that the company’s share price has plummeted to $00.15 per share since its IPO days of around $5.50-6.00. These gambles could either catapult Chieftain into the frac sand mining big leagues or relegate it to the bench, however.
- Chieftain Silica Sand Mine Proposal, Barron County, WI Review, page 4
- We used carbon and nitrogen as their importance from a greenhouse gas (i.e., CO2, CH4, N2O), biogeochemical, and soil fertility perspective is well established.
- Burrows, S.N., Gower, S.T., Norman, J.M., Diak, G., Mackay, D.S., Ahl, D.E., Clayton, M.K., 2003. Spatial variability of aboveground net primary production for a forested landscape in northern Wisconsin. Canadian Journal of Forest Research 33, 2007-2018.
- Klopatek, J.M., Stearns, F.W., 1978. Primary Productivity of Emergent Macrophytes in a Wisconsin Freshwater Marsh Ecosystem. American Midland Naturalist 100, 320-332.
- Scheiner, S.M., Jones, S., 2002. Diversity, productivity and scale in Wisconsin vegetation. Evolutionary Ecology Research 4, 1097-1117.
Thanks to Jim Lacy at the Wisconsin Sate Cartographer’s Office, University of Wisconsin-Madison.
Regulatory Gaps for Train Spills?
By Matt Kelso, Manager of Data & Technology
On January 26, 2015, the Columbian, a paper in Southwestern Washington state, reported that an oil tanker spilled over 1,600 gallons of Bakken Crude in early November 2014. The train spill was never cleaned up, because frankly, nobody knows where the spill occurred. This issue highlights weaknesses in the incident reporting protocol for trains, which appears to be less stringent than other modes of transporting crude.
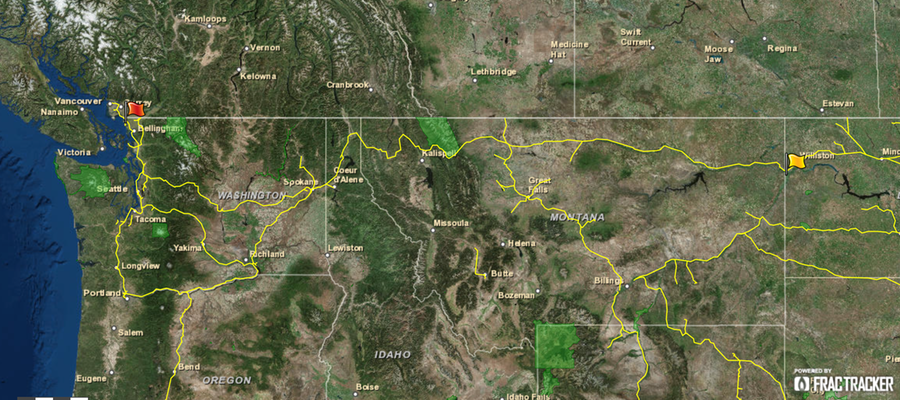
Possible Train Spill Routes
To follow the most likely train route for this incident, start at the yellow flag, then follow the line west. The route forks at Spokane – the northernmost route would be the most efficient. View full screen map
While there is not a good place for an oil spill of this size, some places are worse than others – and some of the locations along this train route are pretty bad. For example, the train passes through the southern edge of Glacier National Park in Montana, the scenic Columbia River, and the Spokane and Seattle metropolitan areas.
Significant Reporting Delay
The Columbian article mentions that railroads are required to report spills of hazardous materials in Washington State within 30 minutes of spills being noticed. In this case, however, the spill was apparently not noticed until the tanker car in question was no longer in BNSF custody. Therefore, relevant state and federal regulatory agencies were never made aware of the incident.
Both state and federal officials are now investigating, and we will follow up this post with more details when they are made available.
A Bird’s Eye View of Pipeline Oppositions
By Samantha Malone, FracTracker Alliance
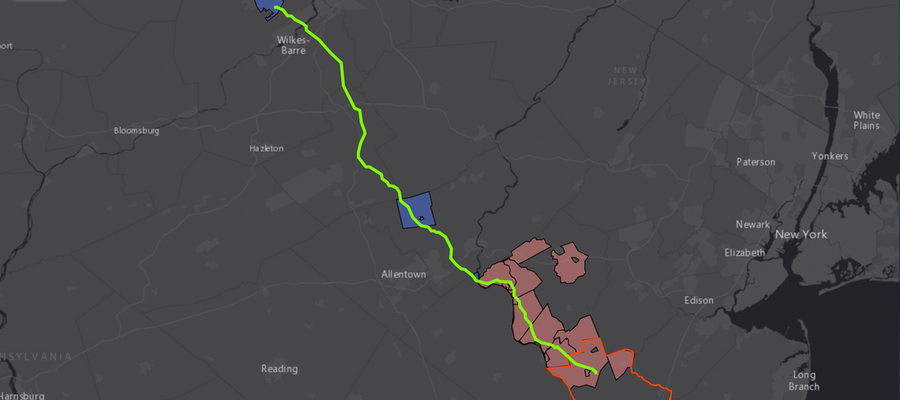
New York State is not the only area where opposition to fracking and its related activities is emerging. A 108-mile proposed PennEast pipeline between Wilkes-Barre, PA and Mercer County, New Jersey is facing municipal movements against its construction, as well. The 36-inch diameter pipeline will likely carry 1 billion cubic feet of natural gas per day. According to some sources, this proposed pipeline is the only one in NJ that is not in compliance with the state’s standard of co-locating new pipelines with an existing right-of-way.1
PennEast Pipeline Oppositions
Below is a dynamic, clickable map of said opposition by FracTracker’s Karen Edelstein, as well as documentation associated with each municipality’s current stance:
Click here to view map and legend fullscreen.
Additional Projects and Pushback
In Ohio, many communities are working on similar projects to prevent over 40,000 miles of proposed pipelines according to recent news reports.
And in Massachusetts and New Hampshire, municipalities are working to ban, reroute, or regulate heavily the Northeast Energy Direct Pipeline (opposition map shown below):
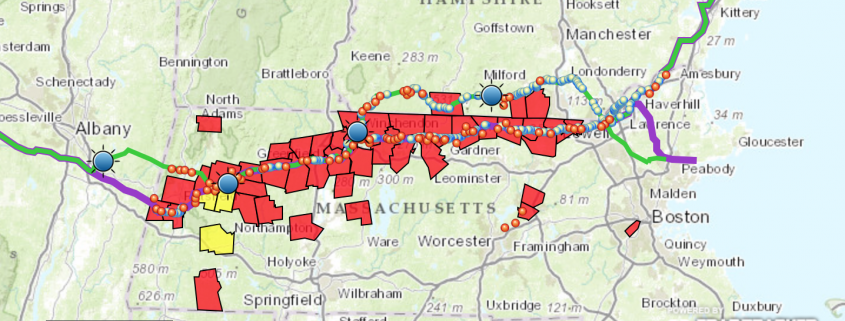
Northeast Energy Direct Proposed Pipeline Paths and Opposition Resolutions in MA & NH
Why is this conversation important?
Participation in government is a beneficial practice for citizens and helps to inform our regulatory agencies on what people want and need. This surge in opposition against oil and gas activity such as pipelines or well pads near schools highlights a broader question, however:
If not pipelines, what is the least risky form of oil and gas transportation?
Oil and gas-related products are typically transported in one of four ways: Truck, Train, Barge, or Pipeline.
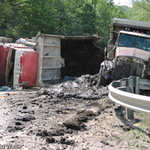 Drilling mud spill from truck accident |
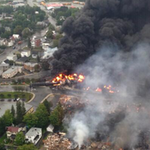 Lac-Mégantic oil train derailment |
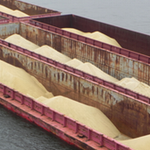 Using a barge to transport frac sand |
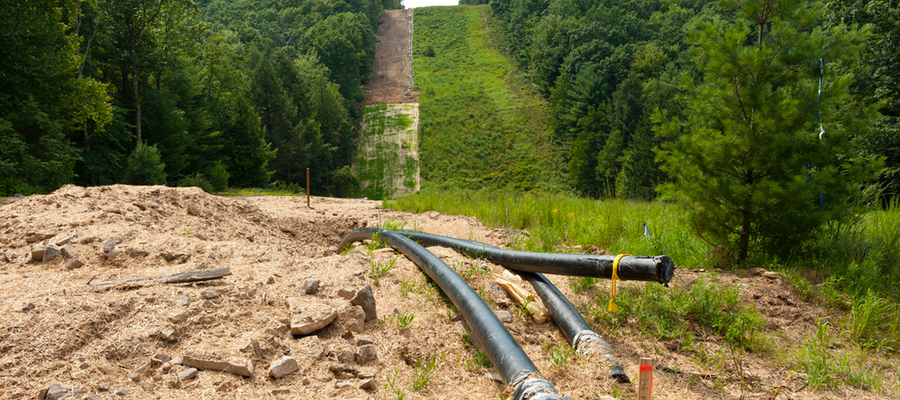
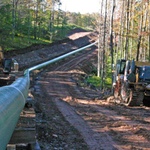 Gas pipeline construction in PA forest |
Trucks are arguably the most risky and environmentally costly form of transport, with spills and wrecks documented in many communities. Because most of these well pads are being built in remote areas, truck transport is not likely to disappear anytime soon, however.
Transport by rail is another popular method, albeit strewn with incidents. Several, major oil train explosions and derailments, such as the Lac-Mégantic disaster in 2013, have brought this issue to the public’s attention recently.
Moving oil and gas products by barge is a different mode that has been received with some public concern. While the chance of an incident occurring could be lower than by rail or truck, using barges to move oil and gas products still has its own risks; if a barge fails, millions of people’s drinking water could potentially be put at risk, as highlighted by the 2014 Elk River chemical spill in WV.
So we are left with pipelines – the often-preferred transport mechanism by industry. Pipelines, too, bring with them explosion and leak potential, but at a smaller level according to some sources.2 Property rights, forest loss and fragmentation, sediment discharge into waterways, and the potential introduction of invasive species are but a few examples of the other concerns related to pipeline construction. Alas, none of the modes of transport are without risks or controversy.
Footnotes
- Colocation refers to the practice of constructing two projects – such as pipelines – in close proximity to each other. Colocation typically reduces the amount of land and resources that are needed.
- While some cite pipelines as relatively safe, incidents do occur quite often: ~1.6 incidents per day.
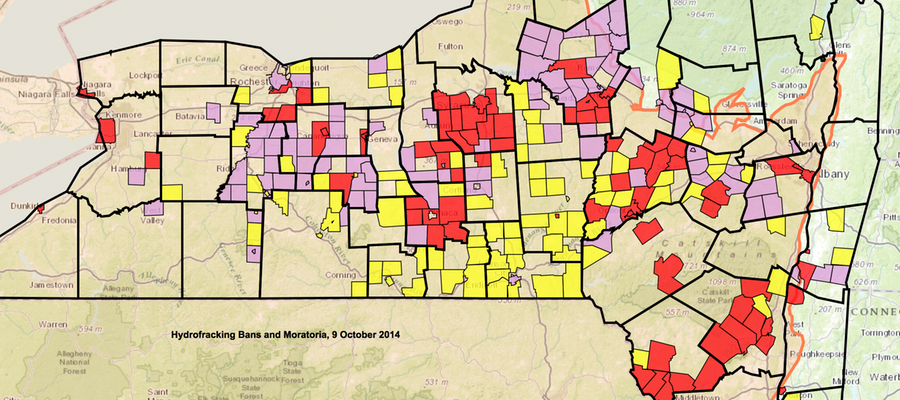
New York State Will Not Permit Fracking
On December 17, 2014 Governor Cuomo, as well as DEC and DOH Commissioners, said no to fracking in the state of New York.
By Karen Edelstein, NY Program Coordinator, FracTracker Alliance
On Wednesday, December 17, 2014, at an end-of-the-year televised Cabinet Meeting in Albany, New York State Governor Andrew Cuomo, Health Commissioner Howard A. Zucker, and Department of Environmental Conservation Commissioner Joe Martens informed New Yorkers about their decision not to allow high volume hydraulic fracturing in New York State “at this time.
Governor Cuomo instructed Commissioner Martens to complete the Supplemental Generic Environmental Impact Statement (SGEIS) in early 2015, and after additional public comment, the law should go into effect. The New York State Health Commissioner’s report “A Public Health Review of High Volume Hydraulic Fracturing for Shale Gas Development” can be found here.
Watch the history-making statements from Cuomo, Martens, and Zucker in the video below. Cuomo’s comments start 15 seconds into the clip. At about 57:00, hear how FracTracker’s map of bans and moratoria in NY State played a part in cementing Marten’s decision.
Resistance Mounts to Northeast Energy Direct Pipeline Across MA and NH
By Karen Edelstein, NY Program Coordinator
As the pressure to move domestic natural gas to market from sources in Pennsylvania and beyond, residents in Massachusetts have been learning about a planned project that would cross the northern portion of the state.
Gas infrastructure build-out on the radar
The proposed Kinder Morgan/Tennessee Gas Pipeline Expansion, known as the “Berkshire Pipeline,” or more recently as “Northeast Energy Direct,” would link existing pipeline infrastructure near the New York-Massachusetts border and Dracut, MA, north of Boston. TX-based Tennessee Gas Pipeline Co. says that the 250-mile-long, 36-inch diameter pipeline construction would temporarily create about 3000 jobs, and deliver upwards of 2.2 billion cubic feet per day of natural gas to the northeastern United States. Along the course of the proposed pipeline, 50 miles of the run would use existing Tennessee Gas Pipeline rights-of-way. Nevertheless, 129 miles of the new pipeline would be located in “greenfield” areas: locations that had previously not seen disruption by pipeline infrastructure. If approved, construction would begin in April 2017, with a targeted completion date of November 2018.
In addition to the main pipeline, the project would also include meter stations, at least two new compressor stations in Massachusetts and one in New Hampshire, and modifications to existing pipeline infrastructure. Part of a growing web of pipelines that are moving Marcellus Shale and other gas across the continent, this project would have further connections to the Spectra Energy’s Maritimes and Northeast Pipeline that goes through Maine to the Canadian Maritime provinces, to terminals on the Atlantic coast. In addition, six lateral lines off the main pipeline include:
- Nashua Lateral (Pepperell, MA into Hollis, NH)
- Worcester Lateral
- Pittsfield Lateral
- Haverhill Lateral
- Fitchburg Lateral Extension
- Lynnfield Lateral
Municipalities React, Resistance Mounts
The plan was announced in late January 2014. Despite the endorsements of governors in six states in the Northeast to increase the region’s supply of natural gas, more than three dozen Massachusetts towns in the path of the pipeline have passed resolutions opposing the project (map below). After the December 8, 2014 release of a substantially revised route that would run 71 miles of the pipeline through New Hampshire rather than northern Massachusetts, Granite State municipalities have also raised their voices in opposition. Residents have cited concerns about the accidental releases of gas or chemicals used in during hydraulic fracturing in general, as well as the direct impacts that the pipeline would have on sensitive wetlands, conservation lands, state parks, private properties, and other critical habitats in Massachusetts, including crossing under or over the Connecticut River. We’ve also included point locations of federally designated National Wetlands Inventory sites on or adjacent to the current and newly-described pipeline routes, as well as other environmental assets such as waterways, lakes, state parks and forest lands.
Proposed Pipeline Paths and Opposition Resolutions
For a full-screen view of this map, with a legend, click here.
Currently, approximately 37% of residents contacted by Tennessee Gas for the pipeline rights-of-way have agreed to surveys of their lands. Massachusetts towns likely to be in the path of the pipeline include Richmond, Lenox, Pittsfield, and Dalton. In addition, Hancock, Hinsdale, Peru, Savoy, Stockbridge, Washington, West Stockbridge and Windsor counties are expected to be in the path.
According to the US Energy Information Administration (EIA), 50% of New England’s electric power supply comes from natural gas, with a mere 9.3% sourced from renewable resources. Opponents of the project, such as the citizen group No Fracked Gas in Mass, are pushing for more resources and policy-planning to focus on alternative, renewable energy, rather than enhancing fossil fuel dependencies.
Additional concern has come from the Massachusetts Land Trust Coalition (MLTC). MLTC sent a letter to Governor Deval Patrick expressing their alarm that while Tennessee Gas has asserted that they will be using existing gas pipeline rights-of-way, landowners across the northern tier of Massachusetts have received letters from the gas company asking for permission to use their land. Were the pipeline to go this route, MLTC says, it would also run directly through public- and privately-owned stretches of conservation land.
In early August 2014, Massachusetts Governor Deval Patrick indicated to opponents of the pipeline his growing skepticism about the plan. A few days later, the New England States Committee on Electricity filed for an extension of a schedule looking at a proposal that would levy new tariffs on electric customers in order to finance projects such as this pipeline.
Additional Resources
- Burden of Proof: The case against the proposed Northeast Energy Direct (NED) fracked gas pipeline
- Berkshire County Fights Pipeline Proposal
- Proposed Pipeline to Cross Northern MA
- List of MA Resolutions
- Information on the proposed pipeline’s impact in New Hampshire
- Second Version of Resource Report (reroute through New Hampshire), December 8, 2014
NOTE: This article was updated on December 27, 2014, to include information about the revised pipeline route that we were not aware of when this article was originally released earlier in the month.
Where have all the guardrails gone?
Guardrails vs. Trucks
Wetzel County in northwestern West Virginia is remarkable for its steep, knobby hills and long narrow winding valleys – providing residents and visitor alike with beautiful views. Along with these scenic views, however, comes difficult roadways and dangerous traveling.
Two two-lane roads traverse the county from the west, along the Ohio River, to the east. There are very few connecting roads going north-south between these two main highways, and only one of them is semi-paved. This road is called Barker Run Road — treacherous, steep and winding. There is at least a 400-foot change in elevation in about ½ mile at one point, with multiple switchbacks.
Switchbacks have a reputation for swallowing up the long trailer component of the tractor-trailer combos, which now comprise a larger part of the traffic on Barker Run Road. Many of these trucks are heading to the HG Energy drilling sites on the ridges at the top. HG Energy has a significant footprint up there. On the east ridge there are four well pads in place and two additional pads being completed to the east, and two large ones on the ridge to the west of Barker Run Road. All that traffic must use Barker Run Road. Until the recent expansion of natural gas exploration in the area, however, I had never seen a tractor and trailer come up either side of the very steep road.
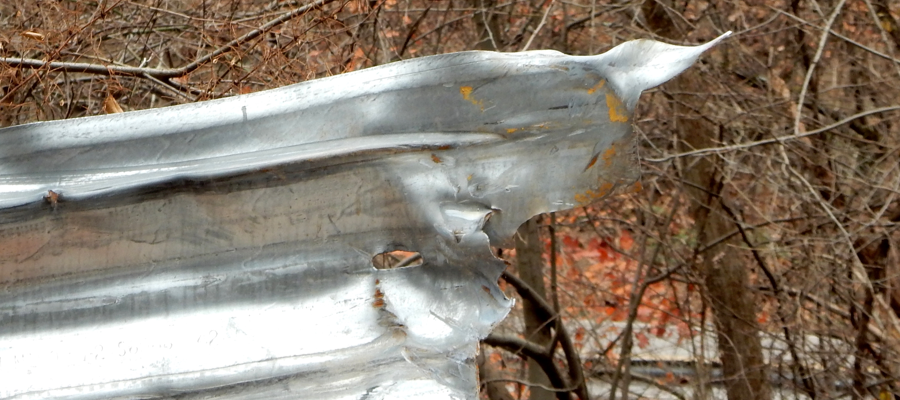
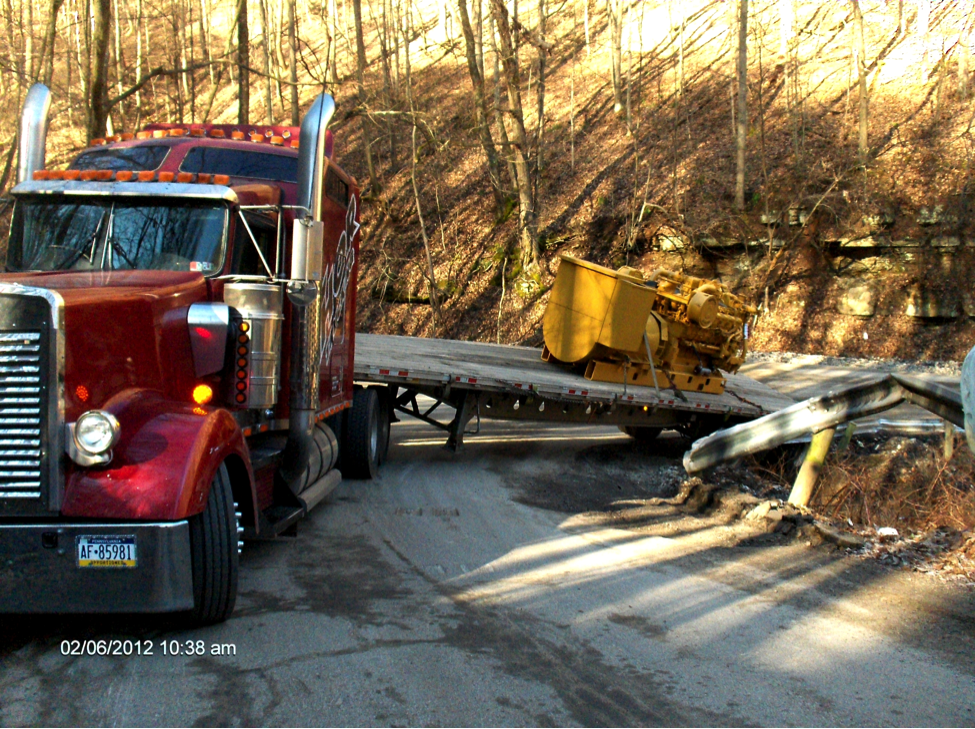
The first casualty caused by the large, long trailer trucks needed to service these well pads is always the full-time sentinels of our traffic safety – our faithful guard rails that are designed to take a beating before we and our vehicle descend over the hillside sideways or rolling over. A good example of a damaged but still useful guardrail is shown below from February on 2012 – wrinkled but useful. The very sharp turn in the roadway is also obvious here.
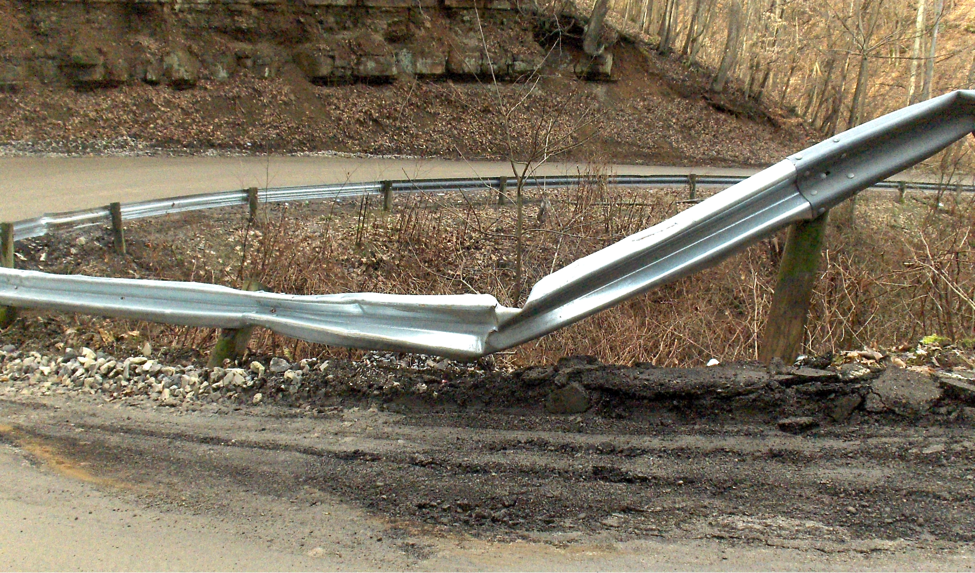
Figure 1. Switchback curve on Barker Run Road has seen its share of damage from the increase in truck traffic.
After leaving Route 7 heading south on Barker Run Road, one encounters a particularly sharp and steep switchback curve as shown in Figure 1. It is this kind of turn that is so sharp that it allows the driver of an overlong truck to be able to look back and check the lug nuts on the rear wheels.
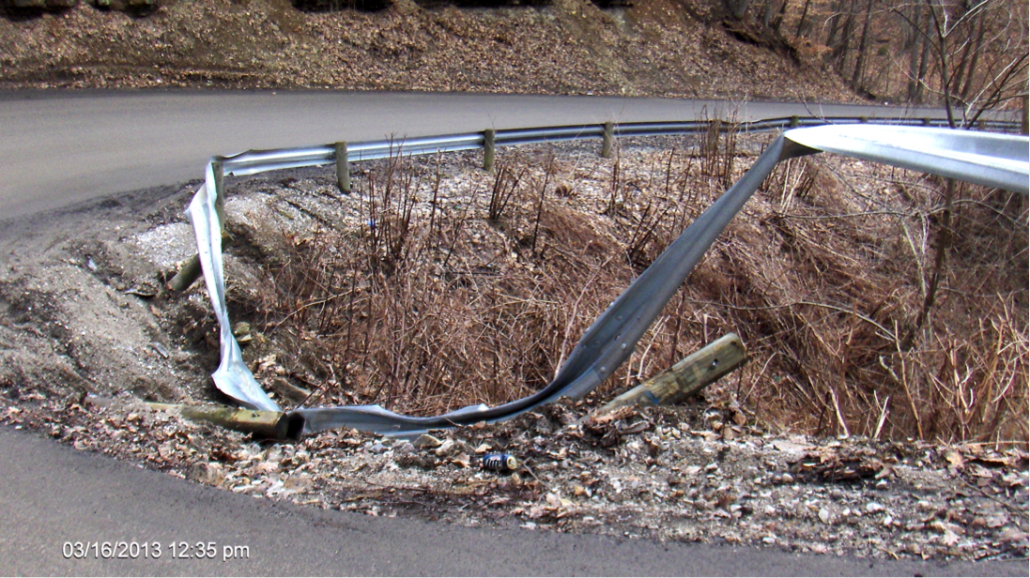
On a few occasions, I have been able to actually witness the attempt of our full-time guards as they try to keep a truck somewhat close to the roadway. The below photo shows that the guardrail was barely able to keep the trailer from going completely over the hillside. The truck was stuck, causing the road to be closed for hours till help could arrive (Figure 2, below).
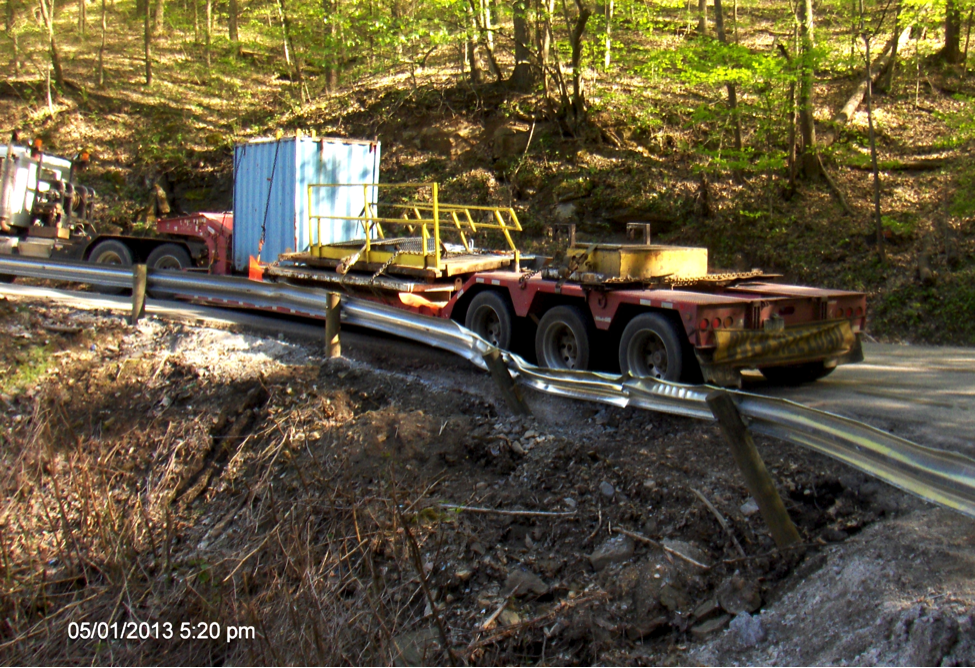
When that incident was over, the photo below from a few weeks later, on March 16, 2013, shows the final damaged rail (Figure 3). The guardrail and posts were replaced and were largely intact when the rail was pushed over again in May of 2013 by another oversized truck trying to get up the hill and around the turn (Figure 4). Ongoing impacts with the guardrail eventually rendered it useless. Figure 5 below is a photo taken in August of 2013.

Infrastructure Damage & Costs
When the Marcellus shale gas drilling began here in Wetzel County eight years ago, it quickly became apparent that the rapidly expanding Chesapeake Energy drilling footprint in north central Wetzel County was leaving scars in the neighborhood, particularly on the roadways. The most visible damages were the road signs, guardrails, and pavement. These effects resulted in a three-layer, road bonding program implemented by the West Virginia Department of Highways. The stipulation requires that any of the large natural gas drillers or operators must post a $1-million bond to cover them statewide, or a single highway district bond for $250,000. This bonding only applies to secondary roads. The third option is to post a bond for fixed, limited miles along specific roads. Some of the pipeline contractors who might be working in a smaller area will use the latter option. Since the DOH generally knows which companies are using the roads, the department usually knows who to approach to pay for damage. In a few cases the companies have reported the damage to the Highway department, and at other times the truckers’ insurance companies report an accident or insurance claim. .
During a recent conversation with a WV-DOH representative, I was told that he quite frequently gets good cooperation from the gas industry companies in paying for damages. He said this is true even when a number of different companies and dozens of their subcontractors are using the same road.
Usually the guardrails just need to be fixed or replaced and new posts installed. Sometimes it is not critical that it be done immediately. However, at times the repairs should be done now. A good example of when repairs are needed soon is shown below in Figure 7, right. This remnant is the shredded, mangled, twisted remains of the stubborn effort of the steel to stop a truck.
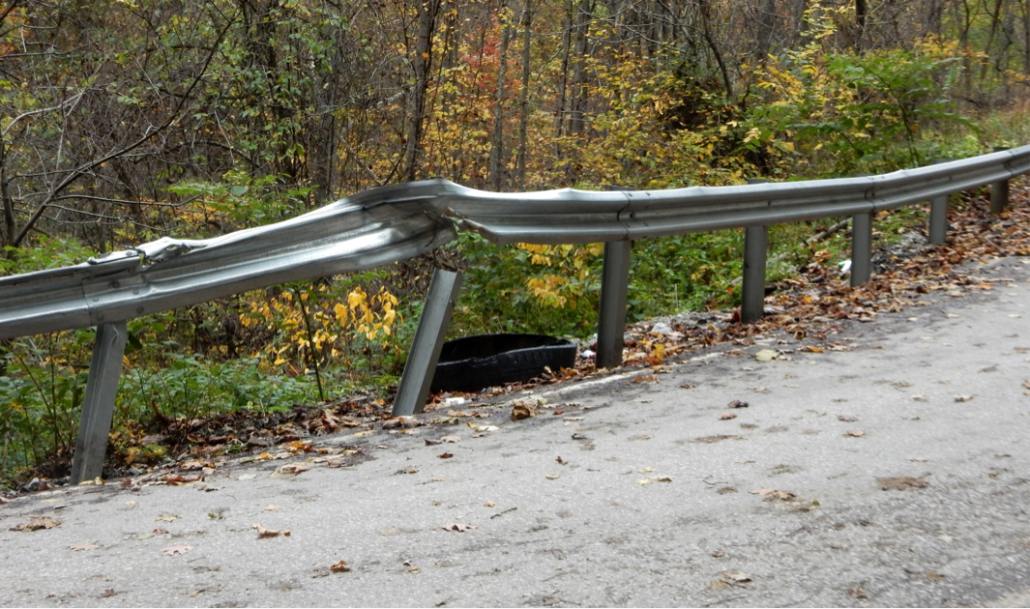
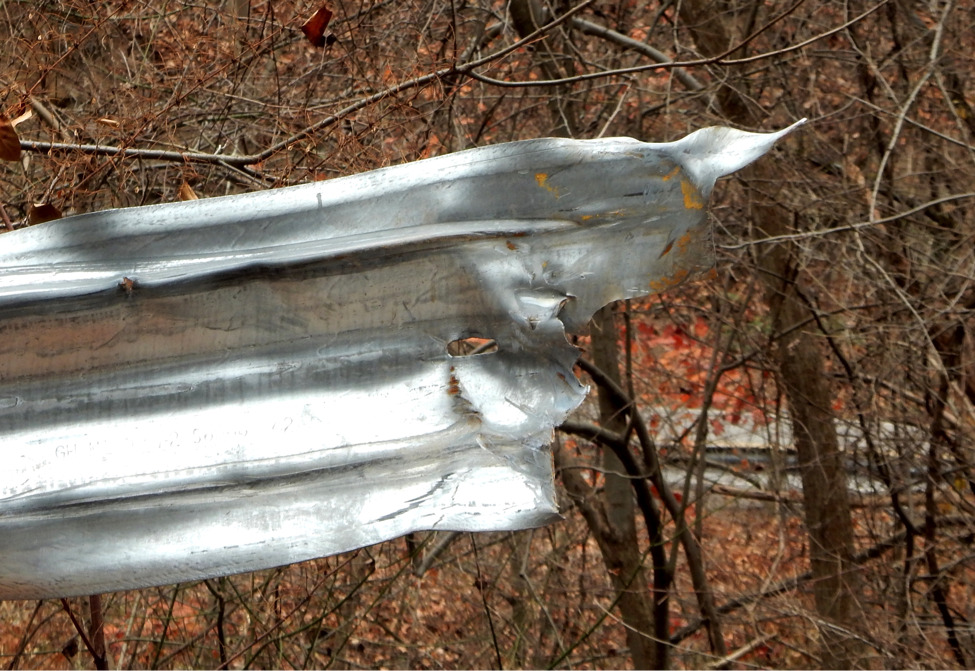
The rail has now been totally sliced open, making it an extraordinary danger to the traveling public. As we enter the winter season with a bit of snow and ice on this steep road above this section, any of my neighbors could slide into this. I am optimistic that it will be replaced soon and have had several conversations with the WV-DOH to speed up the process.
By Bill Hughes, WV Community Liaison, FracTracker Alliance
Read more Field Diary articles.
![]()
216 Franklin St, Suite 400, Johnstown, PA 15901
Phone: +1 (717) 303-0403 | info@fractracker.org
FracTracker Alliance is a 501(c)3 non-profit: Tax identification number: 80-0844297