The majority of FracTracker’s posts are generally considered articles. These may include analysis around data, embedded maps, summaries of partner collaborations, highlights of a publication or project, guest posts, etc.
New York State Will Not Permit Fracking
On December 17, 2014 Governor Cuomo, as well as DEC and DOH Commissioners, said no to fracking in the state of New York.
By Karen Edelstein, NY Program Coordinator, FracTracker Alliance
On Wednesday, December 17, 2014, at an end-of-the-year televised Cabinet Meeting in Albany, New York State Governor Andrew Cuomo, Health Commissioner Howard A. Zucker, and Department of Environmental Conservation Commissioner Joe Martens informed New Yorkers about their decision not to allow high volume hydraulic fracturing in New York State “at this time.
Governor Cuomo instructed Commissioner Martens to complete the Supplemental Generic Environmental Impact Statement (SGEIS) in early 2015, and after additional public comment, the law should go into effect. The New York State Health Commissioner’s report “A Public Health Review of High Volume Hydraulic Fracturing for Shale Gas Development” can be found here.
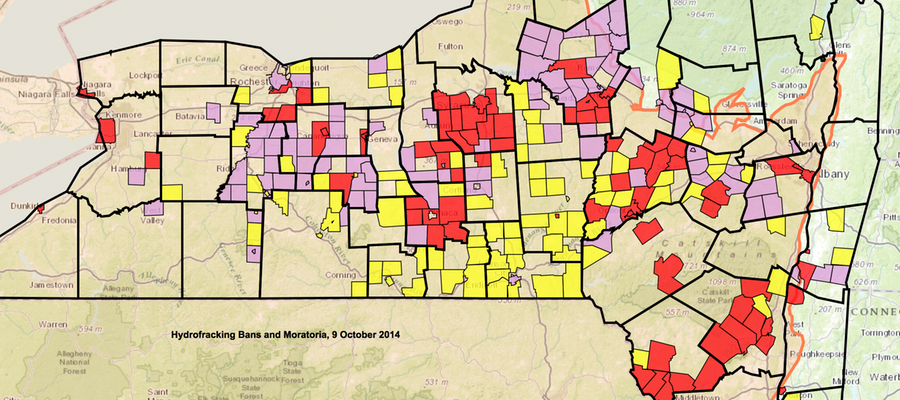
Watch the history-making statements from Cuomo, Martens, and Zucker in the video below. Cuomo’s comments start 15 seconds into the clip. At about 57:00, hear how FracTracker’s map of bans and moratoria in NY State played a part in cementing Marten’s decision.
Resistance Mounts to Northeast Energy Direct Pipeline Across MA and NH
By Karen Edelstein, NY Program Coordinator
As the pressure to move domestic natural gas to market from sources in Pennsylvania and beyond, residents in Massachusetts have been learning about a planned project that would cross the northern portion of the state.
Gas infrastructure build-out on the radar
The proposed Kinder Morgan/Tennessee Gas Pipeline Expansion, known as the “Berkshire Pipeline,” or more recently as “Northeast Energy Direct,” would link existing pipeline infrastructure near the New York-Massachusetts border and Dracut, MA, north of Boston. TX-based Tennessee Gas Pipeline Co. says that the 250-mile-long, 36-inch diameter pipeline construction would temporarily create about 3000 jobs, and deliver upwards of 2.2 billion cubic feet per day of natural gas to the northeastern United States. Along the course of the proposed pipeline, 50 miles of the run would use existing Tennessee Gas Pipeline rights-of-way. Nevertheless, 129 miles of the new pipeline would be located in “greenfield” areas: locations that had previously not seen disruption by pipeline infrastructure. If approved, construction would begin in April 2017, with a targeted completion date of November 2018.
In addition to the main pipeline, the project would also include meter stations, at least two new compressor stations in Massachusetts and one in New Hampshire, and modifications to existing pipeline infrastructure. Part of a growing web of pipelines that are moving Marcellus Shale and other gas across the continent, this project would have further connections to the Spectra Energy’s Maritimes and Northeast Pipeline that goes through Maine to the Canadian Maritime provinces, to terminals on the Atlantic coast. In addition, six lateral lines off the main pipeline include:
- Nashua Lateral (Pepperell, MA into Hollis, NH)
- Worcester Lateral
- Pittsfield Lateral
- Haverhill Lateral
- Fitchburg Lateral Extension
- Lynnfield Lateral
Municipalities React, Resistance Mounts
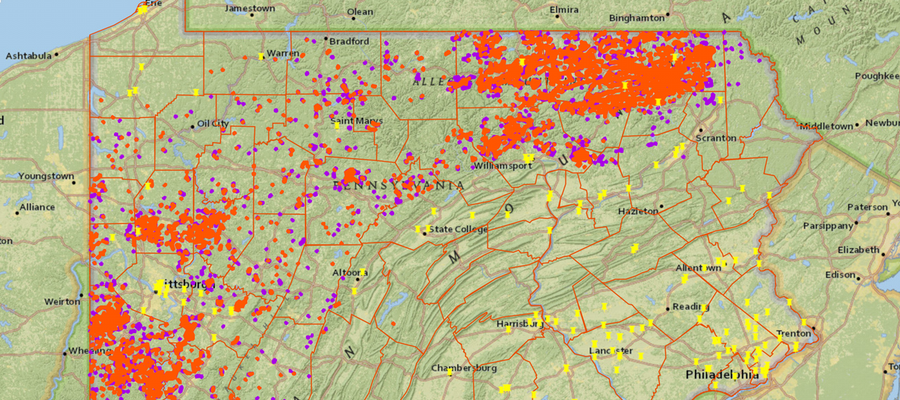
The plan was announced in late January 2014. Despite the endorsements of governors in six states in the Northeast to increase the region’s supply of natural gas, more than three dozen Massachusetts towns in the path of the pipeline have passed resolutions opposing the project (map below). After the December 8, 2014 release of a substantially revised route that would run 71 miles of the pipeline through New Hampshire rather than northern Massachusetts, Granite State municipalities have also raised their voices in opposition. Residents have cited concerns about the accidental releases of gas or chemicals used in during hydraulic fracturing in general, as well as the direct impacts that the pipeline would have on sensitive wetlands, conservation lands, state parks, private properties, and other critical habitats in Massachusetts, including crossing under or over the Connecticut River. We’ve also included point locations of federally designated National Wetlands Inventory sites on or adjacent to the current and newly-described pipeline routes, as well as other environmental assets such as waterways, lakes, state parks and forest lands.
Proposed Pipeline Paths and Opposition Resolutions
For a full-screen view of this map, with a legend, click here.
Currently, approximately 37% of residents contacted by Tennessee Gas for the pipeline rights-of-way have agreed to surveys of their lands. Massachusetts towns likely to be in the path of the pipeline include Richmond, Lenox, Pittsfield, and Dalton. In addition, Hancock, Hinsdale, Peru, Savoy, Stockbridge, Washington, West Stockbridge and Windsor counties are expected to be in the path.
According to the US Energy Information Administration (EIA), 50% of New England’s electric power supply comes from natural gas, with a mere 9.3% sourced from renewable resources. Opponents of the project, such as the citizen group No Fracked Gas in Mass, are pushing for more resources and policy-planning to focus on alternative, renewable energy, rather than enhancing fossil fuel dependencies.
Additional concern has come from the Massachusetts Land Trust Coalition (MLTC). MLTC sent a letter to Governor Deval Patrick expressing their alarm that while Tennessee Gas has asserted that they will be using existing gas pipeline rights-of-way, landowners across the northern tier of Massachusetts have received letters from the gas company asking for permission to use their land. Were the pipeline to go this route, MLTC says, it would also run directly through public- and privately-owned stretches of conservation land.
In early August 2014, Massachusetts Governor Deval Patrick indicated to opponents of the pipeline his growing skepticism about the plan. A few days later, the New England States Committee on Electricity filed for an extension of a schedule looking at a proposal that would levy new tariffs on electric customers in order to finance projects such as this pipeline.
Additional Resources
- Burden of Proof: The case against the proposed Northeast Energy Direct (NED) fracked gas pipeline
- Berkshire County Fights Pipeline Proposal
- Proposed Pipeline to Cross Northern MA
- List of MA Resolutions
- Information on the proposed pipeline’s impact in New Hampshire
- Second Version of Resource Report (reroute through New Hampshire), December 8, 2014
NOTE: This article was updated on December 27, 2014, to include information about the revised pipeline route that we were not aware of when this article was originally released earlier in the month.
Where have all the guardrails gone?
Guardrails vs. Trucks
Wetzel County in northwestern West Virginia is remarkable for its steep, knobby hills and long narrow winding valleys – providing residents and visitor alike with beautiful views. Along with these scenic views, however, comes difficult roadways and dangerous traveling.
Two two-lane roads traverse the county from the west, along the Ohio River, to the east. There are very few connecting roads going north-south between these two main highways, and only one of them is semi-paved. This road is called Barker Run Road — treacherous, steep and winding. There is at least a 400-foot change in elevation in about ½ mile at one point, with multiple switchbacks.
Switchbacks have a reputation for swallowing up the long trailer component of the tractor-trailer combos, which now comprise a larger part of the traffic on Barker Run Road. Many of these trucks are heading to the HG Energy drilling sites on the ridges at the top. HG Energy has a significant footprint up there. On the east ridge there are four well pads in place and two additional pads being completed to the east, and two large ones on the ridge to the west of Barker Run Road. All that traffic must use Barker Run Road. Until the recent expansion of natural gas exploration in the area, however, I had never seen a tractor and trailer come up either side of the very steep road.
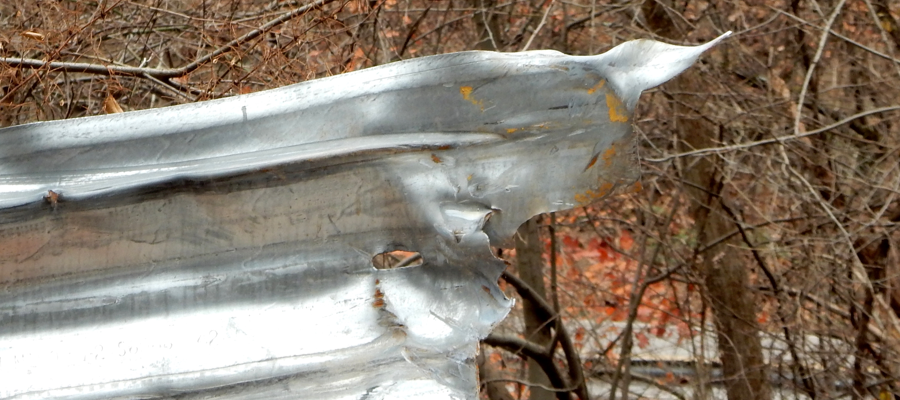
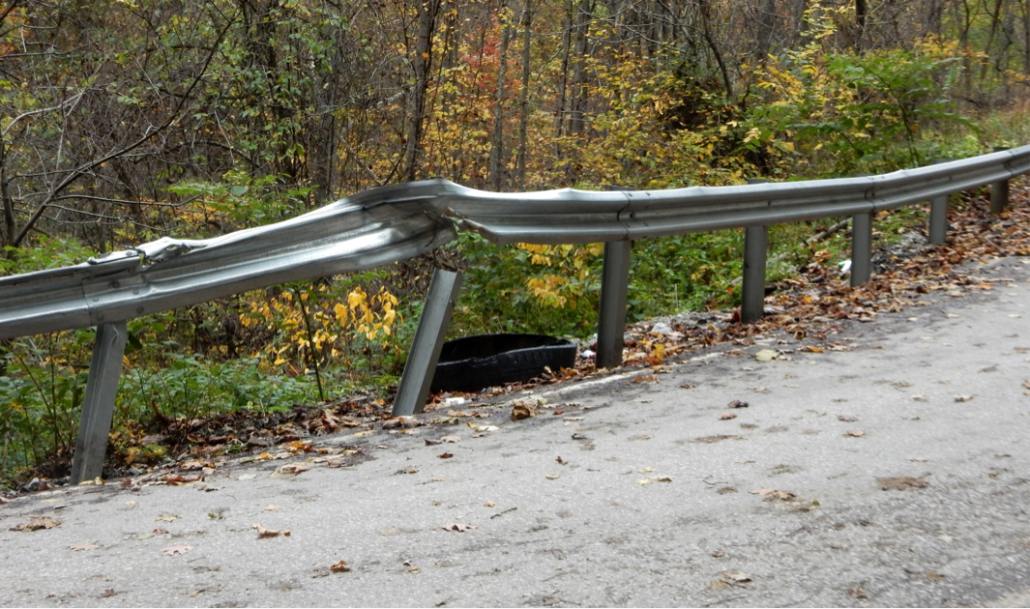
The first casualty caused by the large, long trailer trucks needed to service these well pads is always the full-time sentinels of our traffic safety – our faithful guard rails that are designed to take a beating before we and our vehicle descend over the hillside sideways or rolling over. A good example of a damaged but still useful guardrail is shown below from February on 2012 – wrinkled but useful. The very sharp turn in the roadway is also obvious here.
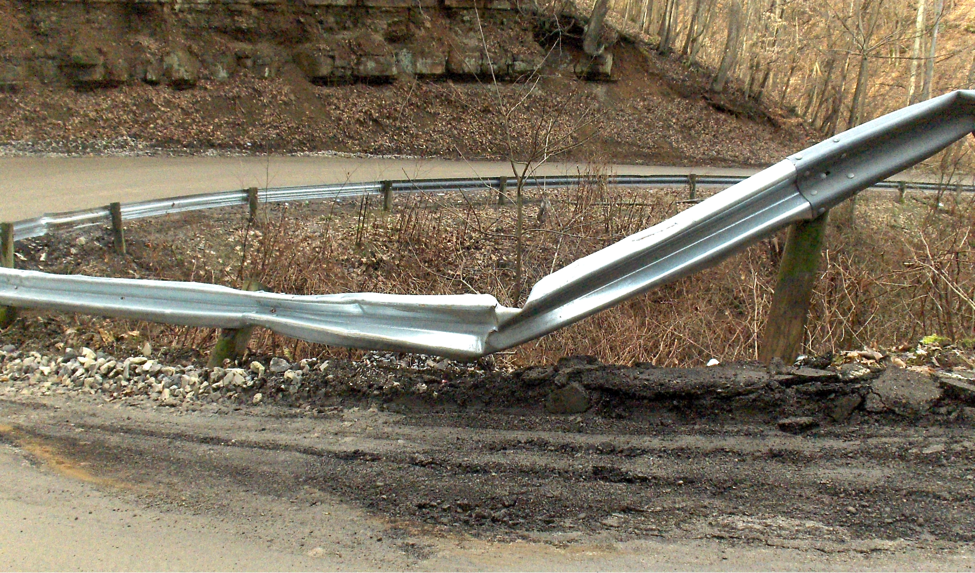
Figure 1. Switchback curve on Barker Run Road has seen its share of damage from the increase in truck traffic.
After leaving Route 7 heading south on Barker Run Road, one encounters a particularly sharp and steep switchback curve as shown in Figure 1. It is this kind of turn that is so sharp that it allows the driver of an overlong truck to be able to look back and check the lug nuts on the rear wheels.
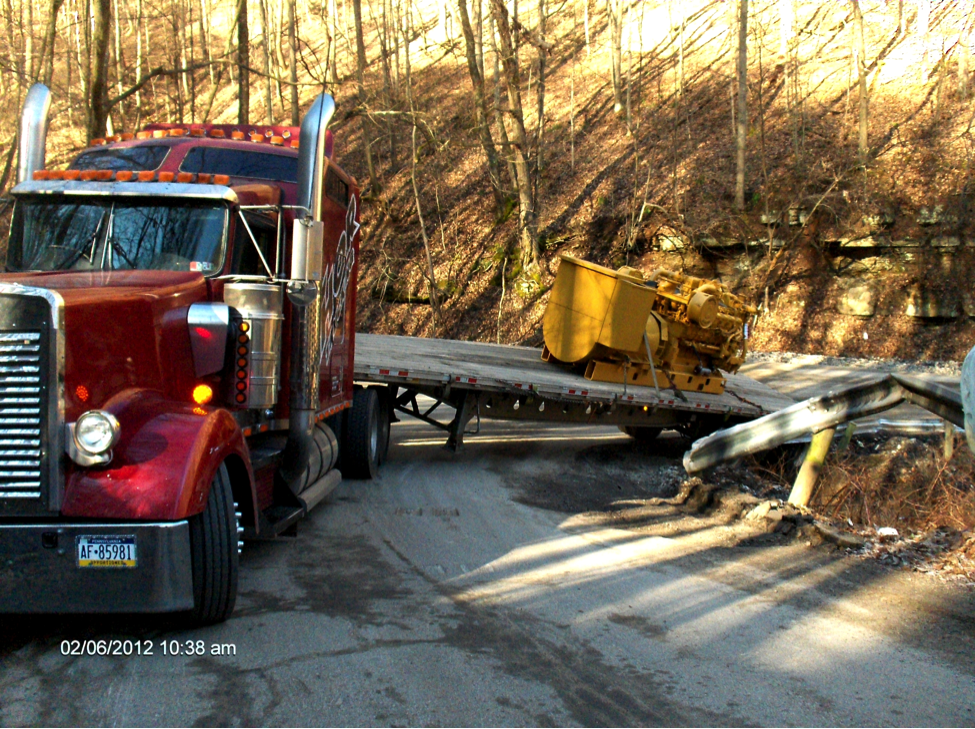
On a few occasions, I have been able to actually witness the attempt of our full-time guards as they try to keep a truck somewhat close to the roadway. The below photo shows that the guardrail was barely able to keep the trailer from going completely over the hillside. The truck was stuck, causing the road to be closed for hours till help could arrive (Figure 2, below).
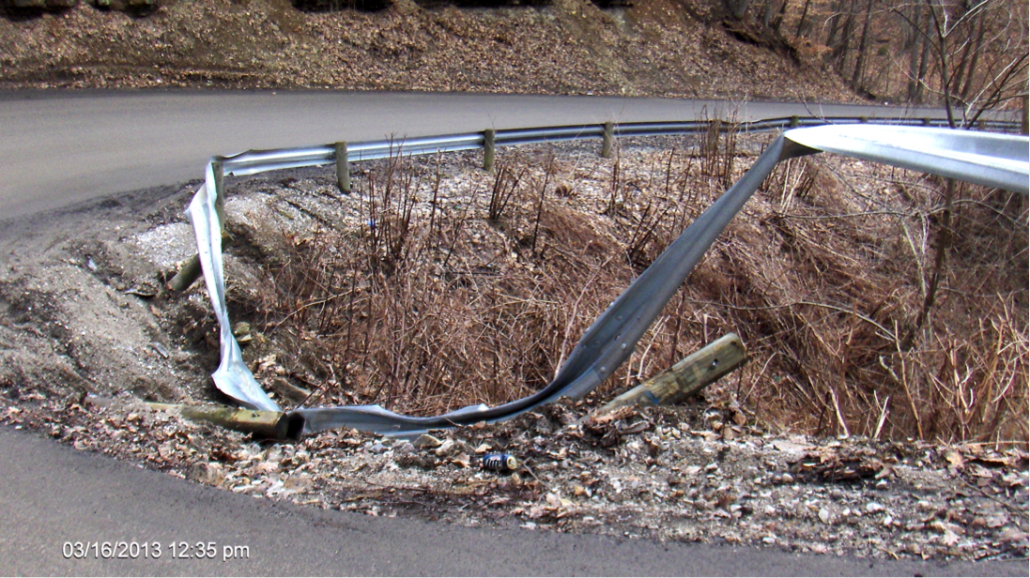
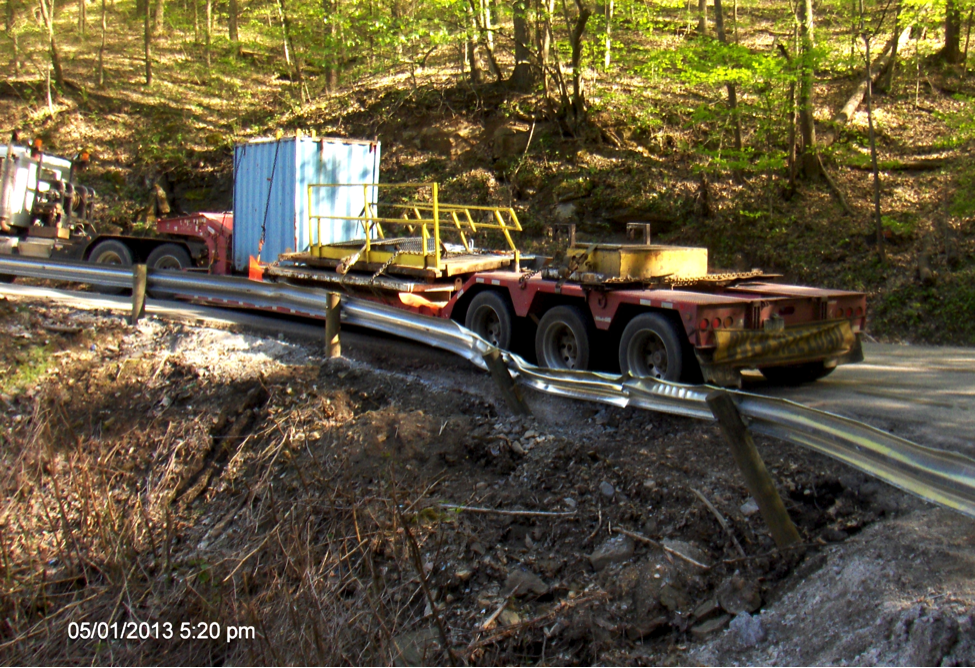
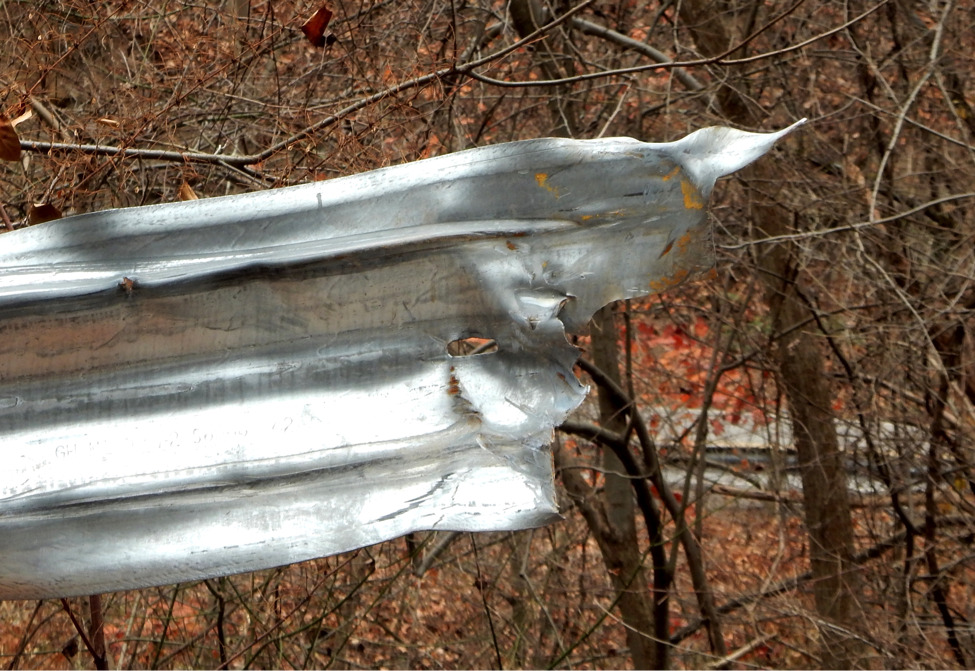
When that incident was over, the photo below from a few weeks later, on March 16, 2013, shows the final damaged rail (Figure 3). The guardrail and posts were replaced and were largely intact when the rail was pushed over again in May of 2013 by another oversized truck trying to get up the hill and around the turn (Figure 4). Ongoing impacts with the guardrail eventually rendered it useless. Figure 5 below is a photo taken in August of 2013.

Infrastructure Damage & Costs
When the Marcellus shale gas drilling began here in Wetzel County eight years ago, it quickly became apparent that the rapidly expanding Chesapeake Energy drilling footprint in north central Wetzel County was leaving scars in the neighborhood, particularly on the roadways. The most visible damages were the road signs, guardrails, and pavement. These effects resulted in a three-layer, road bonding program implemented by the West Virginia Department of Highways. The stipulation requires that any of the large natural gas drillers or operators must post a $1-million bond to cover them statewide, or a single highway district bond for $250,000. This bonding only applies to secondary roads. The third option is to post a bond for fixed, limited miles along specific roads. Some of the pipeline contractors who might be working in a smaller area will use the latter option. Since the DOH generally knows which companies are using the roads, the department usually knows who to approach to pay for damage. In a few cases the companies have reported the damage to the Highway department, and at other times the truckers’ insurance companies report an accident or insurance claim. .
During a recent conversation with a WV-DOH representative, I was told that he quite frequently gets good cooperation from the gas industry companies in paying for damages. He said this is true even when a number of different companies and dozens of their subcontractors are using the same road.
Usually the guardrails just need to be fixed or replaced and new posts installed. Sometimes it is not critical that it be done immediately. However, at times the repairs should be done now. A good example of when repairs are needed soon is shown below in Figure 7, right. This remnant is the shredded, mangled, twisted remains of the stubborn effort of the steel to stop a truck.
The rail has now been totally sliced open, making it an extraordinary danger to the traveling public. As we enter the winter season with a bit of snow and ice on this steep road above this section, any of my neighbors could slide into this. I am optimistic that it will be replaced soon and have had several conversations with the WV-DOH to speed up the process.
By Bill Hughes, WV Community Liaison, FracTracker Alliance
Read more Field Diary articles.

Has our beer been fracked?
By Matt Unger and Gianna Calisto, FracTracker PA Interns
Recently, a Grist.com article, entitled Hey! Did somebody frack my favorite beer? caught our attention here at FracTracker Alliance. In the piece, a concerned citizen questioned whether or not fracking could be affecting what many consider to be the crown jewel of Pennsylvania brewing – Yuengling. The author responded very thoroughly, but needed a map to help show the locations of breweries closest to drilling. To help identify any potential problems and hopefully allow the Commonwealth’s beer drinkers to drink easily tonight, we’ve pulled together such a map.
The PA Beer and Unconventional Drilling Map
Click on the map to explore the breweries and nearby drilling activity
On this map you will see all of the drilled wells (orange), permitted wells (purple), and breweries / brewpubs that we could find in Pennsylvania as of 11-16-2014. The data was gathered from the PA DEP website and The Beer Mapping Project, as well as from a tool our map below contains that allows the viewer to measure distances between two points.
The breweries/brewpubs in the South Central and South Eastern parts of the state are located quite a long distance away from unconventional well pads. This means that Yuengling is likely safe so long as there are no pipeline or traffic incidents nearby!
Even the other areas of Pennsylvania show that brewing near areas of fracking is relatively uncommon. However, there are a few exceptions, particularly in the North Eastern and South Western parts of the state.
Select Results
- Yuengling Brewery: 38 Miles from the nearest permitted well, 40 miles from the nearest drilled well.
- Iron City Brewing Company: 12 miles from the nearest permitted well, 11.7 miles from the nearest drilled well. Both well sites are upstream from the brewery.
- Nimble Hill Brewing Company: 0.5 miles from nearest drilled and permitted well
Use the measure tool on the fullscreen map to explore more about PA brewing and its proximity to drilling.
Things to Consider
The Grist article that we referred to earlier did a great job at outlining some of the risks of drilling and caveats to supporting your favorite brewery. Simply being located near a drilling site does not necessarily mean that the area’s water and air are polluted, but it is a risk. In addition to the points that Grist made, keep in mind that fracking can have other, more indirect effects on the beer industry; well pads are not the only places where effects on the environment can be seen. Spills and traffic involving the transportation of drilling resources, products, and waste pose very serious risks through the areas that these items are transported. This intense industrial activity can also give off localized air pollution. The map above only begins to highlight all of the potential beer-scare scenarios, unfortunately.
If you do feel that your favorite beer is being affected by nearby drilling activity, there are very easy things that you can do, as the Grist article explains. In the mean time, we at FracTracker will happily taste test each PA brewery’s product should the need arise!
Updated PA Data and Trends
By Matt Kelso, Manager of Data and Technology
The FracTracker Alliance periodically takes a deeper look into the unconventional oil and gas data in Pennsylvania, in order to provide updates for some frequently requested statistics on the industry. Here we provide updated PA data and trends as of December 4, 2014. Since unconventional drilling began in the Commonwealth permits have been issued to drill 15,573 unconventional wells, according to data from the Pennsylvania DEP. Many – 8,696 (56%) – of those permits have actually been drilled. In terms of violations, there have been 5,983 entries on the statewide Compliance Report for unconventional wells throughout the state, which are attributed to 1,790 distinct wells.
Pennsylvania Shale Viewer Map
Please click here for the full screen version, with additional map tools and controls.
Additional Stats
The number of permits, wells, and violations vary significantly from month to month, but each category is well off of its peak. The largest number of unconventional permits issued in a single month was 402, which was in December 2010, more than twice as many as were issued last month. In that year, there were six months with 300 or more permits issued, whereas there has only been one such month to date in 2014.
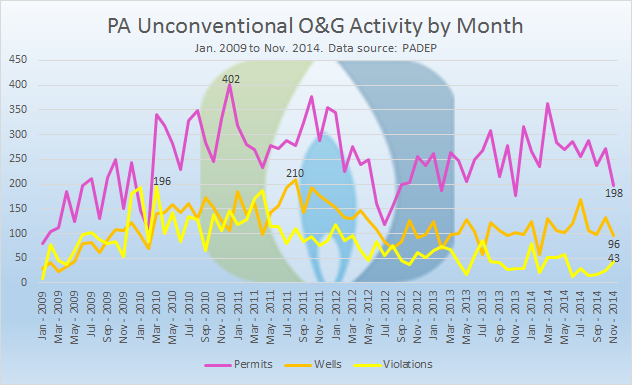
PA unconventional O&G activity per month from Jan. 2009 to Nov. 2014. Source: PADEP
The 210 wells spudded (drilled) in August 2011 represents the high water mark, and is more than two times the amount of wells drilled last month. In the 28 months between March 2010 and June 2012, the industry failed to spud 100 wells only once, reaching 98 in April 2011. In the first 11 months of 2014, that plateau was missed three times, with a low of 58 spuds in February.
There was a significant spike in violations appearing on the compliance report from December 2009 through August 2011. More than 100 violations were issued in 17 out of 21 months, including 196 in March 2010. The number of violations issued has slowed down considerably since then, with November 2014 being the 34th straight month with fewer than 100 violations. Only 14 violations were issued in June 2014.
Violations per Well (VpW)
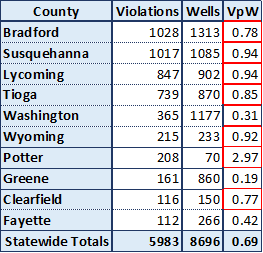
Unconventional violations per well by county in PA, showing the 10 counties with the largest number of violations. Counties with an above average Violations per Well (VpW) score are highlighted in red.
We often ask whether drilling is more problematic in some areas than others. Since the number of wells varies depending upon the location, we must approach this question by looking at the number of violations issued per well drilled (VpW). However, there is an important caveat to consider. Put simply, what is a violation? The Pennsylvania DEP publishes a Compliance Report for unconventional wells, which has 5,983 incidents listed from 2000 through December 4, 2014. However, it used to be common for the DEP to lump several incidents into the same Violation ID number, although this is not the case for more recent infractions. When the DEP counts violations issued, they look at the total number of unique Violation ID numbers that have been issued, not the total number of incidents on the report. Here, we include the more inclusive list of items on the compliance report.
Of the 10 counties with the largest number of violations issued, only 3 counties have a violations per well mark below the statewide average. Notably, each of those three counties are located in Southwestern Pennsylvania. It is unclear from these numbers what is going on in Potter County, but clearly there is a significant problem in that location – with almost three violations issued per well drilled, Potter County has a VpW score 4.3 times the statewide average.
Operator Trends
Before we look at the operators with the most violations, there is an additional caveat to consider: It is relatively common for wells to change hands over their operational lifetimes. This characteristic could be due to one company buying another out, or simply transferring some of their assets. Still, wells changing from one operator to another is a normal aspect of the oil and gas industry. Such a fact matters for this analysis because while violations issued always stick with the responsible party in the DEP data, the name of the operator changes on the Spud Report to the current operator.
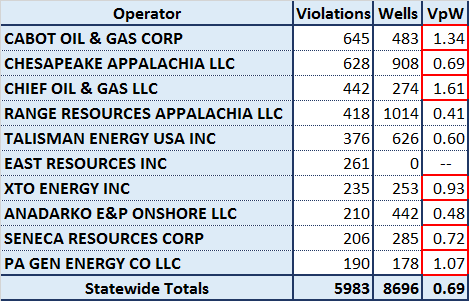
Unconventional violations per well by operator in PA, showing the 10 operators with the largest number of violations. Operators with an above average Violations per Well (VpW) score are highlighted in red.
Because of how these datasets are maintained, we see that East Resources has 261 violations for zero wells, which is of course an impossibly large ratio. That is because East sold off its stake in the Marcellus to Royal Dutch Shell, which does business as SWEPI in Pennsylvania. SWEPI, by the way, is 13th on the list of violations in its own right, with 154 violations for 675 wells, resulting in a 0.23 VpW. If the legacy violations for the old East wells were included, the result would be a 0.61 ViW score, which is almost three times as high, but still below the statewide average. FracTracker doesn’t do the analysis that way, both because it is unfair to the new operator to charge them with violations that they had nothing to do with, as well as being nearly impossible to keep track of the various transactions that result in wells changing hands over the years.
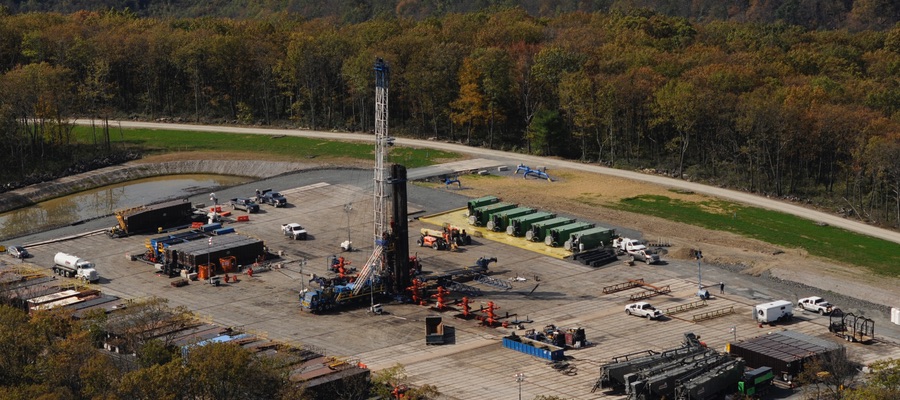
Cover image by Pete Stern, 2013.
Oil Trains Passing Through Pittsburgh
A Pilot Train Count
By Samantha Malone – Manager of Education, Communications, & Partnerships
FracTracker Alliance and the CREATE Lab at CMU recently launched a pilot project to track the transportation of volatile crude oil as it passes through Pennsylvania and specifically the Pittsburgh region.
For a bit of background, we were specifically interested in how many cars marked with either a 1075 or 1267 placard (shown below). 1075 placards designate cars that are carrying or recently carried (not yet cleaned out) butane, LPG, propane, or a flammable gas. Alternatively, 1267 placards are warning signs for cars carrying petroleum crude oil or some sort of flammable liquid.
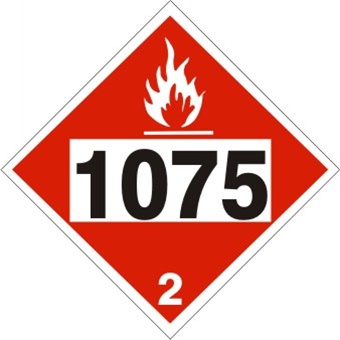
DOT Placard 1075 Butane, LPG, Propane, Flammable Gas, Class 2
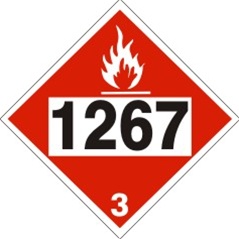
DOT Placard 1267 Petroleum Crude Oil, Flammable Liquid, Class 3
Oil Train Counts
Over 11 hours we counted 28 trains, 10 of which contained at least one car with the 1075 or 1267 placard. Most of these trains were quite long, with 28 trains hauling 2,874 cars.
The largest inbound train with the 1267 placard that we identified and estimated to be full was hauling 97 crude tankers. If they were indeed full, this train carried between 2.5 and 3.4 million gallons of crude oil. As a point of reference, the Lac-Mégantic derailment that occurred in 2013 in Quebec and killed 47 people was only carrying 74 Bakken crude cars.
Of the 2,874 cars that we counted, 360 were carrying some sort of oil product. Of those oil cars, approximately 70% were of the 1267 variety (Figure 1).
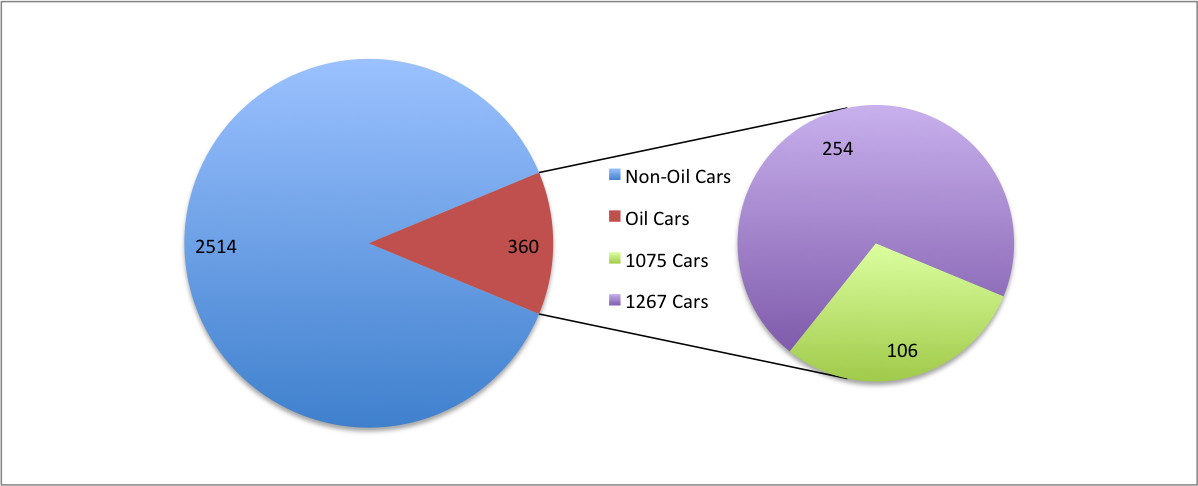
Figure 1. Ratio of oil cars to total documented by volunteers in Pittsburgh, PA over 11 hours
Speed Matters
The fastest oil train that we observed was going approximately 50 MPH. This train was likely full, based on load estimates and the direction it was traveling. This speed violates a voluntary compliance that crude trains run <40 MPH through high-threat areas. A train that derailed in Lynchburg, VA in April was traveling just 24 mph. Our counting location would likely qualify as a high-threat area, as we were near Neville Island, relatively close to ALCOSAN and the City of Pittsburgh, and just a few yards from the Ohio River and residential homes.
While Pittsburgh certainly has its share of oil trains, concern over the dangers that these trains pose to towns along its tracks extends far beyond the Pittsburgh area. Groups as far as California have gathered together to monitor train traffic. We hope that by tracking and monitoring the number of oil trains over time, we can begin to understand the risks that these trains pose should an incident occur.
The Data Collection Process
Here is how we collected the above data: On October 21st our staff, interns, and generous volunteers spent designated shifts observing the passing of trains and the contents of their cars between about 7:30 AM and 6:30 PM. Under the cover of a pop-up shelter, teams of at least three participants videotaped trains as they passed in either direction, counted and recorded the number of cars that they carried, and most importantly identified and counted specific placards that labeled individual cars as oil-carrying.
Many thanks to the groups who helped with this pilot count: volunteer citizens, Group Against Smog and Pollution, Three Rivers Waterkeeper, Women for a Healthy Environment, our interns from Pitt and Duquesne, and CMU staff.
The CREATE Lab then reviewed and analyzed the collected information and video feed. You can take a look at some of the high-resolution video feed they were able to collect with their BreatheCam. If you have specific questions about the train counting protocol or would like to set up one of your own, please contact us.
About Us
FracTracker Alliance is a non-profit with an office in the Pittsburgh area whose mission is to share maps, data, and analyses to communicate impacts of the global oil and gas industry and to inform actions that positively shape our energy future. www.fractracker.org
The Community Robotics, Education and Technology Empowerment Lab (CREATE Lab) explores socially meaningful innovation and deployment of robotic technologies and is based out of Carnegie Mellon University. www.cmucreatelab.org
Is it getting hot in North Dakota?
By Samantha Malone, Manager of Education, Communications & Partnerships, FracTracker Alliance
North Dakota sure is popular recently. You might wonder why ND’s oil and gas development has been such a hot topic when the average monthly temperature there in November is only 27° F. Below we summarize the recent ND coverage and why the state has been the focus of several conversations lately.
The Intensity of Drilling
On November 22nd The New York Times launched a two-part series starting with The Downside of the Boom. Herein, the NY Times highlights how North Dakota’s regulatory system is insufficient to manage a hefty oil and gas industry. Part two in the series looks into Where Oil and Politics Mix in ND. This investigative journalism series questioned how well the state is managing oil and gas development, which was followed quickly by criticism of the series by state officials. If you haven’t checked out this series and its incredible visuals yet, I would highly recommend it.
FracTracker maintains a shale viewer map of North Dakota and its horizontal oil wells if you would like to explore where the industry is operating. Interestingly, ND is one of the few states where the horizontally drilled well data is available to the public. (Horizontal wells jut out from the vertical wells below ground.) Our interactive map of ND includes zooming features, well API information, and a measurement tool to examine horizontal well lengths. The screenshot below shows that one of the laterals on this map extends out two miles underground. Click the map to explore more:
Interactive Map of ND Wells on FracTracker, with Measurement Tool
Alternatively, here the New York Times shows what ND would look like if all of the state’s oil wells were aboveground:

NYTimes Graphic: What North Dakota Would Look Like if Its Oil Drilling Lines Were Aboveground
NPCA
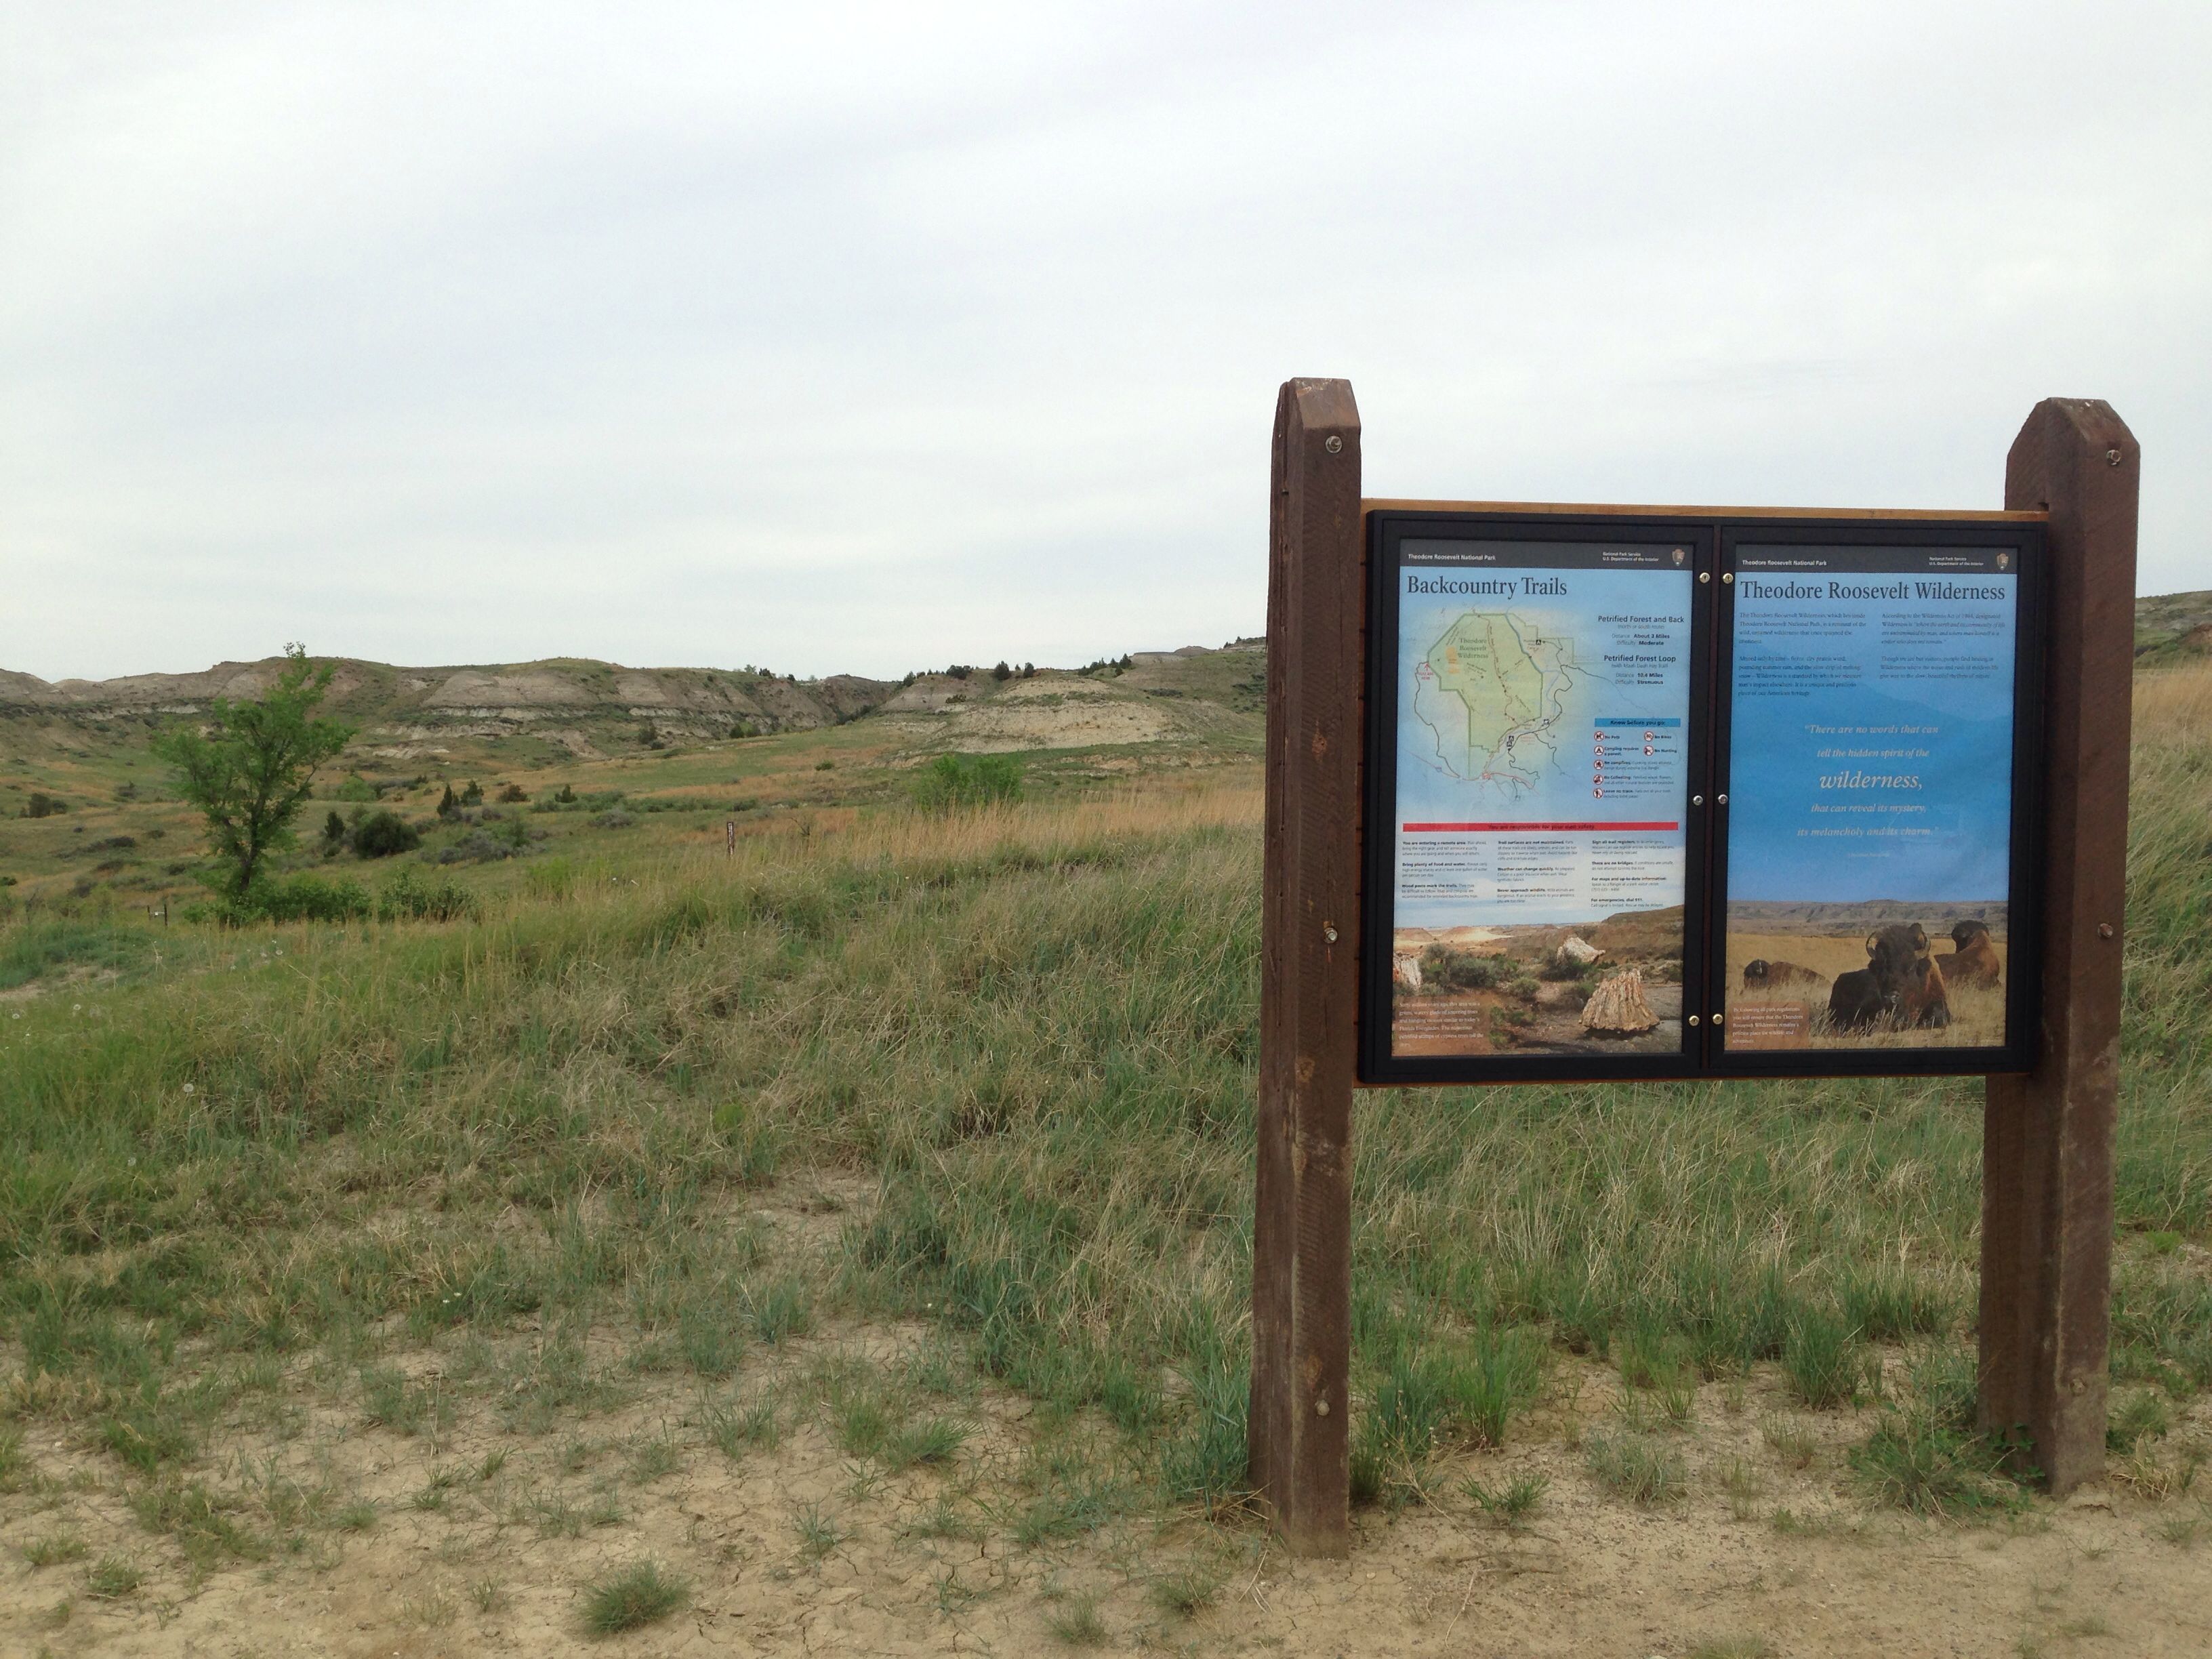
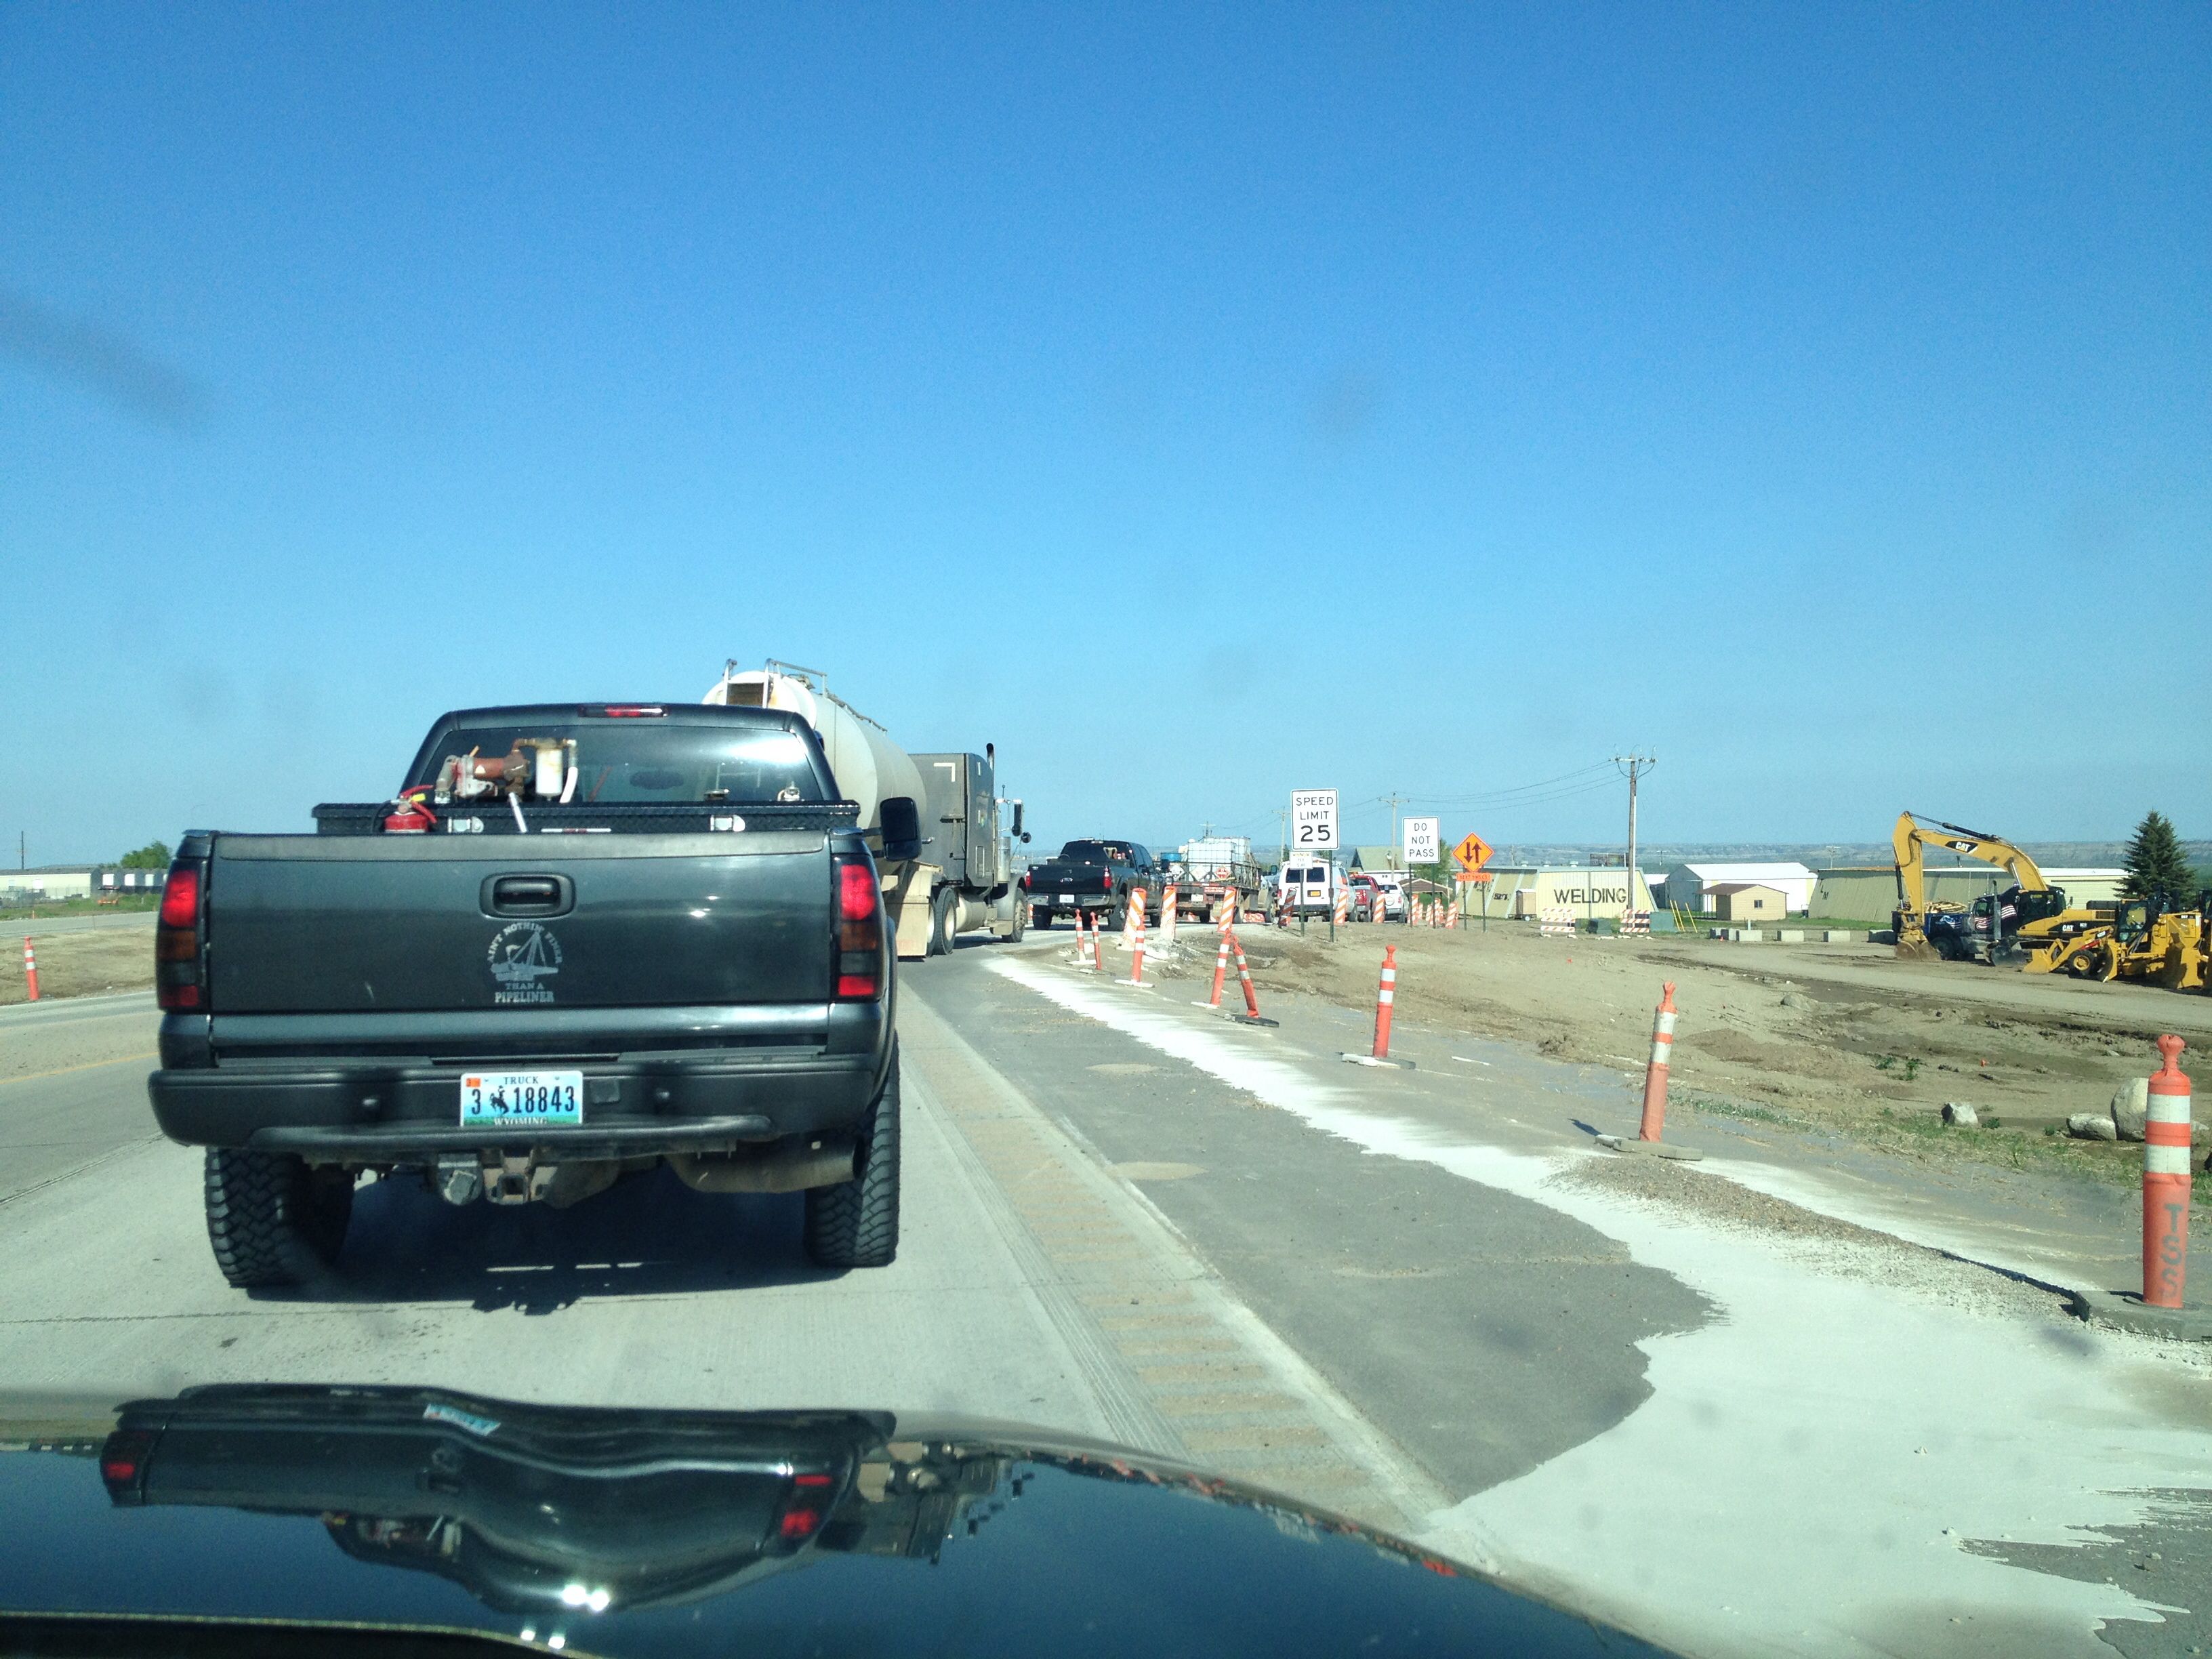
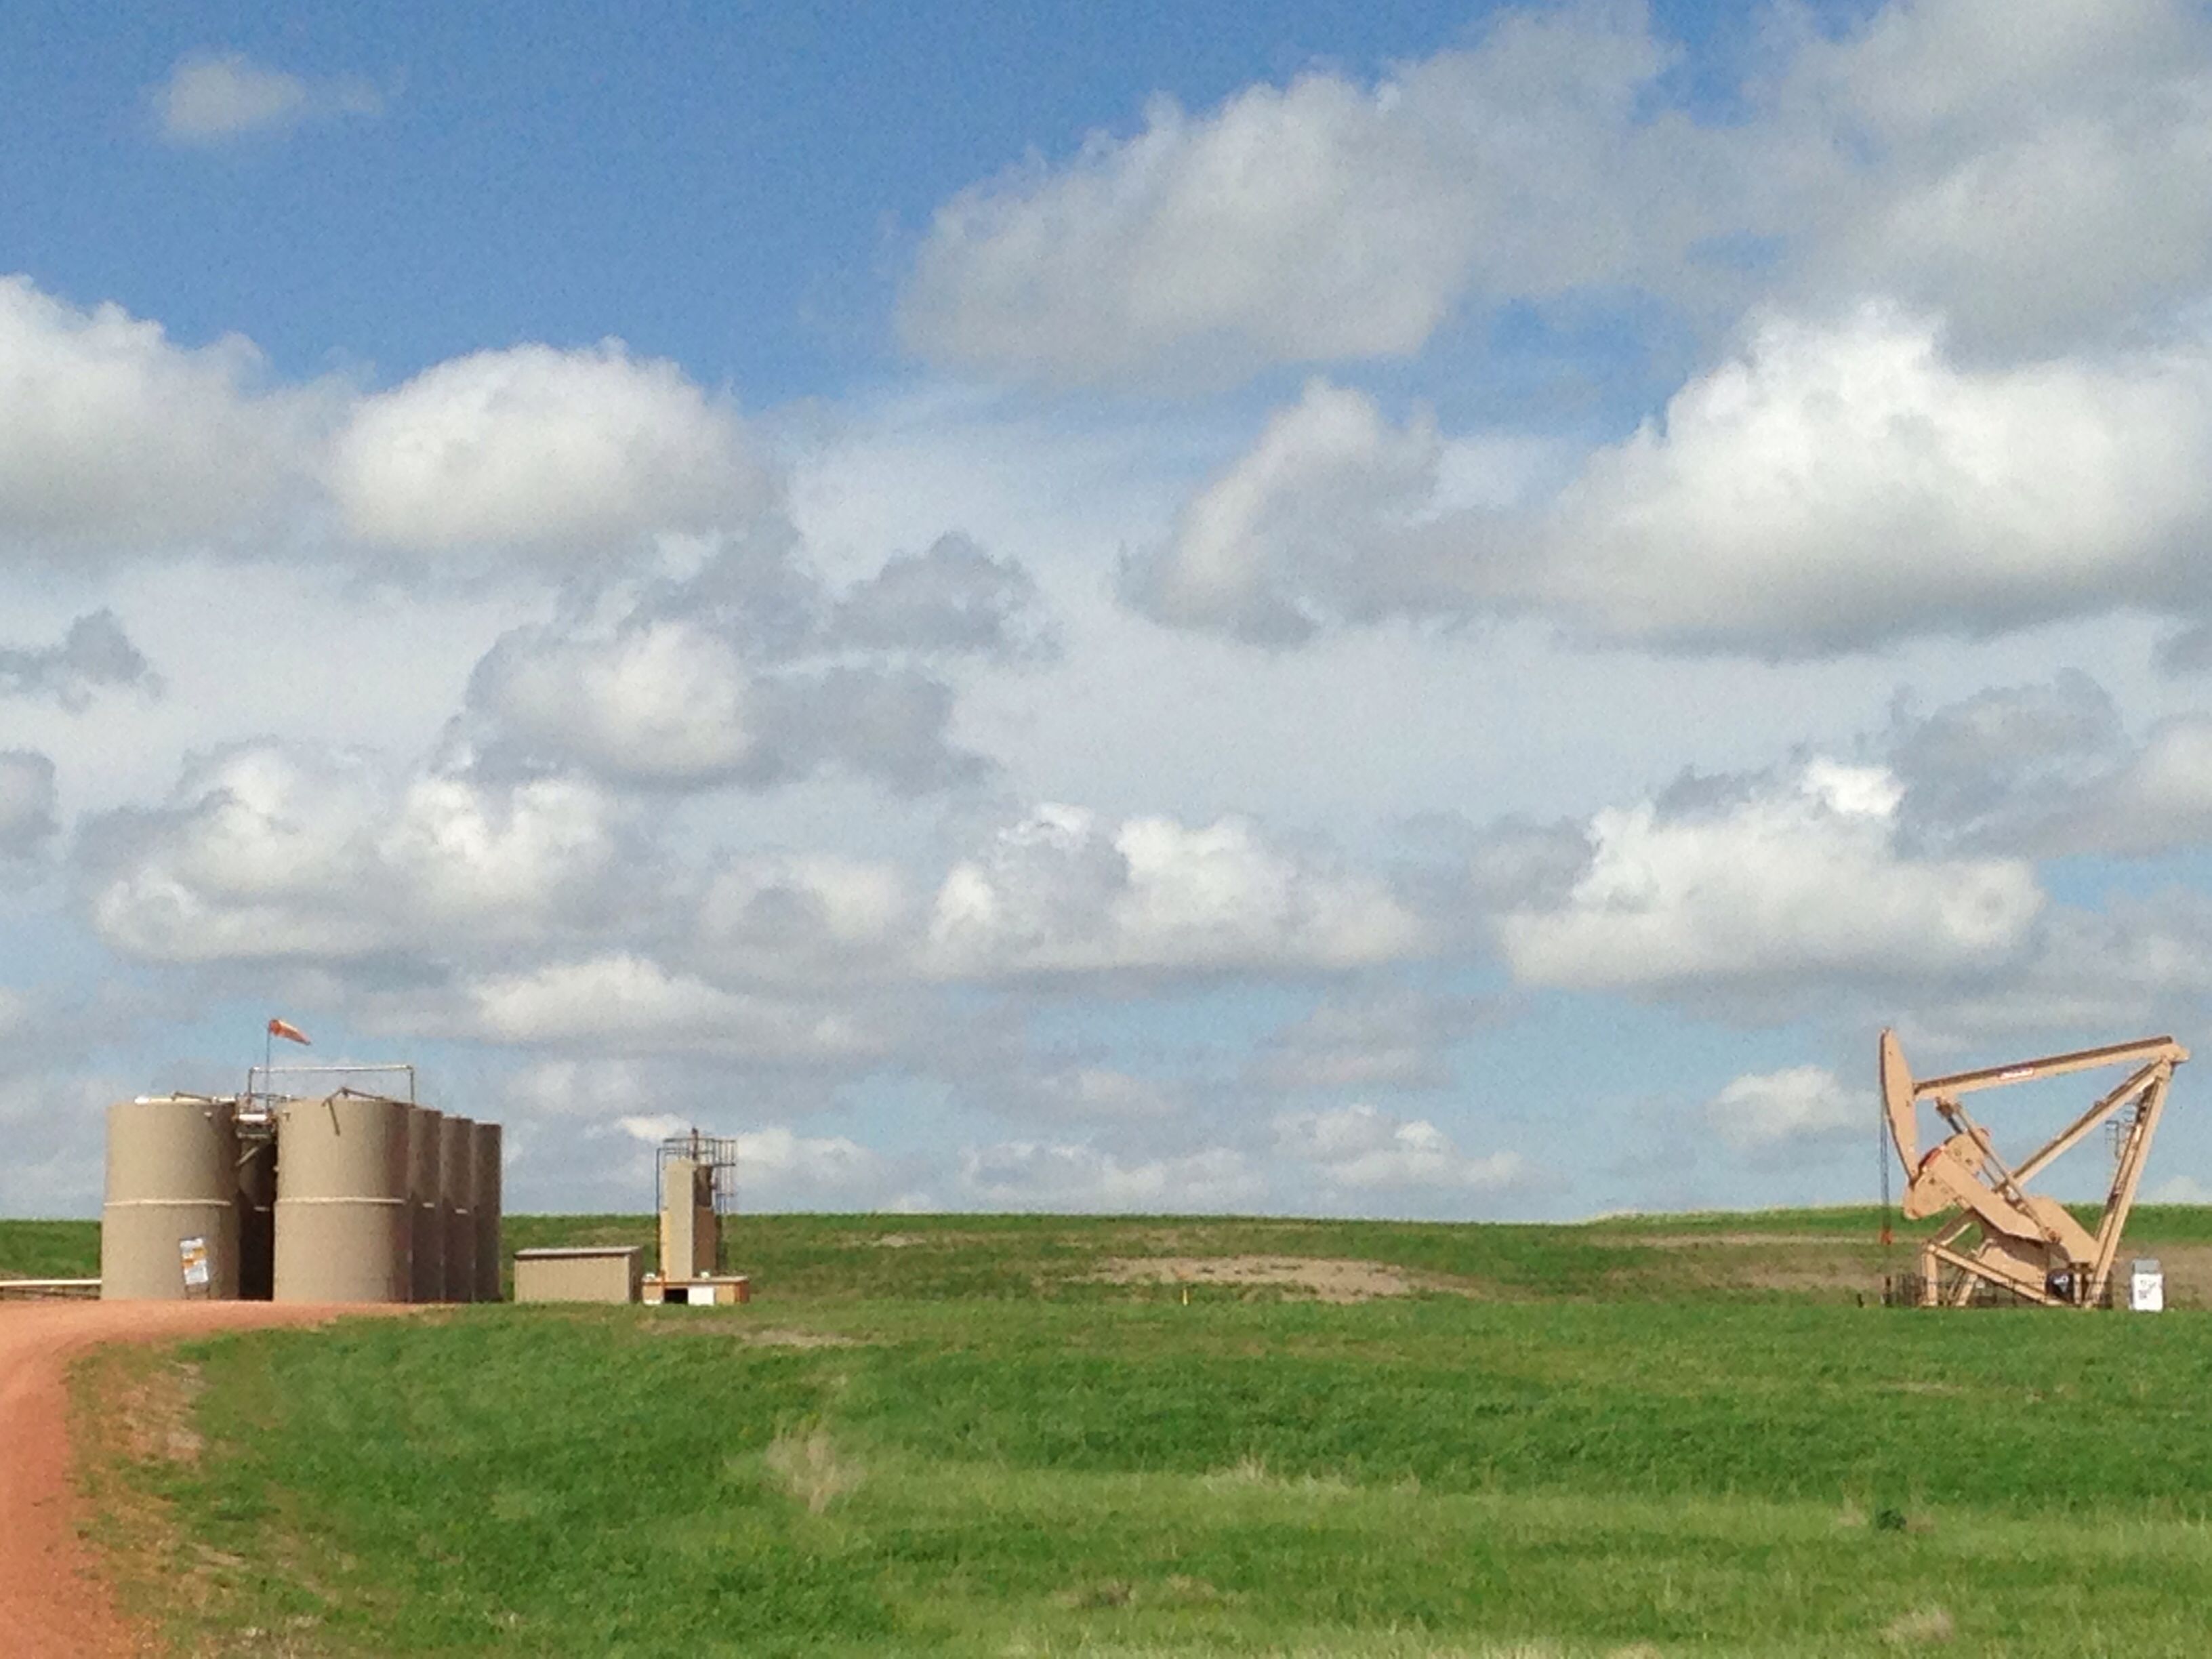
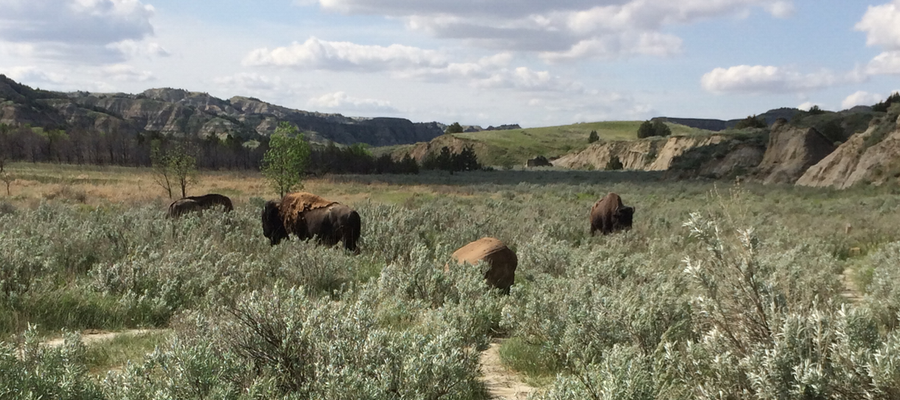
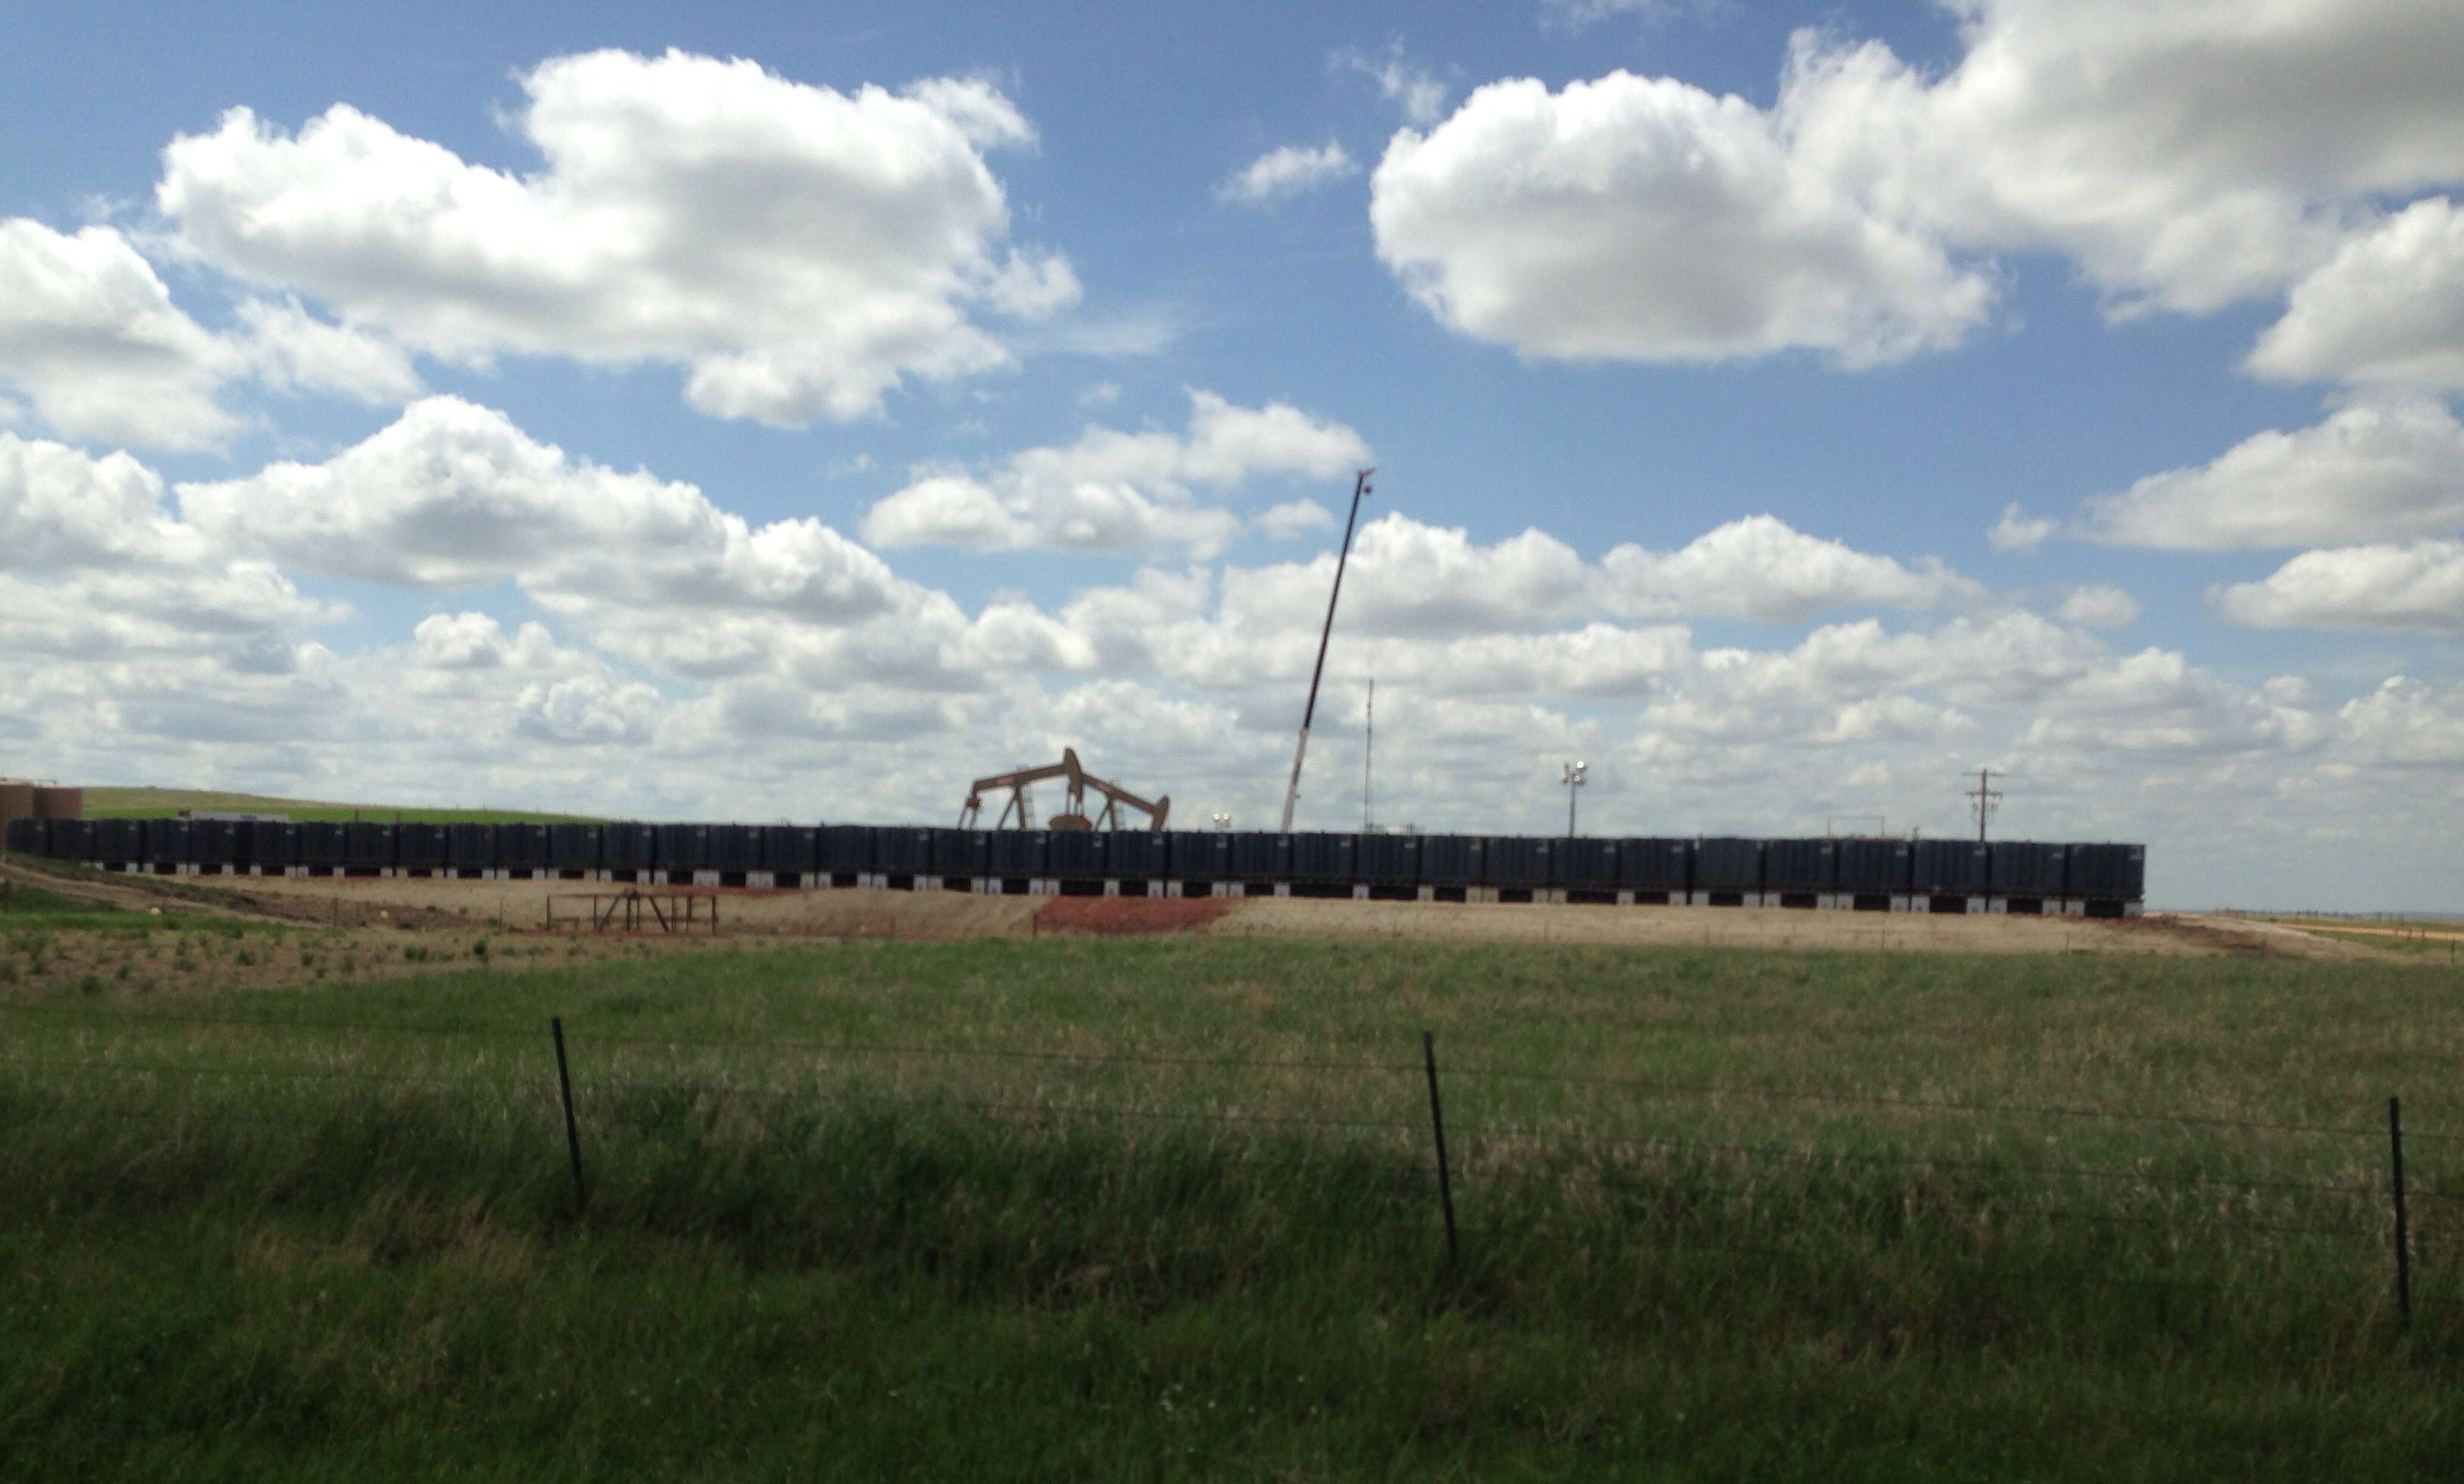
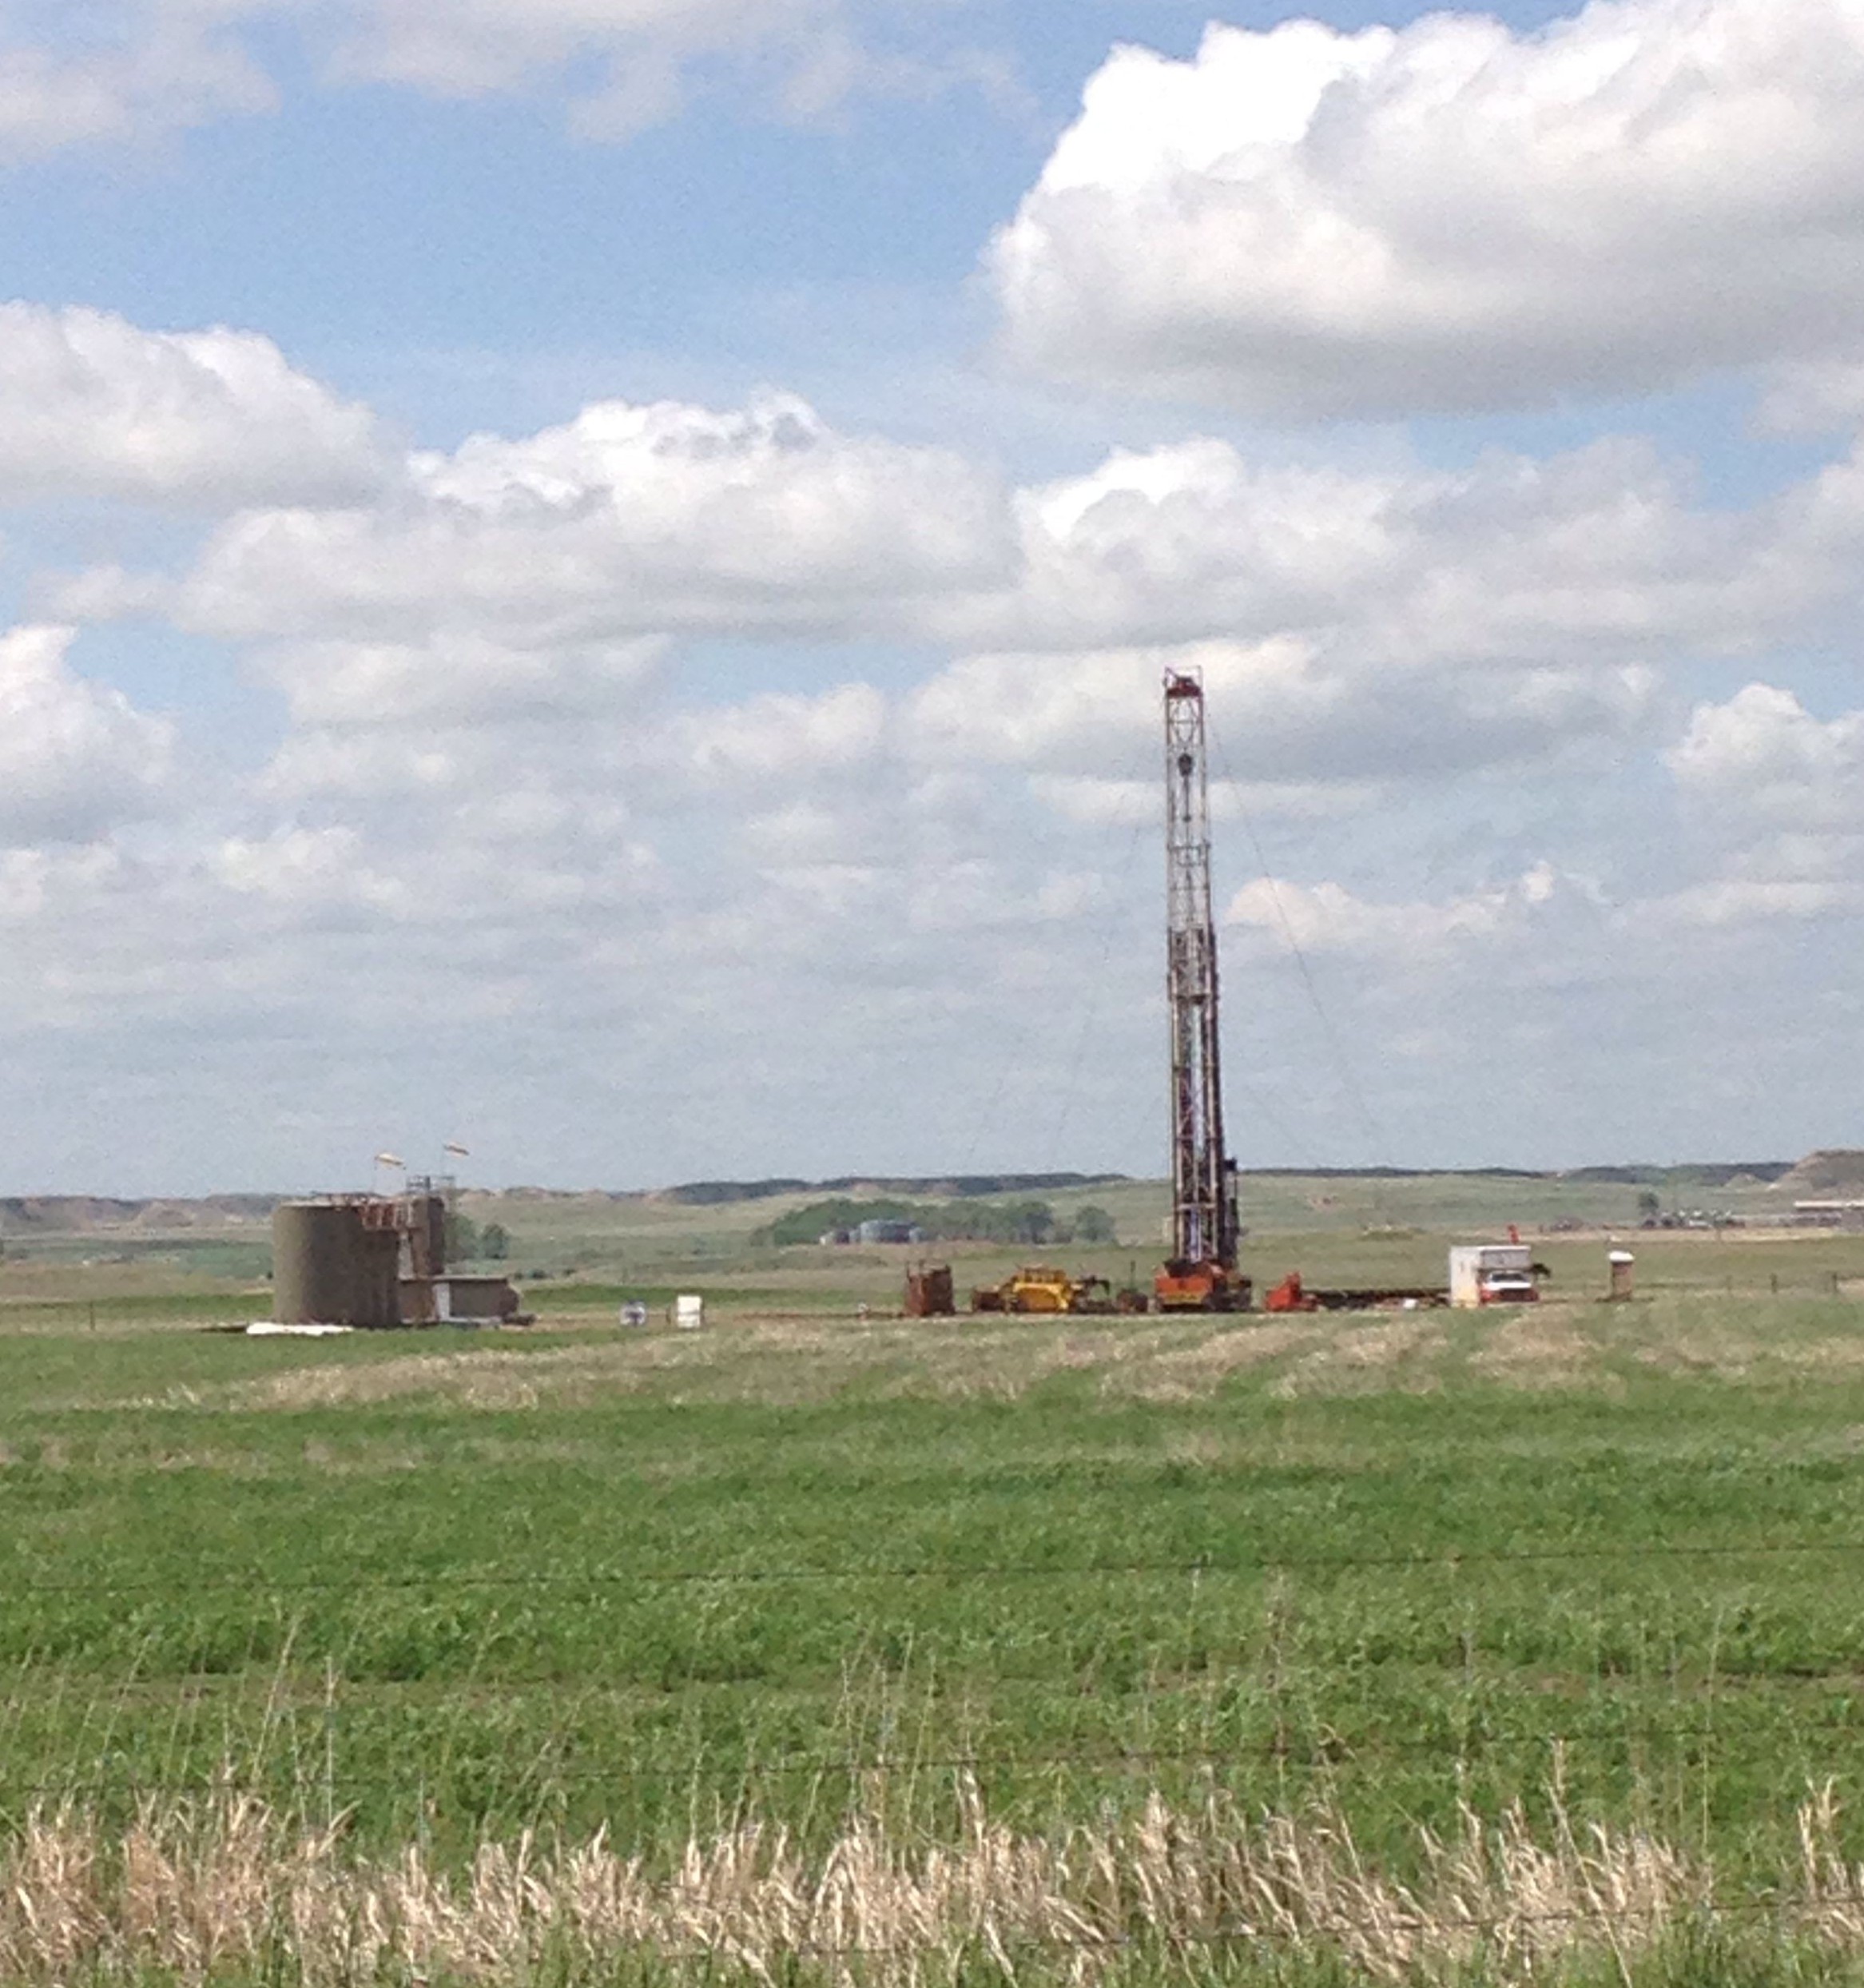
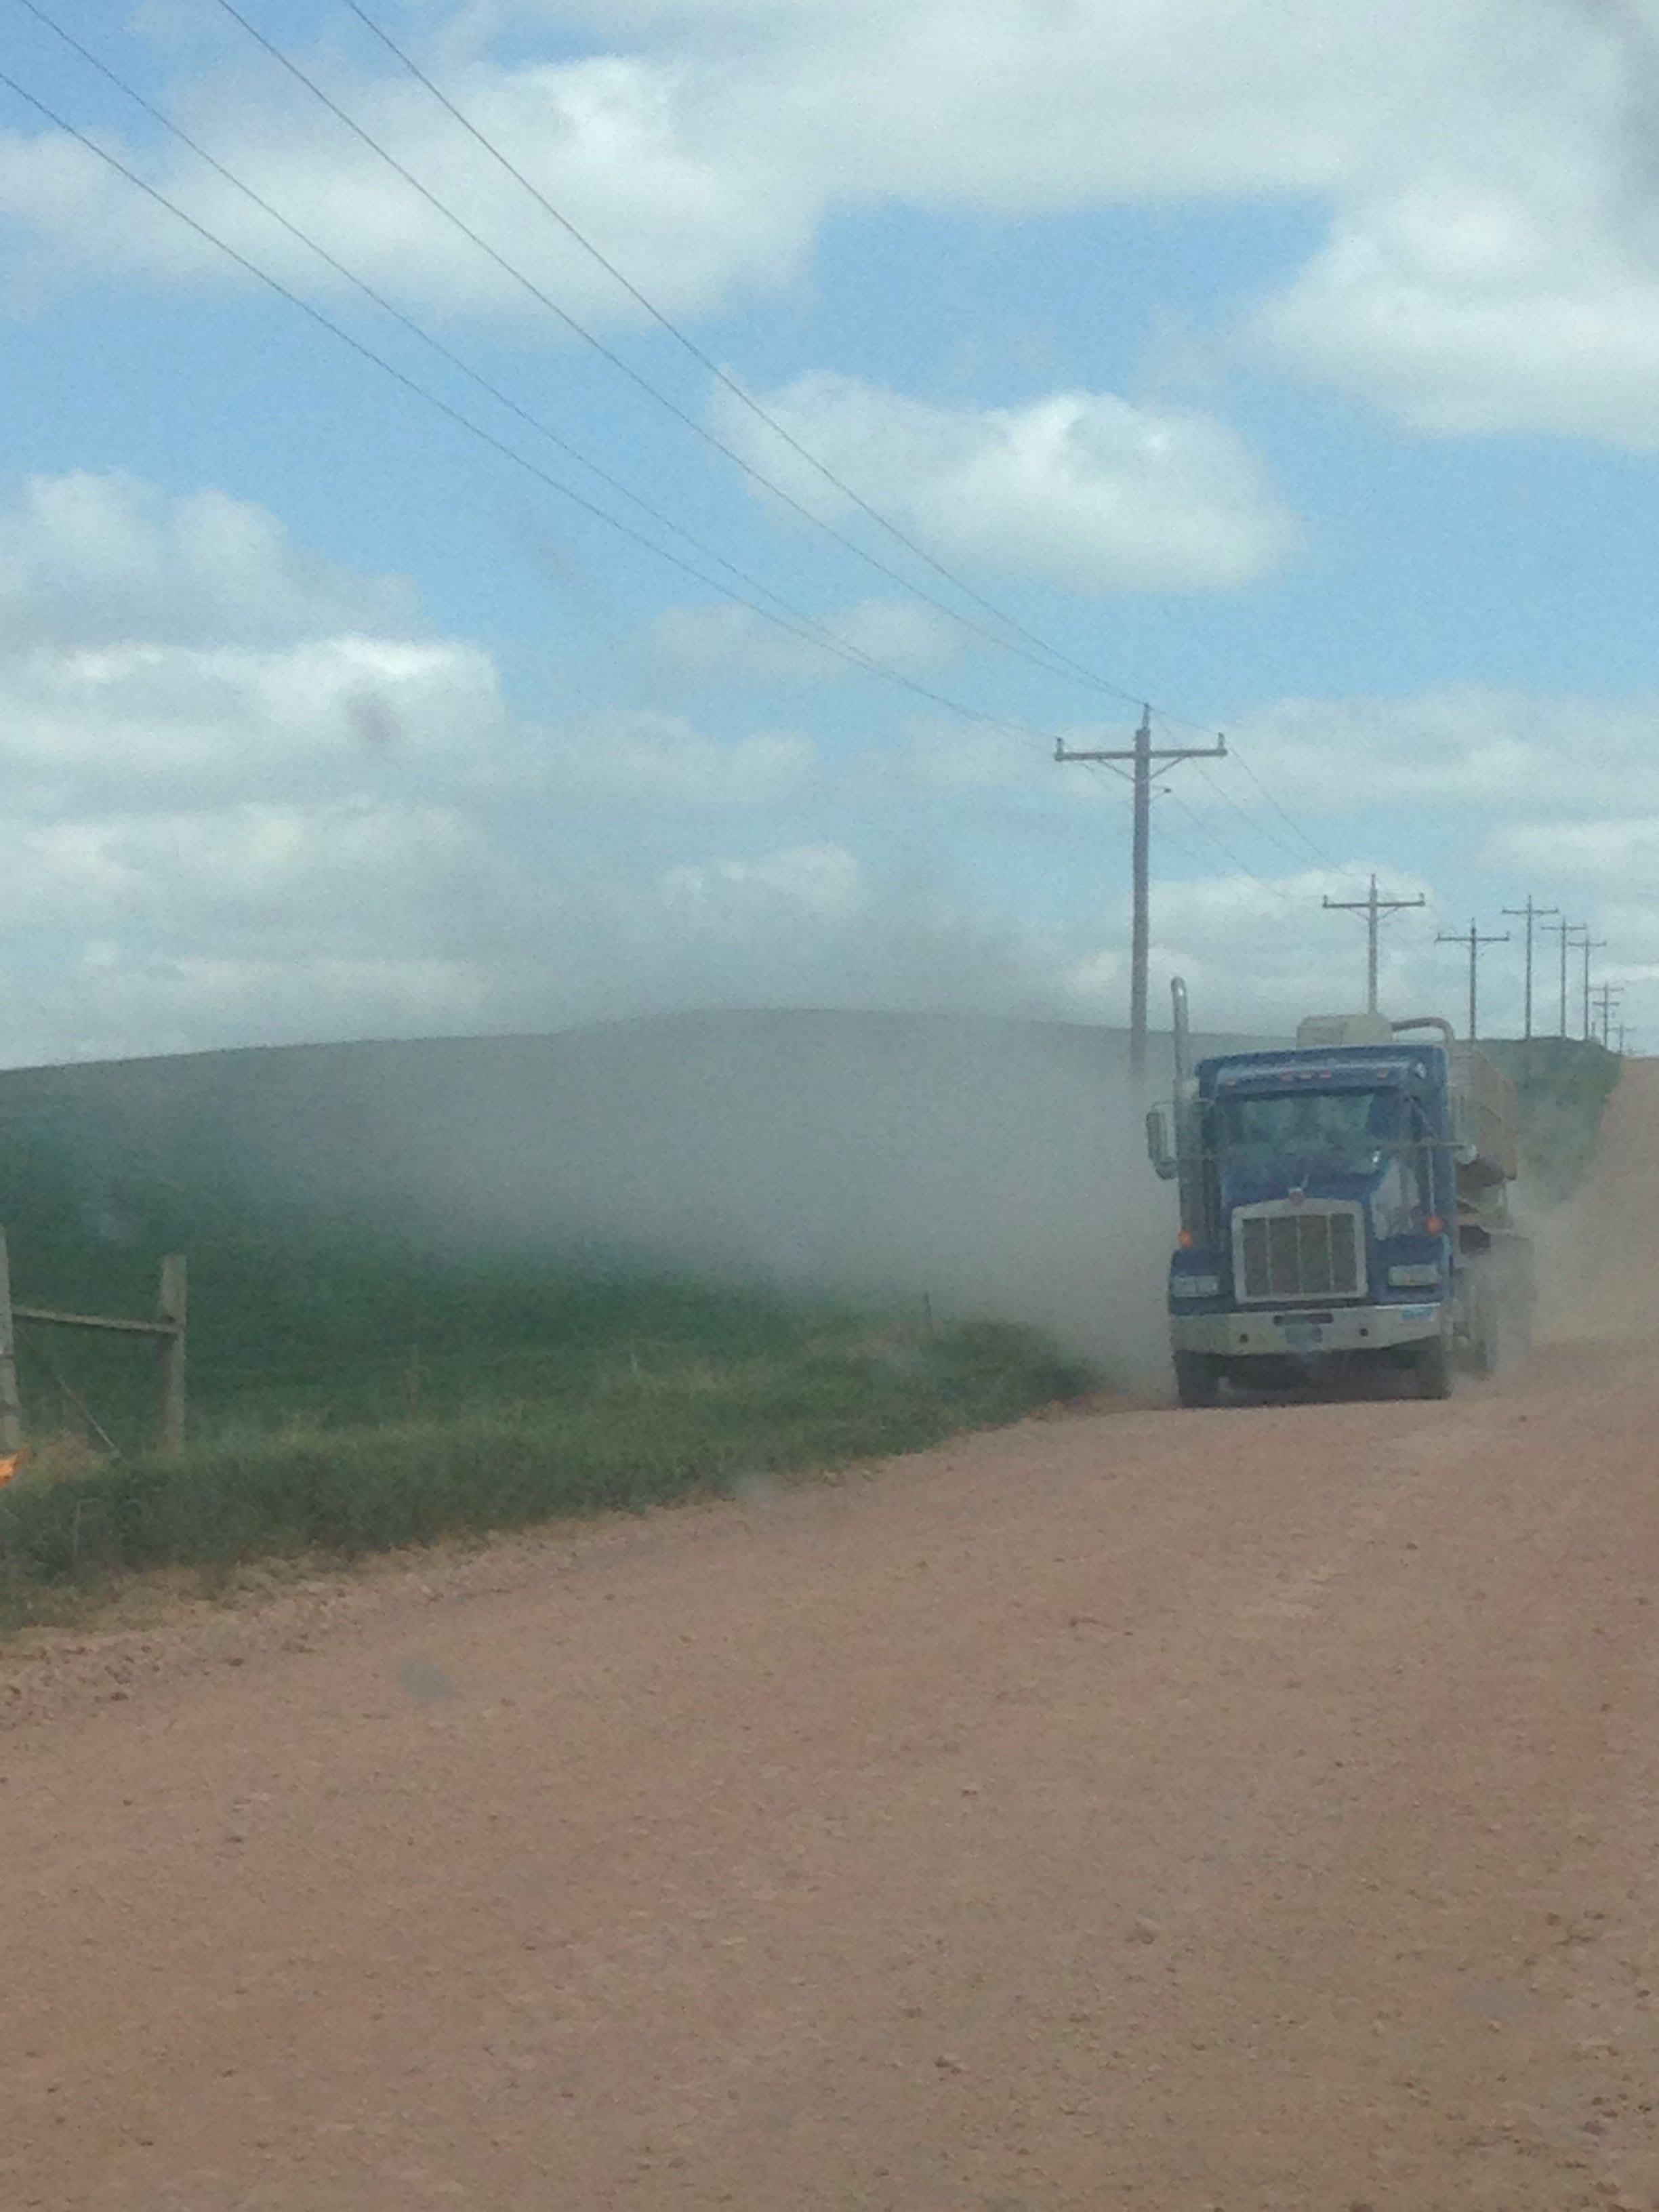
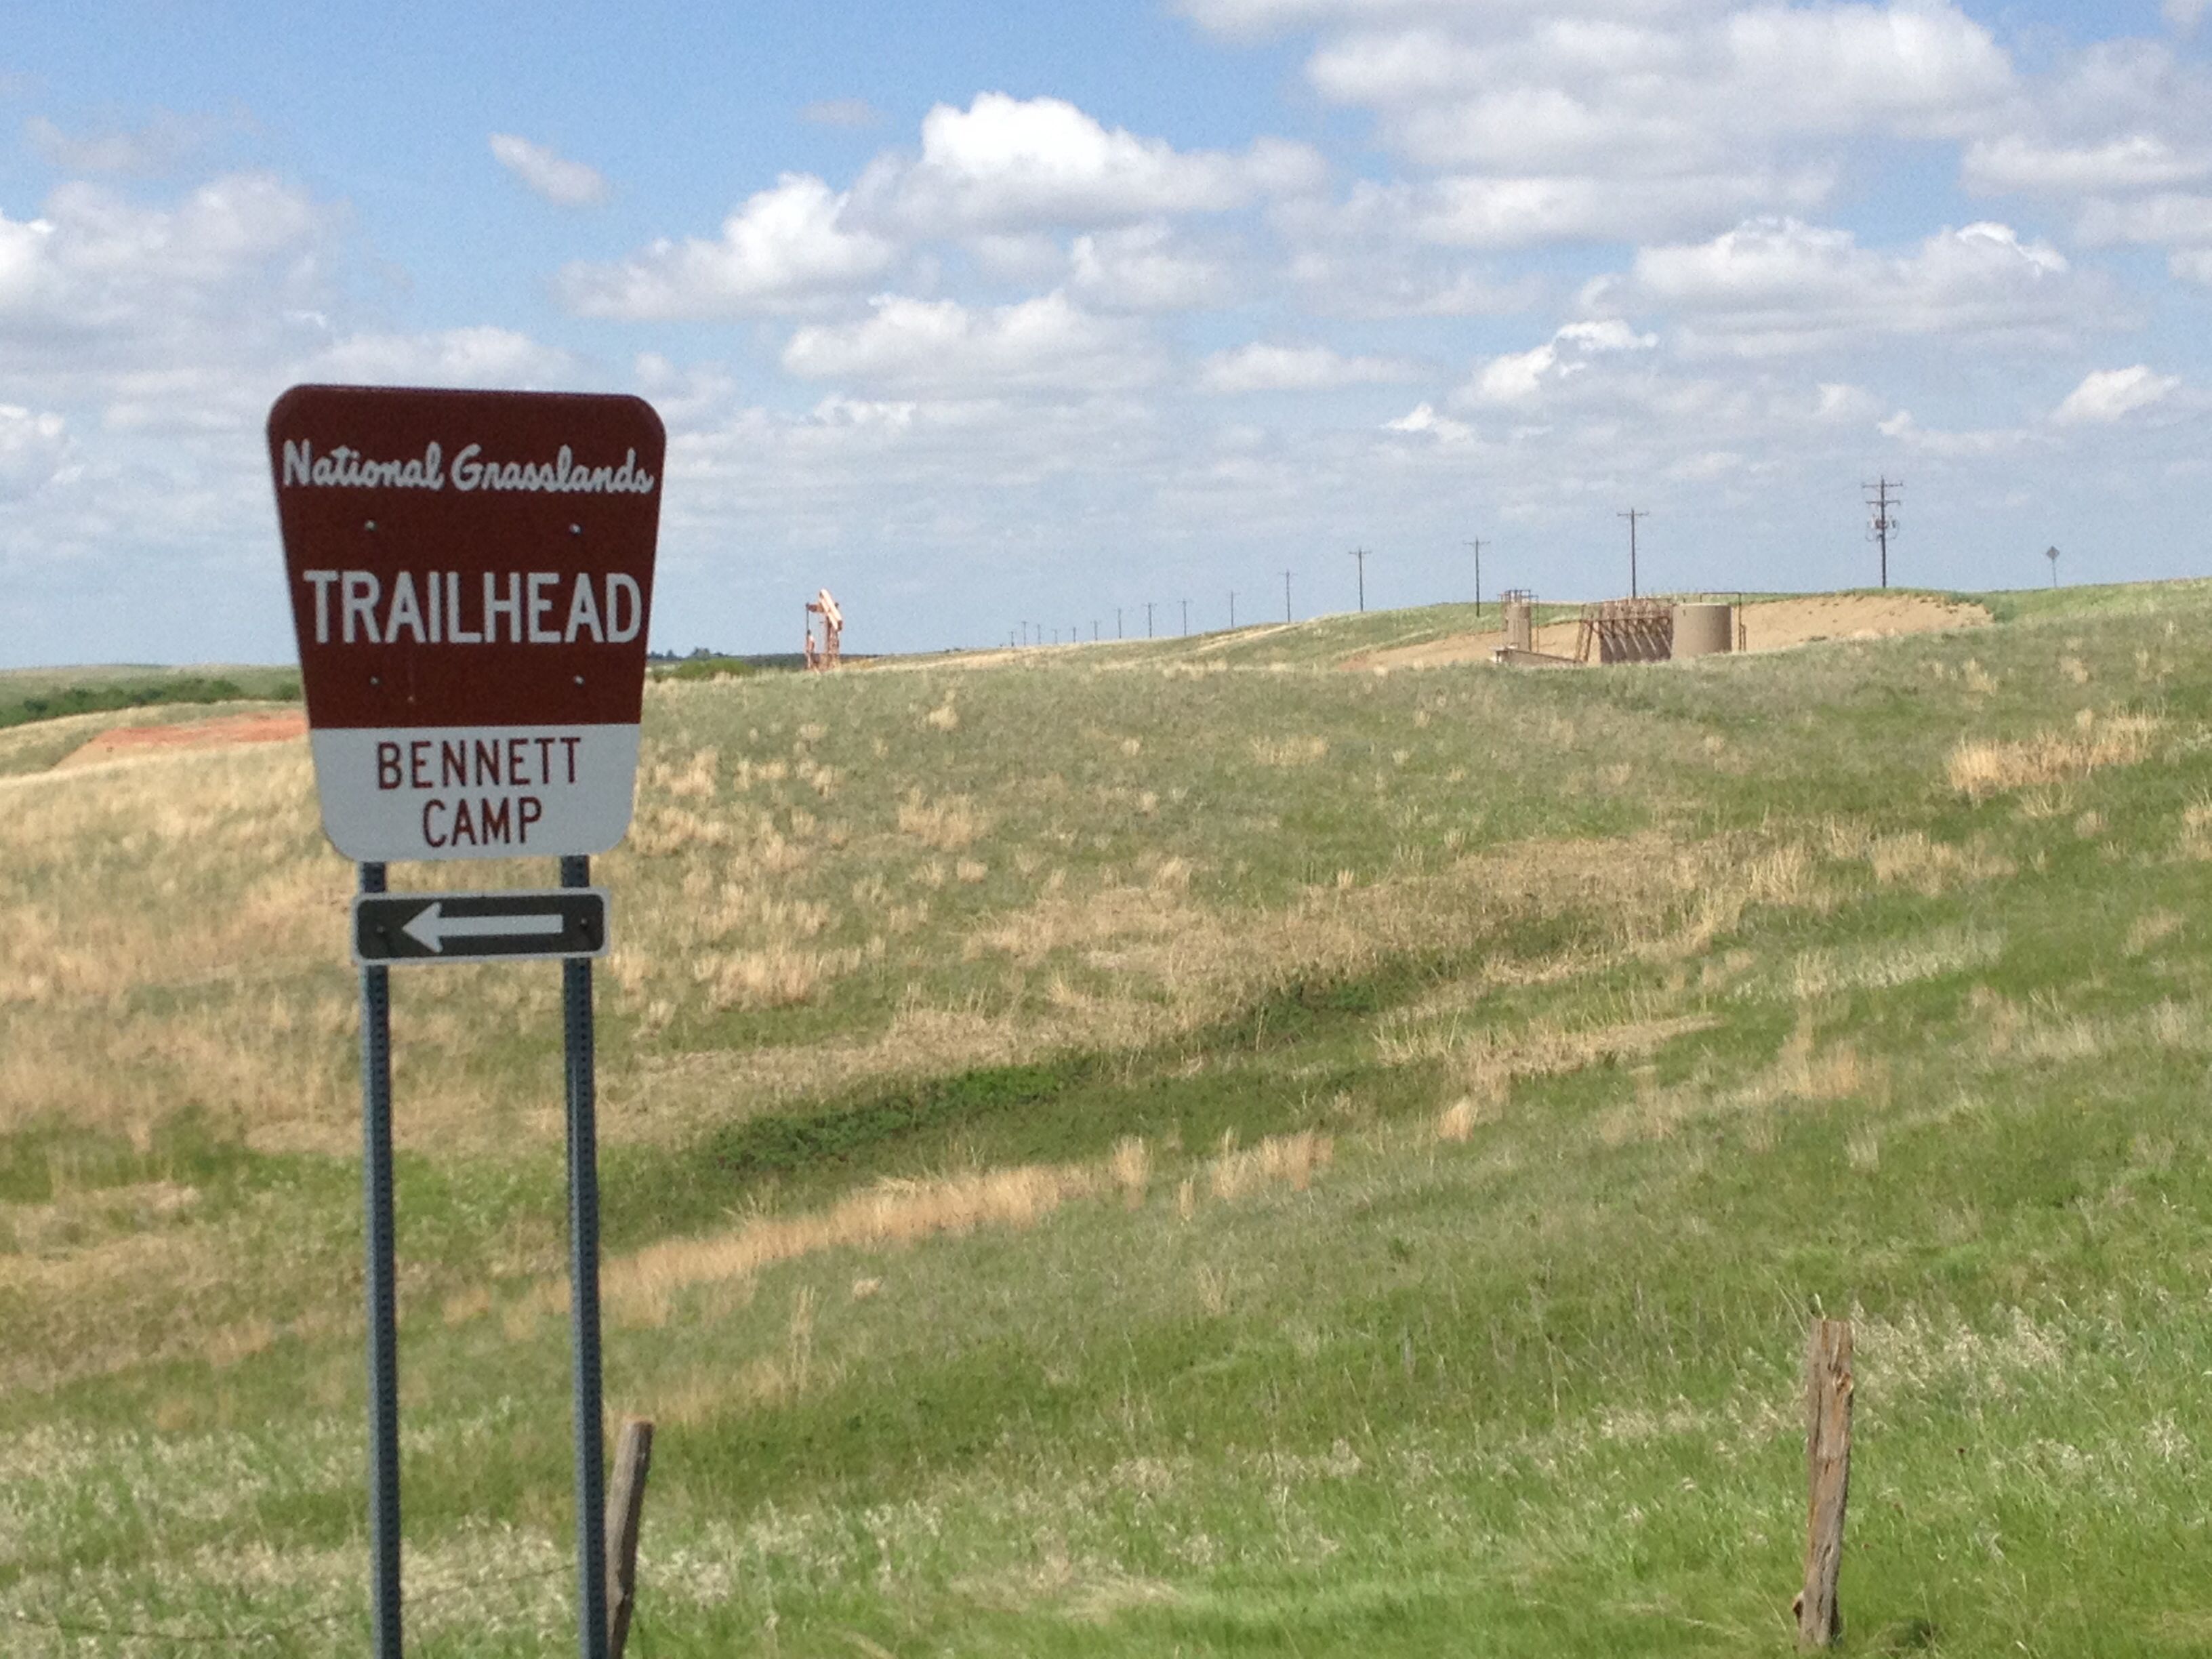
On November 12 and 13, 2014, the National Parks Conservation Association launched their campaign to educate citizens about how oil and gas development may affect America’s national parks. NPCA kicked off their campaign with two events in Pittsburgh and Philadelphia, PA to showcase a crowd-sourced digital map we helped them create with our new mobile app. The map’s photos detail the scale of oil and gas development near North Dakota’s Theodore Roosevelt National Park and is shown below:
NPCA Photo Map. View fullscreen
Photos
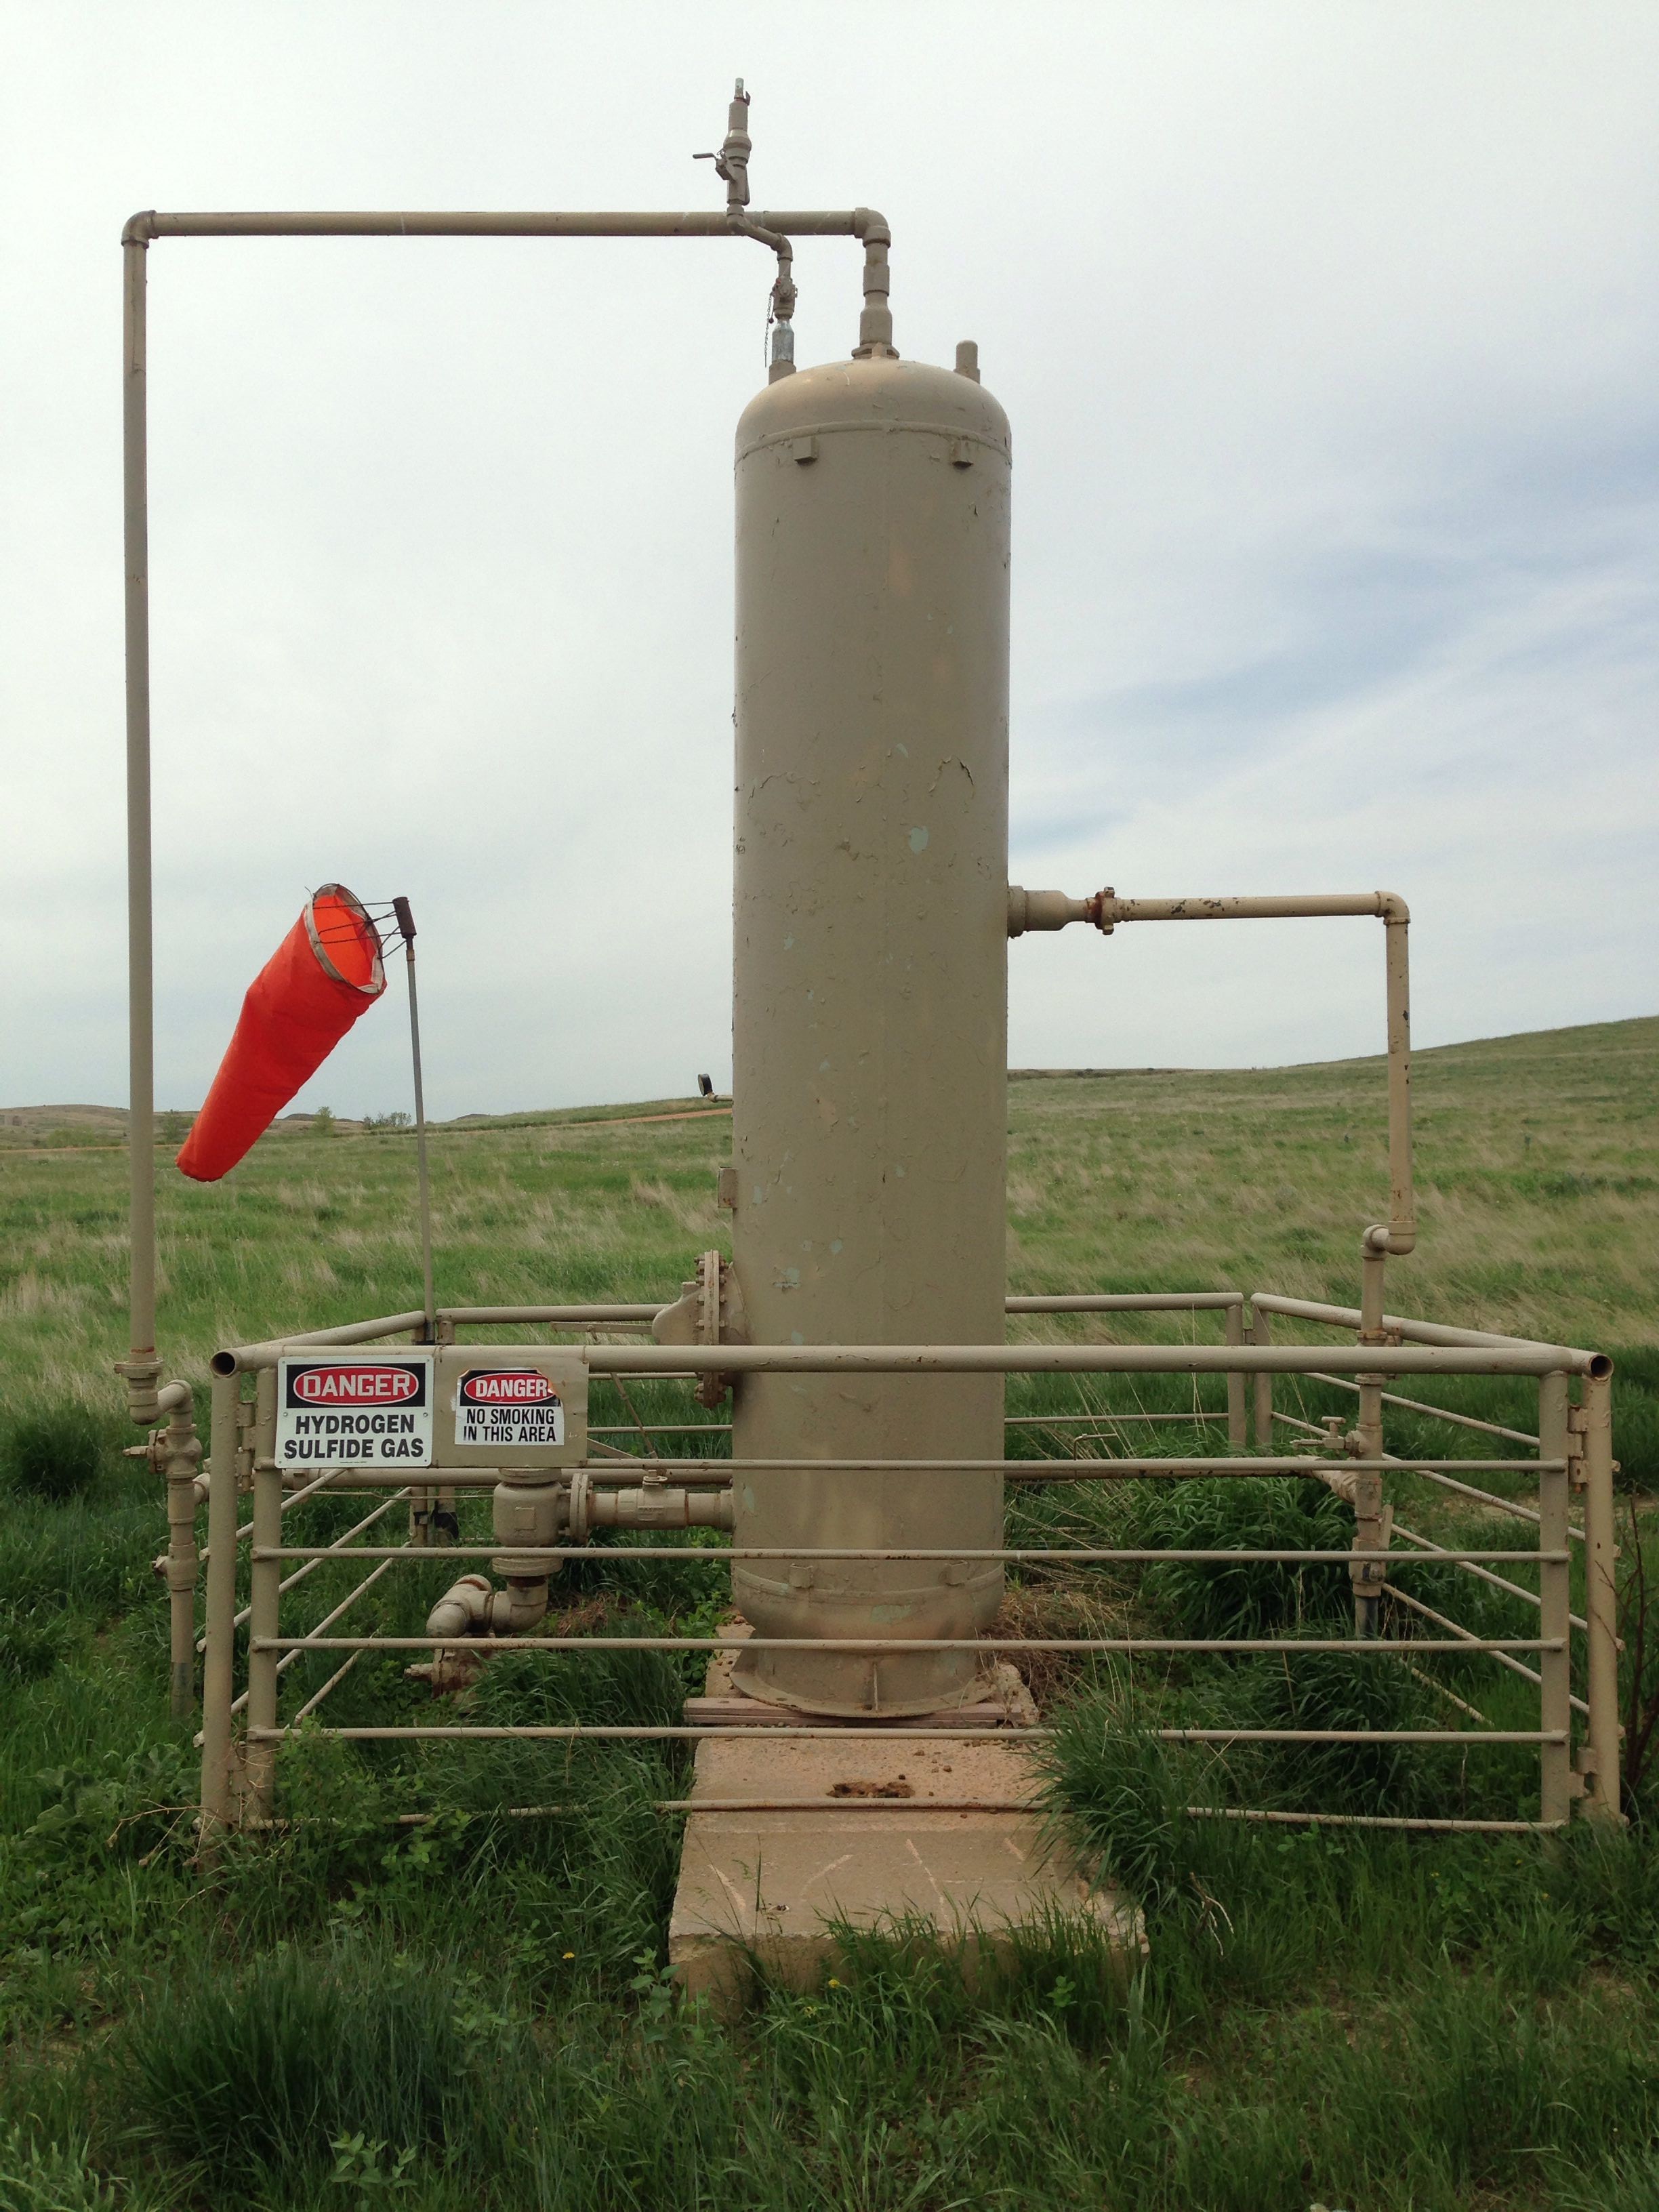
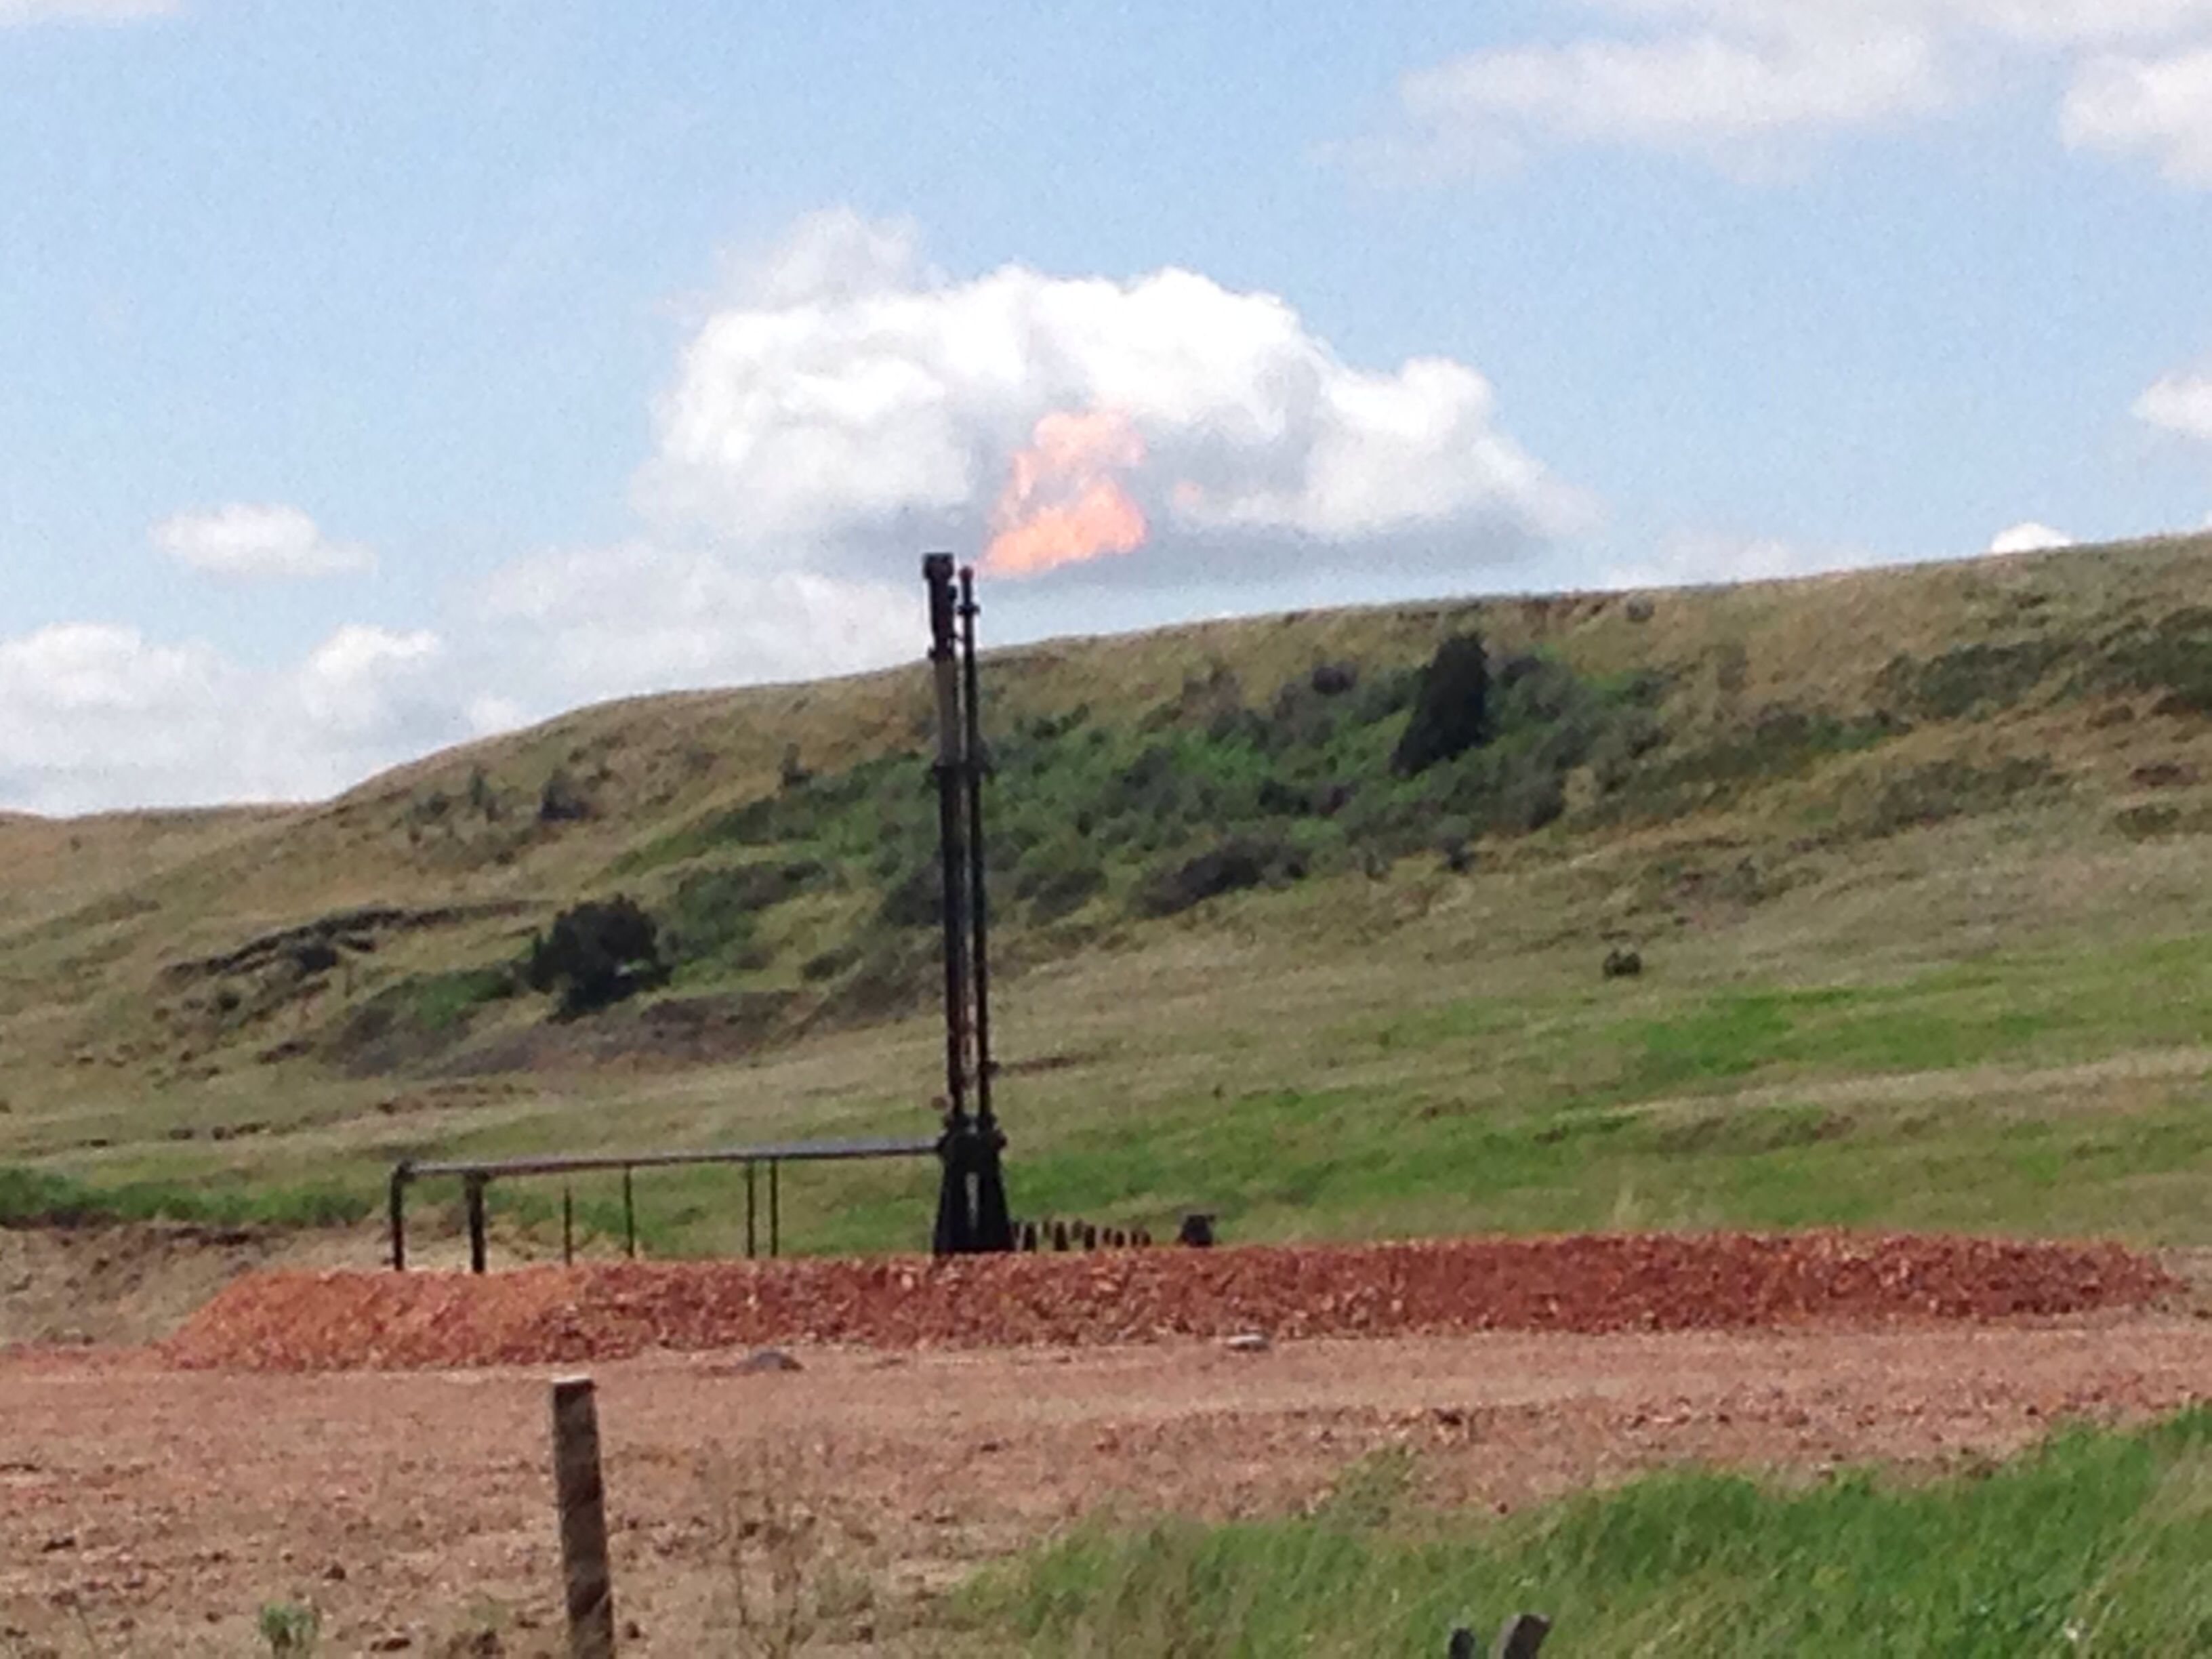
And finally… We spent some time with NPCA collecting photos for that map with our app in ND this spring. Below are just a few, the rest of which can be found in our new ND photo album:
![]()
216 Franklin St, Suite 400, Johnstown, PA 15901
Phone: +1 (717) 303-0403 | info@fractracker.org
FracTracker Alliance is a 501(c)3 non-profit: Tax identification number: 80-0844297