The majority of FracTracker’s posts are generally considered articles. These may include analysis around data, embedded maps, summaries of partner collaborations, highlights of a publication or project, guest posts, etc.
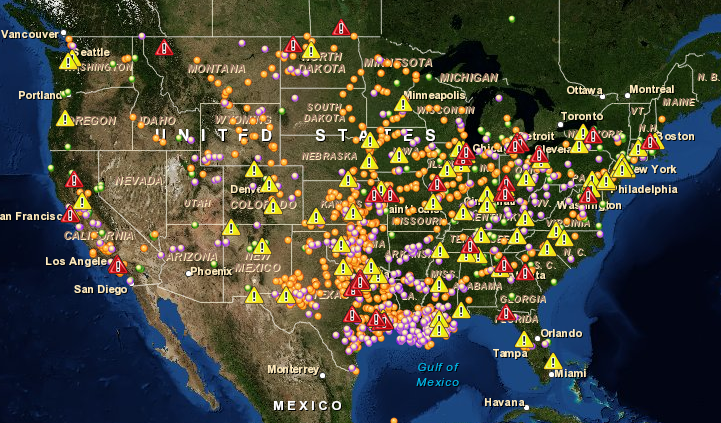
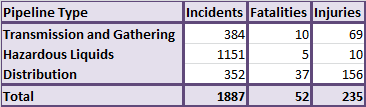
Recently, there has been a lot of attention focused on the Mayflower, Arkansas pipeline failure that resulted in a massive oil spill, particularly as it comes at a time when discussions of the controversial Keystone XL Pipeline project are once again heating up. However, the situation is far from unusual. In fact, according to data downloaded from the Pipeline and Hazardous Materials Safety Administration (PHMSA), there were 1,887 incidents in the nation’s gathering and transmission, distribution, and hazardous liquids pipelines between January 1, 2010 and March 29, 2013, or an average of 1.6 incidents per day.
Pipeline incidents from 1/1/2010 through 3/29/2013. Data Source: PHMSA.
Obviously, not all of these failures are on par with the massive spill in Mayflower, and it should be noted that there are a variety of reasons for these lines to fail. Some of these reasons, such as excavation activity in the vicinity of a pipeline, are not necessarily the fault of the pipeline’s operator. The fact that these incidents are commonplace, however, is not one that can be dismissed.
Pipeline incidents in the United States from 1/1/2010 through 3/29/2013. Source: PHMSA. Red Triangles represent incidents leading to fatalities, and yellow triangles represent those leading to injuries. To access the legend and other controls, click the “Fullscreen” icon at the top-right corner of the map.
It is clear from the map that there a few data entry errors, as a few of the data points draw in locations that aren’t even in the jurisdiction of the United States. However, each entry also contains a city and state that the incident is associated with, and for the most part, the data seem to be fairly reliable.
https://www.fractracker.org/a5ej20sjfwe/wp-content/uploads/2013/04/pipeline_incidents.png502721Matt Kelso, BAhttps://www.fractracker.org/a5ej20sjfwe/wp-content/uploads/2025/09/2025-Wordmark-Logo.pngMatt Kelso, BA2013-04-15 08:38:052020-07-21 10:40:57US Pipelines Incidents Are a Daily Occurrence
Love him or hate him, there’s no arguing that Stephen Colbert can grab a headline. Recently he’s had a lot to say about environmental protection, energy and water. Last week he reported on the Pegasus Pipeline Spill in Arkansas and reminded us that what’s “out of sight” and “out of mind” might still be in our drinking water. Those of us in Pennsylvania familiar with Talisman Terry have yet to forget his exposé on the children’s coloring book that attempts to teach kids about hydraulic fracturing through the expertise of a friendly Frackasaurus. This leaves me wondering if Colbert might ask Congressman Matt Cartwright about his legislative attempts to apply stricter federal protections to oil and gas development when the Pennsylvania Congressman appears on Stephen’s “Better Know a District” segment in early May.
In March 2013, Congressman Cartwright (PA-17) introduced the “Focused Reduction of Effluence and Stormwater runoff through Hydrofracking Environmental Regulation Act” or FRESHER act. Because of expanding development of oil and gas wells in Pennsylvania and exploration, construction, and operations in almost 30 other states, Mr. Cartwright introduced legislation aimed at fixing a federal Clean Water Act loophole to control stormwater runoff from for oil and gas operations. Under the Clean Water Act, industrial facilities are required to obtain a permit to discharge stormwater from their sites and develop “Stormwater Pollution Prevention Plans” if disturbing more than one acre of land. However, Congress exempted oil and gas operations from both of these requirements. By closing the loophole, the FRESHER Act would provide for stronger oversight as both regulators and the public would be aware of industry plans to control pollution. The bill would also require a federal study of stormwater impacts in areas that might be contaminated by stormwater runoff pollution from oil and gas operations.
Chesapeake Bay Watershed
Many of us working in the Chesapeake Bay watershed are often asked about the impacts that increasing natural gas activity may have on our local waters and the larger Chesapeake Bay cleanup. Considering the ongoing challenges we have with sediment impacts to our local waterways in Pennsylvania and West Virginia and the pollution limits we now have in place to bring the Bay back to health, many are asking how we quantify these impacts. In addition to increased sediment pollution largely carried by stormwater runoff, others are also asking what impact a change in our land use might have as we convert farm fields and forests to well pads. Furthermore, many are asking about roads and pipelines and cumulative impacts. All good questions – and these are just related to natural gas development and its relationship to existing pollution limits and cleanup plans. There are a host of additional questions being asked about drinking water, emissions, groundwater contamination, methane migration, and health and safety.
To get an idea of the impacts of the oil and gas industry in the Chesapeake Bay watershed, we turned to our colleagues at the FracTracker Alliance. FracTracker is committed to working with partners – citizens, organizations, and institutions – in a quest for objective, helpful information to perpetuate awareness and support actions that protect public health, the environment, and socioeconomic well-being. FracTracker collects, interprets and shares data through a website and mapping tool. When it came time to understand impacts, we asked for and received some numbers.
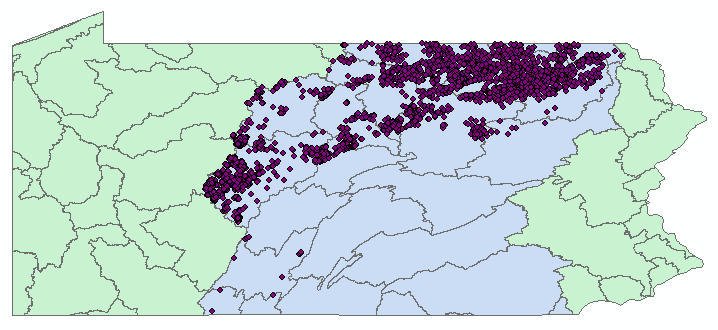
In the portion of Pennsylvania that has waterways draining to the Chesapeake Bay, there have been 5,137 oil and gas wells drilled since 2005*. This number includes both conventional and unconventional wells and vertical and horizontal wells (see map on right). Pennsylvania defines an “unconventional well” as one that is drilled into an unconventional formation, which is defined as a geologic shale formation between the base of the Elk Sandstone or its geologic equivalent where natural gas generally cannot be produced except by horizontal or vertical well bores stimulated by hydraulic fracturing. In short, the definition does include wells drilled within the Marcellus Shale formation. We are continuing to work with FracTracker to obtain similar information on West Virginia.
In Practice
I don’t want to leave the impression that oil and gas development, specifically gas development because of hydraulic fracturing, is an unregulated industry. For example, Pennsylvania already requires erosion & sediment permits for activities involving earth disturbance activities over five acres. I’m also not attempting to get into the patchwork of state-by-state regulations of the oil and gas industry, but Congressman Cartwright’s legislation would ensure that oil and gas companies have stormwater-related permits and pollution prevention plans in place prior to well pad development. The lack of oversight and permitting represents a significant threat to our waterways in places without adequate accountability mechanisms. It’s a fresh opportunity to address an ongoing challenge. We hope Mr. Colbert might just ask Mr. Cartwright about his efforts as we get to know PA’s 17th district. We think he might just say the FRESHER Act is good for his Congressional district and the region.
Jenny Lisak, co-director of the Pennsylvania Alliance for Clean Water and Air, maintains a list of people claiming to be harmed by hydraulic fracturing or related processes, called the List of the Harmed. This version of the list, last updated on February 23, 2013, has 822 people thought to be negatively impacted by the industry, with symptoms ranging from headaches and rashes to death.
The List of the Harmed is maintained by the Pennsylvania Alliance for Clean Water and Air. For full access to map controls, click the “Fullscreen” icon at the top right corner of the map.
The FracTracker Alliance was not involved in the creation or maintenance of this list, but our intern Stephen Paddock did map the incidents to the best available level of accuracy, whether that was at the municipal, county, or state level. Please do not assume that the locations on the map are any more accurate than the level indicated in the “Accuracy” column.
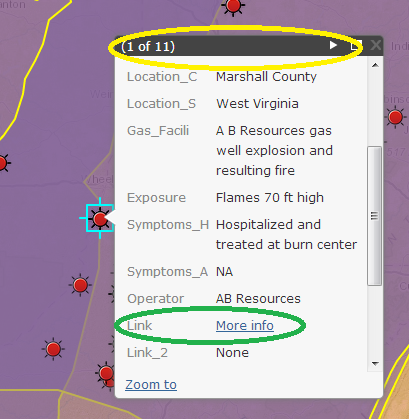
Popup box containing the data for one of the 878 entries on the List. The yellow oval shows that there are multiple boxes stacked on top of each other, and the green oval provides a hyperlink to more information about the incident in question.
Each entry on the List of the Harmed has at least one link to more information about the given incident. To access those, click on any map icon to bring up the popup box. Then scroll down to the “Link” section, and click on “More info”. If there are multiple sources, they will appear under “Link_2” or “Link_3”.
In the picture above, the text “(1 of 11)” in the yellow oval tells us that there are eleven popup boxes stacked on top on one another. To sort through the records, simply click the arrow button toward the right edge of the yellow oval.
https://www.fractracker.org/a5ej20sjfwe/wp-content/uploads/2013/03/harmed-2.png419409Matt Kelso, BAhttps://www.fractracker.org/a5ej20sjfwe/wp-content/uploads/2025/09/2025-Wordmark-Logo.pngMatt Kelso, BA2013-03-07 13:29:342020-07-21 10:40:56PACWA’s List of the Harmed Now Mapped by FracTracker
The Pennsylvania Department of Environmental Protection (DEP) recently published its biannual reports for production and waste from unconventional wells throughout the state for the last half of 2012. FracTracker has learned the hard way not to be too eager in analyzing this data. In the previous cycle, this data was released without the contribution several operators, one of which happened to be the biggest player in the state, Chesapeake Appalachia. That incident prompted the inclusion of a data disclaimer from DEP, which includes the following text:
The Oil and Gas Act reporting is a self-reporting system, meaning that data is reported from producers to DEP as required by law. All production data is posted as it was received from the unconventional well operators. DEP does not independently verify the data before it is posted.
While the Oil and Gas Act requires accurate and on-time data reporting by producers, and the producers and DEP endeavor to correct any errors discovered after the data is posted, DEP makes no claims, promises or guarantees regarding the accuracy, completeness or timeliness of the operators’ data that DEP is required to post.
While considering content regarding production and waste in Pennsylvania, it is worth noting that the DEP considers the data to belong to the various operators. All data for this post was downloaded on February 25, 2013, and while it seems reasonably complete, it is important to note that there could be operators which have not posted their data to DEP in a timely fashion.
PA Production and Waste From Unconventional Wells: July 2012 to December 2012. Click on any map icon for more information, or click the “Fullscreen” button at the top right of the map to access more toolbars. To access data for individual wells, viewers must zoom in to 1:750,000, or an area equivalent to several counties.
The default map frame includes most of the activity for unconventional oil and gas production and waste from Pennsylvania, but if you zoom out, you can find a landfill in southwestern Idaho that accepted 11 tons of flowback fracturing sand for disposal. Unfortunately, the available data does not give any indication of why an operator might choose to ship waste over 2,000 miles away from its source.
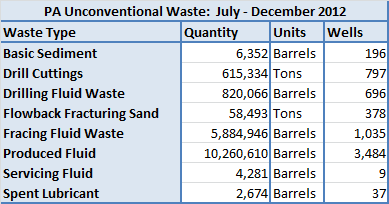
Below are the six month statewide production and waste totals for Pennsylvania’s unconventional wells, including the number of wells that contributed to each total:
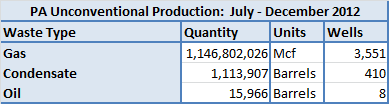
Production from unconventional wells in Pennsylvania from July to December 2012. Mcf represents 1,000 cubic feet, and barrels measure 42 US gallons.
The total gas produced was over 1.1 trillion cubic feet (Tcf) for the six month period, which was over 250 billion cubic feet (Bcf) higher than the previous total of 895 Bcf.
Waste produced by unconventional wells in Pennsylvania from June to December 2012.
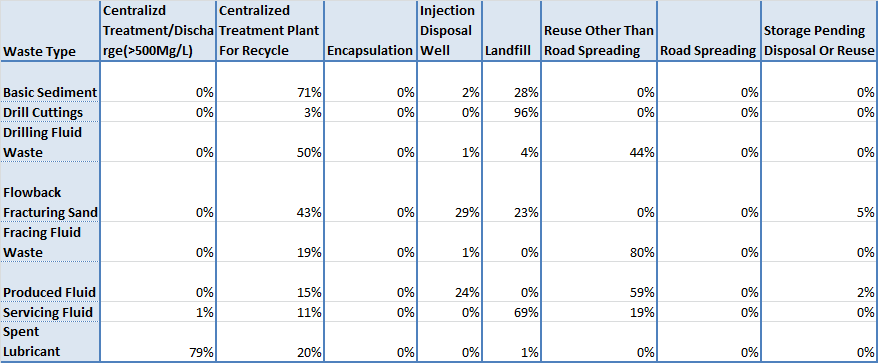
And here is a look at the disposal method for each type of waste, in terms of percentage:
Disposal methods of Pennsylvania unconventional oil and gas waste products, in terms of percentage of the waste type. July – December 2012.
Note that while road spreading rounds down to 0%, 425 barrels of produced fluid were used in this effort.
https://www.fractracker.org/a5ej20sjfwe/wp-content/uploads/2013/03/waste_2012b.png204389Matt Kelso, BAhttps://www.fractracker.org/a5ej20sjfwe/wp-content/uploads/2025/09/2025-Wordmark-Logo.pngMatt Kelso, BA2013-03-01 15:42:032020-07-21 10:40:56Six Months of Production and Waste From PA’s Unconventional Wells
By Ted Auch, PhD – OH Program Coordinator, FracTracker Alliance
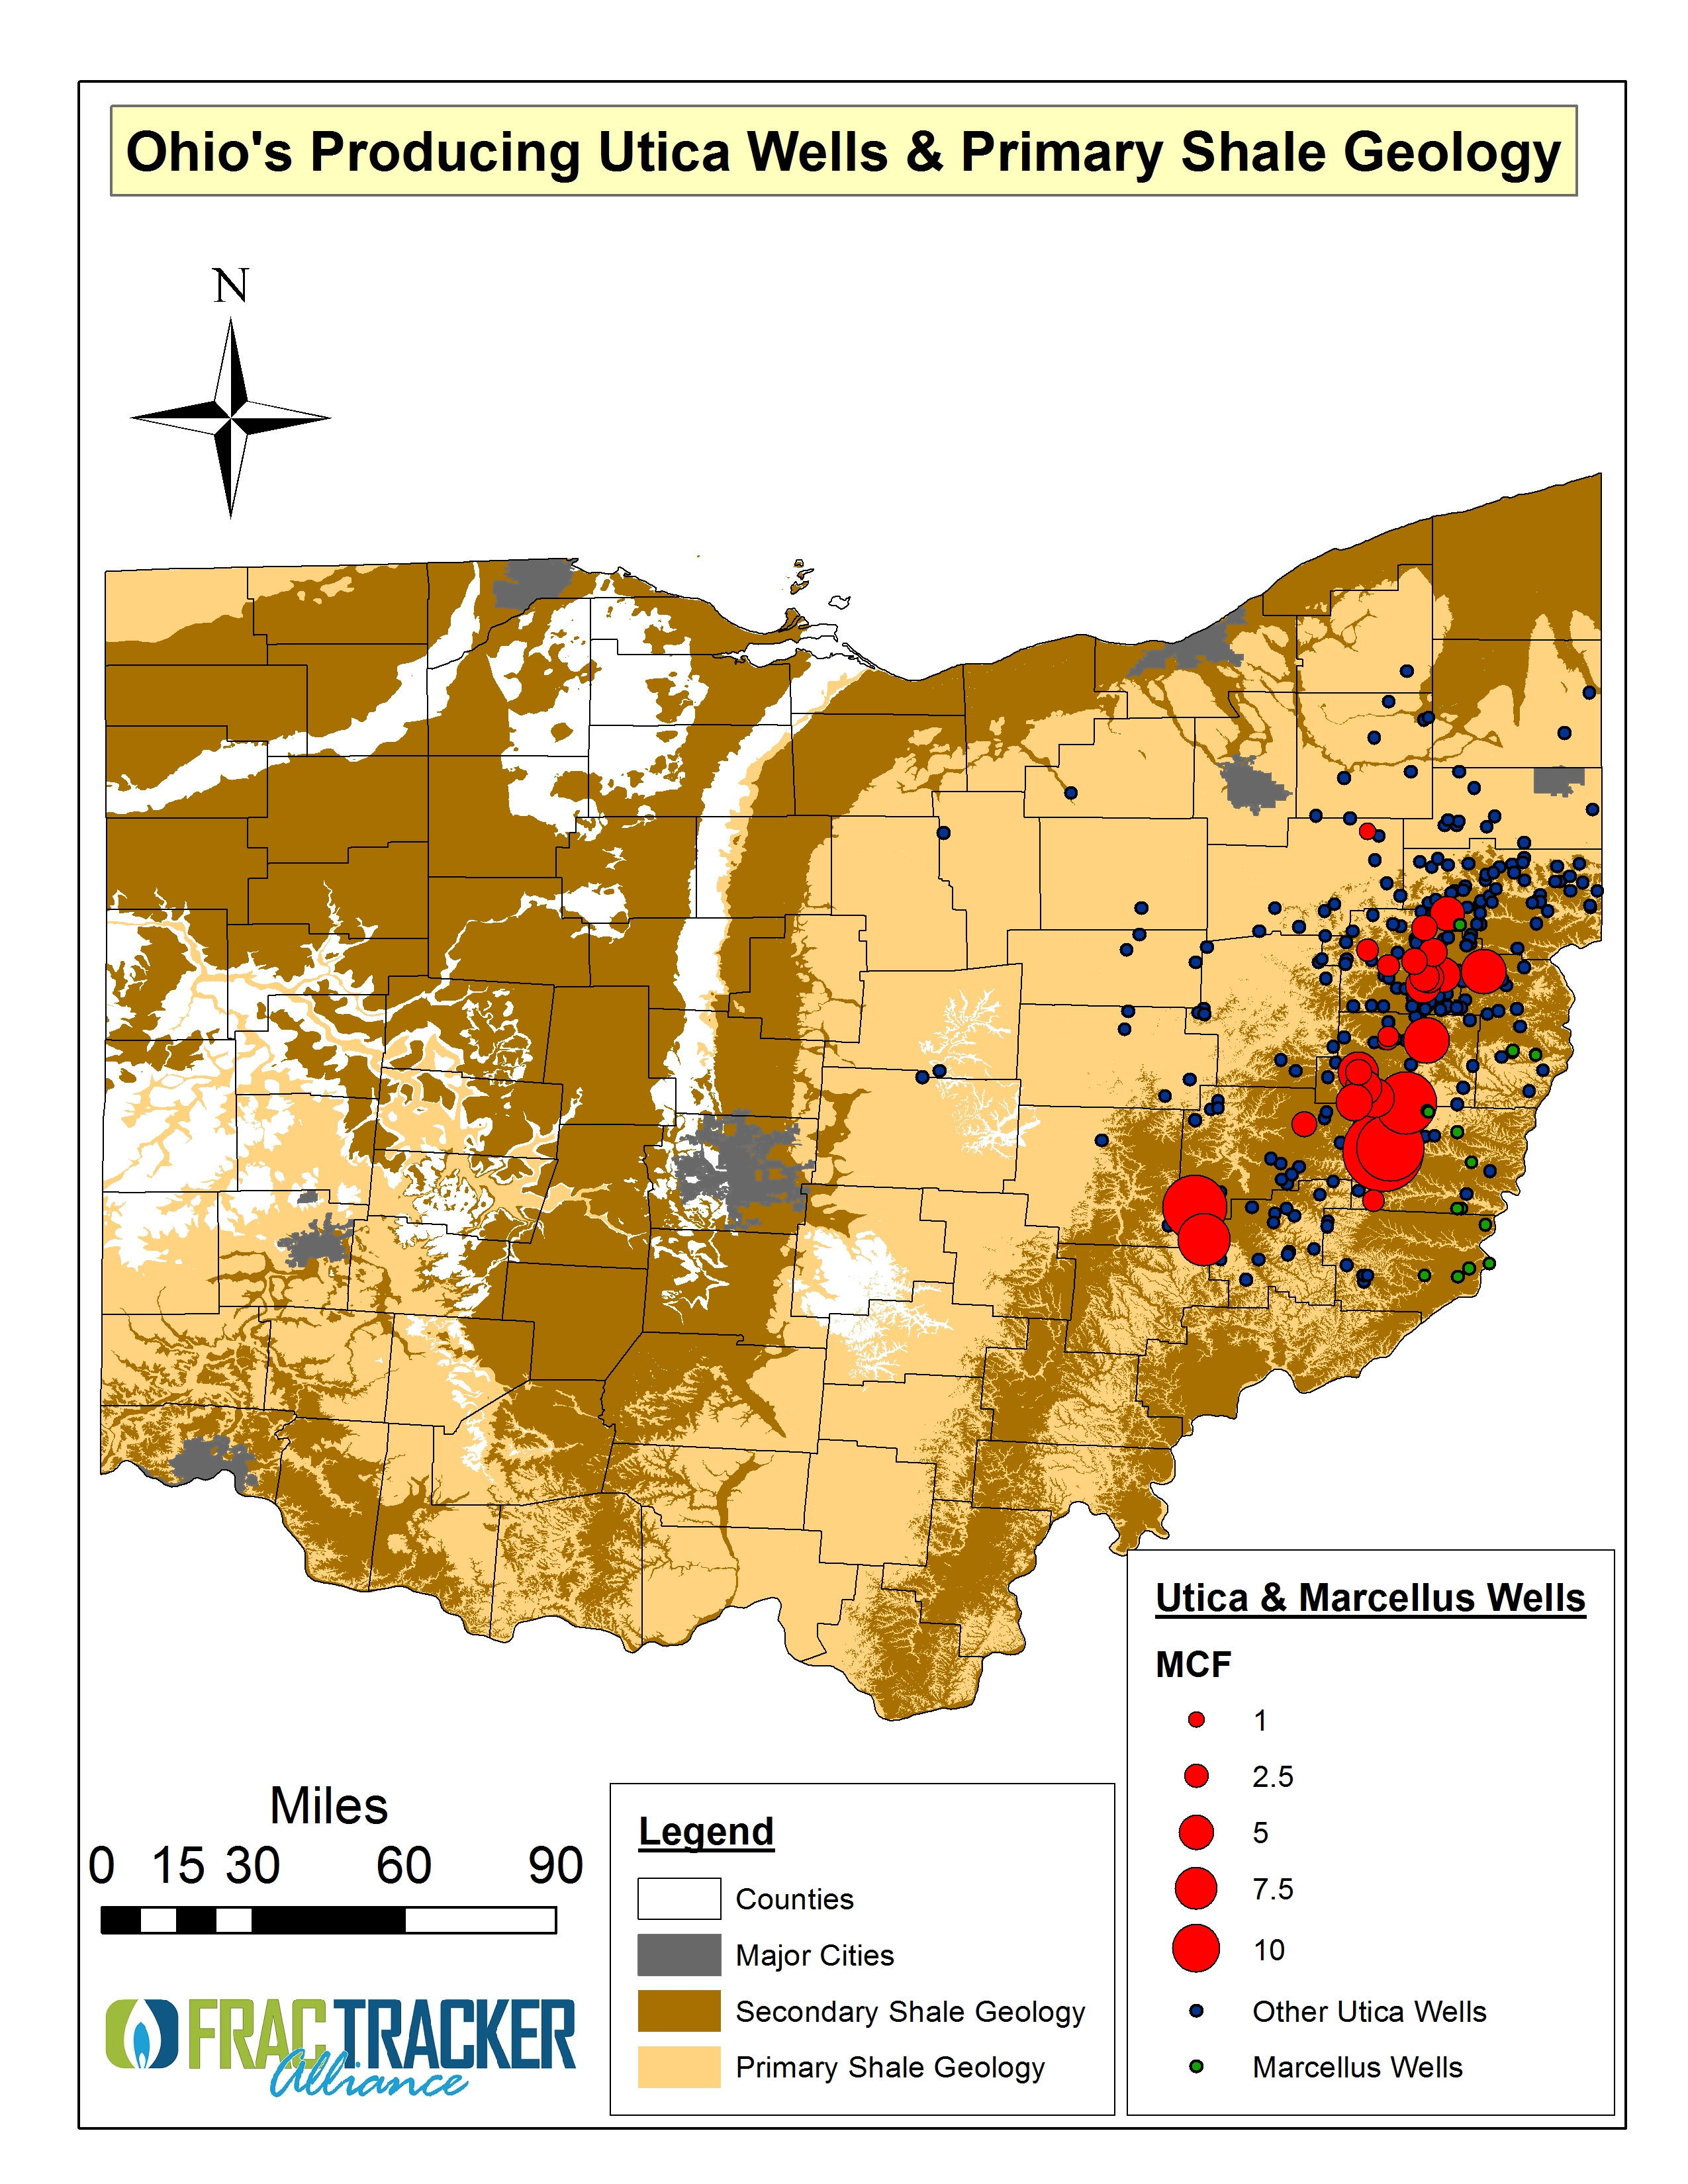
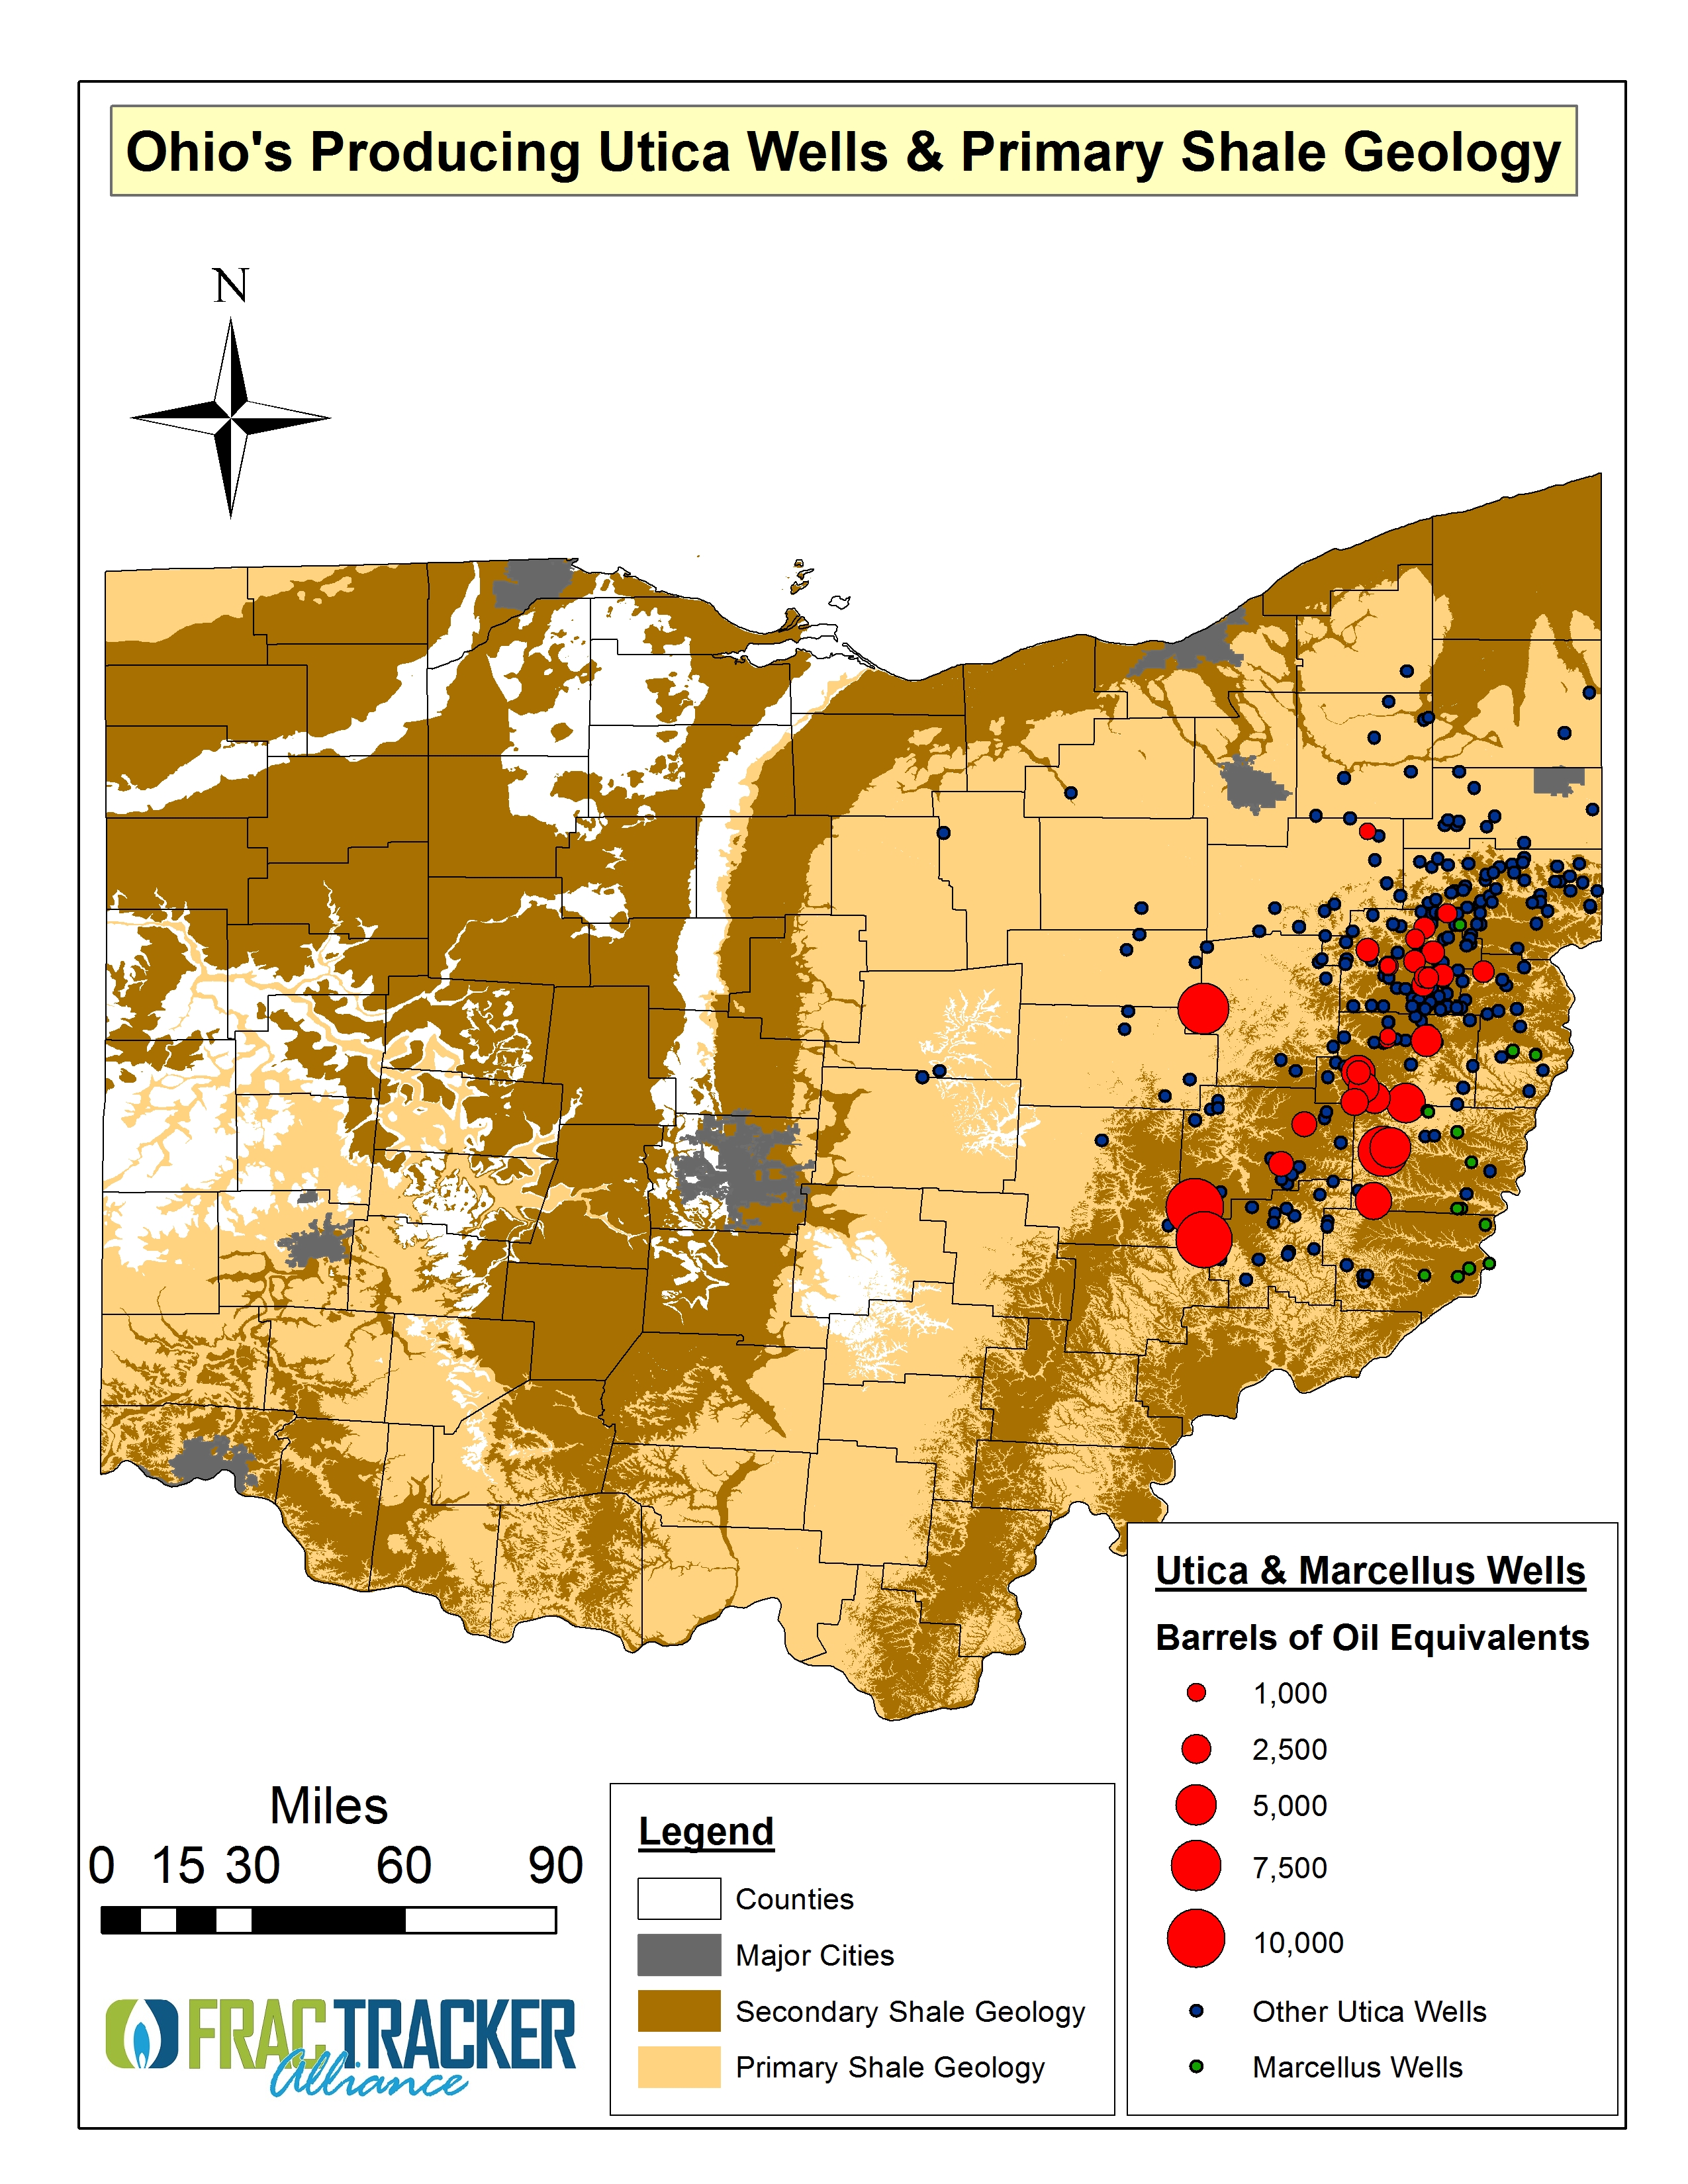
Figure 1. Ohio’s Producing Utica Wells & Primary Shale Geology – plus non-reporting, drilled, or producing Utica & Marcellus Wells. “Million Cubic Feet” (MCF) as measured over industry standard test periods. “Barrels of Oil Equivalents” (BOE) as measured over industry standard test periods.
The economic opportunities provided by Ohio’s Utica Shale play via hydraulic fracturing have been cited repeatedly by the Ohio Oil and Gas Association and industry think-tanks like IHS Inc [1]. Numbers published by the latter last October [2] predicted 143,000 Ohio jobs and $18 billion in state revenue by 2020. However, these projections are accompanied by substantial amounts of error. Given that the state’s Utica Shale well movement is now more than 500 wells permitted strong, we thought it was time to take a closer look at the demographics and economics of the Utica Play, given that there will be a strong geographic component being inserted into the “To Drill Or Not To Drill” and waste disposal debate here in Ohio. This is an especially important issue given that the state is wrestling with either implementing an ad valorem[3] tax or raising the state’s industry-low severance taxes, which currently stands at 0.5-0.8% but would be raised to 1% under the governor’s budget. In contrast, proposals from Policy Matters Ohio and northeast Ohio Democrats seek 5% – 7%, respectively.
In comparison to most other states producing oil and gas, even 5% may be a trivial amount, or what The Cleveland Plain Dealer called “indefensibly low.” It amounts to 97 cents per Ohioan (i.e., $275 mi2) [4]. According to an Ernst & Young analysis of eight states that produce dry gas and natural gas liquids and/or dry gas and oil…
Ohio currently imposes the lowest combined state and local taxes of the states included in the analysis.
…Ohio’s overall effective tax rate (measured as total taxes divided by sales) is 80% below the average rate for the other 7 states for a well producing dry natural gas and natural gas liquids.
For a well producing dry natural gas and oil, Ohio’s effective tax rate is 65% below the other-state average…
With the [proposed] increase, Ohio’s effective severance tax rate (ETR) would be 16% lower than the other states’ average for the well producing dry natural gas liquids and 4% lower than the other states’ average for the well producing dry natural gas and oil.
The governor’s proposed “Severance Tax Changes” will not apply to any Marcellus Shale wells, even though the state is home to five producing Marcellus wells (two in Monroe County) and eight permitted wells across Belmont and Monroe Counties. Additionally, the governor and his staff included a severance tax exemption for all “small-volume gas wells” (gas wells with average daily production of under 10 million cubic feet [MCF] would be exempt from the tax). If early industry production reports – and the Ohio Business Roundtable requested Ernst & Young report – are any indication, only 19% of wells will be subject to this tax. Our own analysis revealed that of the 32 industry reported production wells, the average production value is 7.5 MCF (Figure 1).The Kasich administration admitted the exemptions would apply to – by their estimation – 45,000 gas wells.
Another nuance of the Kasich administration’s severance tax complicated mélange is that rates will be 1% for natural gas and 4% for oil, natural gas liquids, and condensate. However, according to the administration:
… there will be a lower tax rate of 1.5 percent for the first year of production, in order to allow producers to recover the cost of preparing the well site and drilling the well.
Coincidentally, “the first year of production” is generally the time of greatest gas yields. Anonymous sources in Ohio’s Utica sweet spot have spoken of 50% declines in royalties within 6 months of production.
The Ohio Oil and Gas Association, the industry’s lobbying arm, has weighed-in against higher severance taxes, stating that:
a 4% severance tax on oil and gas would be equivalent to a 40% income tax and 16 times more than the commercial activities tax (or CAT). It would also burden economically challenged area throughout the state and landowners who want to lease their land and receive royalty streams.
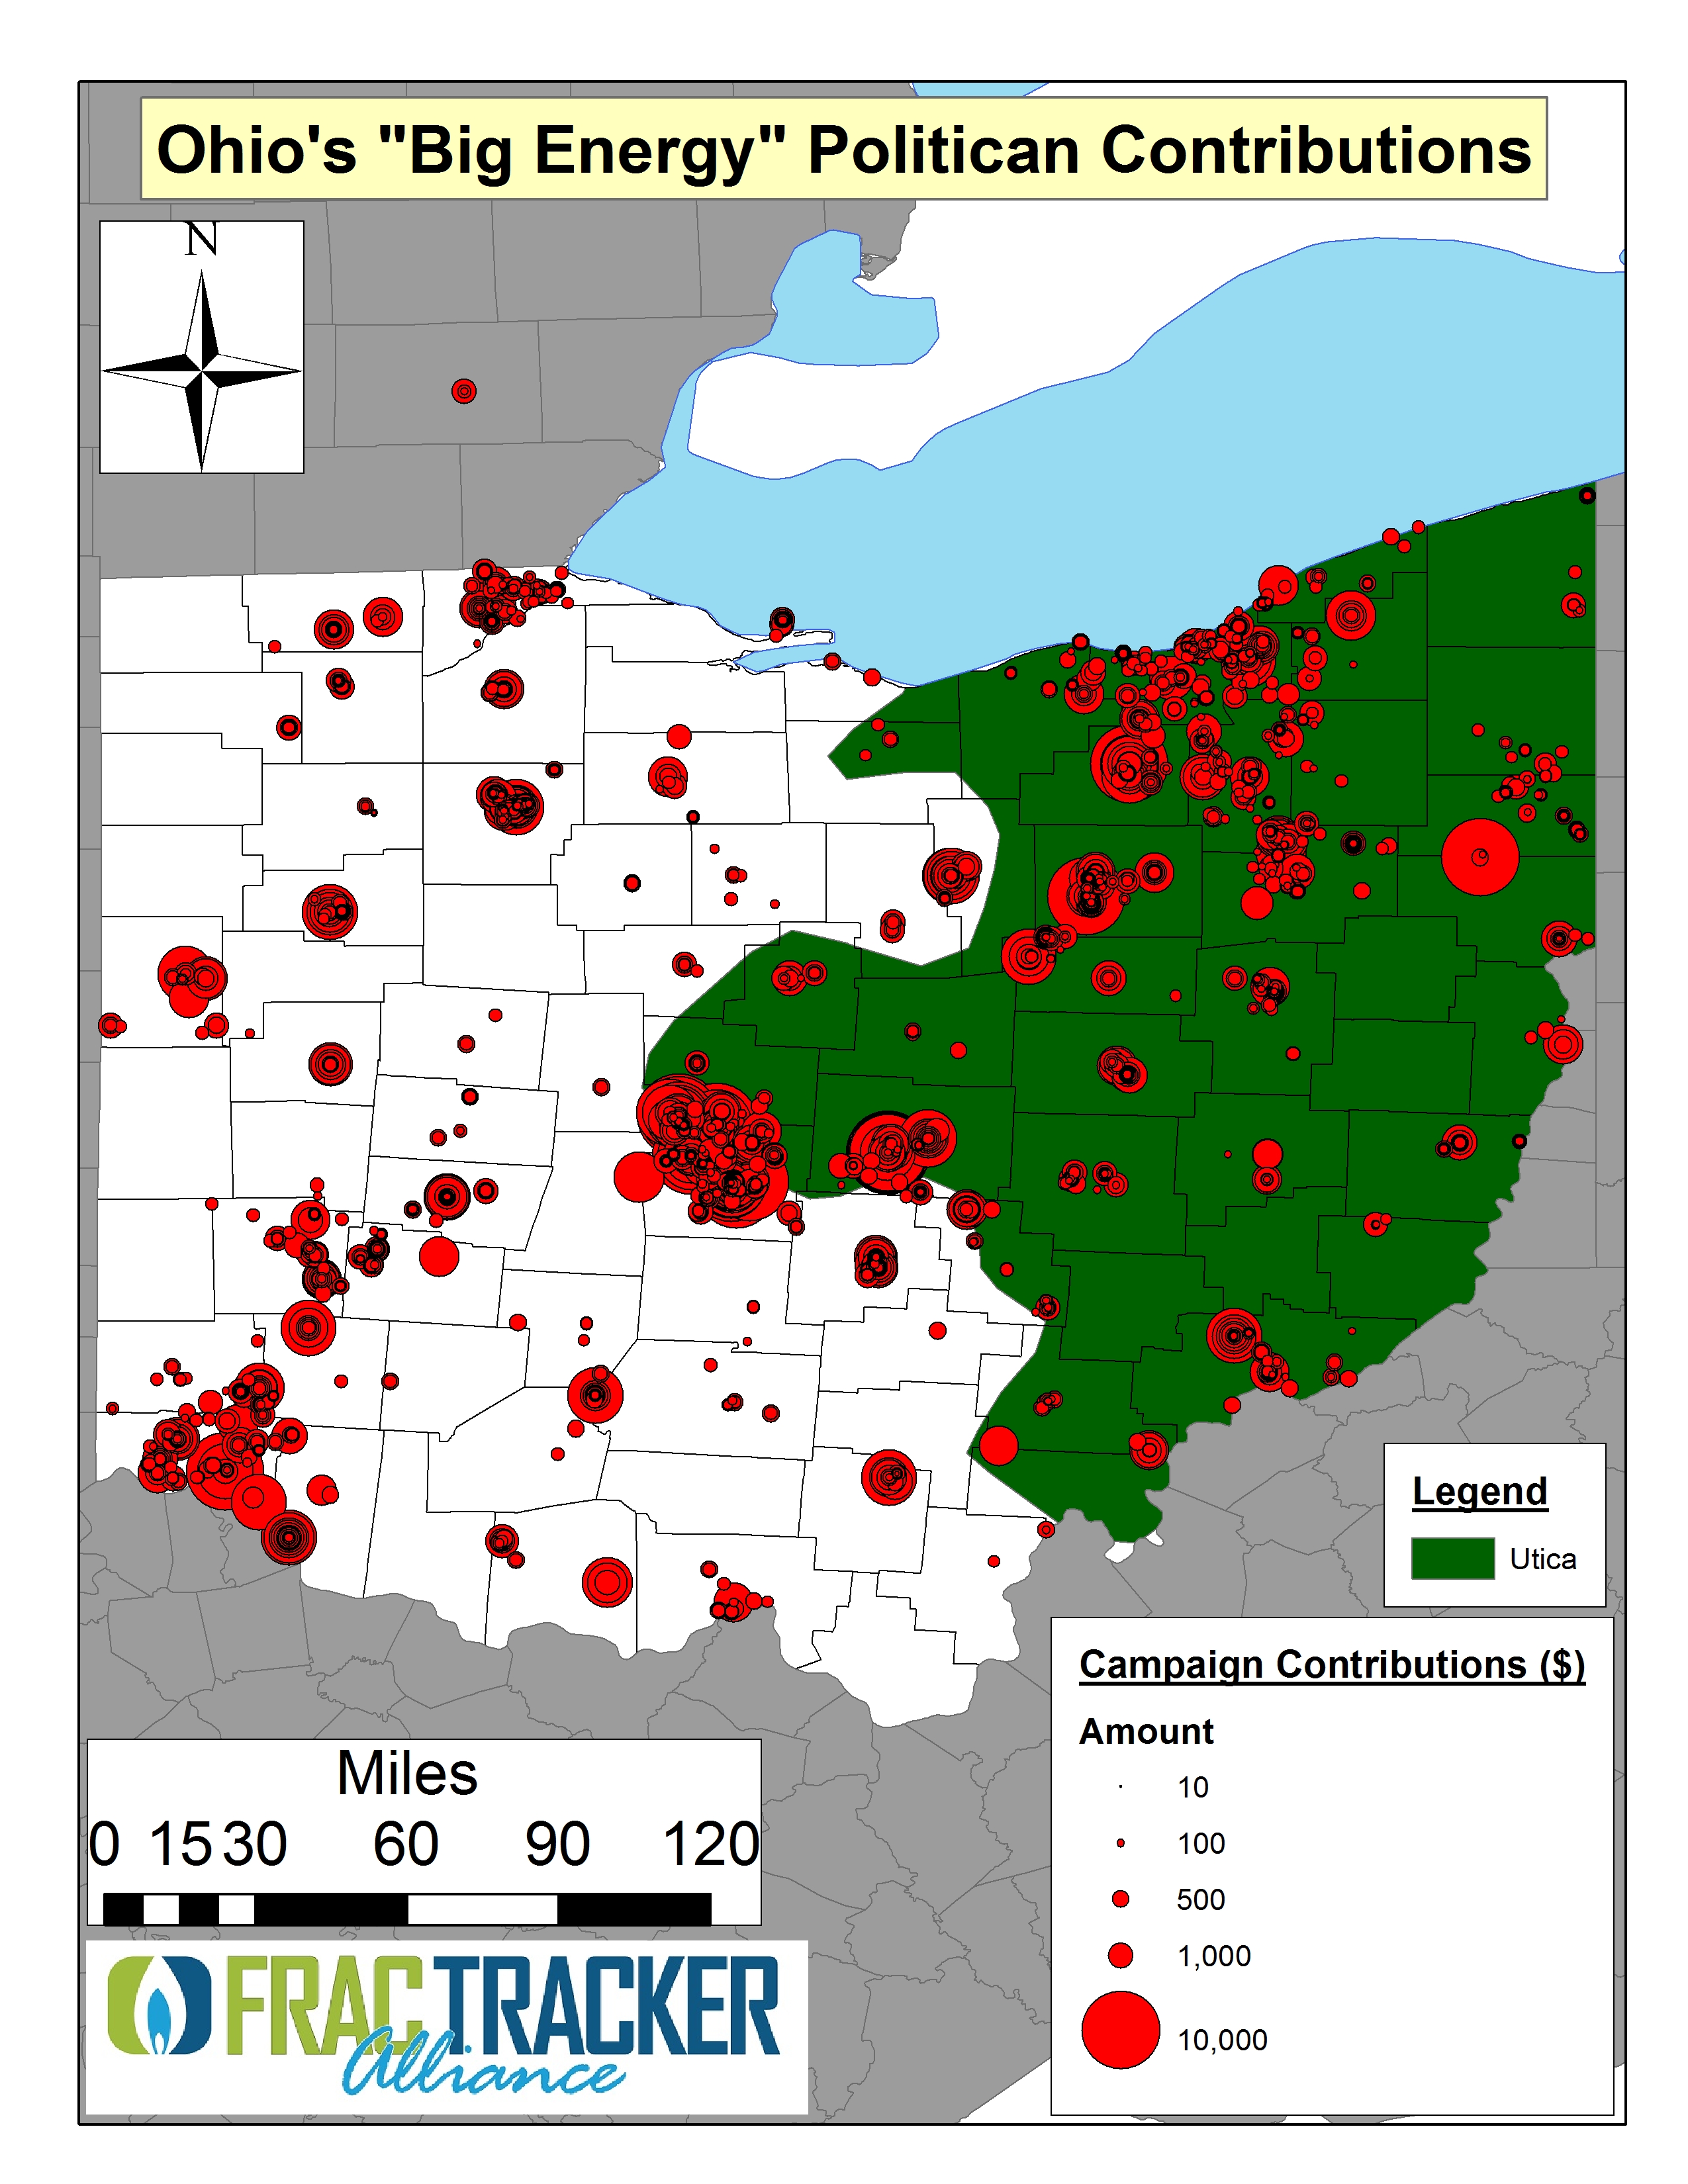
Figure 2. Ohio’s Big Energy individual or Political Action Committee (PAC) political donations from 2001 to 2011. (Total: 4,037 individual donations. Data courtesy of Common Cause Ohio’s Deep Drilling, Deep Pockets spreadsheet.)
The anonymous BizzyBlog took the OOGA position one step further proclaiming that energy companies “won’t do business in a state with a newly-enacted punitive severance tax.”
Whereas an ad valorem tax would be redistributed directly back into the communities from which the hydrocarbons are extracted, a severance tax would be distributed throughout the state, even to communities and counties that prohibit Utica Shale drilling and/or injection activity. Theoretically, the entire state could benefit from the toils and environmental risks taken on by Ohio’s Appalachian region. According to a Quinnipiac pole, Ohioans support (52 to 38%) an increase in drilling-related severance taxes. Bipartisan voter support for a severance tax increases (60 to 32%) when the prospect of offsetting state income taxes is proposed.
Either levy – an ad valorem tax or severance tax – would be based upon the industry’s headline well production, even though USGS research recently spoke to the substantial well-to-well production variability in the Appalachian Shale Basin: 250-600% [5]. There are quite a few short- and long-term costs and benefits associated with exploitation of the Utica Shale; however, as it stands the risk burden is disproportionately being shouldered by Appalachian Ohio. Thus, the severance tax being proposed by the governor and House Democrats could add to the regional schisms evident in the state.
But maybe geography is immaterial. The likely big winner of the tax decisions will be energy companies and, according to data on recent campaign contributions, those politicians they deem worthy of their political donations – many of whom are on the fringes or completely outside the Utica Shale (Figure 2).
[2] This work was funded by the US Chamber of Commerce’s Institute for 21st Century Energy, the American Petroleum Institute, the American Chemistry Council, America’s natural Gas Alliance, and the Natural Gas Supply Association.
[3] Ad valorem taxes are assessed according to the value of the natural gas extracted.
[4] The Kasich “Ohio’s Jobs Budget 2.0: Jobs. Momentum. Transformation” highlights this aspect of their proposed severance tax, explicitly noting that it “has researched the severance tax structures of other states with significant oil and gas production, particularly those states with shale resources, and has found that even with a 4 percent tax rate, the tax burden on the revenues from these horizontal Utica wells will be lower than in other states.”
[5] According to the USGS, production from the most productive wells in the Appalachian Basin’s shale formations is commonly 50 times larger than the poorest producing wells, with the same value being 250-600 times larger for the Marcellus Basin. However, the only numbers presented to individual landowners – but less frequently to collectives given that energy firms are increasingly aware of the legal advice that land aggregators are seeking out – when the subject of royalties comes up are near-term gushers. For example:
GPOR’s “’King’ of Utica Well” the Shugert 1-1H at 4,913 barrels of oil equivalents per day (BOEPD),
CHK’s Buell well in Harrison County, OH producing 1,040 BOE[5],
GPOR’s Boy Scout 1-33H in Wagner, Harrison County producing 3,456 BOE, the Ryser 1-25H producing 2,914, or the Groh 1-12H producing 1,935 BOE,
https://www.fractracker.org/a5ej20sjfwe/wp-content/uploads/2013/02/OHUtica2-25-13.jpg250610Ted Auch, PhDhttps://www.fractracker.org/a5ej20sjfwe/wp-content/uploads/2025/09/2025-Wordmark-Logo.pngTed Auch, PhD2013-02-25 11:48:012020-07-21 10:40:55To Severance Tax or not to Severance Tax, that is the question!
This page was updated in January 2018 to fix the embed code in the map.
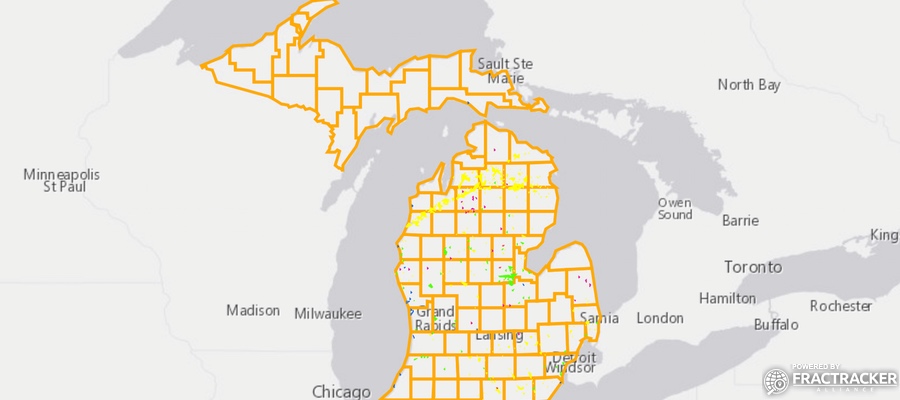
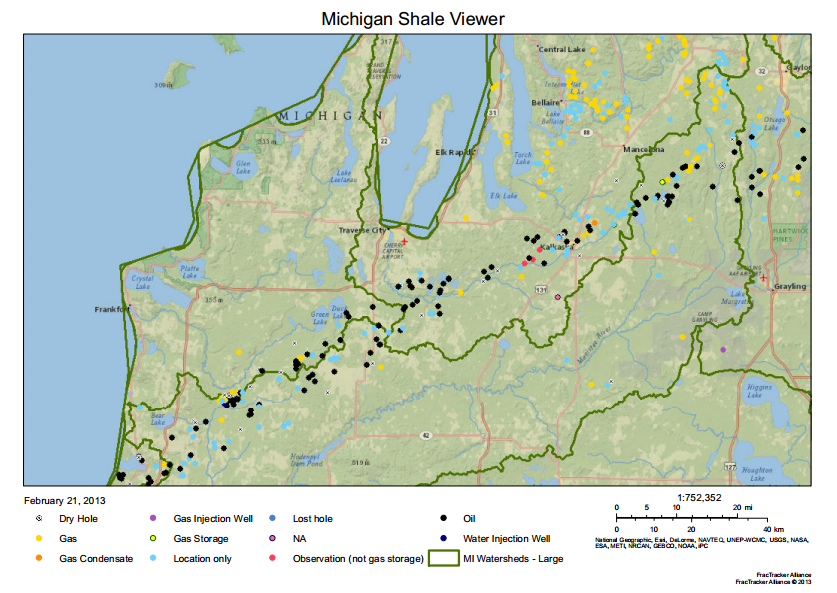
Recently, FracTracker has been getting requests from residents in many locations to map large-scale oil and gas operations in their area. We now have content for Michigan, which happens to correspond with the release of additional map export functionality on FracMapper:
Each state is different in the data it makes available to the public, so it is always interesting to take a look at how new areas approach their duties of data transparency. After having recently produced maps for New Mexico and Colorado, I confess to being excited to work with data from a state that embraces designating locations in latitude and longitude (and doesn’t release data only with the archaic PLSS notation). But then, sometimes mapmakers are easy to please.
Far more important is the data made available for wells related to oil and gas development by the Michigan Department of Environmental Quality. Not only does it include the standard well type designations of “oil” or “gas”, but it also includes observation wells, storage wells, and injection wells. Altogether, there are 15 categories of well types.
As with many states, there are so many legacy oil and gas wells that mapping them all would overwhelm the online mapping software servers with data requests from over 63,000 wells. For that reason, the wells are restricted to those marked as being horizontally drilled, which reduces that number to 1,562. That should include most of the unconventional oil and gas extraction activity from recent years.
Also included in the data are point locations for the tops and bottoms of the well bore, which could be used in the future to map a generalized path of the horizontal wells beneath the surface.
FracMapper Export Feature Enhancement
The Michigan map is the first one produced with our new “Save as PDF” tool, which can be found in the “Export” toolbar.
The “Save as PDF” tool in the the Export Menu creates as landscape oriented 8.5″ x 11″ document, complete with title, scale bar, and legend. The legend contains only those map icons that are displayed in the view of the PDF.
Please note that if you wish to make multiple PDF files from the same map, it is currently required to refresh the webpage containing the map, or it will continue to produce the same map.
In the coming weeks, this functionality will be added to the other FracMapper entries that have already been published. We are also hoping to roll out additional functionality in the near future.
Trout Unlimited (TU) is one of several organizations that are actively monitoring water quality in Pennsylvania’s rivers and streams. Currently, TU is collecting data in 99 different watersheds throughout the Commonwealth in an effort to help understand potential impacts of shale gas drilling and related industries on Pennsylvania’s waterways. Mitchell Blake, TU’s Pennsylvania Marcellus Shale Field Organizer explains:
Trout Unlimited’s Coldwater Conservation Corps (CCC) is a network of volunteer stream stewards who monitor water quality throughout the Commonwealth of Pennsylvania. With over 350 members trained, hailing from almost every Pennsylvania Trout Unlimited chapter, the CCC volunteers focus on achieving early detection of pollution events during oil and gas drilling and production activities and collecting a baseline inventory of data on important coldwater fisheries. Using a scientific tool that focuses on trout populations and forecasted Marcellus development, CCC volunteers strategically choose their monitoring locations within their chapter and report and map their data using Trout Unlimited’s water quality monitoring database. Protection of coldwater fisheries is an integral part of Trout Unlimited’s mission and more than any other segment of society, it is fisherman who spend considerable time on these streams, and thus are well positioned to watch over them.
While the data collection is ongoing, there are several logistical concerns involved with data digitization and distribution before the water quality data can be made available to the general public, but Mr. Blake is hopeful that these issues will be resolved in the coming months.
Watersheds where water quality testing is being conducted by TU volunteers are highlighted in green. For full access to map controls, please click the expanding arrows icon at the top right corner of the map.
At the FracTracker Alliance, we are excited to see TU’s desire to share this data with the public. It may seem like a thankless task to brave the elements to obtain baseline water quality data, but it is important work that everyone can benefit from. And while everyone hopes never to find the proverbial “smoking gun” in terms of streams being negatively impacted by industry, data collection efforts such as these are invaluable resources in identifying potential contamination events, should they occur.
https://www.fractracker.org/a5ej20sjfwe/wp-content/uploads/2025/09/2025-Wordmark-Logo.png00Matt Kelso, BAhttps://www.fractracker.org/a5ej20sjfwe/wp-content/uploads/2025/09/2025-Wordmark-Logo.pngMatt Kelso, BA2013-02-07 15:02:302020-07-21 10:40:41Trout Unlimited Testing for Water Quality in PA’s Marcellus Region
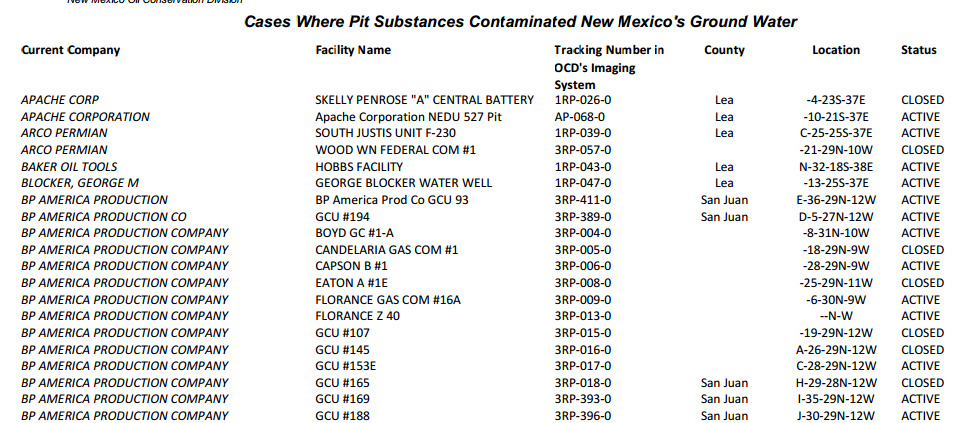
Recently, the FracTracker Alliance has gotten several requests from residents of New Mexico for maps showing the large scale drilling operations in that state. As we began to look around for data sources, we encountered an interesting document from 2008:
This 2008 document from the New Mexico Oil Conservation Division shows instances of ground water contamination by oil and gas pits in the state.
There isn’t much description on the document or the New Mexcio Oil Conservation Division (NMOCD) page that links to it, however, the subject matter is straightforward enough. Altogether, there are 369 instances of ground water contamination documented by a New Mexico governmental agency from dozens of drilling operators throughout the Land of Enchantment.
Ground Water Contamination Controversy
Since the title of document indicates that the agents causing contamination are “pit substances”, this does not technically indicate that hydraulic fracturing is to blame. This is largely a matter of definition, but it is an important one to understand, because the word “fracking” means something different to industry insiders than it does to the general public, and the issue of ground water contamination is a point of considerable debate.
Technically speaking, hydraulic fracturing only refers to one stage of the well completion process, in which water, sand, and chemicals are injected into the oil or gas well, and pressurized to break up the carbon-rich rock formation to allow the desired product to flow better.Most people (and many media outlets) consider “fracking” to be the entire production process for wells that require such treatment, from the development of the several acre well pad, through the drilling, the completion, flaring, waste disposal, and integration of the product to pipelines. (It is due to these competing definitions that the FracTracker Alliance goes out of our way to avoid the term “fracking”.)
All of this has lead to some carefully worded statements that seem to exhonerate hydraulic fracturing, despite suspected contamination events reported in Pennsylvania, Wyoming, and elsewhere. Of course, from the perspective of residents relying on a contaminated aquifer, it hardly matters whether the water was contaminated by hydraulic fracturing, leeching from the associated pits, problems with well casing or cement, or re-pressurized abandoned wells. A fouled aquifer is a fouled aquifer.
This document does not specify what was contained in the pits, only that they are contamination events. Therefore, we do not know what stage of the process the contaminant came from, only that it was believed by the state of New Mexico to have originated from a pit, and not the well bore itself.
Notes About Location Information
It is important to note that the location information is not exact, but are generally within 0.72 miles of the specified location. The reason for this is that the location information was provided using the Public Land Survey System (PLSS). The brainchild of Thomas Jefferson, the PLSS was the method used to grid out the western frontier, and it is still used as a legal land description in many western states. Essentially, the land was divided into townships that were six miles by six miles, which was then broken into 36 sections, each of which is one square mile. FracTracker has calculated the centroid of each section, which could be up to 0.71 miles from the corner of the same section if the shape is perfectly square.
The PLSS system was used to grid out most of New Mexico, but some portions of the state had already been well defined by Spanish and Mexcian land grants. Aside from being a fascinating historical anecdote, it does have an effect on the mapping of these pits. In the image of the table above, note that the “Florance Z 40” well does not have any values in the location column. As a result, we were not able to map this pit. Altogether, 11 of the 369 pits identified as causing groundwater contamination could not be mapped.
New Mexico Shale Viewer. You can zoom and click on map icons in this window for more information. For full access to map controls, including layer descriptions, please click the expanding arrows icon in the top right portion of the map.
Ohio’s first Utica well was permitted by ODNR on behalf of Hess Ohio Resources on 9-28-10. As shown in Figure 1 (right), the major uptick in well permitting began in the summer of 2011 with 23 wells permitted during that period, ramping up to 24 wells in November 2011. There was a brief reduction in permitting during the winter of 2011-12, followed by the boom-boom summer and fall of 2012, with an average of 37 wells per month and a total of 261 wells permitted between June and December 2012.
Production
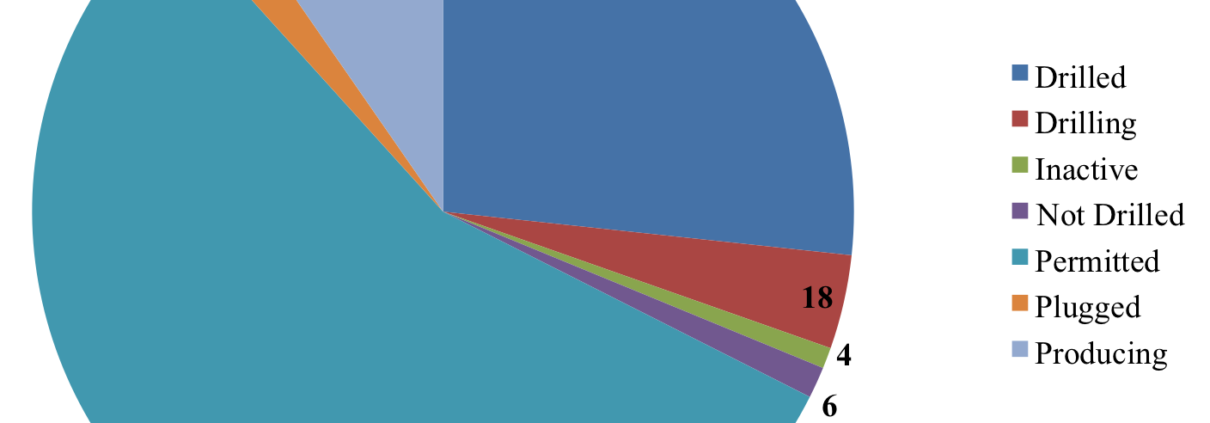
As of the end of 2012, only 30.4% of the 487 permitted wells had been drilled or are currently being drilled. Forty-seven are currently producing gas, with the Ohio Department of Natural Resources (ODNR) reporting production data for only 9 of the 47 producing wells. All of these wells are owned by Chesapeake, 2/3 of which are in Carroll County. On average, these wells produced 61 barrels of oil, 1,875 million cubic feet of gas, and 8,905 gallons (i.e. 37 tons) of brine per day over an average production period of 88 days. Twenty of the permitted wells are classified as inactive (not drilled) or plugged, with the remaining permitted but yet to be drilled (Figure 2). The top five Utica counties based on number of well permits are Carroll, Harrison, Columbiana[1], Jefferson, and Guernsey [2]; while on the other end, Ashland, Geauga, Medina, and Wayne are each home to one Utica well at this point (Figure 3). According to Columbus, OH-based Huntington Bank’s first Midwest Economic Index, early returns in these parts are mixed in Ohio: “58 percent of respondents agreed that the industry would bring opportunity, with 15 percent of those saying it would be a significant opportunity, while 42 percent said they did not see it bringing economic opportunity to their communities.”
Bird’s Eye View
From an area perspective, Carroll County has 0.45 wells per square mile – 0.39 more wells per square mile than the next ten counties with the most wells (Figure 4) – while the bottom four counties currently contain 0.0023 wells per square mile. The relationship between population and wells is generally the opposite of the previous two relationships with the bottom four counties having an average of 108,345 citizens for every well drilled. Carroll County has 163 residents per well, while the remaining top ten counties have an average resident-to-well ratio of 7,057 (Figure 4, Inset). This means that any potential ad valorem-based tax structure would benefit – on a per capita basis – less populated counties rather than those with more wells such as Carroll.
Companies Involved
Chesapeake and its subsidiaries is the dominant player in the Ohio Utica play, with 320 of all wells permitted, followed by Gulfport Energy with 25, Enervest and HG Energy with 16, and Hess Ohio with 14 permitted wells. These five firms account for 80.3% of all permitted wells in Ohio, with an additional eighteen firms splitting the remaining 19.7% (Table 1, below). However, the firms that are publicly traded have been experiencing an average decline in share price of 3.41% since the time their first wells were permitted to the close of business on January 22nd, 2013. The biggest financial losers have been some of the Ohio Utica play’s biggest participants – including Chesapeake (CHK, -27%), Consol Energy (CNX, -29%), and Devon (DVN, -17%) [3]. Meanwhile, Anadarko (APC, +14%), Gulfport (GPOR, +19%)), and the upstart PDC Energy (PDCE, +55%) are the biggest beneficiaries of wading into Ohio’s Utica Shale play. However, the industry is displaying quite a few characteristics of an unsustainable boom; Wall Street analysts have been skeptical of big Utica Shale energy operations from soup to nuts as reported by Reuters last fall. but Wall Street voted in favor of the removal – either voluntary or forced – of CHK’s founder Aubrey McLendon to the tune of a 10% share spike the day of the announcement. Even the aforementioned winners have been outperformed by the S&P 500 and Dow Jones Industrial by 12.6% since permitting began in September 2010.
Will the boom continue to boom? It may be too soon to tell, but one thing is for sure, shale gas extraction to-date has made an indelible mark on many communities in eastern Ohio.
Figure 1. Ohio Utica Well Development per Month & Cumulatively as of January 1, 2013. Click on the image to view full-screen.
Figure 2. Ohio Utica Well Status as of January 1, 2013. Click on the image to view full-screen.
Figure 3. Ohio Utica Wells by County as of January 1, 2013. Click on the image to view full-screen.
Figure 4. Ohio Utica Wells Per Square Mile by County and People Per Well by County as of January 1, 2013. Click on the image to view full-screen.
[1] Thanks to the surge in Columbiana County wells, the Texas-based Santrol will be opening a frac sand terminal with direct access to Ohio State Route 11 open 365 days a year and equipped to handle 500,000 tons annually.
Table 1. Distribution of Ohio Utica Shale wells across companies (#, %), Date of First Permit (DFP), and the valuation of the publicly funded companies at their DFP at the close of business 1/22/2013.
Company Valuation
Company
#
%
DFP†
Share Price DFP
Share Price 1/22/2013
% Change
Anadarko
12
0.025
09/07/2011
69.88
79.49
1.138
Antero
11
0.023
03/23/2012
Atlas Noble
5
0.010
09/24/2012
31.14
30.315
0.974
Carrizo
2
0.004
07/26/2012
24.02
22.43
0.934
Chesapeake Energy
320
0.657
12/23/2010
25.61
18.73
0.731
Chevron Appalachia
2
0.004
07/31/2012
109.58
115.91
1.058
Consol Energy
19
0.039
06/17/2011
45.86
32.74
0.714
Devon Energy
13
0.027
11/02/2011
65.46
54.28
0.829
Eclipse Resources
1
0.002
12/21/2012
—
—
—
Enervest
16
0.033
06/30/2011
9.37
9.37
1.000
EQT
1
0.002
09/13/2012
57.76
60.43
1.046
Gulfport Energy
25
0.051
02/28/2012
35.49
42.3
1.192
Halcon
1
0.002
11/02/2012
5.003
5.815
1.162
Hall Drilling
1
0.002
09/17/2012
Hess Ohio
14
0.029
09/28/2010
53.63
58.87
1.098
HG Energy
16
0.033
09/14/2011
—
—
—
Hilcorp Energy
1
0.002
12/14/2012
—
—
—
Mountaineer Keystone
7
0.014
07/13/2012
—
—
—
PDC Energy
4
0.008
05/25/2012
25.67
39.8
1.550
R E Gas Development
8
0.016
03/19/2012
—
—
—
Sierra Resources
3
0.006
07/02/2012
—
—
—
SWEPI
1
0.002
06/20/2012
—
—
—
XTO Energy
4
0.008
04/09/2012
0.28
0.027
0.096
Sum
487
Average
0.966
† DFP = Date of First Permit; “—“ not a publicly funded company.
Fire on McDowell B well site near Wetzel County, WV. Burned for 9 days. (Sept. 2010) Wetzel County Action Group photo, copyright of Ed Wade, Jr.
By Samantha Malone, MPH, CPH – Manager of Science and Communications
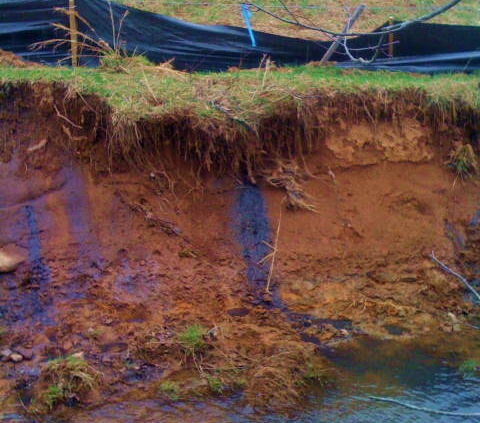
While I am a full-time staff member of FracTracker Alliance, like many other people I wear several hats. One of these is as an academic researcher and doctorate student in environmental health at Pitt. My academic research focuses on unconventional natural gas extraction and its potential impacts on health. However, trying to conduct research in such a controversial arena can be frustrating – at best. Access to well pads, pipelines, or other industrial areas is limited for a variety of reasons in Pennsylvania. The opportunity to discuss concerns with workers and residents is stifled by fear, red tape, and/or the desire to protect precious assets. I don’t blame people for being cautious about with whom they speak, but I truly wish it were easier to get close to drilling activity in person, without putting anyone’s lives or jobs in danger. My lamenting on that very subject one day resulted in a colleague telling me about The West Virginia Host Farms Program, a grassroots project launched by volunteer home owners residing near drilling activity.
The purpose of the program is to provide environmental researchers and the media with the chance to conduct research or simply to photograph a well pad in person from the safety of an adjacent host farm. In short, the network of volunteers help to develop research partnerships to better understand the impacts of drilling. Diane Pitcock, the program’s administrator, recognized the need for this initiative a few years ago as a surface rights owner. In WV many people are in “split-estate” situations, meaning that most surface owners do not own the mineral rights beneath their land. This issue is compounded by the fact that most of the minerals in WV are owned by people that do not even live in state. As such, the people who own the surface rights feel that their homes and livelihoods in some cases are at risk – without the potential for financial reimbursement from the sale of the mineral rights below their land. The program aims to show people that unconventional drilling using hydraulic fracturing is not our grandfather’s gas extraction process, and it can’t be treated as such.
The project operates out of 14 West Virginia counties where drilling is most active. The network of volunteers has aided in academic research based out of several universities including Yale and Duke. The project has also hosted out of state reporters and even international photojournalists, people who possess platforms to advance the outreach and public education effort surrounding unconventional drilling. For example, Jolynn Minaar, who produced the documentary, Un*earthed, visited from South Africa in 2012 as part of her field work. Journalists from alternet.org and polidoc.com have been among the area’s many inquirers, as well. Even if you don’t plan on taking a tour of WV drilling sites, you can still benefit from the project’s extensive, online photo gallery (see image above).
Despite the controversial nature of shale gas drilling, the growing utilization of the program is surely a success story. Based on the WV Host Farms model, additional host farm networks are being coordinated in PA and OH as we speak. Engaging people who can volunteer 30-40 hours per week is no easy task, however. As more federal research like the US EPA’s hydraulic fracturing study begins to get off of the ground and into the well, perhaps even more people will support and recognize the value of such an integral, on-the-ground resource in the WV Host Farms Program. I know this researcher does!
For more information:
Diane L. Pitcock, Program Administrator
The WV Host Farms Program
P.O. Box 214, West Union, WV, 26456
304-873-3764
(e) wvhostfarms@yahoo.com
(w) www.wvhostfarms.org


 Wetzel County Action Group photo, copyright of Ed Wade, Jr.")