A Mosaic of Recent Activity
Summer is a time to vacation, barbecue, and enjoy the great outdoors. In case you have been partaking in summer fun and missed recent drilling news, information, and events, check out the summaries below compiled by the folks at FracTracker with input from many sources including Edward Kokkelenberg:
| PA DEP Data Changes | |
| Until June 2012, data from the Pennsylvania Department of Environmental Protection (PA DEP) Office of Oil and Gas Management had a Marcellus Shale indicator associated with various reports, including the permits issued report. These have all been replaced with an Unconventional indicator. Read more about the distinction from the PA DEP here (PDF). The following two visualizations show you trends with the unconventional wells drilled and permitted in PA using the new category: | |
 Drilled Unconventional Wells in PA by Type |
 Unconventional Permits in PA by Year |
| In the News | |
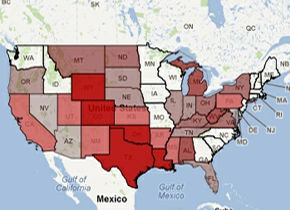
| The Math Behind the 100-Year, Natural Gas Supply Debate When President Barack Obama said that the U.S. has a supply of natural gas that can last nearly 100 years, he was using a quick-and-dirty computation that is nonetheless rooted in recent geological research. How should natural gas supply data be interpreted for public consumption? Read more»  Natural Gas Production in 2010 by State |
Shell Methane Migration Incident Under Investigation Shell, a company who plans to build an ethylene cracker facility in western PA, is being investigated by the PA DEP for methane migration concerns in northeastern PA (Tioga County). The original incident was reported on June 21, 2012. Several families within a one mile radius of the site have already been evacuated temporarily. Read more»  Unconventional Wells in Union Township, Tioga County, PA |
| Health Research | |
| Health Network to Analyze Health Effects from Natural Gas Activities Geisinger Health System, a nonprofit chain of hospitals in eastern PA, plans to use its database of patient records to determine whether natural gas drilling in the state’s Marcellus shale is harming residents. Read more»  Geisinger Health System |
Worker Hazard Alert Issued Based on NIOSH field studies, OSHA and NIOSH released a Hazard Alert on June 21, 2012 for gas drillers who are working on sites utilizing hydraulic fracturing due to the potential for them to be exposed to airborne silica during fracturing sand transport and mixing. Read more»  Mixing of sand on site |
| Resources | |
| Marcellus Papers This unique and easy-to-read assortment of papers has been put together by the Paleontological Research Institute. Browse through introductory topics such as Why the Geology Matters or more intricate discussions of the water input required to hydraulically fracture a Marcellus Shale well – the quantity, additives, and risks. Read more»  PRI’s Marcellus Papers |
Alert service available through Sunlight Foundation With this online resource, you can: set up alerts and subscribe to receive updates from Congress, state legislatures; search through every bill and regulation in the federal government; follow and search bills in all 50 states, powered by the Open States project — And more»  Scout.SunlightFoundation.com |
| Popular Media | |
Injection Wells: The Poison Beneath Us – By ProPublica
 ProPublica article about deep well injection |
The Sky is Pink video – By Josh Fox |