Interest in West Virginia’s Marcellus Now Focused on North
If you look at the overall map of Marcellus Shale permits in West Virginia, it seems to be a topic of concern for most of the state. Looking at the map below of data obtained by the West Virginia Department of Environmental Protection (WVDEP) Oil and Gas Dataviewer, it isn’t surprising to note that such permits have been issued in 46 out of 55 counties in the Mountain State (1):

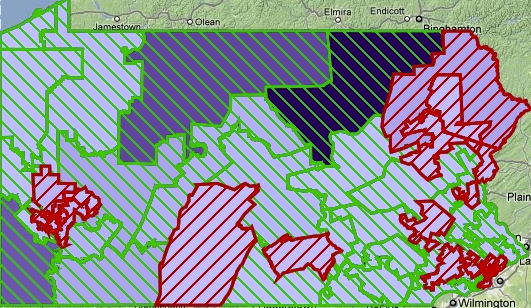
Marcellus Shale permits issued in West Virginia from 2005 to 3-20-2012
I was curious to see how the distribution looked over time, and was surprised to notice a pronounced contraction of the area of interest:
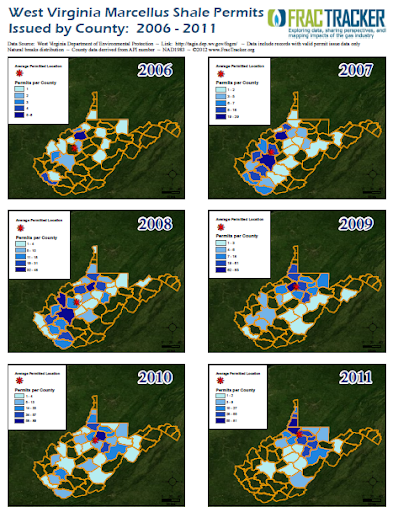
West Virginia Marcellus Shale permits issued by year, showing data by county and average latitude and longitude of each permitted location. Click image to view full size PDF.
While the majority of the state has been explored over the past seven years, the entire southwestern portion has been abandoned in terms of the Marcellus Shale (2), and the average latitude and longitude of all permits issued in 2011 is less than 20 miles from the Pennsylvania border.
To illustrate the trend, let’s take a closer look at Kanawha County, which is the most southwestern county with any shade of blue in the 2011 map. In 2007 and 2008, it led the way among all West Virginia counties with 29 and 48 permits issued, respectively, and the average permitted location was just one county to the northeast. Three years later, the number of new permits in Kanawha had dwindled to just one.
In contrast, Marshall County (the southernmost county in the panhandle) and Wetzel County (just to the south of Marshall) generated very little interest in the early exploration of West Virginia’s Marcellus Shale hydrocarbons, but by 2011, they were the top two counties in terms of permits issued.
This all begs the question of why the southwestern portion of the state is abandoned. While I don’t have access to production data, I assume that wells that were drilled in that area yielded disappointing returns on industry investments, or else efforts to extract resources would have continued. A colleague noted that the abandoned territory also happens to be the heart of West Virginia’s coal country, so perhaps there was some interference between the two extractive industries. This could be a contributing factor, but it is difficult to imagine a situation in which drillers would totally cede an eight county area to miners without massive compensation.
Lacking further data, it may not be possible to know the full story of what happened between 2008 and 2011 in southwestern West Virginia. But there is one thing that we know for sure: for all intents and purposes, the recoverable portion of the Marcellus Shale is smaller than we used to think.
- The WVDEP data is fairly sloppy, as some of the permitted locations are actually in adjacent states, and 373 of the 2472 records downloaded (15 percent) on 3-20-2012 lacked permit issue dates. It is possible that these dates could be obtained from the alternative data source of https://apps.dep.wv.gov/oog/permitsearch_new.cfm. The Oil and Gas Dataviewer was preferred because it was possible to select for permits issued, and because the location data were in longitude and latitude rather than universal transverse Mercator.
- County data is not included in the original data, but it is encoded in the well API number. Of necessity, the entries without permit issue dates were omitted from this analysis.


 nt, -par-]