Piecing Together an Ethane Cracker
How fragmented approvals and infrastructure favor petrochemical development
By Leann Leiter and Lisa Graves-Marcucci
Let’s think back to 2009, when oil and gas companies like Range Resources began drilling the northeast shale plays in earnest. Picture the various stages involved in drilling – such as leasing of land, clearing of trees, boring of wells, siting of compressor stations, and construction of pipelines to gather the gas. Envision the geographic scope of the gas infrastructure, with thousands of wells in Pennsylvania alone, and thousands of miles of pipelines stretching as far as Louisiana.
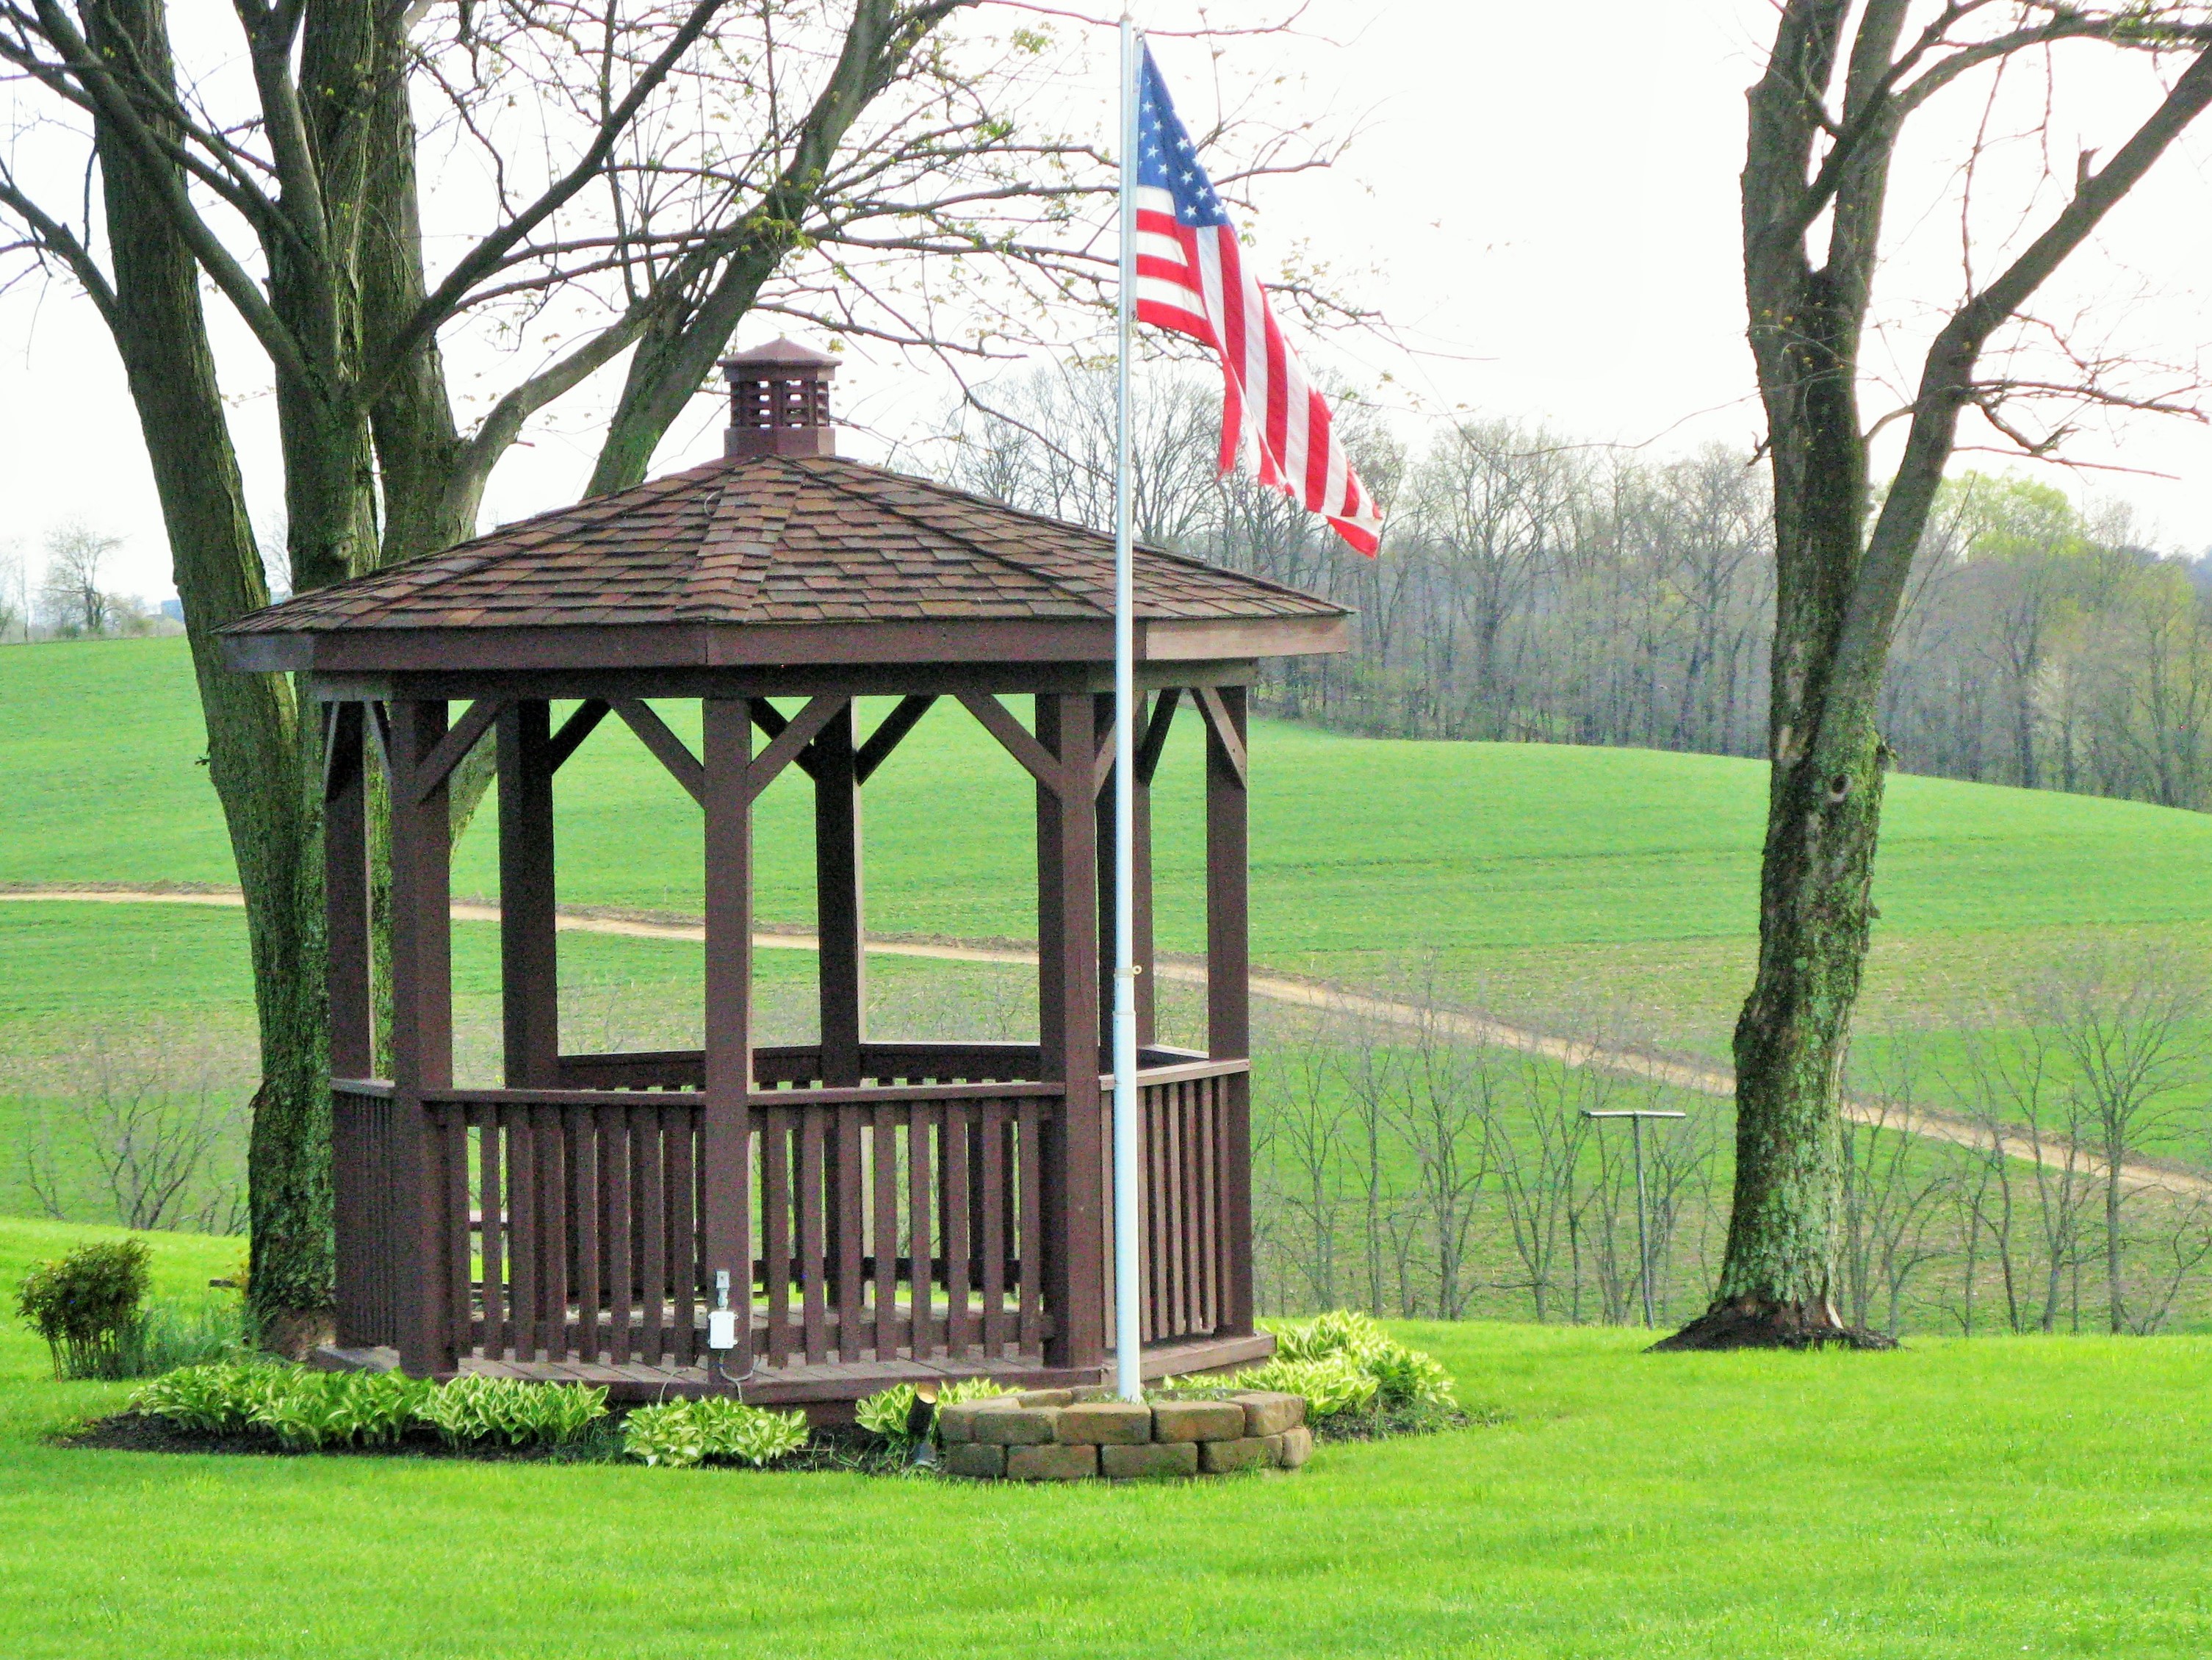
Figure 1. A pipeline right-of-way snakes behind a residential property in Washington County, PA. Photo credit: Leann Leiter
Now, picture the present, where a homeowner looks out over her yard and wonders how a lease she signed with Shell several years prior made it possible for the company to run an ethane pipeline across her property and between her house and her garage.
Think forward in time, to 2022, the year when a world-scale ethane cracker is set to go online in Beaver County, Pennsylvania, to begin churning through natural gas liquids from wells in PA and others, producing a variety of disposable plastic products.
At each of these moments in gas development, which of the many stakeholders – industry leaders, local governments, state regulatory agencies, or landowners and residents – were granted a view of the full picture?
The proposed Shell ethane cracker in Beaver County is an illustration of the fragmented nature of gas development. From the extensive web of drilling infrastructure required to supply this massive facility, to several years of construction, this project is a case-study in piecemeal permitting. Such fragmentation creates a serious barrier to transparency and to the informed decision-making that relies upon it.
In the first two articles in this series on the petrochemical development in Beaver County, we focused on ethane cracker emergency scenarios and how the area might prepare. In this article, we draw the lens back to take in the larger picture of this region-altering project and highlight the effects of limited transparency.
The “Piecemeal” Nature of Gas Development
All across the Pennsylvania, proposed industrial development – even coal operations – have historically provided to the public, elected officials, and regulatory agencies the extent or footprint of their planned operations. Nonetheless, the oil and gas industry has in several instances undertaken a practice of developing its extensive infrastructure piece-by-piece. Operators of these facilities first acquire a GP-5 General Permit, which is only available to certain oil and gas operations with “minor” emissions and which allows them to avoid having the permit undergo public notice or comment. These operators then add emissions sources and increases through a series of minor amendments. While they are required to obtain a “major” source permit once their modifications result in major emissions, they avoid the scrutiny required for a major source by this fragmented process.
Unlike most other industrial permitting, the gas industry has enjoyed a much less transparent process. Instead of presenting their entire planned operation at the time of initial permit application, gas operators having been seeking – and receiving – incremental permits in a piecemeal fashion. This process puts local decision makers and the women, men, and children who live, work, and go to school near gas development at a severe disadvantage in the following ways:
- Without full disclosure of the entirety of the planned project, neither regulatory bodies nor the public can conduct a full and factual assessment of land use impacts;
- Incremental approvals allow for ever-expanding operations, including issuance of permits without additional public notification and participation;
- Piecemeal approvals allow operations to continuously alter a community and its landscape;
- The fragmented approval process prevents consideration of cumulative impacts; and
- Without full transparency of key components of the proposed operations, emergency planning is hampered or non-existent.
From the Well to the Ethane Cracker
In the fragmented approval process of gas development, the proposed ethane cracker in Beaver County represents a pertinent example. Developers of this massive, multi-year, and many-stage project have only revealed the size and scope in a piecemeal fashion, quietly making inroads on the project (like securing land leases along the route of the pipeline required for the cracker, years in advance of permit approvals for the facility itself). By rolling out each piece over several years, the entirety of the petrochemical project only becomes clear in retrospect.
A World-Scale Petrochemical Hub
While Shell is still pursuing key approval from the PA Department of Environmental Protection, industry leaders treat the ethane cracker as a foregone conclusion, promising that this facility is but one step in turning the area into a “petrochemical hub.”
The cracker facility, alone, will push existing air pollution levels further beyond their already health-threatening state. Abundant vacant parcels around Shell’s cracker site are attractive sites for additional spin-off petrochemical facilities in the coming “new industry cluster.” These facilities would add their own risks to the equation, including yet-unknown chemical outputs emitted into the air and their resulting cumulative impacts. Likewise, disaster risks associated with the ethane cracker remain unclear, because in the piecemeal permitting process, the industry is not required to submit Preparedness, Prevention, and Contingency (PPC) Plans until after receiving approval to build.
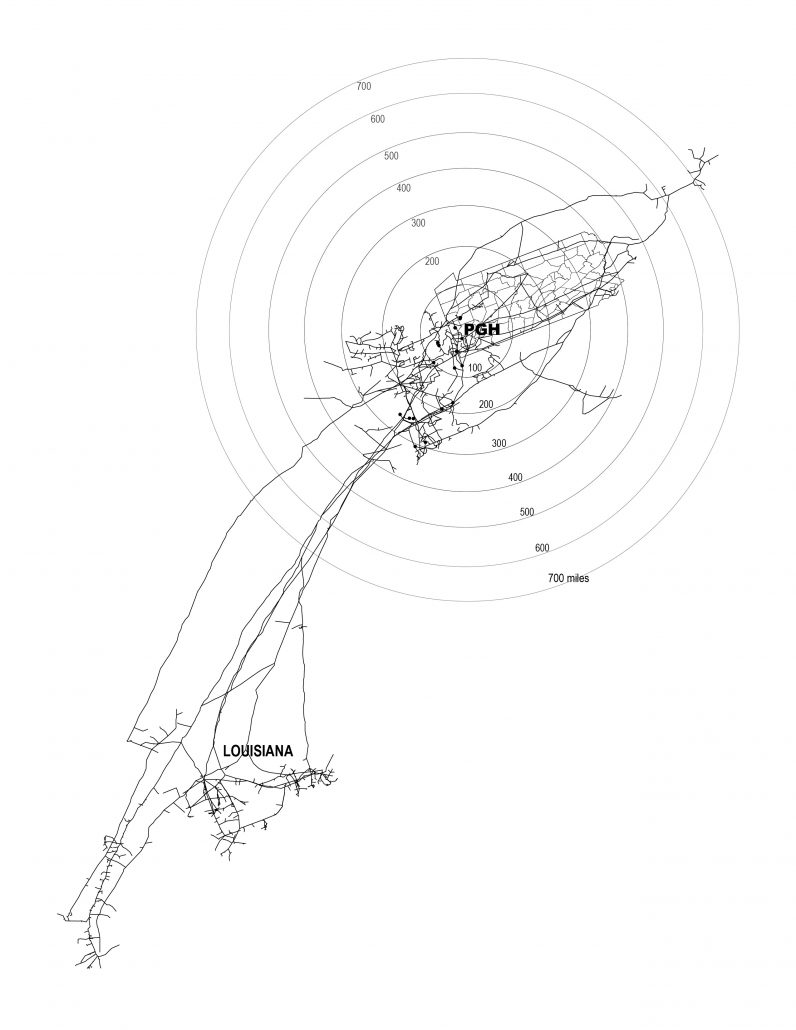
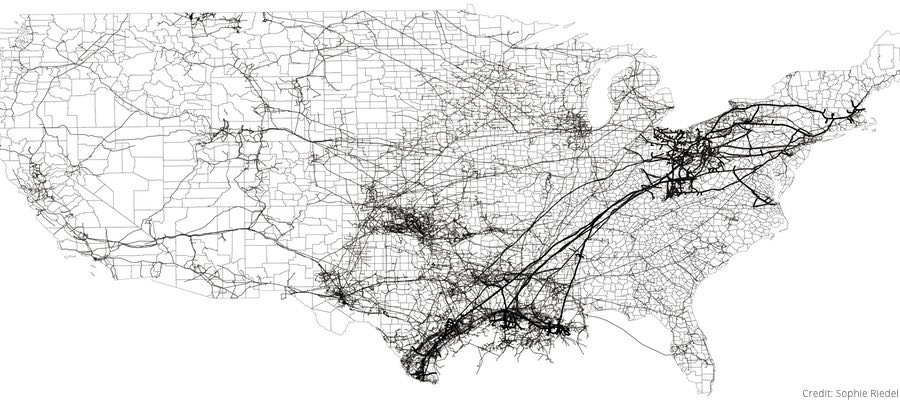
Figure 2. A portion of the extensive US natural gas interstate pipeline system stretching from the petrochemical hubs in the bayous of the Gulf Coast Basin to Pittsburgh’s Appalachian Basin. However, petrochemical development in the northeast may reverse or otherwise change that flow. Visualization created by Sophie Riedel, Carnegie Mellon University, School of Architecture. Data on interstate natural gas supply sourced from Energy Information Administration, Form EIA176 “Annual Report of Natural Gas and Supplemental Gas Supply and Disposition,” 2007.
92.3 Miles of Explosive Pipeline
More than just a major local expansion, communities downriver and downwind will be susceptible to the impacts, including major land disturbance, emissions, and the potential for “incidents,” including explosion. The pipeline required to feed the cracker with highly flammable, explosive ethane would tie the tri-state region into the equation, expanding the zone of risk into Ohio and crossing through West Virginia.
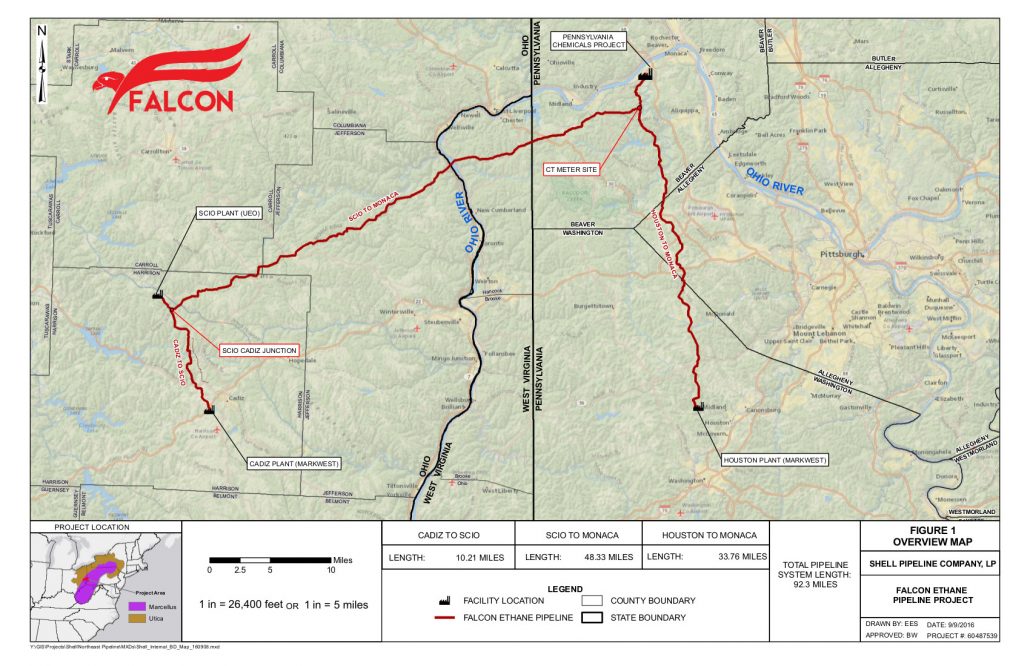
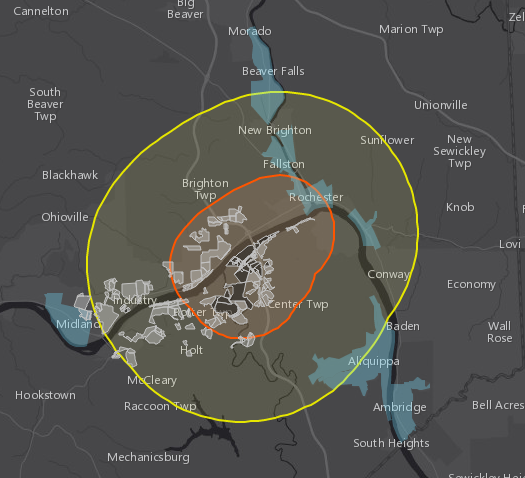
Figure 3. The Falcon Pipeline, which would be used to transport ethane to the cracker in Beaver County. At 92.3 miles long, it consists of two “legs,” starting from Scio and Cadiz, Ohio and Houston, PA, respectively, and extending up to the site of Shell’s ethane cracker. Credit: Shell Pipeline Company LP
Renewed Demand at the Wellhead
No one piece of the gas infrastructure stands alone; all work in tandem. According to the Energy Information Administration (EIA), the new US ethane crackers will drive consumption of ethane up by a 26% by the end of 2018. Gas wells in the northeast already supply ethane; new ethane crackers in the region introduce a way to profit from this by-product of harvesting methane without piping it to the Gulf Coast. How this renewed demand for ethane will play out at fracked wells will be the result of complex variables, but it will undoubtedly continue to drive demand at Pennsylvania’s 10,000 existing unconventional oil and gas wells and those of other states, and may promote bringing new ones online.
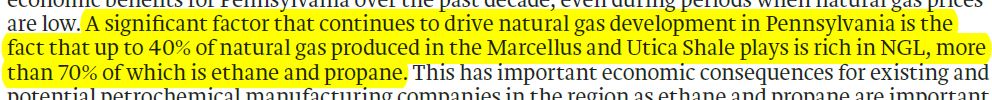
Figure 4. Excerpt from Executive Summary of IHS Markit Report, “Prospects to Enhance Pennsylvania’s Opportunities in Petrochemical Manufacturing.”
Along with drilling comes a growing network of gathering and transmission lines, which add to the existing 88,000 miles of natural gas pipeline in Pennsylvania alone, fragment wildlife habitat, and put people at risk from leaks and explosions. Facilities along the supply stream that add their own pollution and risks include pump stations along the route and the three cryogenic facilities at the starting points of the Falcon Pipeline (see Fig. 6).
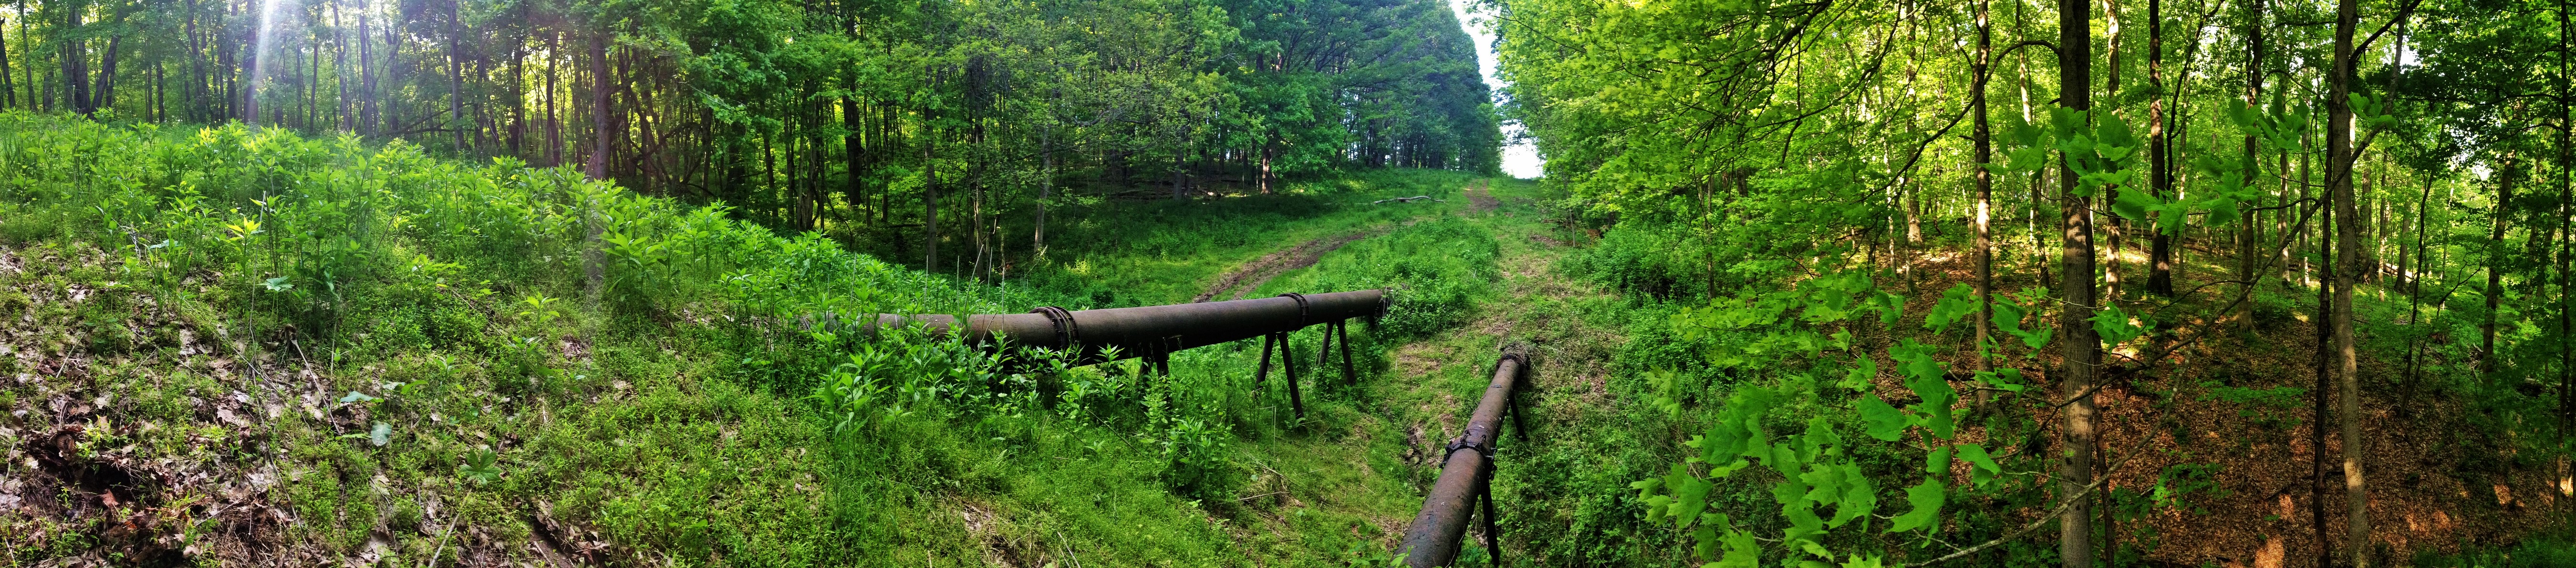
Figure 5. Several yards of the 88,000 miles of gas pipelines cutting through Pennsylvania. Finleyville, PA. Credit: Leann Leiter
The infrastructure investment required for ethane crackers in this region could reach $3.7 billion in processing facilities, pipelines for transmitting natural gas liquids including ethane, and storage facilities. A report commissioned by Team Pennsylvania and the PA Department of Community and Economic Development asserts that “the significant feedstock and transportation infrastructure required” will “exceed what is typically required for a similar facility” in the Gulf Coast petrochemical hub, indicating a scale of petrochemical development that rivals that of the southern states. This begs the question of how the health impacts in Pennsylvania will compare to those in the Gulf Coast’s “Cancer Alley.”
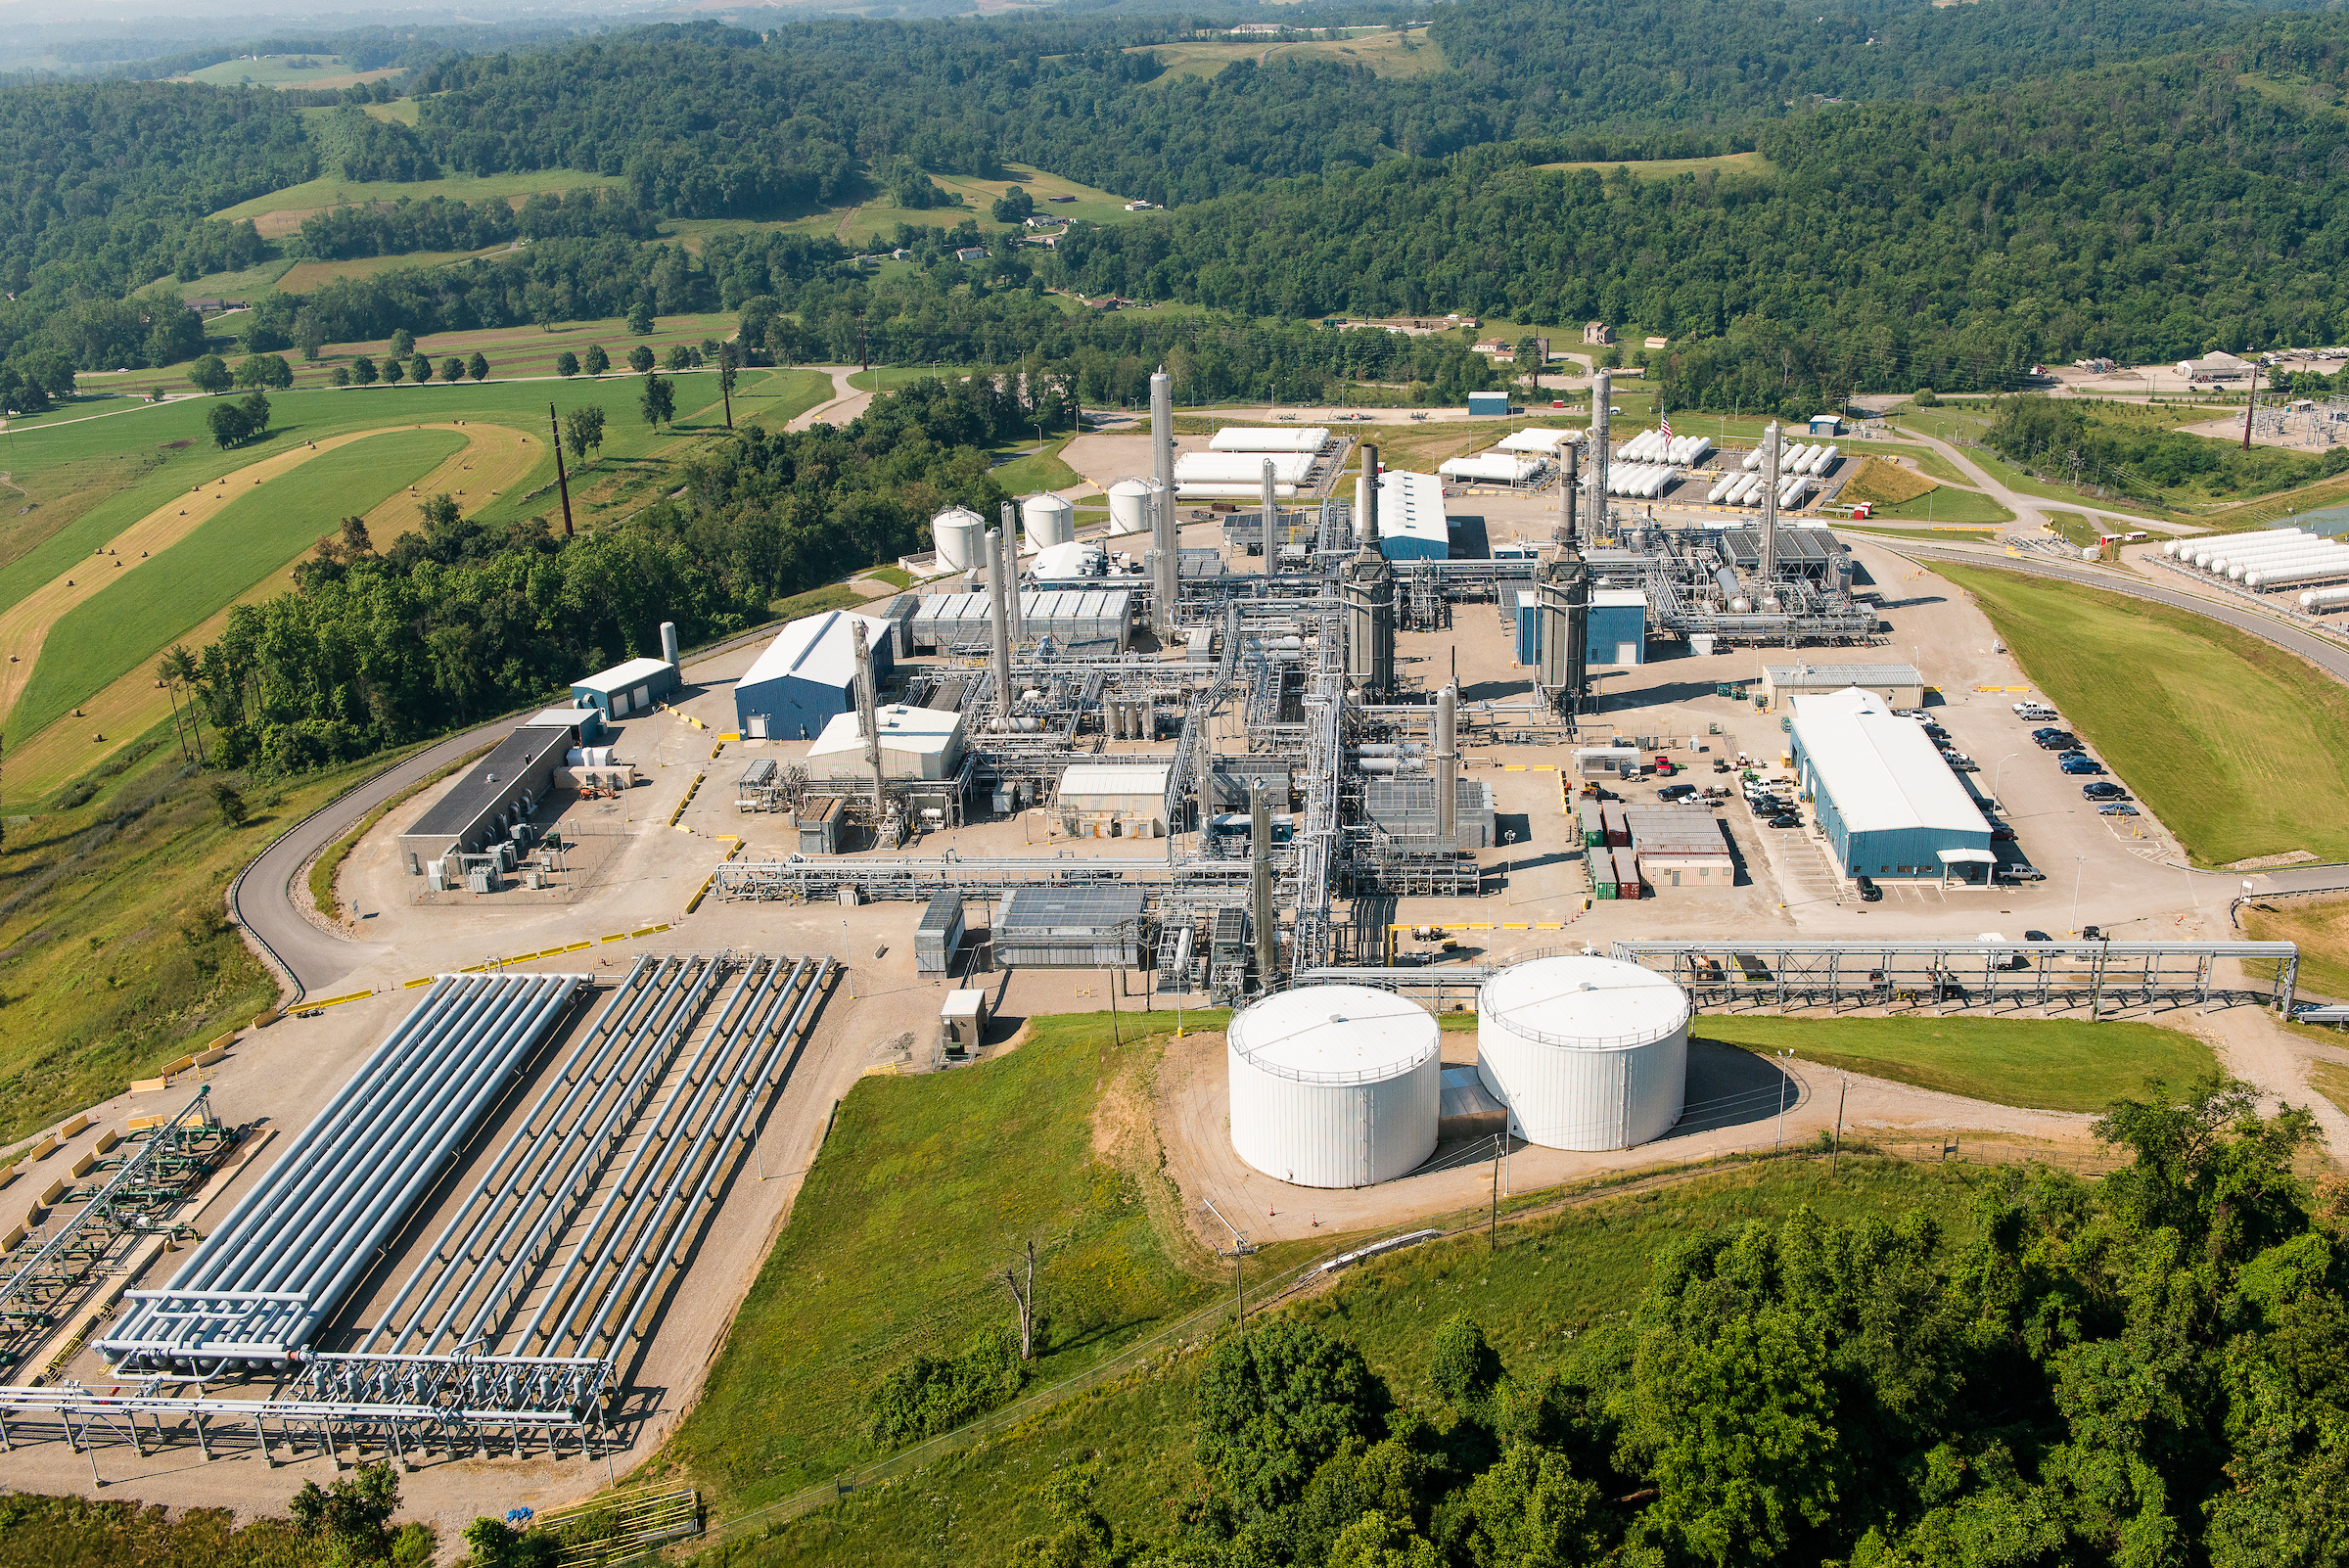
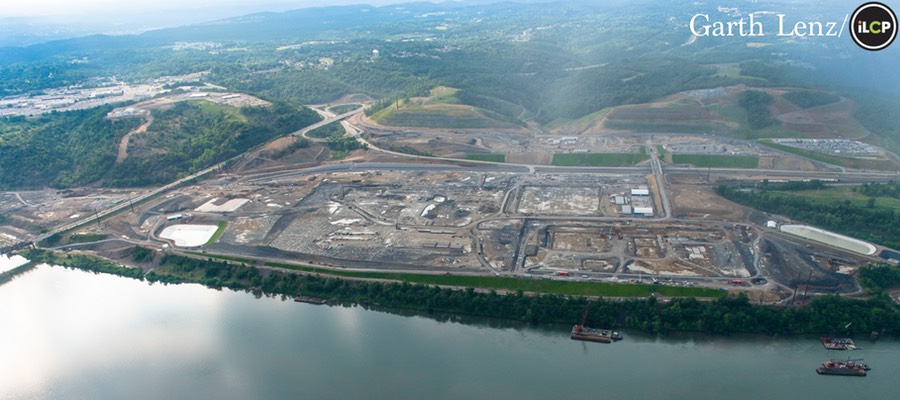
Figure 6. Houston, PA Cryogenic and Fractionation Plant, one of three such facilities supplying feedstock to the proposed Shell ethane cracker. Credit: Garth Lenz, iLCP
Water Impacts, from the Ohio River to the Arctic Ocean
Shell’s facility is only one of the ethane crackers proposed for the region that, once operational, would be permitted to discharge waste into the already-beleaguered Ohio River. This waterway, which traverses six separate states, supplies the drinking water for over 3 million people. Extending the potential water impact even further, the primary product of the Shell facility is plastics, whose inevitable disposal would unnecessarily add to the glut of plastic waste entering our oceans. Plastic is accumulating at the alarming rate of 3,500 pieces a day on one island in the South Pacific and as far away as the waters of the Arctic.
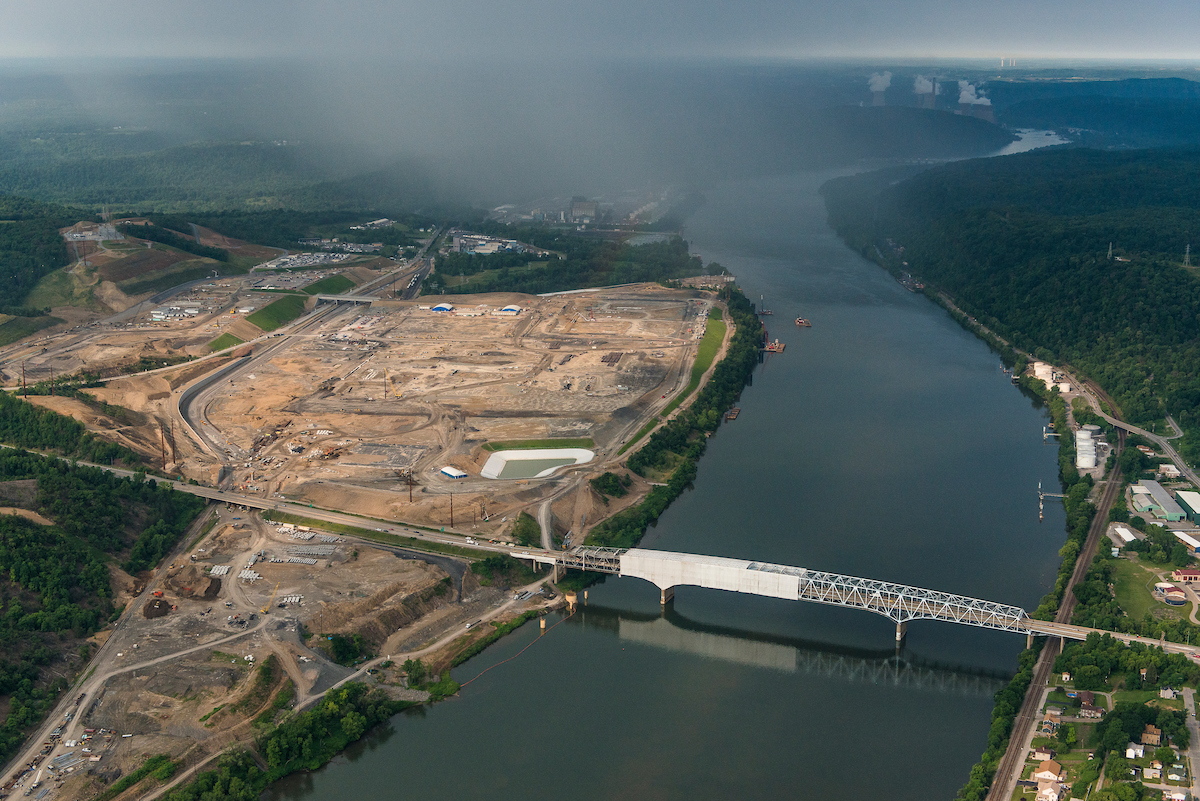
Figure 7. View of the Ohio River, downriver from the site of Shell’s proposed ethane cracker. Existing sources of industrial pollution to the river include the American Electric power plants, coal loading docks, barges, coal ash lagoons, and dry coal ash beds shown in this picture, and at least two fracking operations within the coal plant areas. Credit: Vivian Stockman/ohvec.org; flyover courtesy SouthWings.org.
How does fragmentation favor industry?
The gas and petrochemical industry would likely defend the logistical flexibility the piecemeal process affords them, allowing them to tackle projects, make investments, and involve new players as needed overtime. But in what other ways do the incredibly fragmented approval processes, and the limited requirements on transparency, favor companies like Shell and their region-changing petrochemical projects? And what effect does the absence of full transparency have on local communities like those in Beaver County? We conclude that it:
- “Divides and conquers” the region. The piecemeal approach to gas development, and major projects like the Shell ethane cracker, deny any sense of solidarity between the people along the pipeline route resisting these potentially explosive channels cutting through their yards, and residents of Beaver County who fear the cracker’s emissions that will surround their homes.
- Makes the project seem a foregone conclusion, putting pressure on others to approve. For example, before Shell formally announced its intention to build the facility in Potter Township, it rerouted a state-owned road to facilitate construction and increased traffic flow. Likewise, though a key permit is still outstanding with the PA DEP, first responders, including local volunteer firefighters, have already begun dedicating their uncompensated time to training with Shell. While this is a positive step from a preparedness standpoint, it is one of many displays of confidence by Shell that the cracker is a done deal.
- Puts major decisions in the hands of those with limited resources to carry them out and who do not represent the region to be affected. In the case of the Shell ethane cracker, three township supervisors in Potter Township granted approvals for the project. The impacts, however, extend well beyond Potter or even Beaver county and include major air impacts for Allegheny County and the Pittsburgh area. Effects will also be felt by landowners and residents in numerous counties and two states along the pipeline route, those near cryogenic facilities in Ohio and Pennsylvania, plus those living on the Marcellus and Utica shale plays who will see gas well production continue and potentially increase.


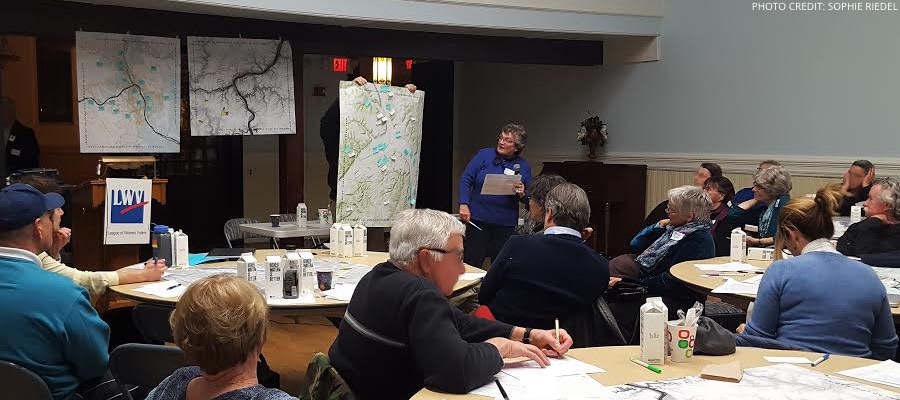
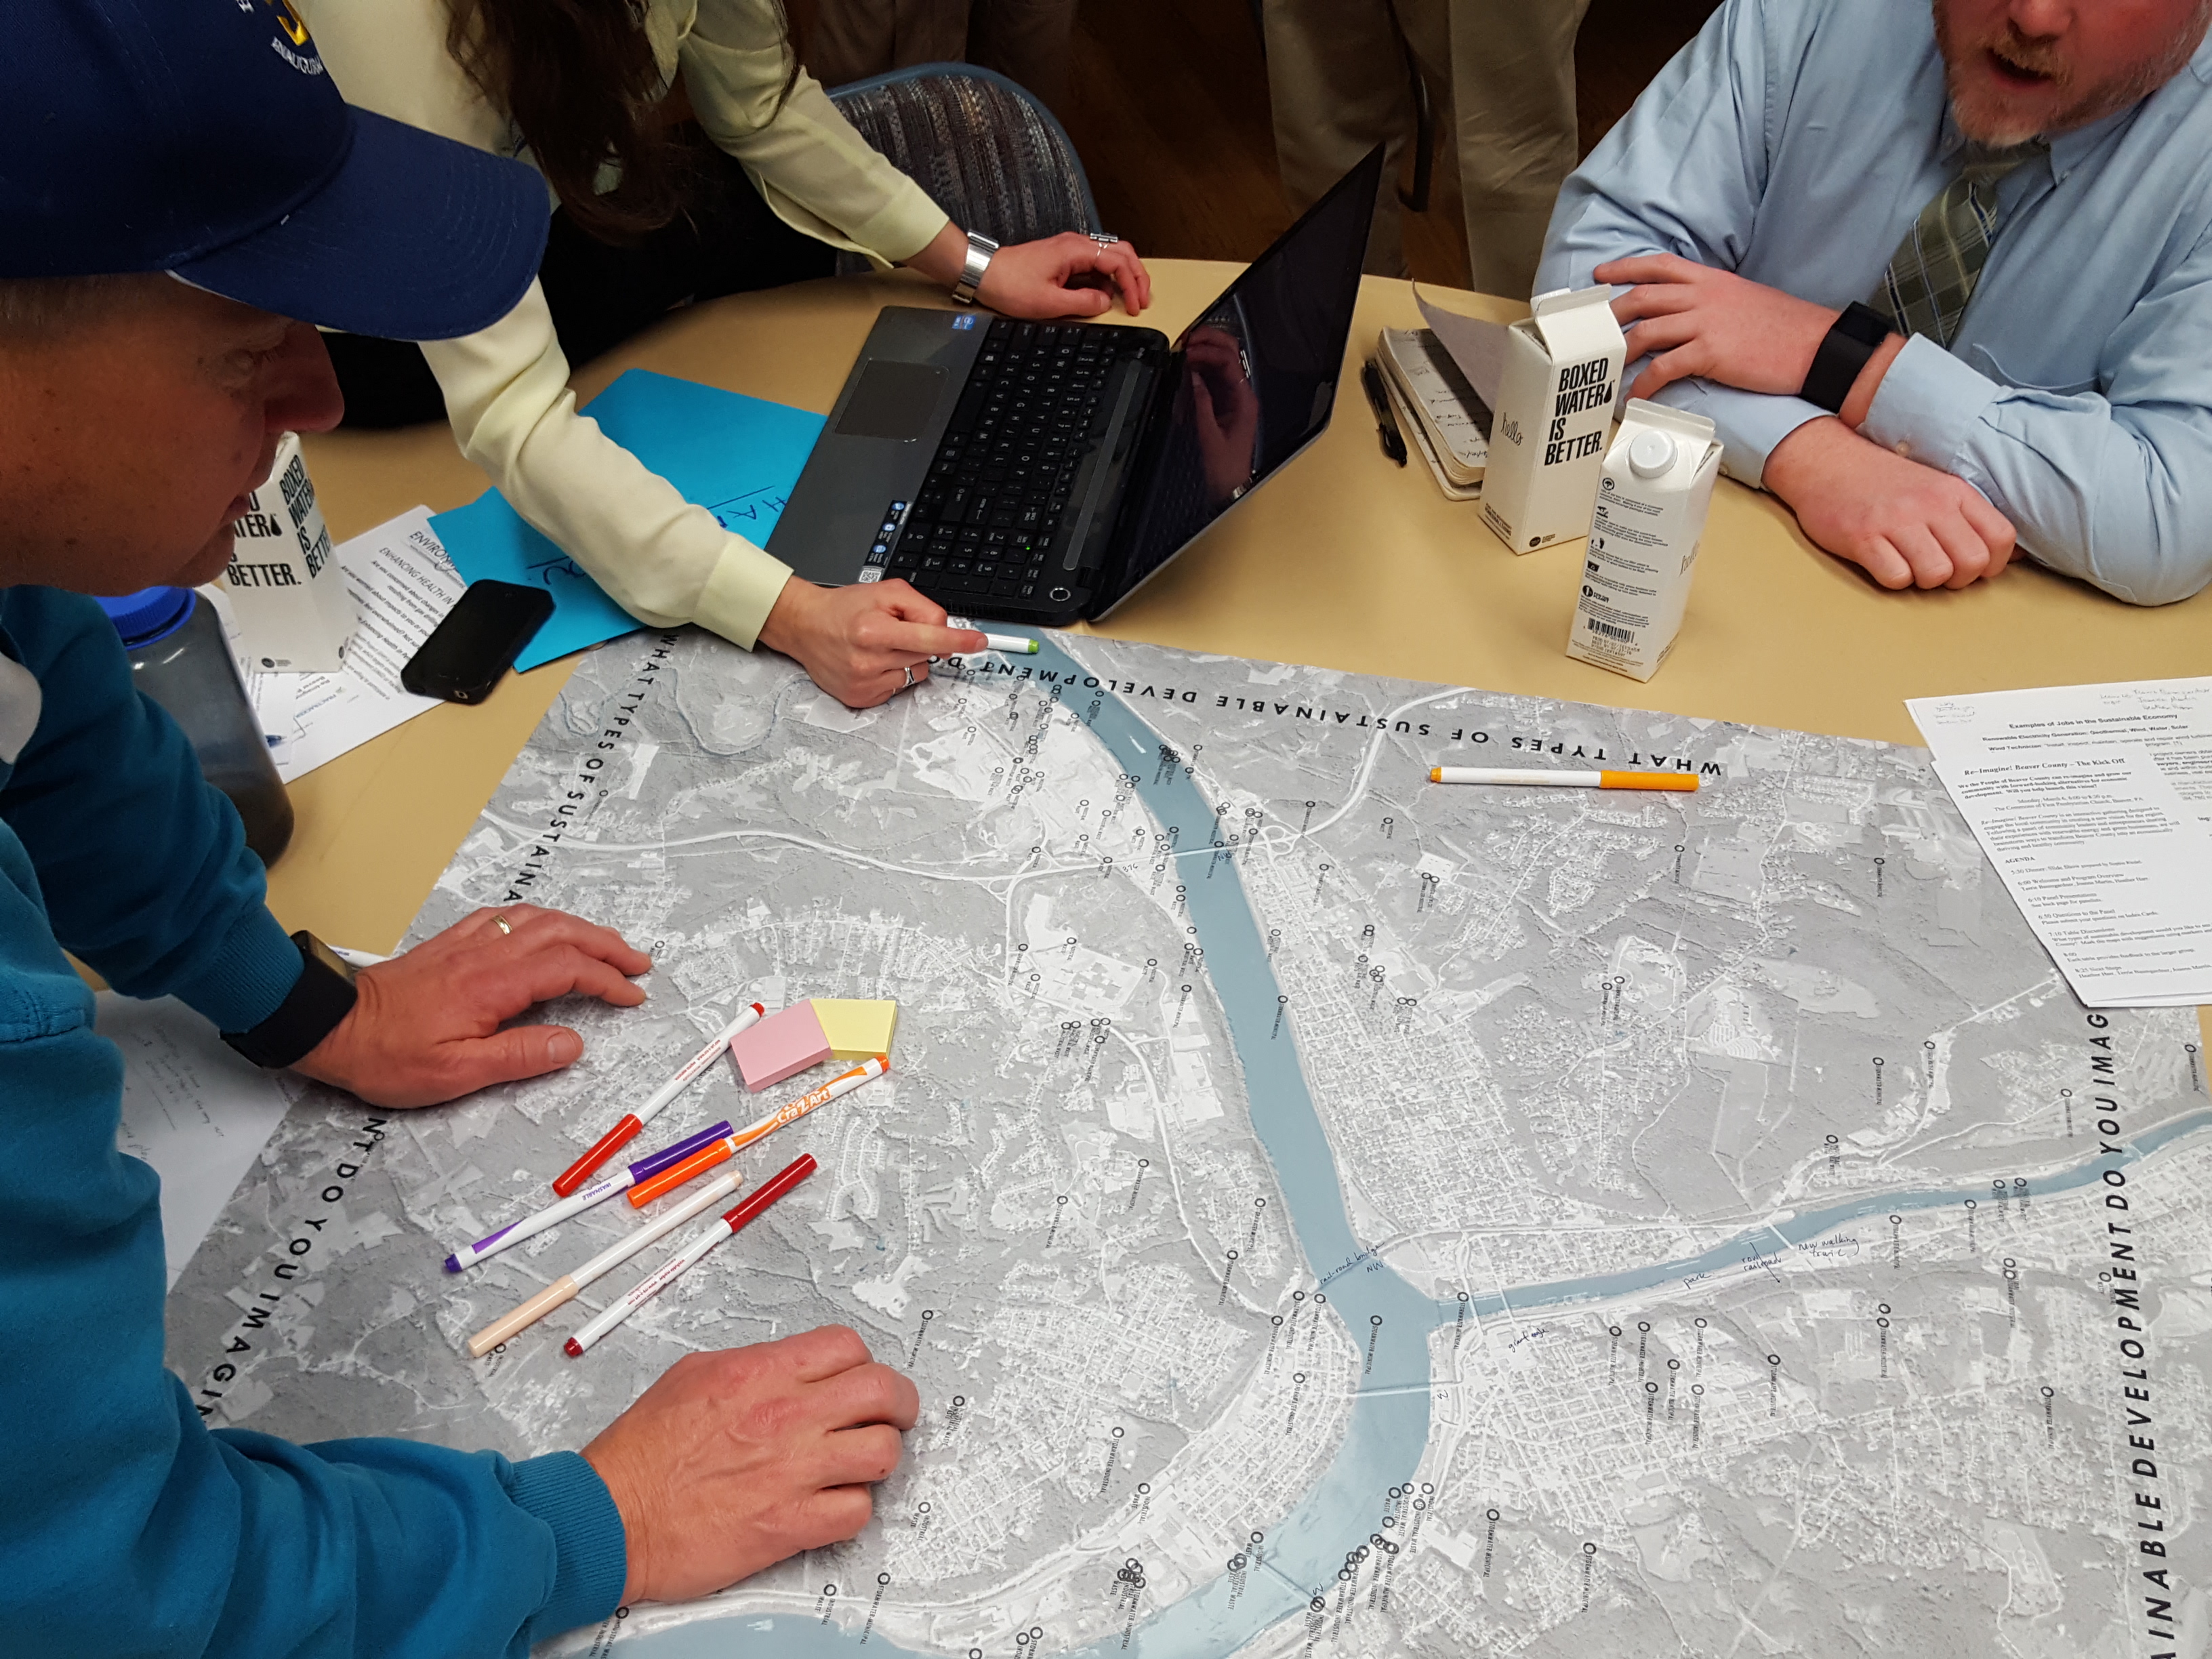
Figures 8a and 8b. Potter Township Supervisors give the go-ahead to draft approval of Shell’s proposed ethane cracker at a January meeting, while confronted with public concern about deficiencies in Shell’s permit applications. Photos courtesy of the Air Quality Collaborative.
Fragmented Transparency, Compromised Decision-making
The piecemeal, incremental, and fragmented approval processes for the ethane cracker – and other gas-related facilities in the making – create one major problem. They make it nearly impossible for locals, elected officials, and regulatory agencies to see the whole picture as they make decisions. The bit-by-bit approach to gas development amounts to far-reaching development with irreversible impacts to environmental and human health.
We ask readers, as they contemplate the impacts closest to them – be it a fracked well, a hazardous cryogenic facility, the heavily polluted Ohio River, a swath of land taken up for the pipeline’s right-of-way, or Shell’s ethane cracker itself – to insist that they, their elected officials, and regulators have access to the whole picture before approvals are granted. It’s hard to do with a project so enormous and far-reaching, but essential because the picture includes so many of us.
Sincere Appreciation
To The International League of Conservation Photographers, The Ohio Environmental Council, and The Air Quality Collaborative for sharing photographs.
To Sophie Riedel for sharing her visualizations of natural gas interstate pipelines.
To Lisa Hallowell at the Environmental Integrity Project, and Samantha Rubright and Kirk Jalbert at FracTracker, for their review of and and invaluable contributions to this series.