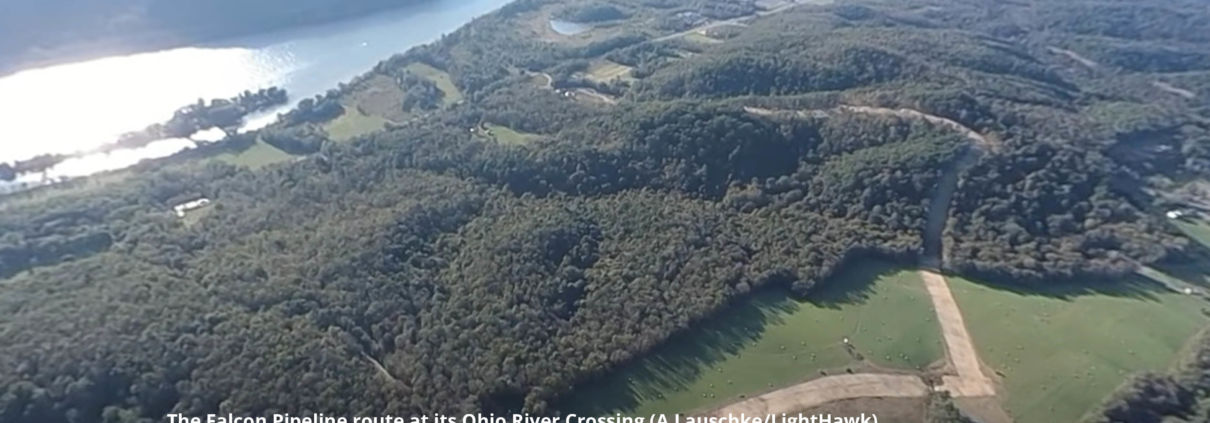
Ongoing Safety Concerns over Shell’s Falcon Pipeline
Ohio River Valley Groups react to a new safety warning issued by federal regulators to Shell regarding the troubled Falcon Pipeline
Ohio River Valley Groups react to a new safety warning issued by federal regulators to Shell regarding the troubled Falcon Pipeline
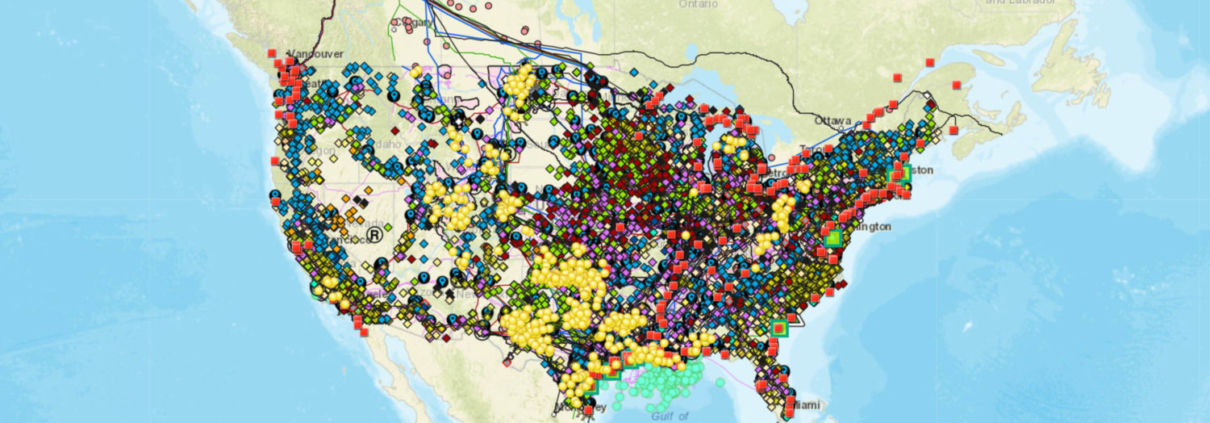
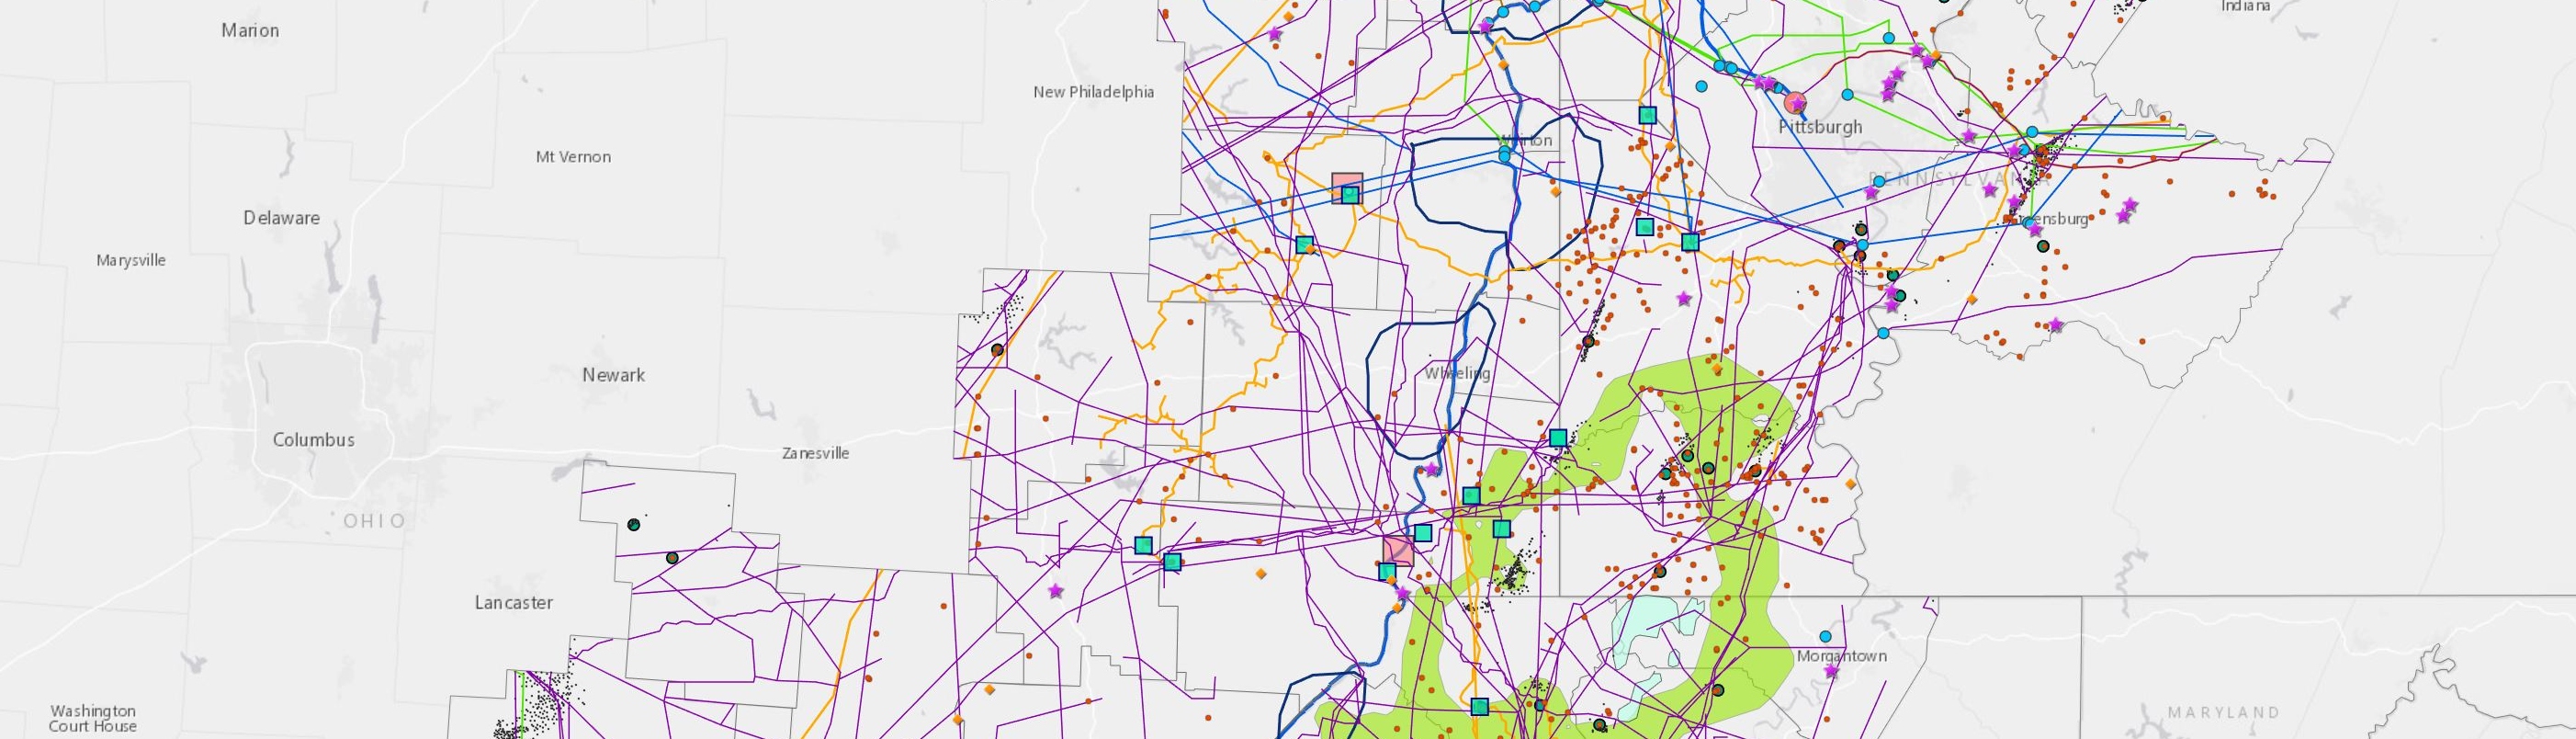
We first released this map in February of 2020. In the year since, the world’s energy systems have experienced record changes. Explore the interactive map, updated by FracTracker Alliance in April, 2021.
The Falcon Ethane Pipeline System is at the center of major investigations into possible noncompliance with construction and public safety requirements and failing to report drilling mud spills, according to documents obtained from the Pennsylvania Department of Environmental Protection (PA DEP) by FracTracker Alliance. These investigations, which are yet to be released, also uncovered instances of alleged data falsification in construction reports and Shell Pipeline Company firing employees in retaliation for speaking up about these issues.
3/17/21 Press release: https://www.fractracker.org/falcon-investigation-press-release-fractraccker-alliance/
Shell’s attempts to cut corners while constructing this 98-mile pipeline, likely motivated by the increasingly bleak economic prospects of this project, present serious public safety concerns for the thousands of residents along its route in Pennsylvania, West Virginia, and Ohio.
These allegations are serious enough to warrant immediate action. We’re calling on the Pipeline and Hazardous Materials Safety Administration (PHMSA) to thoroughly examine these allegations and suspend construction if not yet completed, or, in the case that construction is complete, operation of the Falcon Pipeline. Furthermore, we call on state environmental regulators to fully investigate construction incidents throughout the entire pipeline route, require Shell Pipeline to complete any necessary remediation, including funding independent drinking water testing, and take enforcement action to hold Shell accountable. Read our letters to these agencies here.
These investigations were featured in a March 17th article by Anya Litvak in the Pittsburgh Post-Gazette.
3/18/21 update:
Additional coverage of this story was published in a Times Online article by Daveen Ray Kurutz, a StateImpact Pennsylvania article by Reid Frazier, and an Observer-Reporter article by Rick Shrum.
According to documents obtained through a public records request, a whistleblower contacted PHMSA in 2019 with serious concerns about the Falcon, including that the pipeline may have been constructed with defective corrosion coating. PHMSA is a federal agency that regulates pipeline operation. The whistleblower also shared environmental threats occurring within the DEP’s jurisdiction, prompting the PA DEP and Pennsylvania Attorney General’s Office to get involved.
Many of the issues with the Falcon relate to a construction method used to install pipelines beneath sensitive areas like roads and rivers called horizontal directional drilling (HDD). Shell Pipeline contracted Ellingson Trenchless LLC to complete over 20 HDDs along the Falcon, including crossings beneath drinking water sources such as the Ohio River and its tributaries. FracTracker and DeSmog Blog previously reported on major drilling mud spills Shell caused while constructing HDDs and how public agencies have failed to regulate these incidents.
This map shows the Falcon Pipeline’s HDD crossings and spills of drilling fluid spills that occurred through 3/5/2020. To see the data sources, click on the information icon found in the upper right corner of the map header as well as under the map address bar.
View Map Full Sized | Updated 6/16/20
Correspondence between the PA DEP and PHMSA from February 26, 2020 reveal the gravity of the situation. While PHMSA conducted an inquiry into the whistleblower’s complaints in 2019 and concluded there were no deficiencies, PA DEP Secretary Patrick McDonnell wrote that his agency felt it was incomplete and urged PHMSA to conduct a more thorough investigation. Secretary McDonnell noted the PA DEP “has received what appears to be credible information that sections of Shell’s Falcon Pipeline project in western PA, developed for the transportation of ethane liquid, may have been constructed with defective corrosion coating protection,” and that “corroded pipes pose a possible threat of product release, landslide, or even explosions.”
FracTracker submitted a Freedom of Information Act request with PHMSA asking for documents pertaining to this inquiry, and was directed to the agency’s publicly available enforcement action webpage. The page shows that PHMSA opened a case into the Falcon on July 16, 2020, five months after Secretary McDonnell sent the letter. PHMSA sent Shell Pipeline Company a Notice of Amendment citing several inadequacies with the Falcon’s construction, including:
Shell responded with its amended procedures on July 27, 2020, and PHMSA closed the case on August 13, 2020.
Of note, PHMSA states it is basing this Notice on an inspection conducted between April 9th and 11th, 2019, when construction on the Falcon had only recently started. PHMSA has confirmed its investigation on the Falcon is ongoing, however we question the accuracy of self reported data given to PHMSA inspectors should be questioned
The PA DEP also brought the matter to the attention of the US Environmental Protection Agency.
The Falcon pipeline also crosses through Ohio and briefly, West Virginia. While we do not know how these states are involved in these investigations, our past analyses raise concerns about the Ohio Environmental Protection Agency’s (OEPA) ability to regulate the pipeline’s HDD crossings.
One of the focuses of the Pennsylvania DEP’s investigation is the failure to report drilling fluid spills that occur while constructing a HDD crossing. The PA DEP shut down all HDD operations in November, 2019 and forced Shell to use monitors to calculate spills, as was stated in permit applications.
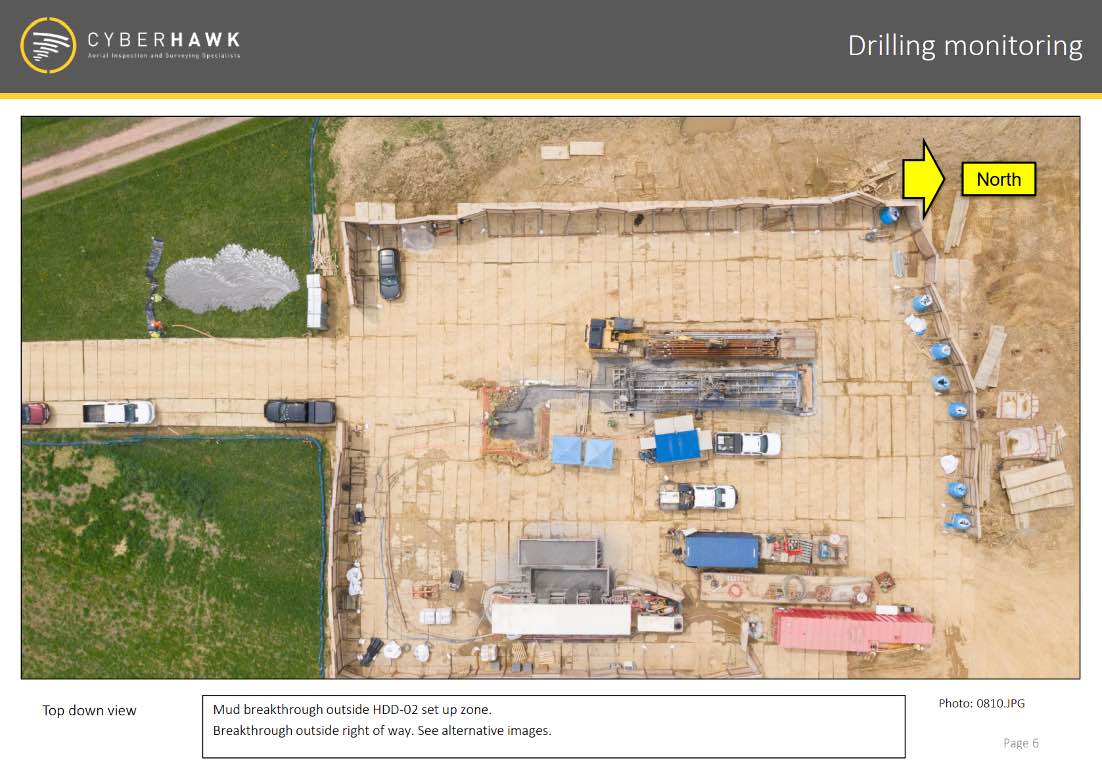
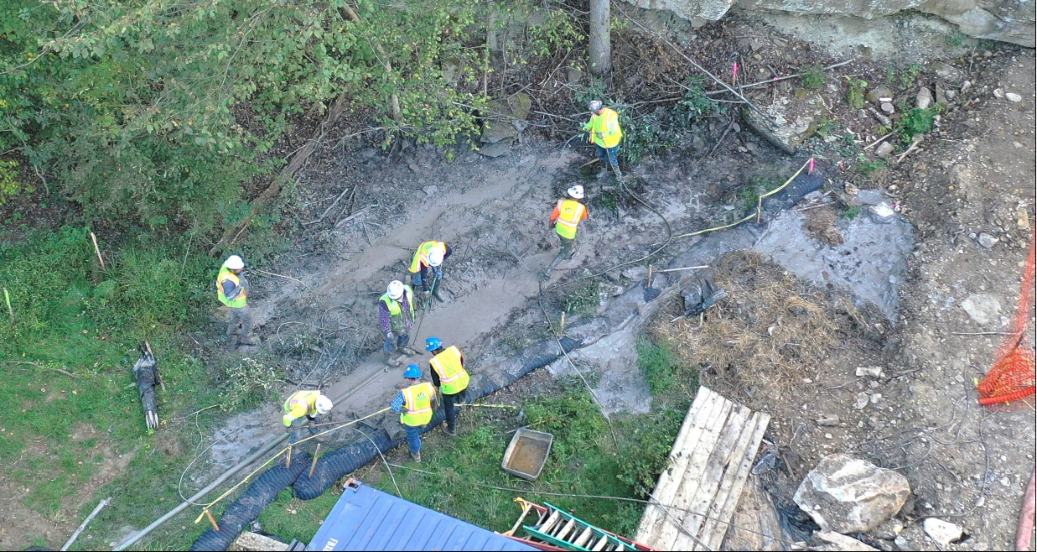
A horizontal directional drilling (HDD) construction site for the Falcon Pipeline in Southview, Washington County, Pennsylvania. You can see where the drilling mud has returned to the surface in the top left of the photo. Photo by Cyberhawk obtained by FracTracker Alliance through a right-to-know request with the Pennsylvania Department of Environmental Protection.
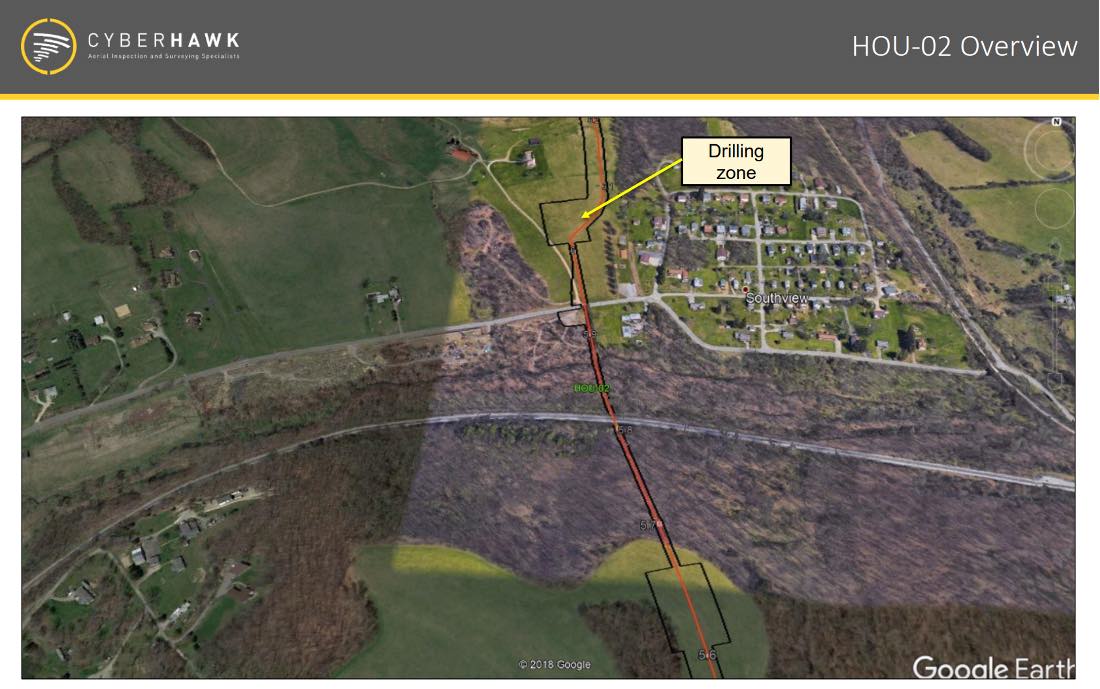
The Falcon Pipeline’s HDD locations are often close to neighborhoods, like the HOU-02 crossing in Southview, Washington County, Pennsylvania. Photo by Cyberhawk obtained by FracTracker Alliance through a right-to-know request with the Pennsylvania Department of Environmental Protection.
To our knowledge, the OEPA did not enforce this procedure, instead relying on workers to manually calculate and report spills. Shell’s failure to accurately self-report raises concerns about the safety of the Falcon’s HDD crossings in Ohio, including the crossing beneath the Ohio River, just upstream of drinking water intakes for Toronto and Steubenville, Ohio.
Public water system wells, intakes, and Drinking Water Source Protection Areas nears the Falcon Pipeline Route. Note, the pipeline route may have slightly changed since this map was produced. Source: Ohio EPA
The Falcon is connected to one of Shell’s most high-profile projects: a $6 billion to $10 billion plastic manufacturing plant, commonly referred to as the Shell ethane cracker, in Beaver County, Pennsylvania. These massive projects represent the oil and gas industry’s far-fetched dream of a new age of manufacturing in the region that would revolve around converting fracked gas into plastic, much of which would be exported overseas.
Many in the Ohio River Valley have raised serious concerns over the public health implications of a petrochemical buildout. The United States’ current petrochemical hub is in the Gulf Coast, including a stretch of Louisiana known colloquially as “Cancer Alley” because of the high risk of cancer from industrial pollution.
Construction of the ethane cracker and the Falcon pipeline have forged forward during the COVID-19 pandemic. In another example of the culture of fear at the worksite, several workers expressed concern that speaking publicly about unsafe working conditions that made social distancing impossible would cost them their jobs. Yet the state has allowed work to continue on at the plant, going so far as to grant Shell the approval to continue work without the waiver most businesses had to obtain. As of December 2020, over 274 Shell workers had contracted the coronavirus.
While the oil and gas industry had initially planned several ethane crackers for the region, all companies except for Shell have pulled out or put their plans on hold, likely due to the industry’s weak financial outlook.
A June 2020 report by the Institute for Energy Economics and Financial Analysis (IEEFA), stated that:
Royal Dutch Shell owes a more complete explanation to shareholders and the people of Pennsylvania of how it is managing risk. Shell remains optimistic regarding the prospects for its Pennsylvania Petrochemical Complex in Beaver County, Penn. The complex, which is expected to open in 2021 or 2022, is part of a larger planned buildout of plastics capacity in the Ohio River Valley and the U.S. IEEFA concludes that the current risk profile indicates the complex will open to market conditions that are more challenging than when the project was planned. The complex is likely to be less profitable than expected and face an extended period of financial distress.
Many of Pennsylvania’s elected officials have gone to great lengths to support this project. The Corbett administration enticed Shell to build this plastic factory in Pennsylvania by offering Shell a tax break for each barrel of fracked gas it buys from companies in the state and converts to plastic (valued at $66 million each year). The state declared the construction site a Keystone Opportunity Zone, giving Shell a 15-year exemption from state and local taxes. In exchange, Shell had to provide at least 2,500 temporary construction jobs and invest $1 billion in the state, giving the company an incredible amount of power to decide where resources are allocated in Pennsylvania.
Would the state have asked Shell for more than 2,500 construction jobs if it knew these jobs could be taken away when workers spoke out against life-threatening conditions? Will the politicians who have hailed oil and gas as the only job creator in the region care when workers are forced to hide their identity when communicating with public agencies?
The PA DEP appears to have played a key role in calling for this investigation, yet the agency itself was recently at the center of a different investigation led by Pennsylvania Attorney General Josh Shapiro. The resulting Investigating Grand Jury Report revealed systematic failure by the PA DEP and the state’s Department of Health to regulate the unconventional oil and gas industry. One of the failures was that the Department seldom referred environmental crimes to the Attorney General’s Office, which must occur before the Office has the authority to prosecute.
The Office of Attorney General is involved in this investigation, which the PA DEP is referring to as noncriminal.
The Grand Jury Report also cited concerns about “the revolving door” that shuffled PA DEP employees into higher-paying jobs in the oil and gas industry. The report cited examples of PA DEP employees skirting regulations to perform special favors for companies they wished to be hired by. The watchdog research organization Little Sis listed 47 fracking regulators in Pennsylvania that have moved back and forth between the energy industry, including Shell’s Government Relations Advisor, John Hines.
The Falcon Pipeline sits empty as people across the nation are amping up pressure on President Biden to pursue bold action in pursuit of environmental justice and a just transition to clean energy. Following Biden’s cancellation of the Keystone XL pipeline, Indigenous leaders are calling for him to shut down other projects including Enbridge Line 3 and the Dakota Access Pipeline.
Over a hundred groups representing millions of people have signed on to the Build Back Fossil Free campaign, imploring Biden to create new jobs through climate mobilization. Americans are also pushing Biden to be a Plastic Free President and take immediate action to address plastic pollution by suspending and denying permits for new projects like the Shell ethane cracker that convert fracked gas into plastic.
If brought online, the Falcon pipeline and Shell ethane cracker will lock in decades of more fracking, greenhouse gasses, dangerous pollution, and single-use plastic production.
Just as concerning, Shell will need to tighten its parasitic grip on the state’s economic and legislative landscape to keep this plant running. Current economic and political conditions are not favorable for the Shell ethane cracker: financial analysts report that its profits will be significantly less than originally presented. If the plant is brought online, Shell’s lobbyists and public relations firms will be using every tactic to create conditions that support Shell’s bottom line, not the well-being of residents in the Ohio River Valley. Politicians will be encouraged to pass more preemptive laws to block bans on plastic bags and straws to keep up demand for the ethane cracker’s product. Lobbyists will continue pushing for legislation that imposes harsh fines and felony charges on people who protest oil and gas infrastructure, while oil and gas companies continue to fund police foundations. Shell will ensure that Pennsylvania keeps extracting fossil fuels to feed its ethane cracker.
The Falcon pipeline is at odds with global demands to address plastic and climate crises. As these new documents reveal, it also poses immediate threats to residents along its route. While we’re eager for more information from state and federal agencies to understand the details of this investigation, it’s clear that there is no safe way forward with the Falcon Pipeline.
Royal Dutch Shell has been exerting control over people through the extraction of their natural resources ever since it began drilling for oil in Dutch and British colonies in the 19th Century. What will it take to end its reign?
Health & Safety | Legislation & Politics | Petrochemicals & Plastics | Pipelines
A new collaboration between FracTracker Alliance and Algalita is aiming to help middle school and high school students understand the connection between plastics and fracking — and the wide ranging implications for climate change, environmental injustice, and human health.
Most young people today understand that plastics are problematic. But, there is still often a disconnect between the symptom of plastics in our oceans, and the root causes of the problem. Algalita’s mission is to empower a new generation of critical thinkers to shift the broken and unjust systems that are causing the plastic pollution crisis. Algalita’s strategy is creating educational experiences directly with the movement’s diverse leaders, and this new project with FracTracker is a perfect example.
Specifically, Algalita and FracTracker have been working together to add new lessons to Algalita’s brand-new online, gamified, action platform: Wayfinder Society. Through this program, students can guide their own exploration of the complexities of the plastics issue, and can take action at their own pace and scale, by completing lessons and action-items (called Waymarks) based on difficulty, topic, and type of impact.
The first of two FracTracker Waymarks outlines the connection between fracking and plastic production. Students explore a map showing the full plastics production process from fracking pads, to pipelines, to ethane crackers, and packaging factories.
In a second Waymark that builds off of the first, students explore the massive petrochemical buildout on the Gulf Coast and in the Ohio River Valley. The map allows students to analyze the greenhouse gas emissions predicted for this buildout using the data point pop-up boxes. They can also examine the effects of climate change on communities amongst the buildout by viewing the coastal flood zone areas in Texas and Louisiana. Beyond that, students can investigate how facilities are impacting their peers in schools close to massive ethane cracker facilities. Finally, students are introduced to the movement’s #PlasticFreePresident Campaign, giving them a direct action to apply their new knowledge.
This StoryMap was created by FracTracker for Wayfinder Society, a program by Algalita. Learn more at Algalita.org. Place your cursor over the image and scroll down to advance the StoryMap and explore a series of maps charting the fracking-for-plastic system. Click on the icon in the bottom left to view the legend. Scroll to the end of the StoryMap to learn more and access the data sources.
View Full Sized Map | Updated 11/20
Algalita is excited about this partnership for so many reasons. For one, GIS is a critical skill for young people to learn. These two Waymarks pose an accessible and non-intimidating introduction to ArcGIS by using simple maps and StoryMaps like the one above. The maps let students get comfortable with GIS concepts and capabilities like layers, data attribute tables, measuring tools, and filters. Allowing students to explore how plastics are produced through a geographical lens provides a unique visual and interactive experience for them. The goal is for students to be able to connect petrochem buildout, with the plastics, climate and justice issues that they are focusing on — often separately. Our aim is that by putting this part of the story in context of real physical space they will more easily make those connections. We hope these lessons spark some students’ interest in mapping, geography, and GIS, providing a new generation of changemakers with GIS in their toolbox.
On top of that, we are stoked to be building this partnership with FracTracker because the success of our collective movement depends on strong, clear communication and synergies between the nodes of the movement’s network. The FracTracker Waymarks give our Wayfinders direct access to real-time data, visualizations, and expert insights that they can then use to level-up their actions and stories around their activism. And, they connect the dots not just for students, but also for educators and movement partners like us at Algalita — we are all for this powerful lever for change!
Check out Wayfinder Society here. Access the FracTracker Waymarks here and here — but you’ll need to be logged in. If you’re a student, get started by creating a profile, and then start earning Cairns (points)! If you’re an educator, parent or mentor, and interested in exploring the site, email us here for the guest login.
By Anika Ballent, Education Director, Algalita
Algalita empowers a new generation of critical thinkers who will shift the broken and unjust systems that are causing the plastic pollution crisis. We do this by offering educational experiences created directly with the movement’s diverse leaders.
Anika has been working in the movement against plastic pollution for ten years, studying microplastics in benthic and freshwater environments. She brings together her science background and creativity to educate young changemakers through hands-on experiences in schools, Algalita’s International Youth Summit, and online programs.
Data Sources:
Fracked Wells: Pennsylvania Department of Environmental Protection
ATEX Pipeline: EIA
Railroad: Selection from ArcGIS online
Process information: Houston Chronicle
Falcon Pipeline: Shell/AECOM and FracTracker Alliance
Mariner East 2 Pipeline: PA DEP
Greenhouse gas emission increases: Environmental Integrity Project. (2020, November 30). Emission Increase Database. Retrieved from https://environmentalintegrity.org/oil-gas-infrastructure-emissions.
All other data points were mapped by FracTracker Alliance referencing various online sources. While this map is based on actual infrastructure, it is intended as a model of the fracking-for-plastic lifecycle and certain steps may vary in real life.
It’s been a little over a year since I visited the Texas Gulf Coast to document the oil, gas, and petrochemical landscape with our partners at LightHawk and Scott Humphries, an amazing pilot and Houston native.
Much has happened since then – in regard to and because of – the Gulf Coast’s petrochemical industry.
The fossil fuel landscape along the Gulf Coast is broad, and its impact is heavy.
The area has seen a massive build out over the last five years. New plastics and steel manufacturing facilities and pipelines from the Permian Basin that transport crude to ever-expanding tank farms and marine terminals – all with the blessings of local economic development groups and local government, despite known present and potential hazards.
As these developments continue, communities and workers pay the price. An incident in early December, 2020 left workers injured after a condensate fire at a Citgo tank farm in Corpus Christi. Before that, a pipeline explosion on August 20th in the Corpus Christi Ship Channel resulted in four deaths, with only two of those bodies recovered.
Channels of Life, below, is a short video looking at what is already on the ground, and what is on the horizon. Whether you are pleasure-boating in the channels or driving down the highway, you only see the edge of industrial sprawl that already exists. The depth of the incursion is not visible from the ground. Further down in an interactive Story Map, we give you a rare look from above, while pinpointing various incidents and facilities of concern. Partnering with LightHawk, we flew from Port Aransas, up the La Quinta Channel to the Nueces Delta, and ending at Refinery Row, giving you a bird’s-eye view of the sprawling fossil fuel landscape.
How much more industrial saturation can the Coastal Bend’s public health and ecosystem withstand before it is all sacrificed?
Is it destined to become a sacrifice zone for increasing corporate wealth and prestige?
In many parts of Texas – as well as in Louisiana and New Mexico – oil, gas, and petrochemical facilities abut schools, backyards, and playgrounds. The Gulf Coast contains 95% of the country’s ethylene capacity and roughly half of the country’s petroleum refining and natural gas processing capacity. This development has propelled a new wave of petroleum and petrochemical infrastructure in recent years. There are 129 planned or recently completed petrochemical facilities in TX and LA alone.
This buildout has enormous consequences for the country’s greenhouse gas emissions, including intensifying climate change; increasing production of (often radioactive) waste and the need for its disposal; and discharging dangerous pollution into frontline communities where health has already been compromised by industry activities.
As the sacrifice builds and the losses mount, economic development corporations advertise the area as prime real estate for more facilities and infrastructure – even as markets steadily move away from fossil fuels. Exports are a tenuous lifeline for an industry drowning in an oversupply of oil and gas, but advocates like the Port of Corpus Christi Authority insist on proposing, financing, and constructing new crude oil and liquefied natural gas (LNG) export terminals along the Gulf Coast, including the BlueWater and GulfLink terminals.
Even with access to global markets, the outlook for this Gulf Coast petrochemical expansion doesn’t look great. Countries that planned to import the US’ fossil fuels are withdrawing interest, citing climate concerns. Major projects are being abandoned, like the petrochemical facility Project Falcon that SABIC had planned to build near Aransas Pass. Frontline communities that have suffered devastating health impacts from the industry for too long are calling out environmental racism and causing major delays for new facilities.
These Texan sites are further captured in the Story Map below, as are the footprints of countless other existing and proposed petrochemical infrastructure sites, from the frac sand mines south of San Antonio down into Corpus Christi Bay, the mushrooming industry along the La Quinta Channel, up the Gulf Coast to Freeport, and finally along the always hectic Houston Ship Channel that empties out into Galveston Bay.

Left to Right: Corpus Christi native and Coastal Alliance to Protect Our Environment (CAPE) member Dewey Magee, FracTracker Alliance’s Ted Auch, and LightHawk pilot Scott Humphries stand outside Scott’s Beechcraft Bonanza A-36 at McCampbell-Porter Airport in Aransas Pass, TX, November 11th, 2019. Photo by Errol Summerlin
The View of Corpus Christi’s Petrochemical Corridor along La Quinta Channel and Tule Lake Shipping Channel from 200’ above McCampbell-Porter Airport in Aransas Pass, TX, November 11th, 2019. Photo by Ted Auch, FracTracker Alliance
I reached out to pilot and native Houstonian Scott Humphries for his thoughts on what he expected and what he gleaned from our flight. He wrote the following:
Question #1: What about our proposed flight interested you as a Texan and/or Houstonian – or just more generally – what interested you about this mission?
I’ve always tried to be environmentally conscious, and always try to have, “think globally, act locally” rummaging around in my head, but this mission (and affiliating with LightHawk generally) presented an opportunity for me to try to (hopefully) have a little more impact than just personally recycling, outlawing Styrofoam cups at our office, etc. Separately, as a longtime Houstonian, I’ve always been proud to live and work in what many refer to as the “Energy Capital of the World.” This mission seemed a useful way to do some small part to help make sure that title continues to be held responsibly.
Question #2: After conducting the flights, or as they were happening, did you learn anything, or have any thoughts that surprised you or realizations about anything particular?
I have flown along the Gulf Coast (including to/from Houston/Corpus Christi) many, many times, and if you’d asked me before this mission, I would have said, ‘Sure, there’s a decent amount of industry along that part of the coast.’ What surprised me while we were flying was two things: (1) there’s not just a decent amount of industry along that part of the coast; rather, along that route, even flying low, you’re rarely – if ever – out of sight of a significant facility of some kind, and (2) the size of the facilities – in other circumstances I’d have been flying much higher and wouldn’t get a good sense of the size of the pads. Flying as we were at just over 1000′, it was striking how massive the various plants were, both in Corpus Christi Bay and along the coast.
Another perspective on this flight and the area we flew over comes from Kevin Sims, Aransas Bay Birding Charters Operator whose Whooping Crane and Pink Spoonbill photos we feature in the story map below. Kevin has been plying the waters in and around Aransas Wildlife Refuge since 1972, and when I contacted him about using some of his photos, he told me the following:
“We need the desalination plants, but the planned discharge points are going to cripple our ecology and the business that rely on it for tourism. They could’ve discharged offshore, but instead they are discharging into the bay, and if it gets too salty the crab populations will plummet, and everything around here depends on crabs and shrimp. If we have a constant influx of brine it could really cripple us. I went to a fantastic meeting from Texas A&M, and their science told them that if red fish larvae migrated into the [Aransas Pass] shipping channel and hit a wall of salty water, they wouldn’t go further, and their population would crash. But despite these facts, they’ve chosen to discharge into the La Quinta Channel, and that is bad news! They were having fairly regular meetings on all of these proposals prior to COVID, but once COVID hit, they went all remote, and less people knew when the meetings were, and the meeting details weren’t widely disseminated … So, the next thing we knew, everything was passed, and they’re gonna [sic] go ahead and do [all of] it.
My perspective comes from a lifetime of fishing and observing the Whooping Crane, and watching them progress from 157 eighteen years ago, to 507 at the present time. Well, I feel this will threaten an endangered species that they’ve been trying to bring back from the brink of extinction since the 1940s. I can remember my dad showing me the cranes in the mid-70s, and there were only 52-55. All of the projects you are mapping have the potential to decimate all the progress made, not to mention money spent on Whooping Crane recovery. From my perspective, it’s a catch-22, ‘cause [sic] the big cities take the water out of the river, and they don’t have the inflows into the bays that they did in the past. We also don’t have the rains that we used to have. The desalination plants would relieve some of that pressure if they would just put that brine offshore. The other species of concern to my industry is the Pink Spoonbills, but the Whooping Crane is the main draw.”
This Story Map illustrates the impacts of oil and gas infrastructure from San Antonio down to Corpus Christi, and then up the Gulf Coast to Houston.
The map displays aerial photographs of infrastructure, from frac sand mines and refineries, to chemical plants and offshore drill rig construction sites. This map includes CO2 emissions from oil and gas infrastructure from 2010 – 2018 (weighted by total CO2 during this period in orange), and/or oil refineries and their myriad products (weighted by capacity in black [barrels/day oil equivalents]).
The Story Map also presents detailed information and locations for proposed petrochemical infrastructure in the Corpus Christi Bay region, courtesy of Errol Summerlin and our partners at Coastal Alliance to Protect Our Environment (CAPE). These proposals include dredging projects needed to accommodate more traffic from larger tanker ships, as well as desalination facilities that would collectively intake 758 million gallons of Corpus Christi Bay water each day, and discharge 507 million gallons of brine per day, with an average of 95 and 64 million gallons of desalinated water produced daily, respectively.
The perforated yellow line is the flight path we took with our LightHawk partners. When the viewer scrolls into any given region, they will see SkyTruth incident alerts within five miles of our flight path. The two examples cited at the beginning of this article are just a couple of the nearly 760 such incidents in just the Corpus Christi Shipping Channel since 2011, according to data provided by SkyTruth.
The most recent data in this map is Whooping Crane locations and number counts in TX as of November 2020, courtesy of The Cornell Lab of Ornithology’s eBird data portal. This data speaks to the concerns of Mr. Sims and many of his colleagues who rely on the Whooping Crane’s attraction to birders internationally, and it also highlights that the projects photographed and in the works across Corpus Christi Bay will not just negatively affect the human communities, but will have far reaching impacts on the ecosystems of the western Gulf, and the industries that have relied on these ecosystems for all manner of ecosystems services.
We recommend viewing this map in full screen
Decades of oil and gas development have created a dependency on extractive industries, which has in turn hindered community health and stability.
The Port of Corpus Christi’s controversial dock expansion and Harbor Bridge replacement project at the southern end of Refinery Row has taken over community land and eclipsed their fight to protect their neighborhoods and their public health. Even after an environmental review, the preferred route cuts through these neighborhoods that are surrounded by industry, interstates, and waste treatment facilities – isolated from other residences, and subjected to heavy pollution, noise, and constant hazard.
But with interest and investments declining in the fossil fuel industry and overproduction keeping prices low, the future of the Gulf Coast, its people, environment, and industrial landscape is uncertain – but resistance to extractive industry is strong.
Several activists and environmental coalitions are fighting this project and the industrial onslaught for the health of their communities. For more information on how to support their vision, visit our friends at Coastal Alliance to Protect our Environment (CAPE) and Texas Environmental Justice Advocacy Services (TEJAS).
This video, Story Map and article were produced with much gratitude and appreciation for our partners at LightHawk, as well as the support and resources of Scott Humphries, Kevin Sims, and Errol Summerlin.
In this article, we’ll take a look at the current trend in “re-branding” incineration as a viable option to deal with the mountains of garbage generated by our society. Incineration can produce energy for electricity, but can the costs—both economically, and ecologically—justify the benefits? What are the alternatives?
In today’s world of consumerism and production, waste disposal is a chronic problem facing most communities worldwide. Lack of attention to recycling and composting, as well as ubiquitous dependence on plastics, synthetics, and poorly-constructed or single-use goods has created a waste crisis in the United States. So much of the waste that we create could be recycled or composted, however, taking extraordinary levels of pressure off our landfills. According to estimates in 2017 by the US Environmental Protection Agency (EPA), over 30 percent of municipal solid waste is made up of organic matter like food waste, wood, and yard trimmings, almost all of which could be composted. Paper, glass, and metals – also recyclable – make up nearly 40 percent of the residential waste stream. Recycling plastic, a material which comprises 13% of the waste stream, has largely been a failed endeavor thus far.
Why say NO to incinerators?
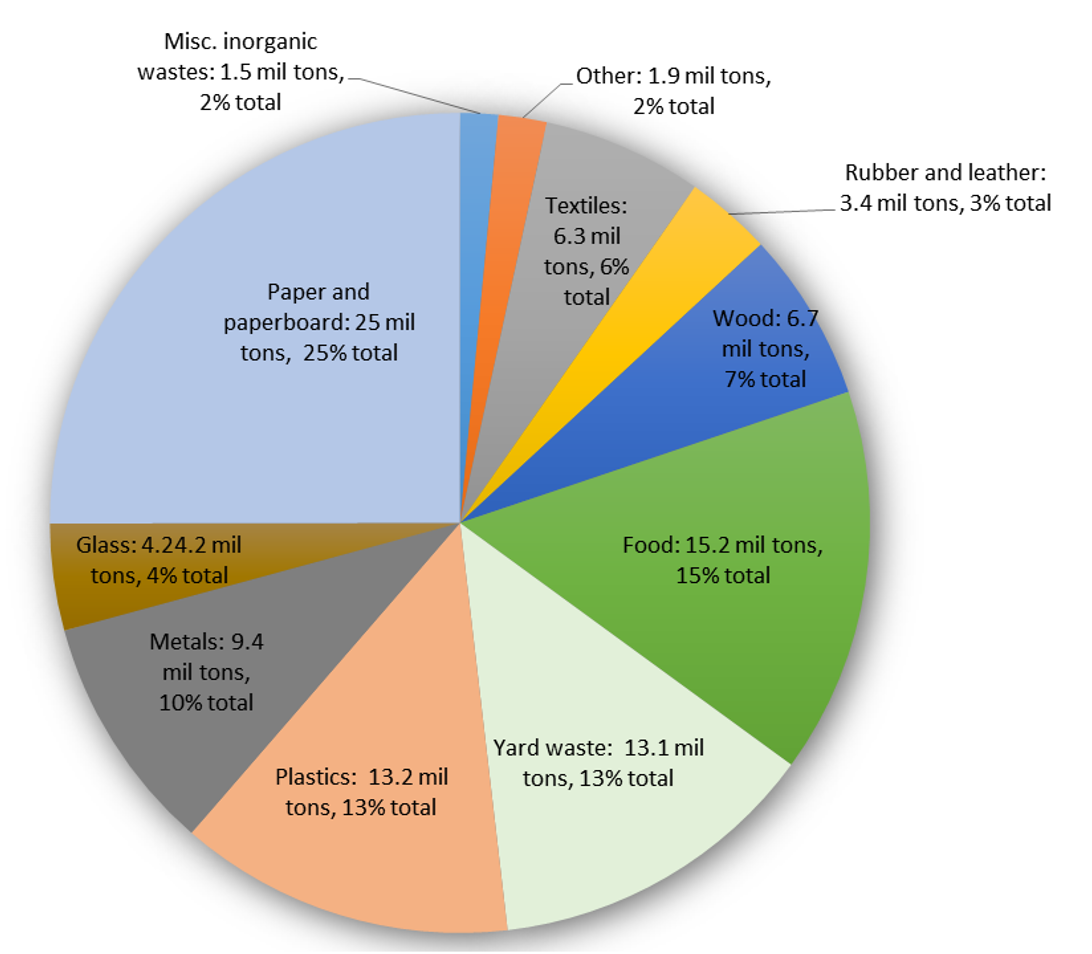
Figure 1: A breakdown of the 267.78 million tons of municipal waste that were generated in the US in 2017. Source: figure developed by FracTracker Alliance, based on 2017 EPA data. Source: https://www.epa.gov/facts-and-figures-about-materials-waste-and-recycling/national-overview-facts-and-figures-materials
Nevertheless, of the approximately 400 million tons of plastic produced annually around the world, only about 10% of it is recycled. The rest winds up in the waste stream or as microfragments (or microplastics) in our oceans, freshwater lakes, and streams.
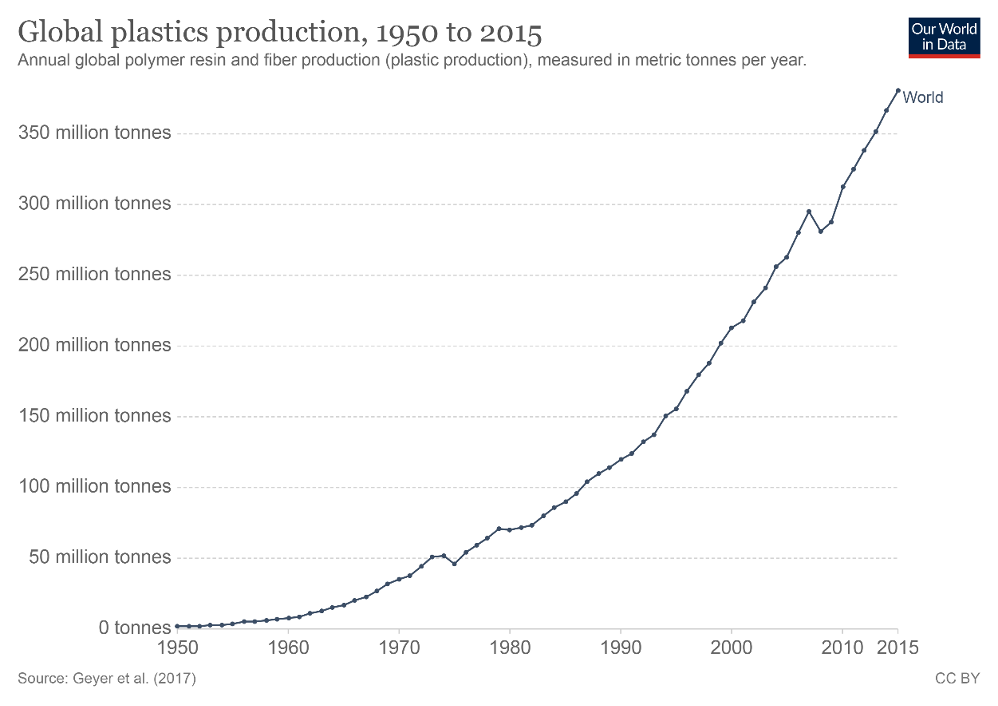
Figure 2: Increase in global plastics production, 1950-2015, Source: Geyer, R., Jambeck, J. R., & Law, K. L. (2017). Production, use, and fate of all plastics ever made. Science Advances, 3(7), e1700782. Available at: http://advances.sciencemag.org/content/3/7/e1700782 Referenced in https://ourworldindata.org/plastic-pollution
According to an EPA fact sheet, by 2017, municipal solid waste generation increased three-fold compared with 1960. In 1960, that number was 88.1 million tons. By 2017, this number had risen to nearly 267.8 million tons. Over that same period, per-capita waste generation rose from 2.68 pounds per person per day, to 4.38 pounds per person per day, as our culture became more wed to disposable items.
The EPA provides a robust “facts and figures” breakdown of waste generation and disposal here. In 2017, 42.53 million tons of US waste was shipped to landfills, which are under increasing pressure to expand and receive larger and larger loads from surrounding area, and, in some cases, hundreds of miles away.
On average, in 2017, Americans recycled and composted 35.2% of our individual waste generation rate of 4.51 pounds per person per day. While this is a notable jump from decades earlier, much of the gain appears to be in the development of municipal yard waste composting programs. Although the benefits of recycling are abundantly clear, in today’s culture, according to a PEW Research Center report published in 2016, just under 30% of Americans live in communities where recycling is strongly encouraged. An EPA estimate for 2014 noted that the recycling rate that year was only 34.6%, nationwide, with the highest compliance rate at 89.5% for corrugated boxes.
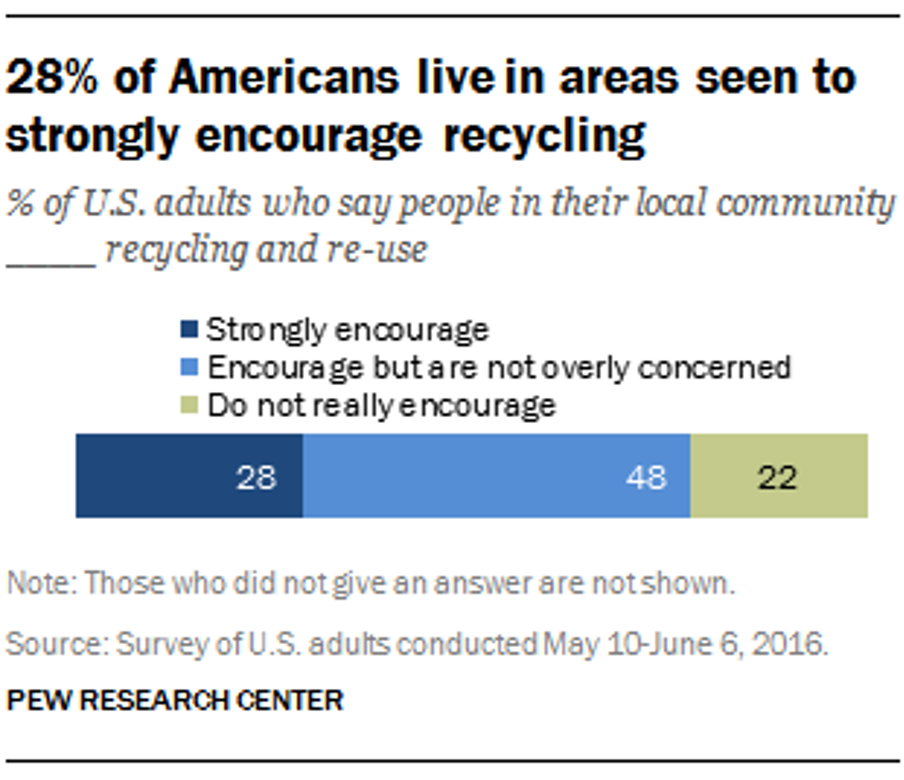
Figure 3. Percent of Americans who report recycling and re-use behaviors in their communities, via Pew Research center
Historically, incineration – or burning solid waste – has been one method for disposing of waste. And in 2017, this was the fate of 34 million tons—or nearly 13%– of all municipal waste generated in the United States. Nearly a quarter of this waste consisted of containers and packaging—much of that made from plastic. The quantity of packaging materials in the combusted waste stream has jumped from only 150,000 tons in 1970 to 7.86 million tons in 2017. Plastic, in its many forms, made up 16.4% of all incinerated materials, according to the EPA’s estimates in 2017.
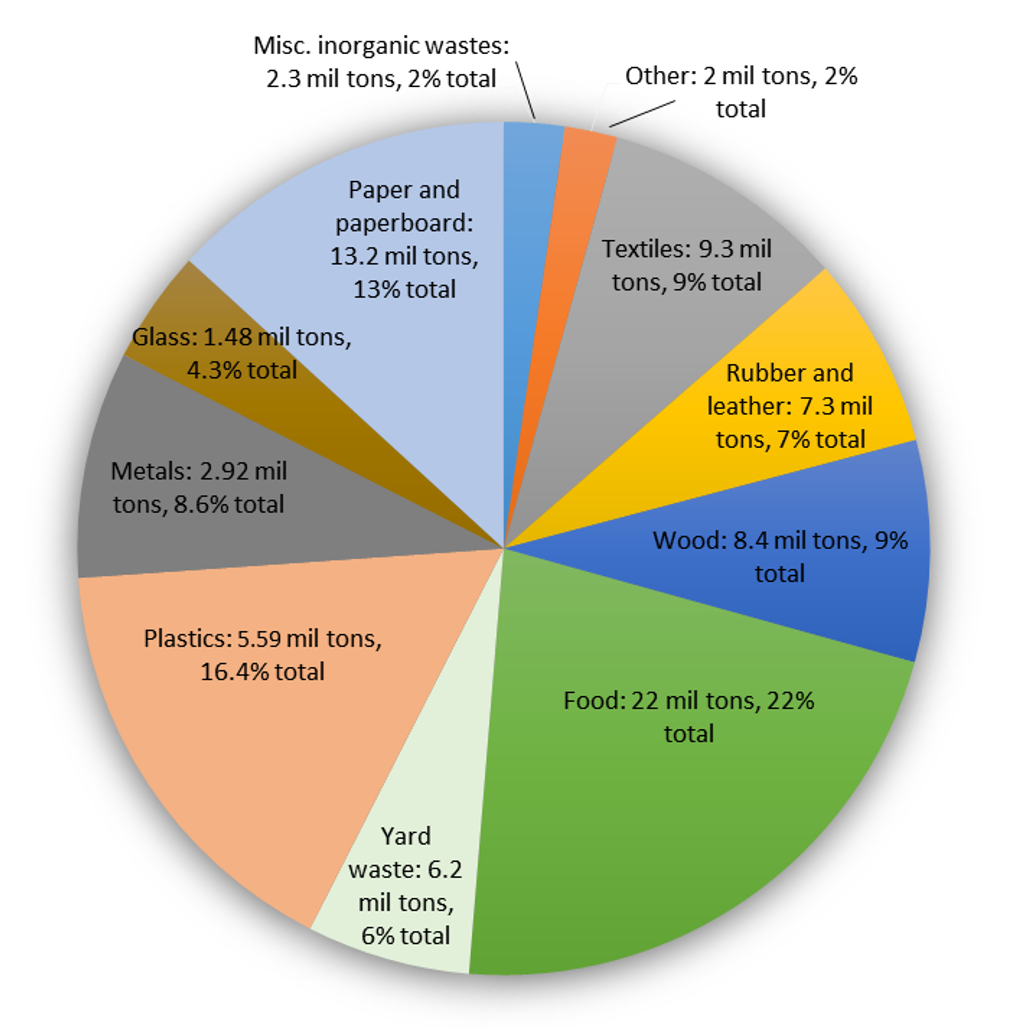
Figure 4: A breakdown of the 34.03 tons of municipal waste incinerated for energy in the US in 2017
Sadly, the answer is this: The oil and gas industry produces copious amounts of ethane, which is a byproduct of oil and gas extraction. Plastics are an “added value” component of the cycle of fossil fuel extraction. FracTracker has reported extensively on the controversial development of ethane “cracker” plants, which chemically change this extraction waste product into feedstock for the production of polypropylene plastic nuggets. These nuggets, or “nurdles,” are the building blocks for everything from fleece sportswear, to lumber, to packaging materials. The harmful impacts from plastics manufacturing on air and water quality, as well as on human and environmental health, are nothing short of stunning.
FracTracker has reported extensively on this issue. For further background reading, explore:
A report co-authored by FracTracker Alliance and the Center for Environmental Integrity in 2019 found that plastic production and incineration in 2019 contributed greenhouse gas emissions equivalent to that of 189 new 500-megawatt coal power plants. If plastic production and use grow as currently planned, by 2050, these emissions could rise to the equivalent to the emissions released by more than 615 coal-fired power plants.
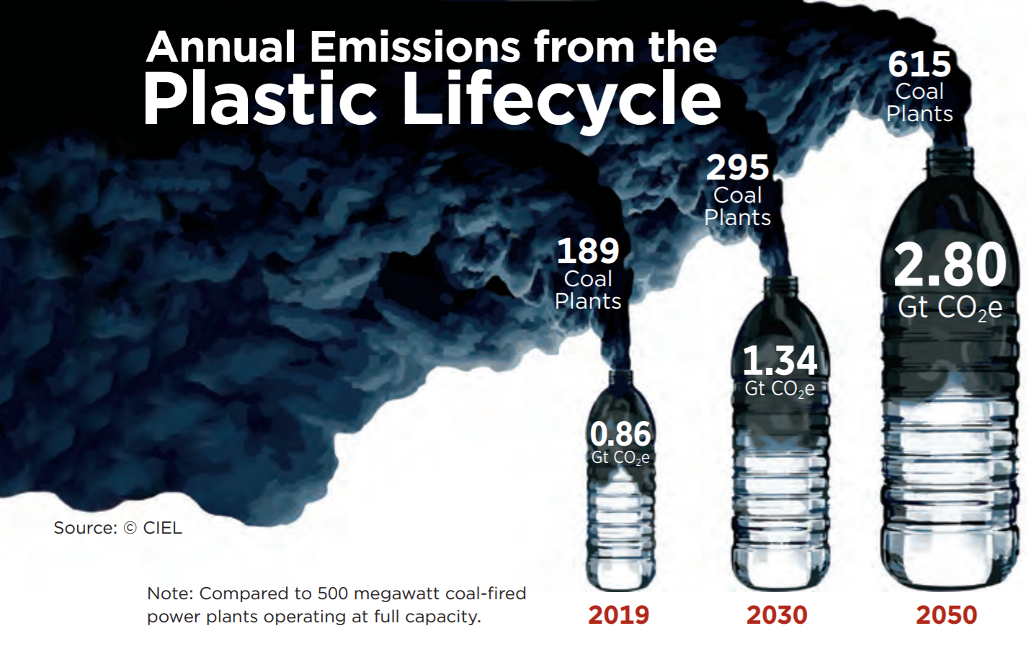
Figure 5: Projected carbon dioxide equivalencies in plastics emissions, 2019-2050. Source: Plastic and Climate https://www.ciel.org/plasticandclimate/
Incineration is now strongly critiqued as a dangerous solution to waste disposal as more synthetic and heavily processed materials derived from fossils fuels have entered the waste stream. Filters and other scrubbers that are designed to remove toxins and particulates from incineration smoke are anything but fail-safe. Furthermore, the fly-ash and bottom ash that are produced by incineration only concentrate hazardous compounds even further, posing additional conundrums for disposal.
Incineration as a means of waste disposal, in some states is considered a “renewable energy” source when electricity is generated as a by-product. Opponents of incineration and the so-called “waste-to-energy” process see it as a dangerous route for toxins to get into our lungs, and into the food stream. In fact, Energy Justice Network sees incineration as:
… the most expensive and polluting way to make energy or to manage waste. It produces the fewest jobs compared to reuse, recycling and composting the same materials. It is the dirtiest way to manage waste – far more polluting than landfills. It is also the dirtiest way to produce energy – far more polluting than coal burning.
Waste incineration has been one solution for disposing of trash for millennia. And now, aided by technology, and fueled by a crisis to dispose of ever-increasing trash our society generates, waste-to-energy (WTE) incineration facilities are a component in how we produce electricity.
But what is a common characteristic of the communities in which WTEs are sited? According to a 2019 report by the Tishman Environmental and Design Center at the New School, 79% of all municipal solid waste incinerators are located in communities of color and low-income communities. Incinerators are not only highly problematic environmentally and economically. They present direct and dire environmental justice threats.
Click here to view this map full-screen
![]()
Activate the Layers List button to turn on Environmental Justice data on air pollutants and cancer occurrences across the United States. We have also included real-time air monitoring data in the interactive map because one of the health impacts of incineration includes respiratory illnesses. These air monitoring stations measure ambient particulate matter (PM 2.5) in the atmosphere, which can be a helpful metric.
These trash incinerators capture energy released from the process of burning materials, and turn it into electricity. But what are the costs? Proponents of incineration say it is a sensible way to reclaim or recovery energy that would otherwise be lost to landfill disposal. The US EIA also points out that burning waste reduces the volume of waste products by up to 87%.
The down-side of incineration of municipal waste, however, is proportionally much greater, with a panoply of health effects documented by the National Institutes for Health, and others.
Dioxins (shown in Figures 6-11) are some of the most dangerous byproducts of trash incineration. They make up a group of highly persistent organic pollutants that take a long time to degrade in the environment and are prone to bioaccumulation up the food chain.
Dioxins are known to cause cancer, disrupt the endocrine and immune systems, and lead to reproductive and developmental problems. Dioxins are some of the most dangerous compounds produced from incineration. Compared with the air pollution from coal-burning power plants, dioxin concentrations produced from incineration may be up to 28 times as high.

2,3,7,8-Tetrachlorodibenzo-p-dioxin

2,3,7,8-Tetrachlorodibenzofuran

3,3′,4,4′,5,5′-Hexachlorobiphenyl

Figures 6-11: Dioxin chemical structures via US EPA. Source: https://www.epa.gov/dioxin/learn-about-dioxin
Federal EPA regulations between 2000 and 2005 resulted in the closure of nearly 200 high dioxin emitting plants. Currently, there are fewer than 100 waste-to-energy incinerators operating in the United States, all of which are required to operate with high-tech equipment that reduces dioxins to 1% of what used to be emitted. Nevertheless, even with these add-ons, incinerators still produce 28 times the amount of dioxin per BTU when compared with power plants that burn coal.
Even with pollution controls required of trash incinerators since 2005, compared with coal-burning energy generation, incineration still releases 6.4 times as much of the notoriously toxic pollutant mercury to produce the equivalent amount of energy.
Energy Justice Network, furthermore, notes that incineration is the most expensive means of managing waste… as well as making energy. This price tag includes high costs to build incinerators, as well as staff and maintain them — exceeding operation and maintenance costs of coal by a factor of 11, and nuclear by a factor of 4.2.
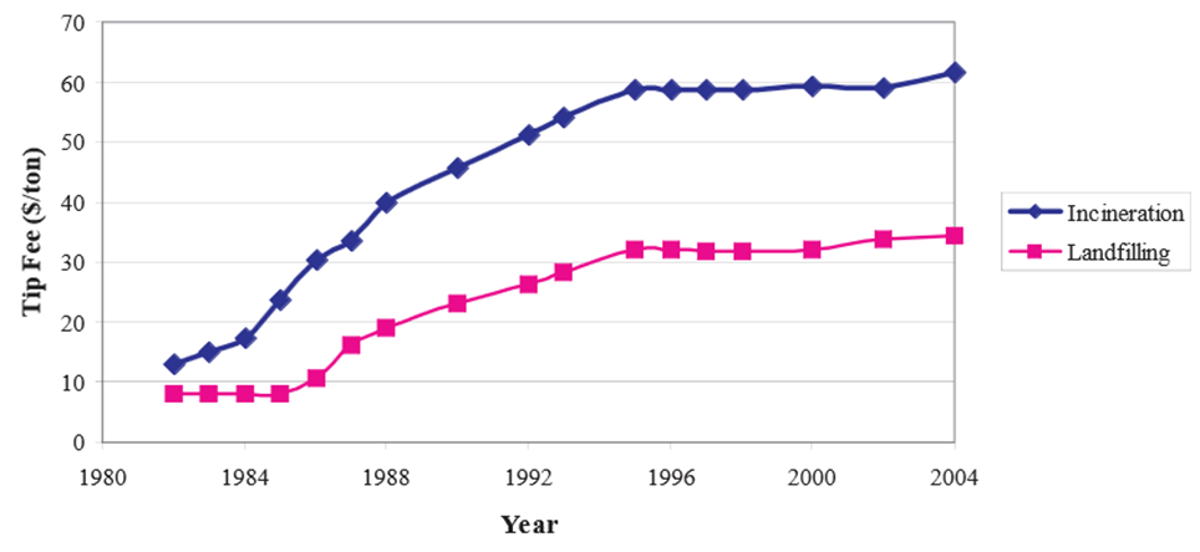
Figure 12. Costs of incineration per ton are nearly twice that of landfilling. Source: National Solid Waste Management Association 2005 Tip Fee Survey, p. 3.
Energy Justice Network and others have pointed out that the amount of energy recovered and/or saved from recycling or composting is up to five times that which would be provided through incineration.
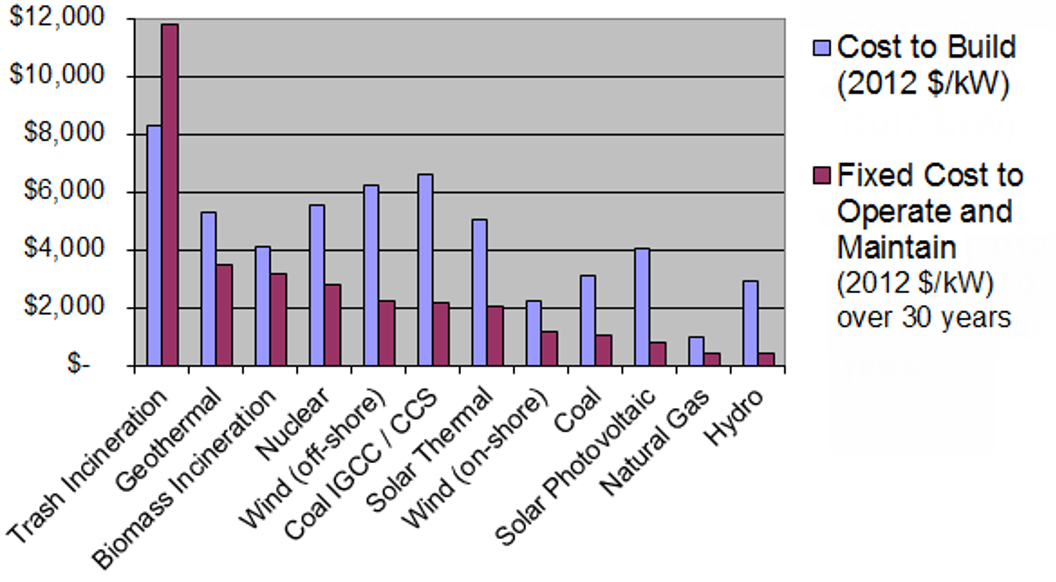
Figure 13. Estimated power plant capital and operating costs. Source: Energy Justice Network
Waste is a “renewable” resource only to the extent that humans will continue to generate waste. In general, the definition of “renewable” refers to non-fossil fuel based energy, such as wind, solar, geothermal, wind, hydropower, and biomass. Synthetic materials like plastics, derived from oil and gas, however, are not. Although not created from fossil fuels, biologically-derived products are not technically “renewable” either.
ZeroWasteEurope argues that:
Biogenic materials you find in the residual waste stream, such as food, paper, card and natural textiles, are derived from intensive agriculture – monoculture forests, cotton fields and other “green deserts”. The ecosystems from which these materials are derived could not survive in the absence of human intervention, and of energy inputs from fossil sources. It is, therefore, more than debatable whether such materials should be referred to as renewable.
Although incineration may reduce waste volumes by up to 90%, the resulting waste-products are problematic. “Fly-ash,” which is composed of the light-weight byproducts, may be reused in concrete and wallboard. “Bottom ash” however, the more coarse fraction of incineration—about 10% overall—concentrates toxins like heavy metals. Bottom-ash is disposed of in landfills or sometimes incorporated into structural fill and aggregate road-base material.
Trash incineration accounts for a fraction of the power produced in the United States. According to the United States Energy Information Administration, just under 13% of electricity generated in the US comes from burning of municipal solid waste, in fewer than 65 waste-to-energy plants nation-wide. Nevertheless, operational waste-to-incineration plants are found throughout the United States, with a concentration east of the Mississippi.
According to EnergyJustice.net’s count of waste incinerators in the US and Canada, currently, there are:
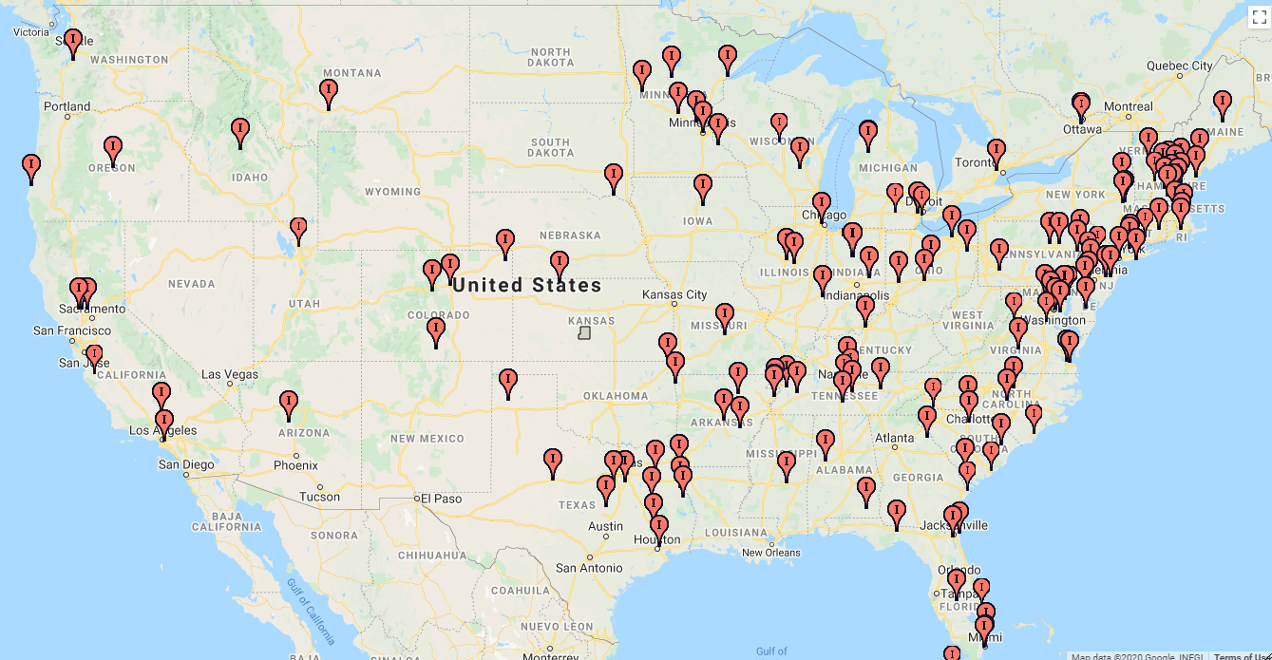
Figure 14. Locations of waste incinerators that are already shut down. Source: EnergyJustice.net)
Precise numbers of these incinerators are difficult to ascertain, however. Recent estimates from the federal government put the number of current waste-to-energy facilities at slightly fewer: EPA currently says there are 75 of these incinerators in the United States. And in their database, updated July 2020, the United States Energy Information Administration (EIA), lists 63 power plants that are fueled by municipal solid waste. Of these 63 plants, 40—or 66%—are in the northeast United States.
Regardless, advocates of clean energy, waste reduction, and sustainability argue that trash incinerators, despite improvements in pollution reduction over earlier times and the potential for at least some electric generation, are the least effective option for waste disposal that exists. The trend towards plant closure across the United States would support that assertion.
Let’s take a look at the dirty details on WTE facilities in three states in the Northeastern US.
In NYS, there are currently 11 waste-to-energy facilities that are operational, and two that are proposed. Here’s a look at some of them:
The largest waste-to-energy facility in New York State, Covanta Hempstead Company (Nassau County), was built in 1989. It is a 72 MW generating plant, and considered by Covanta to be the “cornerstone of the town’s integrated waste service plan.”
According to the Environmental Protection Agency’s ECHO database, this plant has no violations listed. Oddly enough, even after drawing public attention in 2009 about the risks associated with particulate fall-out from the plant, the facility has not been inspected in the past 5 years.
Other WTE facilities in New York State include the Wheelabrator plant located in Peekskill (51 MW), Covanta Energy of Niagara in Niagara Falls (32 MW), Convanta Onondaga in Jamesville (39 MW), Huntington Resource Recovery in Suffolk County (24.3 MW), and the Babylon Resource Recovery Facility also in Suffolk County (16.8 MW). Five additional plants scattered throughout the state in Oswego, Dutchess, Suffolk, Tioga, and Washington Counties, are smaller than 15 MW each. Of those, two closed and one proposal was defeated.
In Pennsylvania, six WTE facilities are currently operating. Two have been closed, and six defeated.
And in New Jersey, there are currently four operating WTE facilities. Essex County Resource Recovery Facility, is New Jersey’s largest WTE facility. It opened in 1990, houses three burners, and produces 93 MW total.
Union County Resource Recovery Facility, which opened in 1994, operates three burners, producing 73 MW total. Covanta Camden Energy Recovery Center opened in 1991. It has 13 burners, producing a total of 46 MW. Wheelabrator Gloucester LP (Westville, NJ) opened in 1990. The two burners there produce 21 MW of power. Covanta Warren Energy is the oldest and smallest WTE facility in New Jersey. It produced 14 MW of energy and opened in 1988. Operations are currently shut down, but this closure may not be permanent.
Looming large above the arguments about appropriate siting, environmental justice, financial gain, and energy prices, is a bigger question:
How can we continue to live on this planet at our current rates of consumption, and the resultant waste generation?
The issue here is not so much about the sources of our heat and electricity in the future, but rather “How MUST we change our habits now to ensure a future on a livable planet?”
Professor Paul Connett (emeritus, St. Lawrence University), is a specialist in the build-up of dioxins in food chains, and the problems, dangers, and alternatives to incineration. He is a vocal advocate for a “Zero Waste” approach to consumption, and suggests that every community embrace these principles as ways to guide a reduction of our waste footprint on the planet. The fewer resources that are used, the less waste is produced, mitigating the extensive costs brought on by our consumptive lifestyles. Waste-to-energy incineration facilities are just a symptom of our excessively consumptive society.
Dr. Connett suggests these simple but powerful methods to drastically reduce the amount of materials that we dispose — whether by incineration, landfill, or out the car window on a back-road, anywhere in the world:
Connett’s Zero Waste charge to industry is this: “If we can’t reuse, recycle, or compost it, industry shouldn’t be making it.” Reducing our waste reduces our energy footprint on the planet.
In a similar vein, FracTracker has written about the potential for managing waste through a circular economics model, which has been successfully implemented by the city of Freiburg, Germany. A circular economic model incorporates recycling, reuse, and repair to loop “waste” back into the system. A circular model focuses on designing products that last and can be repaired or re-introduced back into a natural ecosystem.
This is an important vision to embrace. Every day. Everywhere.
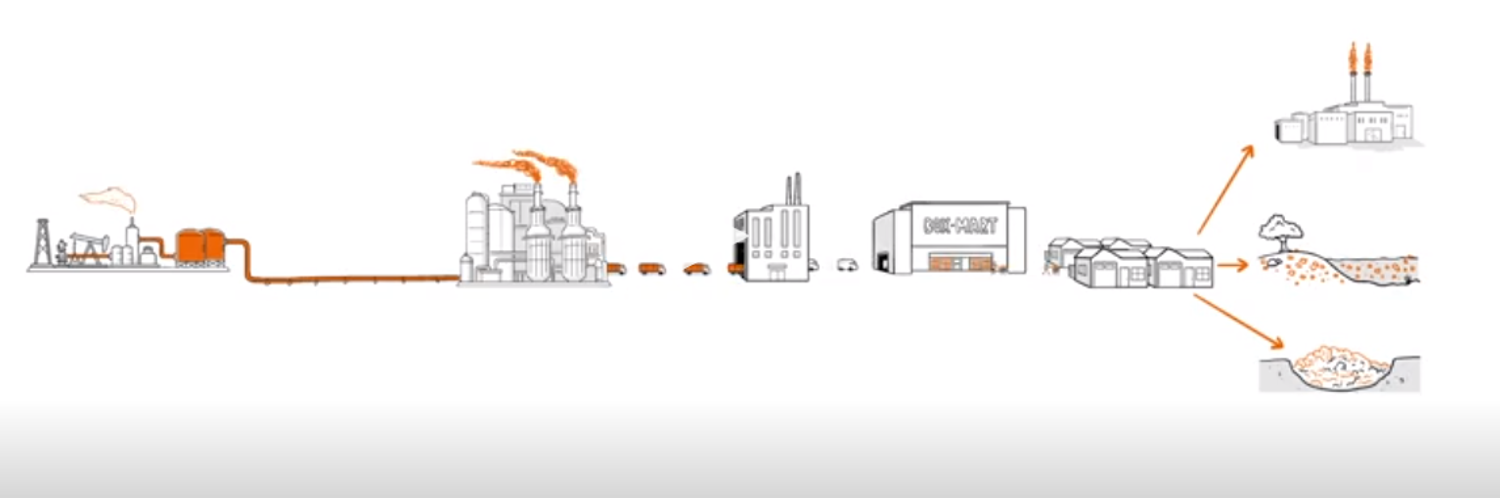
Figure 17: Illustration of common waste streams from “The Story of Plastic” (https://www.storyofplastic.org/)
By Karen Edelstein, Eastern Program Coordinator
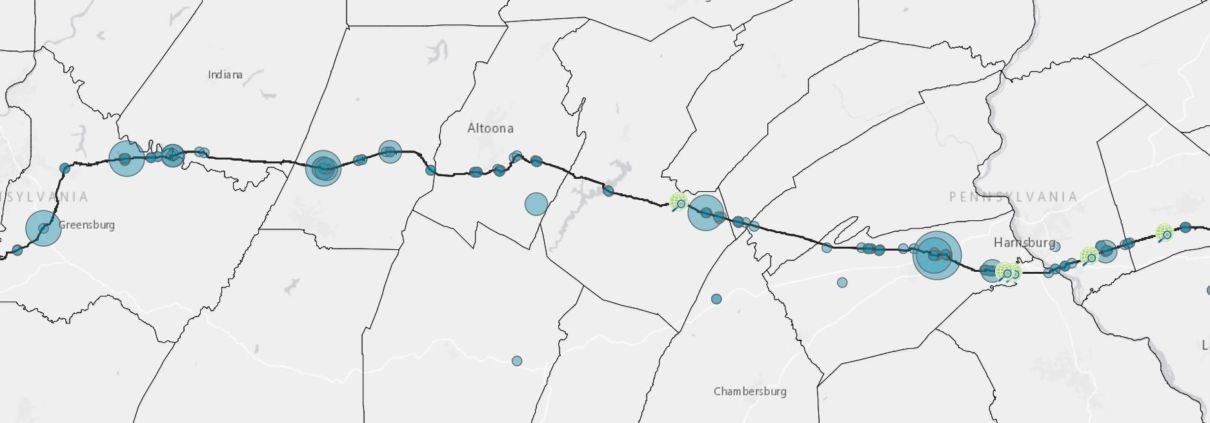
FracTracker Alliance has released a new map of drilling fluid spills along the Mariner East 2 pipeline route, showing 320 spills from its construction since 2017. Of those, a combined 147 incidents have released over 260,000 gallons of drilling fluid into Pennsylvania waterways.
The unpermitted discharge of drilling fluid, considered “industrial waste,” into waters of the Commonwealth violates The Clean Streams Law.
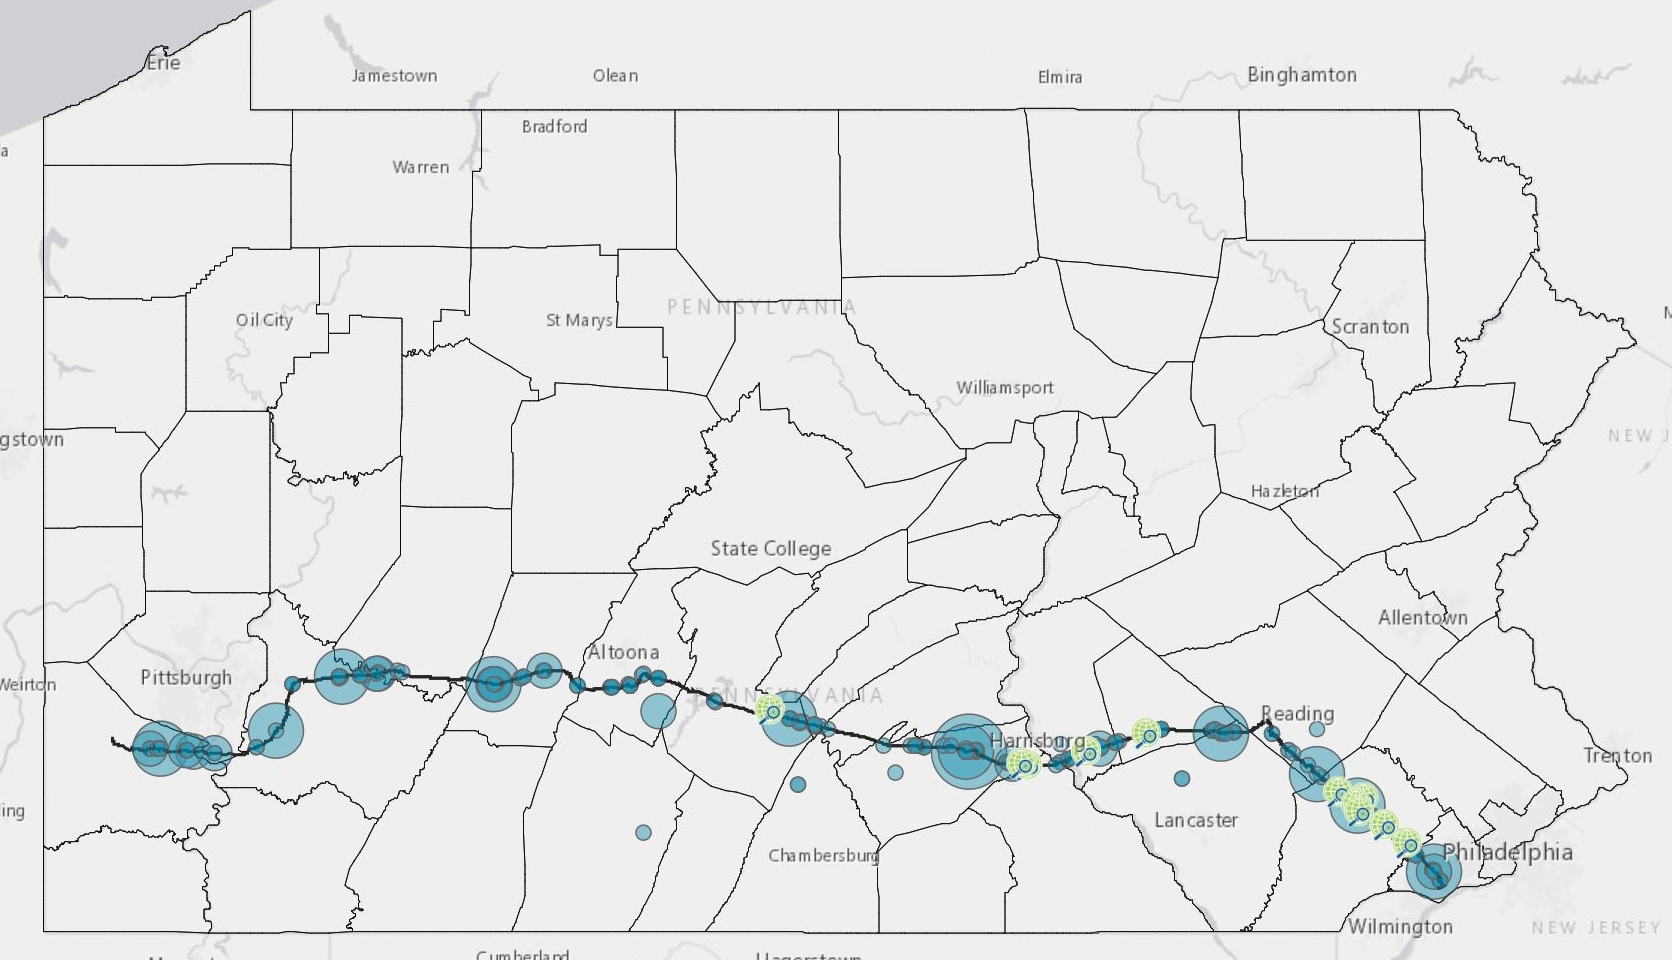
While the total reported volume of drilling fluid released into the environment from the pipeline’s construction is between 344,590 – 405,990 gallons, the actual total is larger, as there are 28 spills with unknown volumes. Spills of drilling mud are also referred to as “inadvertent returns,” or “frac-outs.”
Most of these spills occurred during implementation of horizontal directional drills (HDD). HDDs are used to install a pipeline under a waterway, road, or other sensitive area. This technique requires large quantities of drilling fluid (comprising water, bentonite clay, and chemical additives), which when spilled into the environment, can damage ecosystems and contaminate drinking water sources.
The Mariner East 2 pipeline project is part of the Mariner East pipeline system, which carries natural gas liquids (NGLs) extracted by fracked wells in the Ohio River Valley east, to the Marcus Hook Facility in Delaware County, Pennsylvania. The NGLs will then go to Europe to be turned into plastic. Explore FracTracker’s other resources on this project:
There have been 36 spills since the Commonwealth shutdown statewide on March 16th, 2020, leaks that have jeopardized drinking water sources, putting communities at even higher risk during the COVID-19 pandemic.
The most concerning occurred on August 10th, when pipeline construction released 8,163 gallons of drilling fluids into a wetland and stream system that drains into Marsh Creek Lake in Chester County, a drinking water reservoir (Figure 1). The Department of Environmental Protection (DEP), Pennsylvania Fish and Boat Commission, private contractors, and the Department of Conservation and Natural Resources are responding to the incident and conducting water tests.
On August 11th, construction caused a 15-foot wide and eight-foot deep subsidence event in the wetland (Figure 1). This caused drilling fluid to flow underground and contaminate groundwater, while also “adversely impacting the functions and values of the wetland.” Thirty-three acres of the lake are now closed to boating, fishing, and other uses of the lake — an extra blow, given the solace state parks have provided to many during this pandemic.
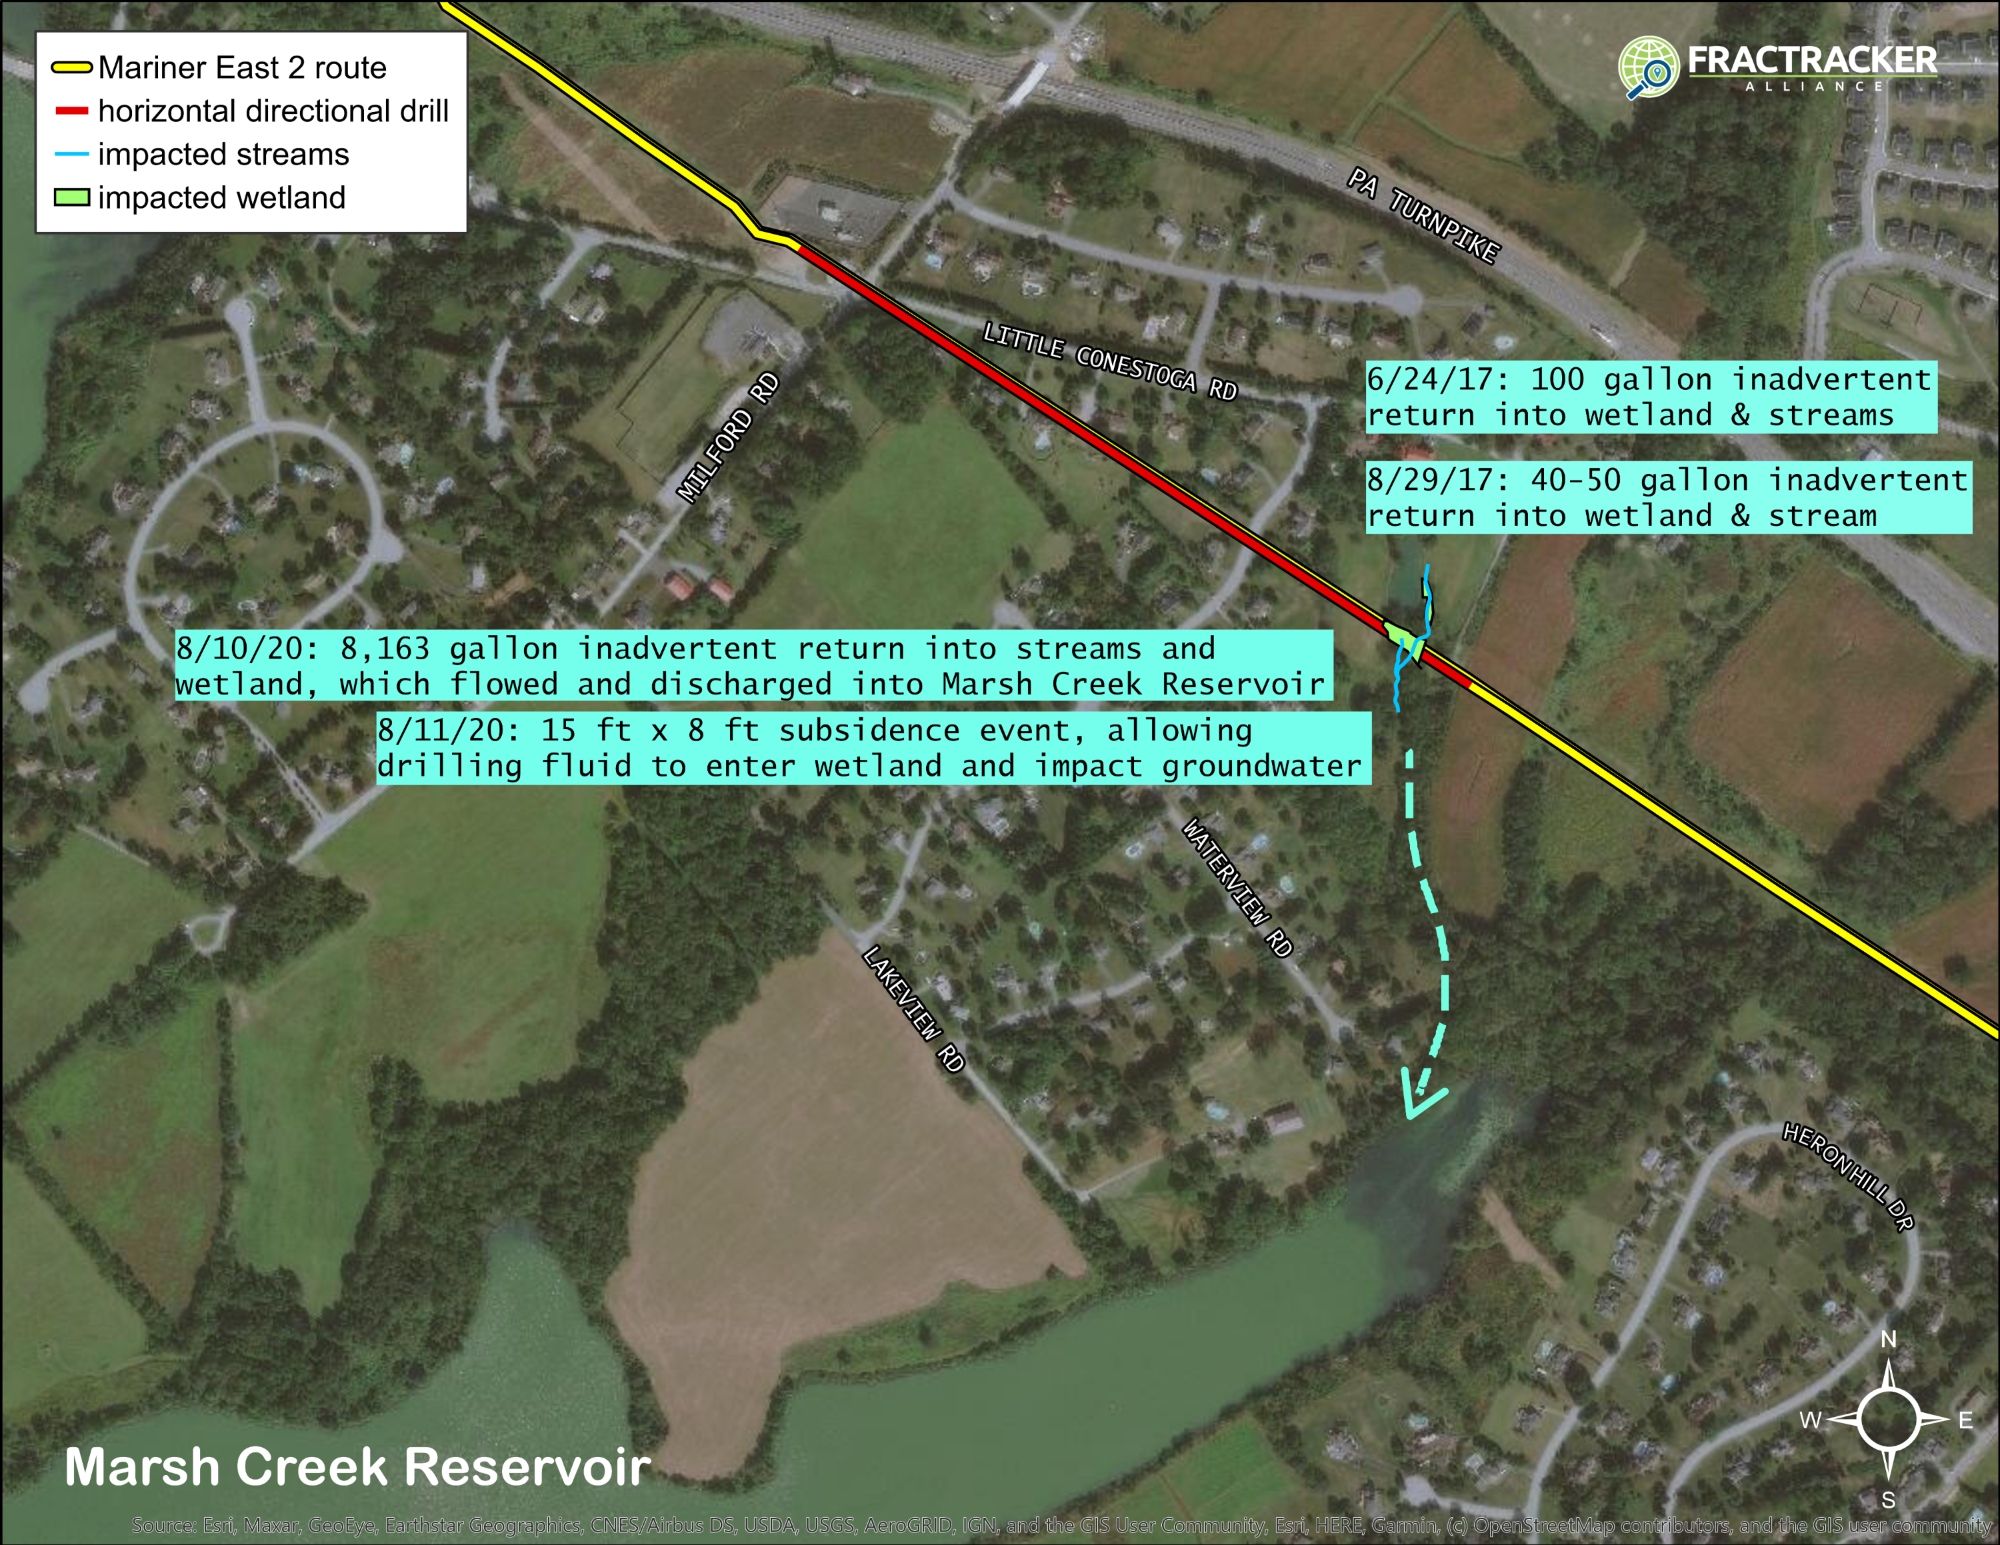
Figure 1. This HDD crossing in Upper Uwchlan Township, Chester County, caused over 8,000 gallons of drilling mud to spill into waterways. However, installation of the parallel 16-inch pipeline also caused spills at this same location in 2017.
A plume of drilling mud, captured here on video, entered the Marsh Creek Lake and settled on the lake bottom.
Last week, the PA DEP ordered Sunoco to suspend work on this HDD site and to implement a reroute using a course Sunoco had identified as an alternative in 2017:
“A 1.01 mile reroute to the north of the HDD is technically feasible. This would entail adjusting the project route prior to this HDD’s northwest entry/exit point to proceed north, cross under the Pennsylvania Turnpike, then proceed east for 0.7 miles parallel to the turnpike, cross Little Conestoga Road, then turn south, cross under the turnpike, and then reintersect the existing project route just east of this HDD’s southeast entry/exit point. There is no existing utility corridor here, however; therefore, this route would create a Greenfield utility corridor and would result in encumbering previously unaffected properties. The route would still cross two Waters of the Commonwealth and possible forested wetlands, and would pass in near proximity or immediately adjacent to five residential home sites. Both crossings of the turnpike would require “mini” HDDs or direct pipe bores to achieve the required depth of cover under the highway. Considered against the possibility of additional IRs [inadvertent returns] occurring on the proposed HDD, which are readily contained and cleaned up with minimal affect to natural resources, the permanent taking of the new 4 easement and likely need to use condemnation against previously unaffected landowners results in SPLP’s opinion that managing the proposed HDD is the preferred option.”
Based on that description, the route could follow the general direction of the dashed line in Figure 2:
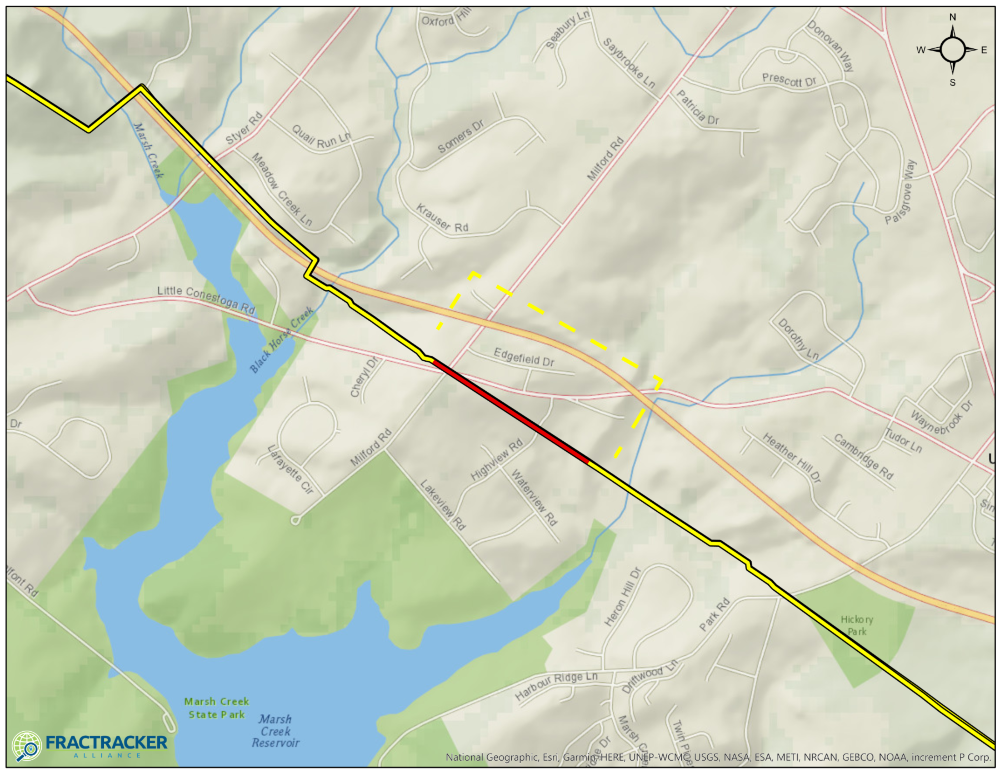
Figure 2. Possible reroute of Mariner East 2 Pipeline shown with dashed line
The DEP’s order also requires Sunoco to restore and remediate “impacted aquatic life, biota, and habitat, including the functions and values of the impacted wetlands resources, and all impacted recreational uses.” Sunoco must submit an Impact Assessment and Restoration Plan for this drill site by October 1, 2020, and the plan must provide for five years of monitoring after its completed restoration. In the meantime, Sunoco must secure the borehole using “grouting or equivalent method,” and continue to monitor the site.
The August incident likely surprised no one, as it was not the first spill at this location, and Sunoco’s own assessment acknowledged that this HDD crossing came with “a moderate to high risk of drilling fluid loss and IRs.”
Residents also sounded alarm bells for this drilling site. The proposal for just this location garnered over 200 public comments, all of which called on the DEP to deny Sunoco’s permit for drilling in this area. Many implored the DEP to consider the alternate route Sunoco must now use.
George Alexander, a Delaware County resident who runs a blog on this pipeline, the Dragonpipe Diary, says, “Sunoco/Energy Transfer continues to demonstrate in real time that they cannot build the Mariner Pipelines without inflicting harm upon our communities … The Marsh Creek situation is reminiscent of the damage to another favorite Pennsylvania lake, Raystown Lake in Huntingdon County.”
In 2017, Sunoco spilled over 200,000 gallons of drilling fluid into Raystown Lake, and released millions more underground. The spill caked acres of the lakebed with a coating of mud, hurting aquatic life and limiting recreational access to the lake. Sunoco failed to report the spills when they occurred, and the DEP fined the company $1.95 million for the incident. The fine is one of many Sunoco has incurred, including a $12.6 million penalty in February 2018 for permit violations, and more recently, a $355,636 penalty for drilling fluid discharges into waterways across eight counties.
On top of the delays, fines, strong public opposition, and even House and Senate members calling for permits to be revoked, there’s another factor working against Sunoco — the bleak financial outlook of the petrochemical industry.
The fracking boom triggered investment in projects to convert the fracked gas to plastic, leading to an oversupply in the global market. The industry made ambitious plans based on the price of plastic being $1/pound. Now, in 2020, the price is 40 – 60 cents per pound. If the Mariner East 2 pipeline is brought online, it likely will not be as profitable as its operators expected.
The poor finances of the oil and gas industry have led to the demise of several pipeline projects over the last few months. Phillips 66 announced in March it was deferring two pipelines — the Liberty Pipeline, which would transport crude oil from Wyoming to Oklahoma — and the Red Oak Pipeline system, planned to cross from Oklahoma to Texas. Kinder Morgan expressed uncertainty for its proposed Texas Permian Pass pipeline, and Enterprise Products Partners cancelled its Midland-to-ECHO crude oil pipeline project. The Atlantic Coast Pipeline also was cancelled this past July by Duke Energy and Dominion Energy, following “an unacceptable layer of uncertainty and anticipated delays,” and the Williams Constitution pipeline was also abandoned after years of challenges. In fact, the EIA recently reported that more pipeline capacity has been cancelled in 2020 than new capacity brought in service.
Will the Mariner East 2 be the next to fall?
A note from the Safety 7: The Safety 7 are seven residents of Delaware and Chester Counties who are challenging Sunoco before the [Pennsylvania Public Utility Commission]. If you are outraged at the ongoing threat to our communities from this dangerous, destructive pipeline, please consider donating to the Safety 7 Legal fund … Our next hearing begins September 29, and funds from your support are urgently needed. This motion is representative of the kind of legal work we need, if we are to prevail in protecting our communities from this dangerous pipeline project. Please contribute today if you are able, and please share this appeal widely and let your friends and family know why this case matters to you!
Learn more and donate here.
By Erica Jackson, Community Outreach and Communications Specialist, FracTracker Alliance
This map and analysis relied on data provided by the Pennsylvania Department of Environmental Protection.
The virtual story map is live!
In this special one-day fundraiser event, two intrepid FracTracker teams will build and share a live virtual map as we travel throughout the Ohio River Valley Region documenting oil, gas, and its effects on our health, climate, and environment.
We’ll share our findings to build awareness about the plight of this region—and so many other places victimized by this rogue industry. Plus, viewers will gain a firsthand understanding of how FracTracker turns data into real-world impact.
Proceeds will benefit the ongoing work of FracTracker to decarbonize our economy and promote environmental justice.
Whether you are able to contribute financially at this time or not, we hope you’ll join us on this virtual journey. You’ll see regular video updates along the way as we share our progress, and watch as a story map is updated throughout the day.
Join our team of explorers in spirit and pledge your support! We’re excited to share this journey with you.
Part of the Falcon Public Environmental Impact Assessment – a FracTracker series on the impacts of Falcon Ethane Pipeline System
Challenges have plagued Shell’s construction of the Falcon Pipeline System through Pennsylvania, Ohio, and West Virginia, according to documents from the Pennsylvania Department of Environmental Protection (DEP) and the Ohio Environmental Protection Agency (EPA).
Records show that at least 70 spills have occurred since construction began in early 2019, releasing over a quarter million gallons of drilling fluid. Yet the true number and volume of spills is uncertain due to inaccuracies in reporting by Shell and discrepancies in regulation by state agencies.
A drilling fluid spill from Falcon Pipeline construction near Moffett Mill Road in Beaver County, PA. Source: Pennsylvania DEP
Releases of drilling fluid during Falcon’s construction include inadvertent returns and losses of circulation – two technical words used to describe spills of drilling fluid that occur during pipeline construction.
Drilling fluid, which consists of water, bentonite clay, and chemical additives, is used when workers drill a borehole horizontally underground to pull a pipeline underneath a water body, road, or other sensitive location. This type of installation is called a HDD (horizontal directional drill), and is pictured in Figure 1.
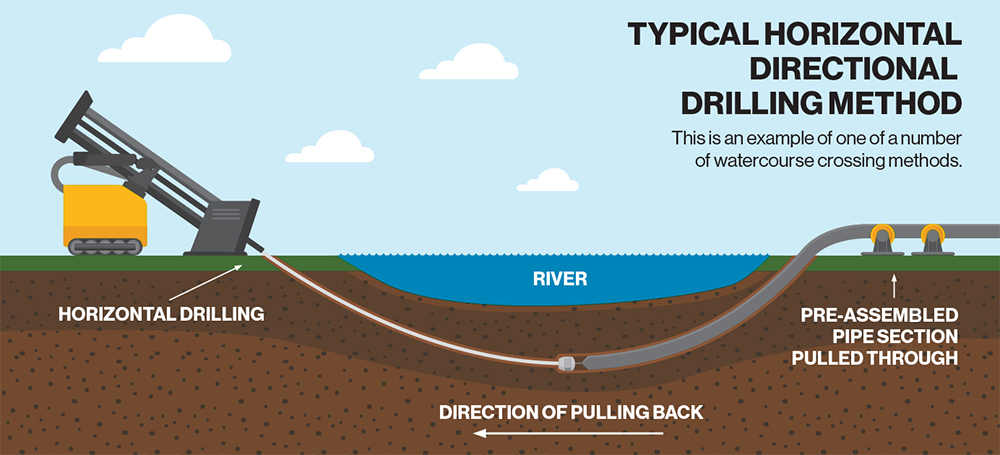
Figure 1. An HDD operation – Thousands of gallons of drilling fluid are used in this process, creating the potential for spills. Click to expand. Source: Enbridge Pipeline
Here’s a breakdown of what these types of spills are and how often they’ve occurred during Falcon pipeline construction, as of March, 2020:
However, according to the Ohio EPA, Shell is not required to submit reports for losses of circulation that are less than the definition of an inadvertent return, so many losses may not be captured in the list above. Additionally, documents reveal inconsistent volumes of drilling mud reported and discrepancies in the way releases are regulated by the Pennsylvania DEP and the Ohio EPA.
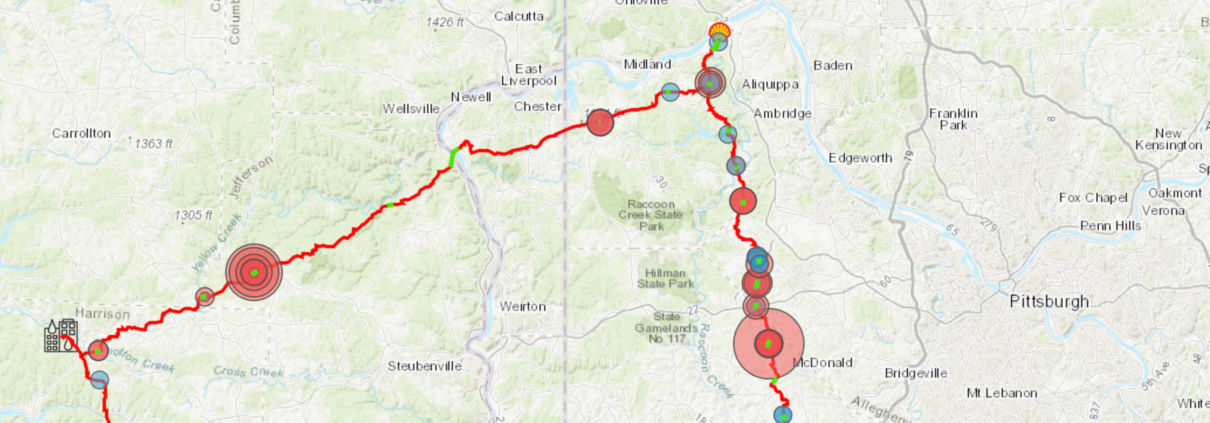
Very few of these incidents were published online for the public to see; FracTracker obtained information on them through a public records request. The map below shows the location of all known drilling fluid releases from that request, along with features relevant to the pipeline’s construction. Click here to view full screen, and add features to the map by checking the box next to them in the legend. For definitions and additional details, click on the information icon.
Our investigation into these incidents began early this year when we received an anonymous tip about a release of drilling fluids in the range of millions of gallons at the SCIO-06 HDD over Wolf Run Road in Jefferson County, Ohio. The source stated that the release could be contaminating drinking water for residents and livestock.
Working with Clean Air Council, Fair Shake Environmental Legal Services, and DeSmog Blog, we quickly discovered that this spill was just the beginning of the Falcon’s construction issues.
Documents from the Ohio EPA confirm that there were at least eight losses of circulation at this location between August 2019 and January 2020, including losses of unknown volume. The SCIO-06 HDD location is of particular concern because it crosses beneath two streams (Wolf Run and a stream connected to Wolf Run) and a wetland, is near groundwater wells, and runs over an inactive coal mine (Figure 2).
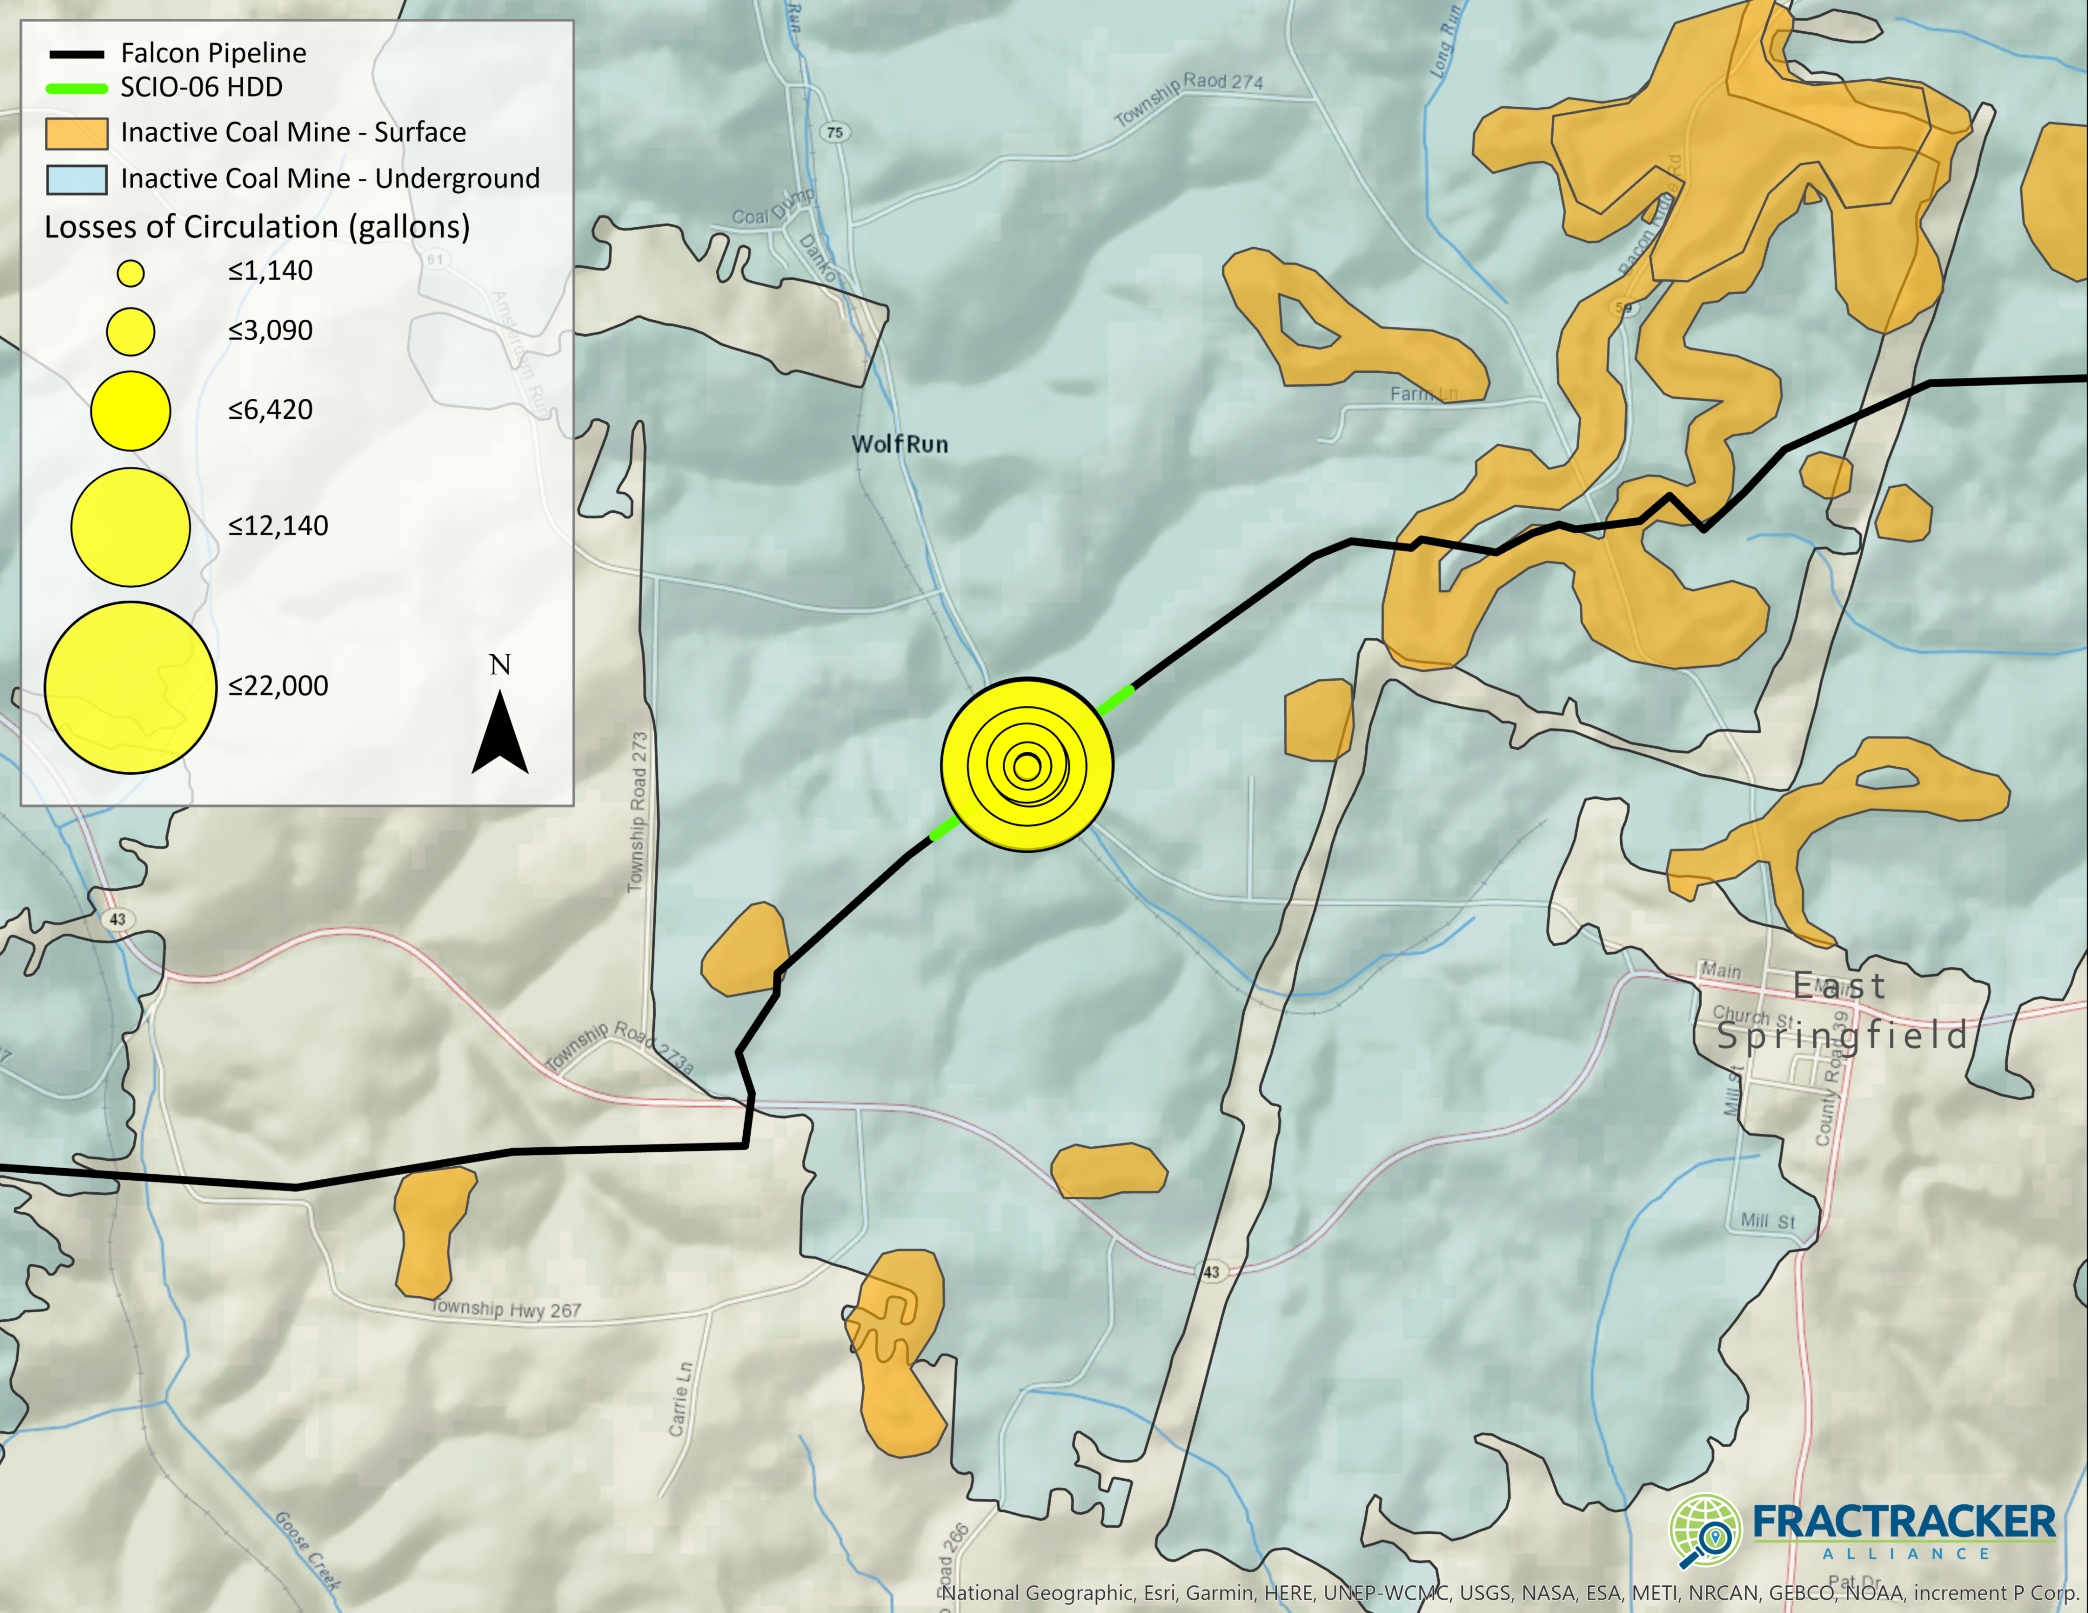
Figure 2. Losses of circulation that occurred at the SCIO-06 horizontal directional drill (HDD) site along the Falcon Pipeline in Jefferson County Ohio. Data Sources: OH EPA, AECOM
According to Shell’s survey, the coal mine (shown in Figure 2 in blue) is 290 feet below the HDD crossing. A hazardous scenario could arise if an HDD site interacts with mine voids, releasing drilling fluid into the void and creating a new mine void discharge.
A similar situation occurred in 2018, when EQT Corp. was fined $294,000 after the pipeline it was installing under a road in Forward Township, Pennsylvania hit an old mine, releasing four million gallons of mine drainage into the Monongahela River.
The Ohio EPA’s Division of Drinking and Ground Waters looked into the issues around this site and reported, “GIS analysis of the pipeline location in Jefferson Co. does not appear to risk any vulnerable ground water resources in the area, except local private water supply wells. However, the incident location is above a known abandoned (pre-1977) coal mine complex, mapped by ODNR.”
While we cannot confirm if there was a spill in the range of millions of gallons as the source claimed, the reported losses of circulation at the SCIO-06 site total over 60,000 gallons of drilling fluid. Additionally, on December 10th, 2019, the Ohio EPA asked AECOM (the engineering company contracted by Shell for this project) to estimate what the total fluid loss would be if workers were to continue drilling to complete the SCIO-06 crossing. AECOM reported that, in a “very conservative scenario based on the current level of fluid loss…Overall mud loss to the formation could exceed 3,000,000 gallons.”
Despite this possibility of a 3 million+ gallon spill, Shell resumed construction in January, 2020. The company experienced another loss of circulation of 4,583 gallons, reportedly caused by a change in formation. However, in correspondence with a resident, Shell stated that the volume lost was 3,200 gallons.
Whatever the amount, this January loss of circulation appears to have convinced Shell that an HDD crossing at this location was too difficult to complete, and in February 2020, Shell decided to change the type of crossing at the SCIO-06 site to a guided bore underneath Wolf Run Rd and open cut trench through the stream crossings (Figure 3).
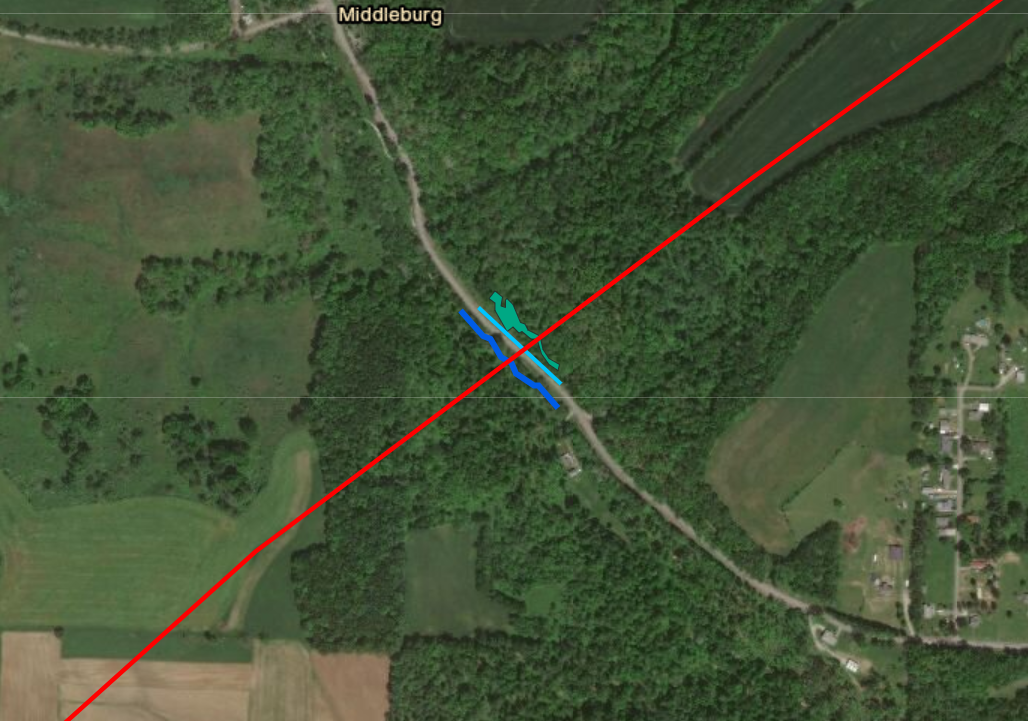
Figure 3. The SCIO-06 HDD site, which may be changed from an HDD crossing to an open cut trench and conventional bore to cross Wolf Run Rd, Wolf Run stream (darker blue), an intermittent stream (light blue) and a wetland (teal). Click to expand.
An investigation by DeSmog Blog revealed that Shell applied for the route change under Nationwide Permit 12, a permit required for water crossings. While the Army Corps of Engineers authorized the route change on March 17th, one month later, a Montana federal court overseeing a case on the Keystone XL pipeline determined that the Nationwide Permit 12 did not meet standards set by federal environmental laws – a decision which may nullify the Falcon’s permit status. At this time, the ramifications of this decision on the Falcon remain unclear.
In looking through Shell’s loss of circulation reports, we noted several discrepancies about the volume of drilling fluid released for different spills, including those that occurred at the SCIO-06 site. As one example, the Ohio EPA stated an email about the SCIO-06 HDD, “The reported loss of fluid from August 1, 2019 to August 14, 2019 in the memo does not appear to agree with the 21,950 gallons of fluid loss reported to me during my site visit on August 14, 2019 or the fluid loss reported in the conference call on August 13, 2019.”
In addition to errors on Shell’s end, our review of documents revealed significant confusion around the regulation of drilling fluid spills. In an email from September 26, 2019, months after construction began, Shell raised the following questions with the Ohio EPA:
A possible explanation for why Shell reported inconsistent volumes of spills is because they were not using the proper technology to measure them.
Shell’s “Inadvertent Returns from HDD: Assessment, Preparedness, Prevention and Response Plan” states that drilling rigs must be equipped with “instruments which can measure and record in real time, the following information: borehole annular pressure during the pilot hole operation; drilling fluid discharge rate; the spatial position of the drilling bit or reamer bit; and the drill string axial and torsional loads.”
In other words, Shell should be using monitoring equipment to measure and report volumes of drilling fluid released.
Despite that requirement, Shell was initially monitoring releases manually by measuring the remaining fluid levels in tanks. After inspectors with the Pennsylvania DEP realized this in October, 2019, the Department issued a Notice of Violation to Shell, asking the company to immediately cease all Pennsylvania HDD operations and implement recording instruments. The violation also cited Shell for not filing weekly inadvertent return reports and not reporting where recovered drilling fluids were disposed.
In Ohio, there is no record of a similar request from the Ohio EPA. The anonymous source that originally informed us of issues at the SCIO-6 HDD stated that local officials and regulatory agencies in Ohio were likely not informed of the full volumes of the industrial waste releases based on actual meter readings, but rather estimates that minimize the perceived impact.
While we cannot confirm this claim, we know a few things for sure: 1) there are conflicting reports about the volume of drilling fluids spilled in Ohio, 2) according to Shell’s engineers, there is the potential for a 3 million+ gallon spill at the SCIO-06 site, and 3) there are instances of Shell not following its permits with regard to measuring and reporting fluid losses.
The inconsistent ways that fluid losses (particularly those that occur underground) are defined, reported, and measured leave too many opportunities for Shell to impact sensitive ecosystems and drinking water sources without being held accountable.
Drilling fluid is primarily composed of water and bentonite clay (sodium montmorillonite), which is nontoxic. If a fluid loss occurs, workers often use additives to try and create a seal to prevent drilling fluid from escaping into underground voids. According to Shell’s “Inadvertent Returns From HDD” plan, it only uses additives that meet food standards, are not petroleum based, and are consistent with materials used in drinking water operations.
However, large inadvertent returns into waterways cause heavy sedimentation and can have harmful effects on aquatic life. They can also ruin drinking water sources. Inadvertent returns caused by HDD construction along the Mariner East 2 pipeline have contaminated many water wells.
Losses of circulation can impact drinking water too. This past April in Texas, construction of the Permian Highway Pipeline caused a loss that left residents with muddy well water. A 3 million gallon loss of circulation along the Mariner East route led to 208,000 gallons of drilling mud entering a lake, and a $2 million fine for Sunoco, the pipeline’s operator.
Our Falcon Public EIA Project found 240 groundwater wells within 1/4 mile of the pipeline and 24 within 1,000 ft of an HDD site. The pipeline also crosses near surface water reservoirs. Drilling mud spills could put these drinking water sources at risk.
But when it comes to understanding the true impact of the more than 245,000+ gallons of drilling fluid lost beneath Pennsylvania and Ohio, there are a lot of remaining questions. The Falcon route crosses over roughly 20 miles of under-mined land (including 5.6 miles of active coal mines) and 25 miles of porous karst limestone formations (learn more about karst). Add in to the mix the thousands of abandoned, conventional, and fracked wells in the region – and you start to get a picture of how holey the land is. Where or how drilling fluid interacts with these voids underground is largely unknown.
In addition to the SCIO-04 HDD, there are other drilling fluid losses that occurred in sensitive locations.
In Robinson Township, Pennsylvania, over a dozen losses of circulation (many of which occurred over the span of several days) released a reported 90,067 gallons of drilling fluid into the ground at the HOU-04 HDD. This HDD is above inactive surface and underground mines.
The Falcon passes through and near surface drinking water sources. In Beaver County, Pennsylvania, the pipeline crosses the headwaters of the Ambridge Reservoir and the water line that carries out its water for residents in Beaver County townships (Ambridge, Baden, Economy, Harmony, and New Sewickley) and Allegheny County townships (Leet, Leetsdale, Bell Acres, and Edgeworth). The group Citizens to Protect the Ambridge Reservoir, which formed in 2012 to protect the reservoir from unconventional oil and gas infrastructure, led efforts to stop Falcon Construction, and the Ambridge Water Authority itself called the path of the pipeline “not acceptable.” In response to public pressure, Shell did agree to build a back up line to the West View Water Authority in case issues arose from the Falcon’s construction.
Unfortunately, a 50-gallon inadvertent return was reported at the HDD that crosses the waterline (Figure 4), and a 160 gallon inadvertent return occurred in Raccoon Municipal Park within the watershed and near its protected headwaters (Figure 5). Both of these releases are reported to have occurred within the pipeline’s construction area and not into waterways.

Figure 4) HOU-10 HDD location on the Falcon Pipeline, where 50 gallons were released on the drill pad on 7/9/2019
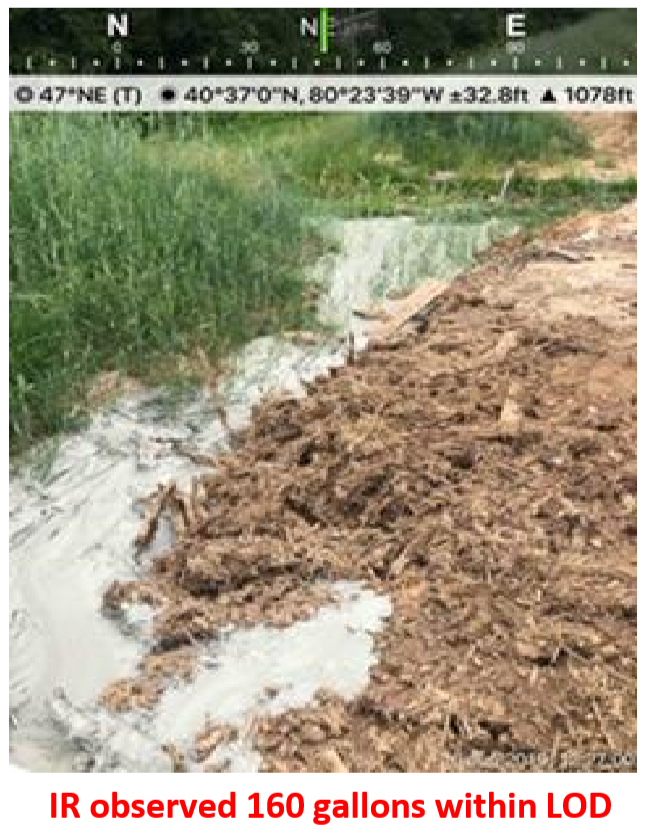
Figure 5) SCIO-05 HDD location on the Falcon Pipeline, where 160 gallons were released on 6/10/19, within the pipeline’s LOD (limit of disturbance)
Farther west, the pipeline crosses through the watershed of the Tappan Reservoir, which provides water for residents in Scio, Ohio and the Ohio River, which serves over 5 million people.
A 35- gallon inadvertent return occurred at a conventional bore within the Tappan Lake Protection Area, impacting a wetland and stream. We are not aware of any spills impacting the Ohio River.
This investigation makes it clear that weak laws and enforcement around drilling fluid spills allows pipeline construction to harm sensitive ecosystems and put drinking water sources at risk. Furthermore, regulations don’t require state agencies or Shell to notify communities when many of these drilling mud spills occur.
Despite the issues Shell experienced during construction, work on the Falcon continued over the past months during state shelter-in-place orders, while many businesses were forced to close.
The problem continues where the 97-mile pipeline ends – at the Shell ethane cracker. In March, workers raised concerns about the unsanitary conditions of the site, and stated that crowded workspaces made social distancing impossible. While Shell did halt construction temporarily, state officials gave the company the OK to continue work – even without the waiver many businesses had to obtain.
The state’s decision was based on the fact it considered the ethane cracker to “support electrical power generation, transmission and distribution.” The ethane cracker – which is still months and likely years away from operation – does not currently produce electrical power and will only provide power generation to support plastic manufacturing.
This claim continues a long pattern of the industry attempting to trick the public into believing that we must continue expanding oil and gas operations to meet our country’s energy needs. In reality, Shell and other oil and gas companies are attempting to line their own pockets by turning the country’s massive oversupply of fracked gas into plastic. And just as Shell and state governments have put the health of residents and workers on the line by continuing construction during a global pandemic, they are sacrificing the health of communities on the frontlines of the plastic industry and climate change by pushing forward the build-out of the petrochemical industry during a global climate crisis.
This election year, while public officials are pushing forward major action to respond to the economic collapse, let’s push for policies and candidates that align with the people’s needs, not Big Oil’s.
By Erica Jackson, Community Outreach & Communications Specialist, FracTracker Alliance
COVID-19 and the oil and gas industry are at odds. Air pollution created by oil and gas activities make people more vulnerable to viruses like COVID-19. Simultaneously, the economic impact of the pandemic is posing major challenges to oil and gas companies that were already struggling to meet their bottom line. In responding to these challenges, will our elected leaders agree on a stimulus package that prioritizes people over profits?
People living in areas with poor air quality may be more vulnerable to COVID-19, a disease that affects the lungs. Poor air quality is linked to higher rates of asthma and chronic obstructive pulmonary disease (COPD), even without a pandemic.
Air pollution from oil and gas development can come from compressor stations, condensate tanks, construction activity, dehydrators, engines, fugitive emissions, pits, vehicles, and venting and flaring. The impact is so severe that for every three job years created by fracking in the Marcellus Shale, one year of life is lost due to increased exposure to pollution.
Yes, air quality has improved in certain areas of China and elsewhere due to decreased traffic during the COVID-19 pandemic. But despite our eagerness for good news, sightings of dolphins in Italian waterways does not mean that mother earth has forgiven us or “hit the reset button.”
Significant environmental health concerns persist, despite some improvements in air quality. During the 2003 SARS outbreak, which was caused by another coronavirus, patients from areas with the high levels of air pollution were twice as likely to die from SARS compared to those who lived in places with little pollution.
On March 8th, Stanford University environmental resource economist Marshall Burke looked at the impacts of air quality improvements under COVID-19, and offered this important caveat:
“It seems clearly incorrect and foolhardy to conclude that pandemics are good for health. Again I emphasize that the effects calculated above are just the health benefits of the air pollution changes, and do not account for the many other short- or long-term negative consequences of social and economic disruption on health or other outcomes; these harms could exceed any health benefits from reduced air pollution. But the calculation is perhaps a useful reminder of the often-hidden health consequences of the status quo, i.e. the substantial costs that our current way of doing things exacts on our health and livelihoods.”
This is an environmental justice issue. Higher levels of air pollution tend to be in communities with more poverty, people of color, and immigrants. Other health impacts related to oil and gas activities, from cancer to negative birth outcomes, compromise people’s health, making them more vulnerable to COVID-19. Plus, marginalized communities experience disproportionate barriers to healthcare as well as a heavier economic toll during city-wide lockdowns.
The COVID-19 health crisis is setting off major changes in the oil and gas industry. The situation may thwart plans for additional petrochemical expansion and cause investors to turn away from fracking for good.
Oil, gas, and petrochemical producers were facing financial uncertainties even before COVID-19 began to spread internationally. Now, the economics have never been worse.
In 2019, shale-focused oil and gas producers ended the year with net losses of $6.7 billion. This capped off the decade of the “shale revolution,” during which oil and gas companies spent $189 billion more on drilling and other capital expenses than they brought in through sales. This negative cash flow is a huge red flag for investors.
“North America’s shale industry has never succeeded in producing positive free cash flows for any full year since the practice of fracking became widespread.” IEEFA
Shale companies in the United States produce more natural gas than they can sell, to the extent that they frequently resort to burning gas straight into the atmosphere. This oversupply drives down prices, a phenomenon that industry refers to as a “price glut.”
The oil-price war between Russia and Saudi Arabia has been taking a toll on oil and gas prices as well. Saudi Arabia plans to increase oil production by 2 – 3 million barrels per day in April, bringing the global total to 102 million barrels produced per day. But with the global COVID-19 lockdown, transportation has decreased considerably, and the world may only need 90 million barrels per day.
If you’ve taken Econ 101, you know that when production increases as demand decreases, prices plummet. Some analysts estimate that the price of oil will soon fall to as low as $5 per barrel, (compared to the OPEC+ intended price of $60 per barrel).
Oil and gas industry lobbyists have asked Congress for financial support in response to COVID-19. Two stimulus bills in both the House and Senate are currently competing for aid.
Speaker McConnell’s bill seeks to provide corporate welfare with a $415 billion fund. This would largely benefit industries like oil and gas, airlines, and cruise ships. Friends of the Earth gauged the potential bailout to the fracking industry at $26.287 billion. In another approach, the GOP Senate is seeking to raise oil prices by directly purchasing for the Strategic Petroleum Reserve, the nation’s emergency oil supply.
Speaker Pelosi’s proposed stimulus bill includes $250 billion in emergency funding with stricter conditions on corporate use, but doesn’t contain strong enough language to prevent a massive bailout to oil and gas companies.
Hopefully with public pressure, Democrats will take a firmer stance and push for economic stimulus to be directed to healthcare, paid sick leave, stronger unemployment insurance, free COVID-19 testing, and food security.
Fracking companies were struggling to stay afloat before COVID-19 even with generous government subsidies. It’s becoming very clear that the fracking boom is finally busting. In an attempt to make use of the oversupply of gas and win back investors, the petrochemical industry is expanding rapidly. There are currently plans for $164 billion of new infrastructure in the United States that would turn fracked natural gas into plastic.
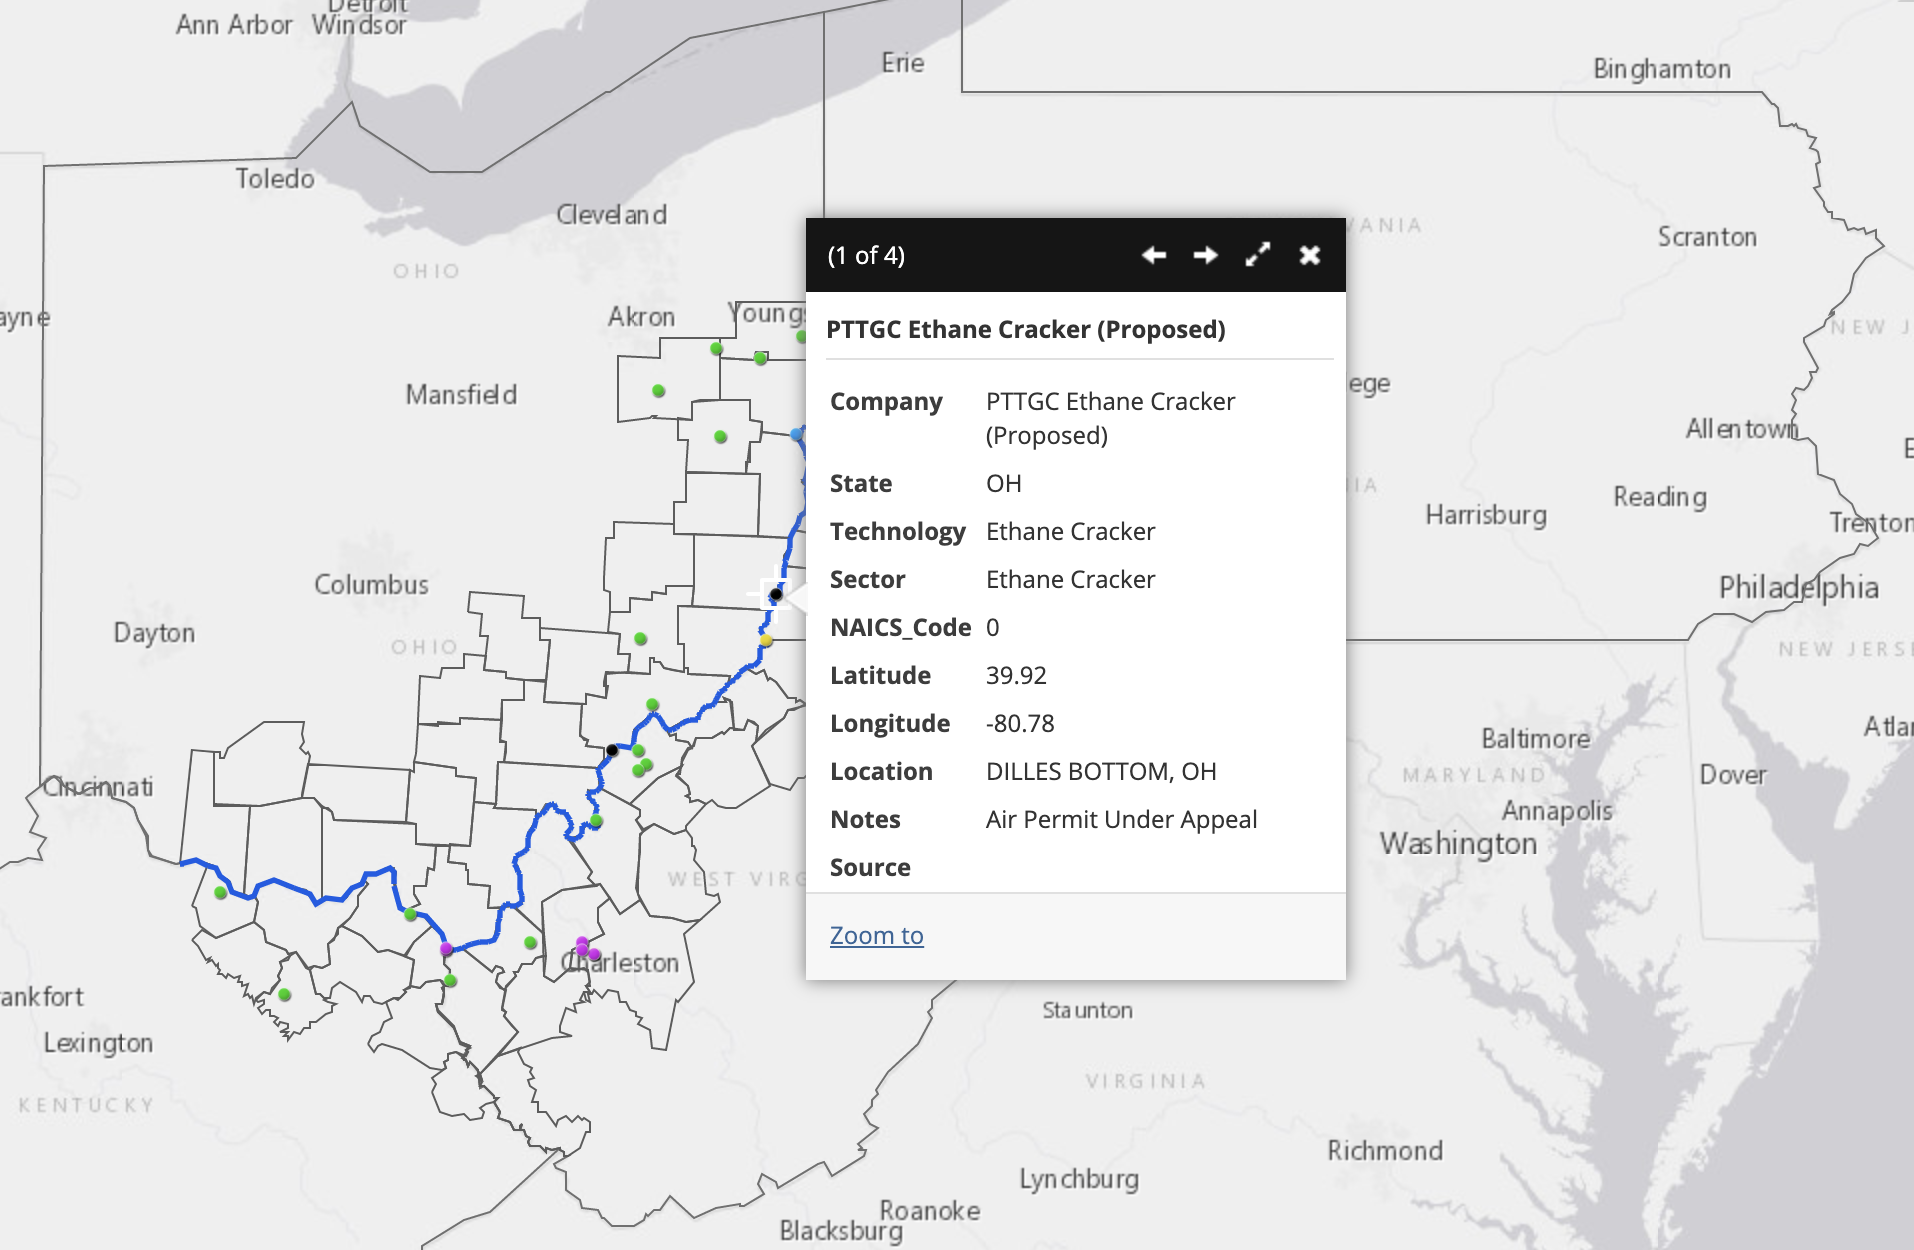
The location of the proposed PTTGC Ethane Cracker in Belmont, Ohio. Go to this map.
There are several fundamental flaws with this plan. One is that the price of plastic is falling. A new report by the Institute for Energy Economics and Financial Analysis (IEEFA) states that the price of plastic today is 40% lower than industry projections in 2010-2013. This is around the time that plans started for a $5.7 billion petrochemical complex in Belmont County, Ohio. This would be the second major infrastructural addition to the planned petrochemical buildout in the Ohio River Valley, the first being the multi-billion dollar ethane cracker plant in Beaver County, Pennsylvania.
Secondly, there is more national and global competition than anticipated, both in supply and production. Natural gas and petrochemical companies have invested in infrastructure in an attempt to take advantage of cheap natural gas, creating an oversupply of plastic, again decreasing prices and revenue. Plus, governments around the world are banning single-use plastics, and McKinsey & Company estimates that up to 60% of plastic production could be based on reuse and recycling by 2050.
Sharp declines in feedstock prices do not lead to rising demand for petrochemical end products.
Third, oil and gas companies were overly optimistic in their projections of national economic growth. The IMF recently projected that GDP growth will slow down in China and the United States in the coming years. And this was before the historic drop in oil prices and the COVID-19 outbreak.
“The risks are becoming insurmountable. The price of plastics is sinking and the market is already oversupplied due to industry overbuilding and increased competition,” said Tom Sanzillo, IEEFA’s director of finance and author of the report.
Oil, gas, and petrochemical companies are facing perilous prospects from demand and supply sides. Increasing supply does not match up with decreasing demand, and as a result the price of oil and plastics are dropping quickly. Tens of thousands of oil and gas workers are being fired, and more than 200 oil and gas companies have filed for bankruptcy in North America in the past five years. Investors are no longer interested in propping up failing companies.
Natural gas accounts for 44% of electricity generation in the United States – more than any other source. Despite that, the cost per megawatt hour of electricity for renewable energy power plants is now cheaper than that of natural gas power plants. At this point, the economy is bound to move towards cleaner and more economically sustainable energy solutions.
It’s not always necessary or appropriate to find a “silver lining” in crises, and it’s wrong to celebrate reduced pollution or renewable energy achievements that come as the direct result of illness and death. Everyone’s first priority must be their health and the health of their community. Yet the pandemic has exposed fundamental flaws in our energy system, and given elected leaders a moment to pause and consider how we should move forward.
It is a pivotal moment in terms of global energy production. With determination, the United States can exercise the political willpower to prioritize people over profits– in this case, public health over fossil fuel companies.
Top photo of petrochemical activity in the Houston, Texas area. By Ted Auch, FracTracker Alliance. Aerial assistance provided by LightHawk.
![]()
216 Franklin St, Suite 400, Johnstown, PA 15901
Phone: +1 (717) 303-0403 | info@fractracker.org
FracTracker Alliance is a 501(c)3 non-profit: Tax identification number: 80-0844297
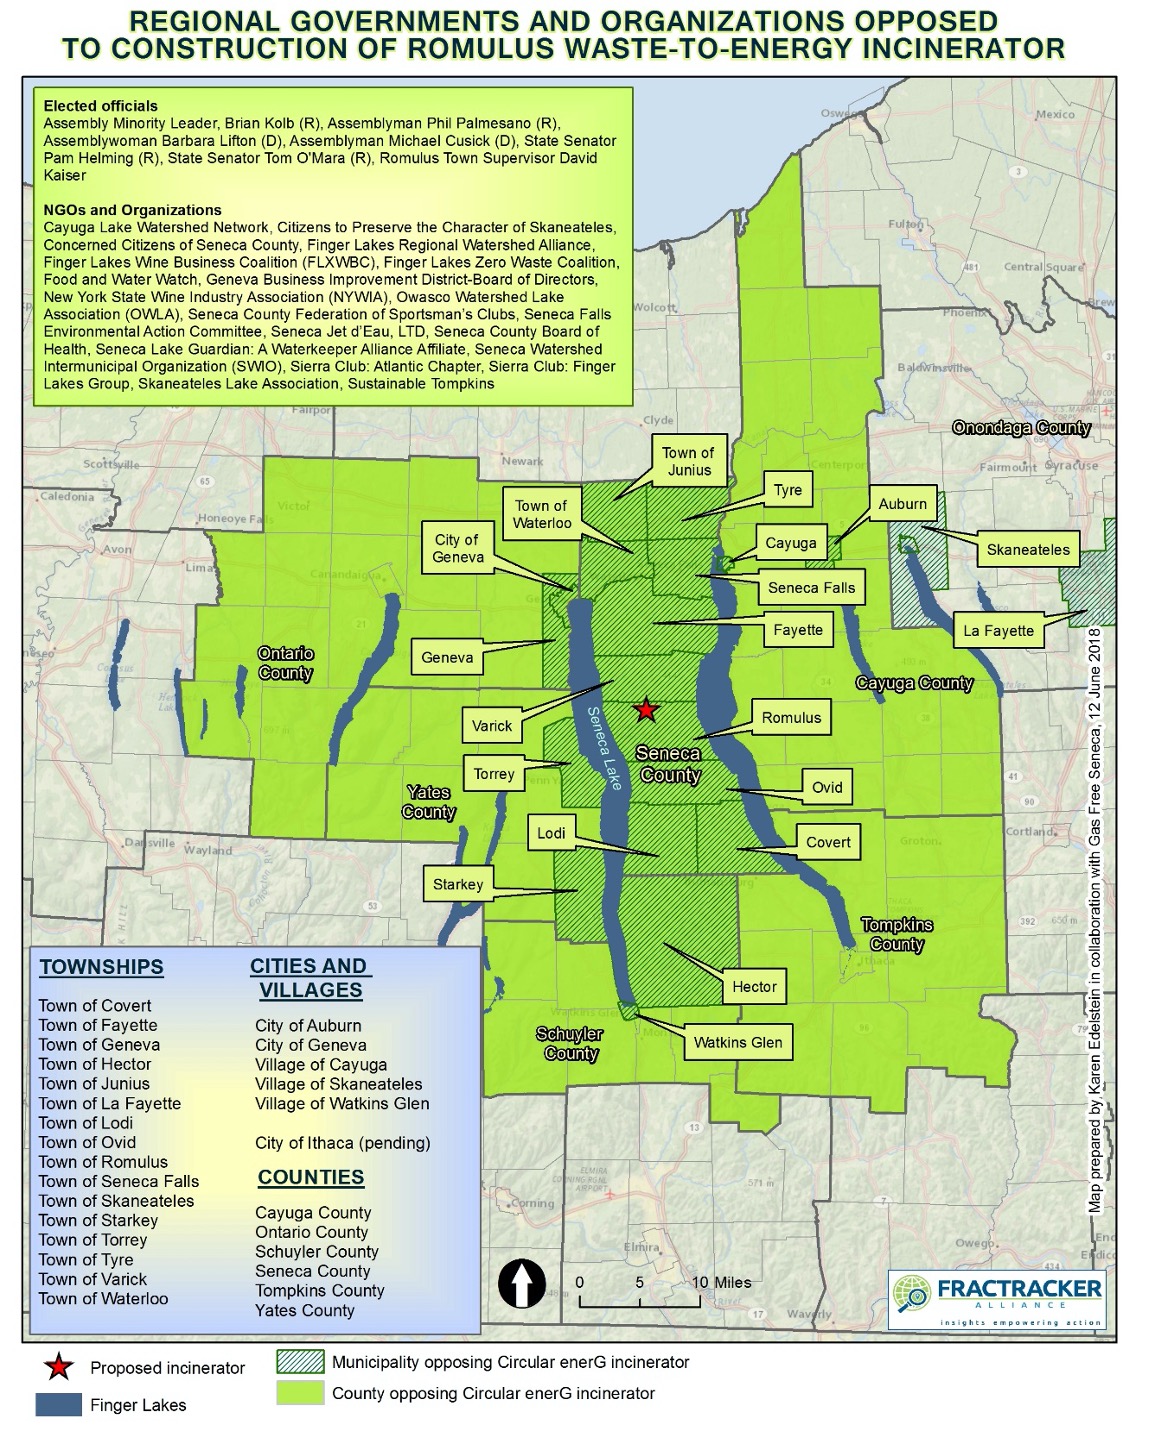
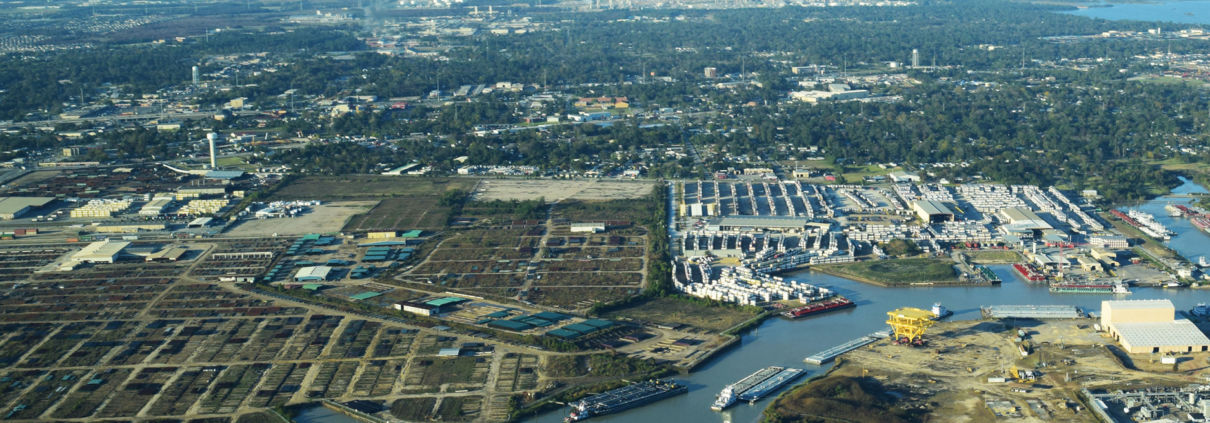 Photo by Ted Auch, FracTracker Alliance, with aerial support by LightHawk