The Dakota Access Pipeline: An Uncertain Future
By Kyle Ferrar, Western Program Coordinator, FracTracker Alliance
Eliza Czolowski, Program Associate, PSE Healthy Energy
Since April 2016, demonstrators in North Dakota have been protesting a section of the Dakota Access Pipeline (DAPL) being built by Dakota Access LLC, a construction subsidiary of Energy Transfer Partners LP. The proposed pipeline passes just 1.5 miles north of the Standing Rock Sioux Tribal Lands, where it is planned to cross Lake Oahe, the largest Army Corps of Engineers reservoir created on the Missouri River. The tribe argues that the project will not only threaten their environmental and economic well-being, but will also cut through land that is sacred.
Given how quickly circumstances have changed on the ground, we have received numerous requests to post an overview on the issue. This article examines the technical aspects of the DAPL proposal and details the current status of protests at Standing Rock. It includes a discussion of what the Army Corps’ recent denial of DAPL’s permits means for the project as well as looks towards the impacts of incoming Trump administration. We have also created the below map to contextualize DAPL and protest activities that have occurred at Standing Rock.
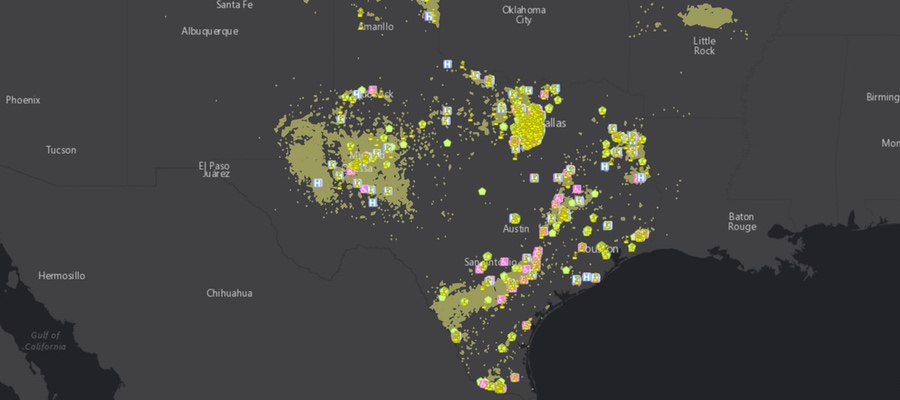
Standing Rock Protest Map
View map fullscreen | How FracTracker maps work
Background
DAPL is a $3.78 billion dollar project that was initially slated for completion on January 1, 2017. The DAPL is a joint venture of Phillips 66, Sunoco Logistics, and other smaller fossil fuel companies including Marathon Petroleum Corporation, and Enbridge Energy Partners. Numerous banks and investment firms are supporting the project and financing the related infrastructure growth, including Citi Bank, JP Morgan Chase, HSBC, PNC, Community Trust, Bank of America, Morgan Stanley, ING, Tokyo-Mitsubishi, Goldman Sachs, Wells Fargo, SunTrust, Us Bank, UBS, Compass and others.
Its route travels from Northwestern North Dakota, south of Bismarck, and crosses the waterway made up of the Missouri River and Lake Oahe just upriver of the Standing Rock Sioux Tribal Area. From North Dakota the pipeline continues 1,172 miles to an oil tank farm in Pakota, Illinois. DAPL would carry 470,000 barrels per day (75,000 m3/d) of Bakken crude oil with a maximum capacity up to 570,000 barrels per day. That’s the CO2 equivalent of 30 average sized coal fired power plants.
As documented by the NY Times map, in addition to the Missouri River and Lake Oahe, the pipeline crosses 22 other waterways that also require the pipeline to be drilled deep under these bodies of water. But Standing Rock portion is the only section disputed and as of yet unfinished. Now the pipeline project, known by the protesters as “the black snake,” is over 95% complete, despite having no official easement to cross the body of water created by the Missouri River and Lake Oahe. The easement is required for any domestic pipeline to cross a major waterway and because the land on either side of the Army Corps Lake Oahe project is managed by the Army Corps (shown in the protest map). An easement would allow Dakota Access LLC to drill a tunnel for the pipeline under the federally owned lands, including the lake and river.
Safety & Environmental Racism
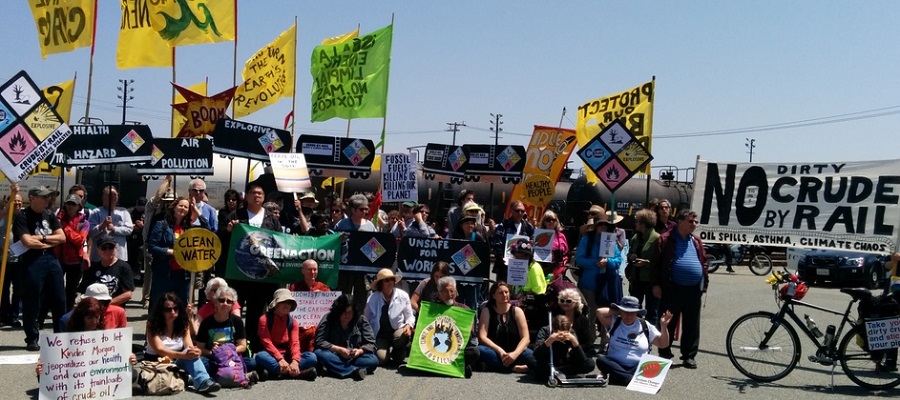
Proponents of the project tout the opinion that pipelines are the safest method of moving oil large distances. Trucking oil in tankers on highways has the highest accident and spill rates, whereas moving oil by railways presents a major explosive hazard when incidents do occur. Pipeline spills are therefore considered the “safe” alternative. On November 11, Kelcy Warren was interviewed on CBS News, claiming Dakota Access, LLC takes every precaution to reduce leaks and that the likelihood of a leak is highly unlikely. The problem with comparing the risk for each of these transportation methods is that rates of incidence are the only comparison. The resulting hazard and impact is ignored. When pipelines rupture, they present a much larger hazard than trucks and trains. Large volumes of spilled oil result in much greater water and soil contamination.
We know that pipelines do rupture, and quite often. An analysis by the U.S. DOT Pipeline and Hazardous Materials Safety Administration in 2012 shows that there have been 201 major incidents (with volumes over 1,000 gallons) related to liquid leaks in the U.S. over the last ten years that were reported to the Department of Transportation. The “average” pipeline therefore has a 57% probability of experiencing a major leak, with consequences over the $1 million range, in a ten-year period. FracTracker’s recent analysis of PHMSA data shows the systemic issue of pipeline spills: there have been 4,215 pipeline spill incidents just since 2010 resulting in 100 reported fatalities, 470 injuries, and property damage exceeding $3.4 billion! The recent (December 12) spill of 176,000 gallons of crude oil into a stream just 150 miles from the Standing Rock protest site highlights the Tribes’ concerns.
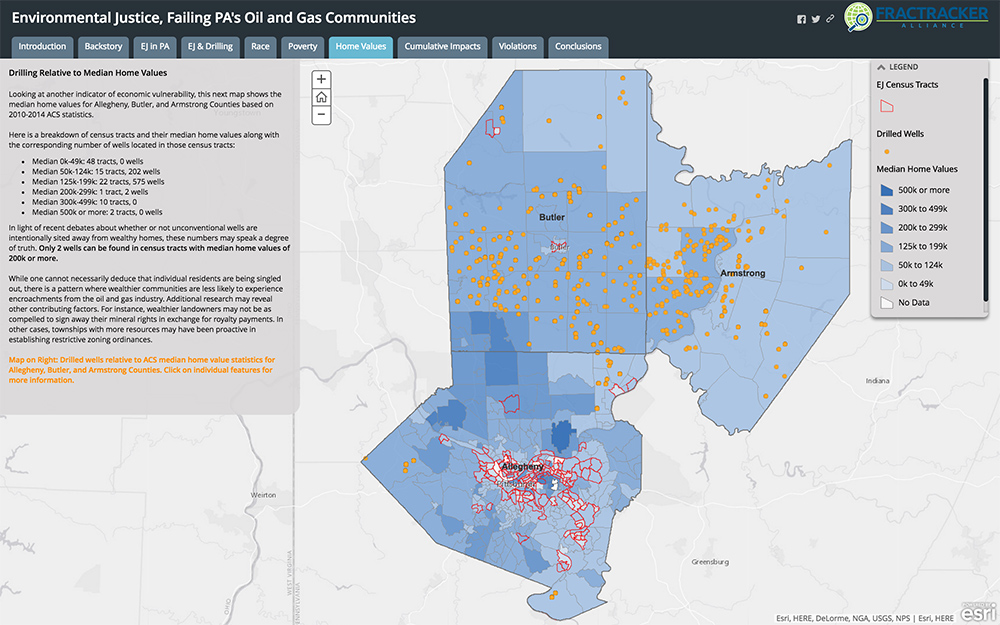
A previously proposed route for the DAPL would have put Bismarck—a city that is 92% white—just downriver of its Missouri River crossing. This initial route was rejected due to its potential threat to Bismarck’s water supply, according to the Army Corps. In addition to being located upriver of Bismarck’s water intake, the route would have been 11 miles longer and would have passed through “wellhead source water protection” areas that are avoided to protect municipal water supply wells. Passing through this “high consequence area” would have required further actions and additional safety measures on the part of Dakota Access LLC. The route would also have been more difficult to stay at least 500 feet away from homes, as required by the North Dakota Public Service Commission. The route was changed and pushed as close to Sioux County as possible, the location of the Standing Rock Indian Reservation.
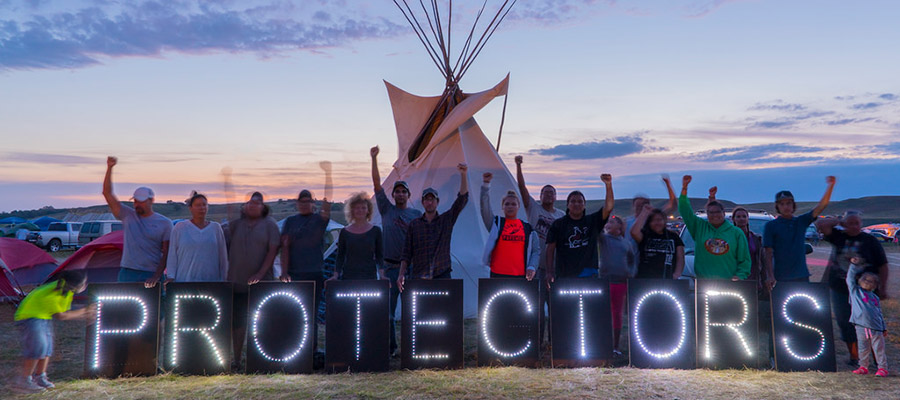
Protests: The Water Protectors
The Standing Rock Sioux Tribe has taken an active stance against Bakken Oil Development in the past. In 2007, the Reservation passed a resolution to prevent any oil and gas development or pipelines on the Tribal Lands. However, deep concerns about the safety of DAPL led protesters to begin demonstrations at Standing Rock in April, 2016. The Standing Rock Sioux Tribe then sued the Army Corps in July, after the pipeline was granted most of the final permits over objections of three other federal agencies. Construction of it, they say, will “destroy our burial sites, prayer sites and culturally significant artifacts.” A timeline of The Standing Rock Sioux Tribe’s litigation addressing DAPL through this period can be found on the EARTHJUSTICE website.
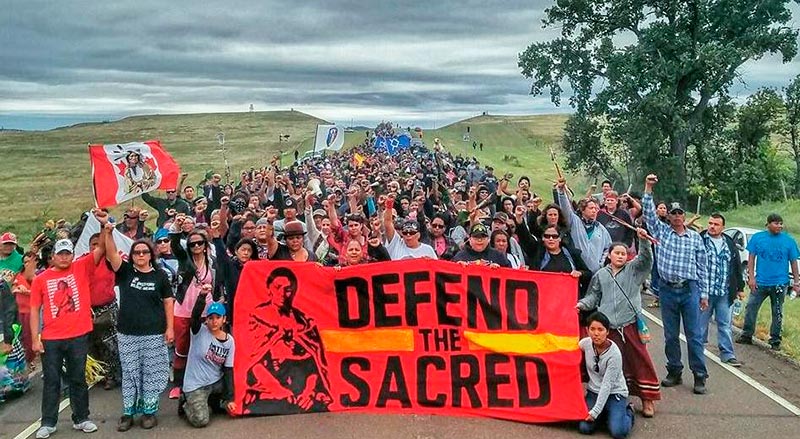
Photo by Derrick Broze/cc
In August, a group organized on the Standing Rock Indian Reservation called ReZpect Our Water brought a petition to the Army Corps in Washington, D.C. stating that DAPL interferes with their ancestral land and water rights. The Tribe sued for an injunction citing the endangerment of water and soil, cultural resources, and the improper use of eminent domain. The suit argued that the pipeline presents a risk to Sioux Tribe communities who live near or downstream of the pipeline. The Missouri River is the main water source for the Standing Rock Sioux Tribe. In September, members of the Standing Rock Sioux tribe in North Dakota finally made headlines.
Federal Injunction
On September 9, District Judge James Boasberg denied the Standing Rock Sioux Tribes preliminary injunction request to prevent the Army Corps from granting the easement. The Judge ordered Dakota Access to stop work only on the section of pipeline nearest the Missouri river until the Army Corps granted the crossing easement. The excavation of Standing Rock burial grounds and other sacred sites, where direct action demonstrators were clashing with Dakota Access security and guard dogs, was allowed to continue. Later that same day, a joint statement was released by the U.S. Department of Justice, the Department of the Interior, and the U.S. Army:
“We request that the pipeline company voluntarily pause all construction activity within 20 miles east or west of Lake Oahe.”
In the map above the 20-mile buffer zone is shown in light green. Regardless of the request from the three federal agencies to pause construction, Dakota Access’s parent company Energy Transfer Partners LP ignored requests to voluntarily halt construction. Dakota Access LLC has also disregarded the instructions of the federal judge. The Army Corps declared Dakota Access LLC would not receive the easement required to cross the waterway until after 2016, but that has not stopped the company from pushing forward without the necessary permits. The pipeline has been built across all of Cannonball Ranch right up to Lake Oahe and the Missouri River, which can be seen in the map above and in drone footage taken November 2, 2016 showing the well pad for the drill rig has been built.
On November 4 the Army Corps requested Dakota Access LLC voluntarily halt construction for 30 days; then on November 8 (Election Day), Dakota Access ignored the request and announced they would begin horizontally drilling under the waterway within weeks. On November 14 Dakota Access filed a lawsuit against the Army Corps arguing that permits are not legally required. Later that day, the Army Corps responded with a statement that said any construction on or under Corps land bordering Lake Oahe cannot occur because the Army has not made a final decision on whether to grant an easement. In the issued statement, Assistant Secretary of the Army Jo-Ellen Darcy said “in light of the history of the Great Sioux Nation’s dispossession of lands [and] the importance of Lake Oahe to the Tribe,” the Standing Rock Sioux tribe would be consulted to help develop a timetable for future construction plans. The Army Corps has since denied the easement entirely.
Violence Against Protesters
Law enforcement has used physical violence to disrupt demonstrations on public lands and to prevent direct action activities as protesters aim to shut down construction on private land held by Energy Transfer Partners LP. Since September 4, law enforcement agencies led by the Morton County Sheriff’s Department have maintained jurisdiction over the protests. Officers from other counties and states have also been brought in to assist. Morton County and the State of North Dakota do not have the jurisdiction to evict protesters from the camps located on Army Corps land. Well over 500 activists have been arrested.
The majority of clashes with law enforcement have occurred on the roadways exiting the Army Corps lands, or at the access points to the privately owned Cannonball Ranch (shown on the map). Morton County has spent more than $8 million keeping direct action protesters from shutting down excavation and construction activities along the path of the pipeline. Meanwhile, the state of North Dakota has spent over $10 million on additional law enforcement officials to provide assistance to Morton County.
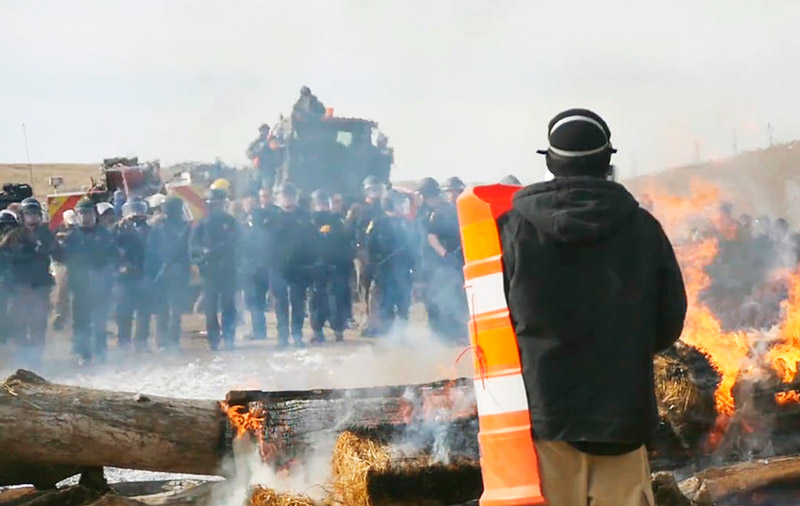
DAPL protests from video by UnicornRiot/cc
The first violent confrontation occurred on September 3 after Dakota Access bulldozed an area of Cannonball Ranch identified by the Tribe as a sacred site hosting burial grounds. At that time, the site was actively being contested in court and rulings still had not been made. The Tribe was seeking a restraining order, known as a “preliminary injunction” to protect their cultural heritage. Direct action demonstrators put themselves in the way of bulldozers to stop the destructive construction. In response, Dakota Access LLC security personnel assaulted protesters with pepper spray and attack dogs. The encounter was documented by Democracy Now reporter Amy Goodman.
October 27, the Morton County Sheriff’s Department reinforced with 300 police from neighboring counties and states, raided the frontline camp site making mass arrests. In response, demonstrators reinforced a blockade of the 1806 bridge, shown in the map above. The most violent clash was witnessed on public lands on November 20, 2016 at this bridge, which demarcates Army Corps land. The Police forces’ use of “non-lethal” bean bag rounds, rubber bullets, tear gas, pepper spray, water hoses, LRAD, and explosive flash grenades on peaceful demonstrators has been criticized by many groups. Fire hoses were used on protesters in freezing conditions resulting in dozens of demonstrators needing treatment for hypothermia. In total 300 people were injured according to a release from the standing rock medic and healer council.
Most recently, the Army Corps has targeted the Standing Rock Demonstration by determining that it is no longer safe to stay at the Sacred Stone and Oceti Sakowin camps located on Army Corps property. North Dakota Governor Jack Dalrymple has frequently blasted the Army Corps for not removing the protesters.
As of December 5th, federal authorities consider the protesters to be trespassing on federal lands, leaving protesters vulnerable to various citations and possible arrest. The Army Corps has also said that emergency services may no longer be provided in the evacuation area. The Army Corps has jurisdiction on Army Corps lands, and only federal authorities can remove the protesters from federal lands. There are now more than 5,000 activists demonstrating at Standing Rock, and an additional 2,000 U.S. veterans joined the protest this past week for an action of solidarity. Nevertheless, U.S. authorities have said that there are no plans to forcibly remove activists, despite telling them to leave.
Victory and an Uncertain Future
Perhaps as a result of this mass outcry, the Army Corps announced on December 4th—only a day before trespassing claims would be imposed—that Dakota Access LLC’s permit application to cross under the Missouri River and Lake Oahe had been denied. Jo-Ellen Darcy, the Army’s Assistant Secretary for Civil Works, announced:
“Although we have had continuing discussion and exchanges of new information with the Standing Rock Sioux and Dakota Access, it’s clear that there’s more work to do…The best way to complete that work responsibly and expeditiously is to explore alternate routes for the pipeline crossing.”
To determine alternate routes, the Army Corps has announced it will undertake an environmental impact statement which could take years to complete. While this is a major victory for the “water protectors” demonstrating at Standing Rock, it is not a complete victory. Following the Army Corps’ announcement, the two main pipeline investors, Energy Transfer Partners LP and Sunoco Logistics, responded that they:
“…are fully committed to ensuring that this vital project is brought to completion and fully expect to complete construction of the pipeline without any additional rerouting in and around Lake Oahe. Nothing this Administration has done today changes that in any way.”
In fact, prior to the Army Corps denying the easement, numerous democrats in congress called for President Obama to shut down the pipeline. While President Obama has not heeded these calls to shut down the project entirely, he also has not given the green light for the project either. Instead the President stated that the situation needed to be handled carefully and urged the Army Corps to consider rerouting the pipeline. “We’re monitoring this closely and I think, as a general rule, my view is that there’s a way for us to accommodate sacred lands of Native Americans…. I think right now the Army Corps is examining whether there are ways to reroute this pipeline,” the President said.
The Corps decision to conduct a lengthy environmental impact statement is encouraging but, ultimately, the Trump administration may have the final say on the DAPL easement. President-elect Trump has voiced support for the easement in the past, and on December 5th, just one day following the Army Corps’ decision, Trump spokesman Jason Miller commented:
“That’s something we support construction of, and we will review the full situation in the White House and make an appropriate determination at that time.”
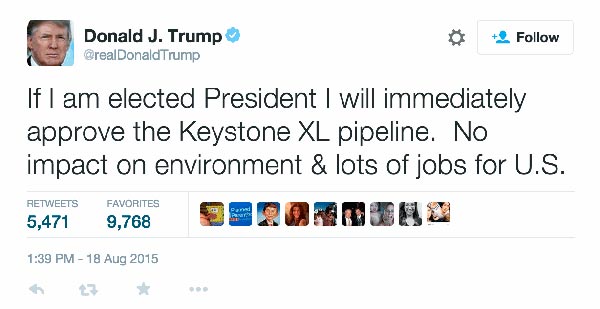
Energy Transfer Partners LP CEO Kelcy Warren donated $103,000 to the Trump campaign and the President-elect has investments in Energy Transfer Partners LP totaling up to $1 million according to campaign financial disclosures. President-elect Trump has made it clear that pipeline projects, specifically the Keystone Access Pipeline rejected by President Obama, will be allowed to move forward along with additional fossil fuel extraction projects.
If the construction company, Dakota Access LLC, continues building the pipeline they are liable to be fined. It is not yet clear whether Dakota Access LLC will “eat” the fine to continue building and drilling, or whether the Army Corps will forcefully stop DAPL. Analysts say the expense of changing the route, such as to the south of the tribal lands, would make the economics of the pipeline a total loss. It is cheaper for Dakota Access LLC to continue to fight the protest despite overwhelming disapproval of the project.
Meanwhile, protestors have refused to leave Standing Rock in fear that the Army Corp will reverse its decision and allow DAPL to proceed, despite requests by the chairman of the Sioux Tribe that demonstrators go home. Many are hopeful that, by stalling the project past January 1st—the deadline by which Energy Transfer Partners LP promised oil companies it would complete construction—the possibility exists that contracts will expire and DAPL loses support from investors.
Other Mapping Resources
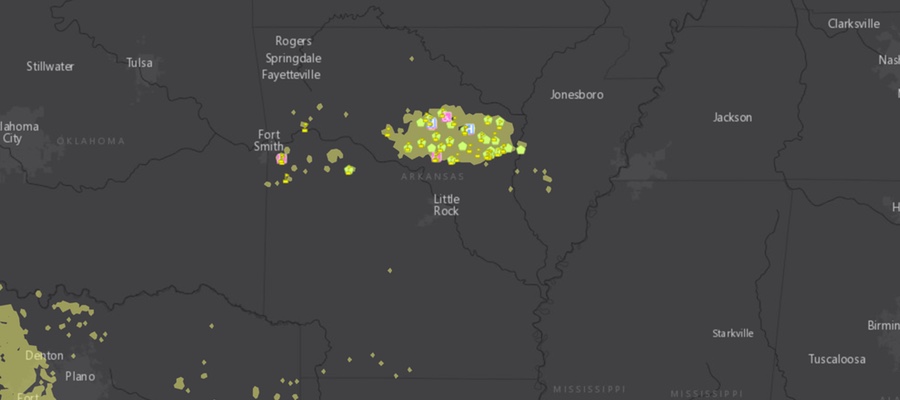
This web map shows the current construction progress of the pipeline.
The New York Times website is hosting a map focusing on the many water crossings of the pipeline route.
The Guardian has a static map on their website similar to our interactive map.
Header photograph by Joe Brusky/flickr/cc


