 Matt Kelso, FracTracker Alliance, 2023
Digital Atlas: Exploring Nature and Industry in the Raccoon Creek Watershed
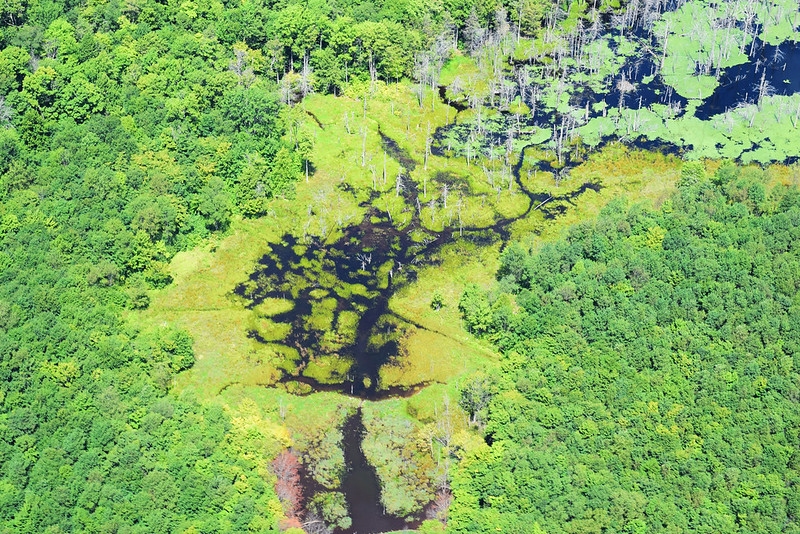
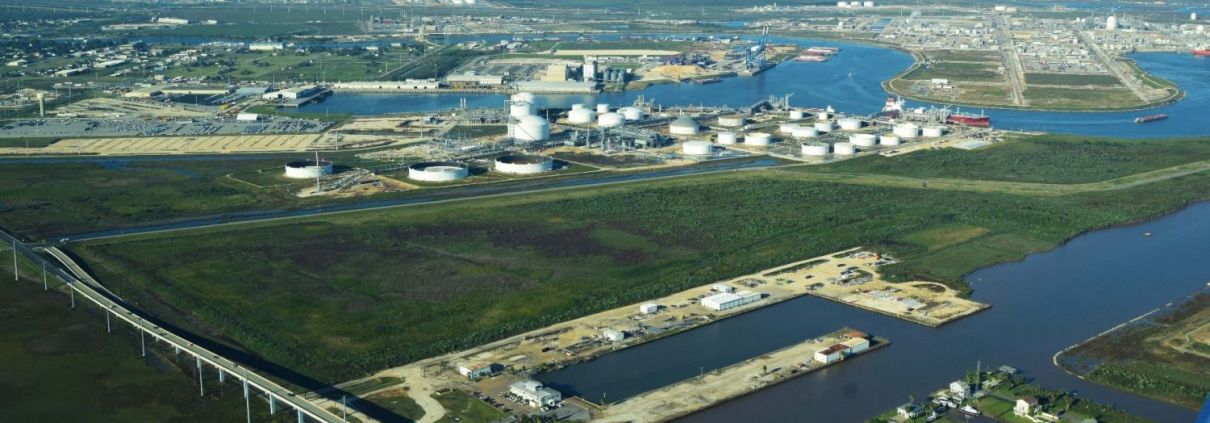
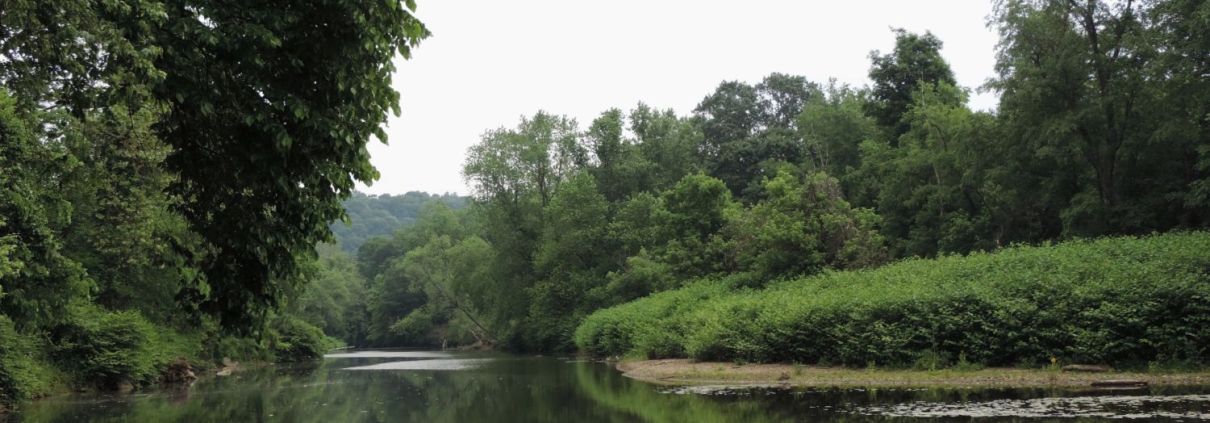
Digital atlas of Pennsylvania’s Raccoon Creek unveils a comprehensive exploration of the watershed, emphasizing its ecological richness, recreational offerings, and the multifaceted impacts of industrial activities.