Northeast Ohio Class II injection wells taken via FracTracker's mobile app, May 2015

OH Class II Injection Wells – Waste Disposal and Industry Water Demand

By Ted Auch, PhD – Great Lakes Program Coordinator

Waste Trends in Ohio

Map of Class II Injection Volumes and Utica Shale Freshwater Demand in Ohio

Map of Class II Injection Volumes and Utica Shale Freshwater Demand in Ohio. Explore dynamic map

It has been nearly 2 years since last we looked at the injection well landscape in Ohio. Are existing disposals wells receiving just as much waste as before? Have new injection wells been added to the list of those permitted to receive oil and gas waste? Let’s take a look.

Waste disposal is an issue that causes quite a bit of consternation even amongst those that are pro-fracking. The disposal of fracking waste into injection wells has exposed many “hidden geologic faults” across the US as a result of induced seismicity, and it has been linked recently with increases in earthquake activity in states like Arkansas, Kansas, Texas, and Ohio. Here in OH there is growing evidence – from Ashtabula to Washington counties – that injection well volumes and quarterly rates of change are related to upticks in seismic activity.

Origins of Fracking Waste

Furthermore, as part of this analysis we wanted to understand the ratio of Ohio’s Class II waste that has come from within Ohio and the proportion of waste originating from neighboring states such as West Virginia and Pennsylvania. Out of 960 Utica laterals and 245+ Class II wells, the results speak to the fact that a preponderance of the waste is coming from outside Ohio with out-of-state shale development accounting for ≈90% of the state’s hydraulic fracturing brine stream to-date. However, more recently the tables have turned with in-state waste increasing by 4,202 barrels per quarter per well (BPQPW). Out-of-state waste is only increasing by 1,112 BPQPW. Such a change stands in sharp contrast to our August 2013 analysis that spoke to 471 and 723 BPQPW rates of change for In- and Out-Of-State, respectively.

Brine Production

Ohio Class II Injection Well trends In- and Out-Of-State, Cumulatively, and on Per Well basis (n = 248).

Figure 1. Ohio Class II Injection Well trends In- and Out-Of-State, Cumulatively, and on Per Well basis (n = 248).

For every gallon of freshwater used in the fracking process here in Ohio the industry is generating .03 gallons of brine (On average, Ohio’s 758 Utica wells use 6.88 million gallons of freshwater and produce 225,883 gallons of brine per well).

Back in August of 2013 the rate at which brine volumes were increasing was approaching 150,000 BPQPW (Learn more, Fig 5), however, that number has nearly doubled to +279,586 BPQPW (Note: 1 barrel of brine equals 32-42 gallons). Furthermore, Ohio’s Class II Injection wells are averaging 37,301 BPQPW (1.6 MGs) per quarter over the last year vs. 12,926 barrels BPQPW – all of this between the initiation of frack waste injection in 2010 and our last analysis up to and including Q2-2013. Finally, between Q3-2010 and Q1-2015 the exponential increase in injection activity has resulted in a total of 81.7 million barrels (2.6-3.4 billion gallons) of waste disposed of here in Ohio. From a dollars and cents perspective this waste has generated $2.5 million in revenue for the state or 00.01% of the average state budget (Note: 2.5% of ODNR’s annual budget).

Freshwater Demand Growing

Ohio Class II Injection Well disposal as a function of freshwater demand by the shale industry in Ohio between Q3-2010 and Q1-2015.

Figure 2. Ohio Class II Injection Well disposal as a function of freshwater demand by the shale industry in Ohio between Q3-2010 and Q1-2015.

The relationship between brine (waste) produced and freshwater needed by the hydraulic fracturing industry is an interesting one; average freshwater demand during the fracking process accounts for 87% of the trend in brine disposal here in Ohio (Fig. 2). The more water used, the more waste produced. Additionally, the demand for OH freshwater is growing to the tune of 405-410,000 gallons PQPW, which means brine production is growing by roughly 12,000 gallons PQPW. This says nothing for the 450,000 gallons of freshwater PQPW increase in West Virginia and their likely demand for injection sites that can accommodate their 13,500 gallons PQPW increase.

Where will all this waste go? I’ll give you two guesses, and the first one doesn’t count given that in the last month the ODNR has issued 7 new injection well permits with 9 pending according to the Center For Health and Environmental Justice’s Teresa Mills.

Mess is near Stone Lantz pad, WV. - Photo by Bill Hughes

Stream Crossings – Oil and water don’t mix

By Bill Hughes, WV Community Liaison, FracTracker Alliance

West Virginia has generously allowed the shale gas industry to occupy parts of our private land (for profit), namely the Lewis Wetzel Wildlife Management Area (LWWMA). This area is known for 13,500 acres of slopes, trails and forests, providing its inhabitants with great opportunities to hunt, fish, hike and camp.

The state of West Virginia does not own the mineral rights for the LWWMA, and the citizens of West Virginia can only manage so much; therefore, it is the responsibility of the Department of Natural Resources, on behalf of all WV citizens, to care for and manage public lands like LWWMA. With much surprise, the DNR has not only allowed oil and gas occupation of LWWMA, but has not been permitted to impose any regulation, supervision, or any other type of state-initiated enforcements. This approach is primarily due to the lack — or absence of inspectors in the Office of Oil and Gas — division of the Department of Environmental Protection. Often the inspectors that are available are simply playing catch up since the industry and market made some unexpected changes, according to DEP spokeswoman, Kathy Cosco.

Where is the reclamation?

I have been of the impression that once drilling and fracturing is done and the wells are put into production, that some form of reclamation must occur. To my dismay, no part of the drilling industry has taken responsibility for stream crossings, and clearly has no intention in doing so. Everybody has ostensibly packed their bags and gone home, leaving a mess of abandoned stream crossings behind. It is very apparent that no improvements will be done voluntarily by the companies that have created all the well pads in the area. Now the question remains: are we stuck with the stream crossings the way they are now? Or can the state order that these abandoned, inadequate stream crossings be removed?

How Not to Do Stream Crossings

The four photos below depict the deplorable, unacceptable, and disgraceful conditions of the stream crossings left behind by the drilling industry. The DNR and the State of WV have known about these conditions for years, yet have not required that any improvements to be made. Click on each poor stream crossing image to enlarge it:

Near Dry Ridge, API 47-103-02433. All of the water is flowing around the pipes.

Near Dry Ridge, WV. API 47-103-02433

Near Sees Run at Buffalo Run, WV

Near Sees Run at Buffalo Run, WV

Stone Energy well pad on Buffalo Run near Lantz Farm and LWWMA

Stone Energy well pad on Buffalo Run near Lantz Farm & LWWMA

Mess is near Stone Lantz pad, WV

Stream crossing mess near Stone Lantz pad, WV

These examples might be why some folks are more than just a little incredulous when the DNR said that it was going to lease public lands under the river for drillers to take advantage of, promising and assuring that they protect the Ohio River from any drilling-related problems. If the DNR cannot handle the size of the stream water flow, or find a better way to enforce responsible behavior from the drillers, then the Ohio River and the citizens of West Virginia are surely in trouble.

In Need of Higher Standards

The picture below is a depiction of a good stream crossing, installed by someone other than a drilling company. Is there any hope that we will ever expect drillers to do this quality of reclamation to the places we cherish and call home? From an enforcement standpoint, it is clear that these actions will not be voluntary. West Virginia’s DEP has several divisions that focus on land reclamation, environmental remediation and land restoration; however, all of these encourage voluntary action, something we don’t expect to see from drilling companies in the near future.

Buffalo Run crossing going to the William WGGS compressor station. This is what all the permanent stream crossings should look like.

Buffalo Run crossing going to the William WGGS compressor station. This is what all the permanent stream crossings should look like.

What is fracking fluid?

Has our beer been fracked?

By Matt Unger and Gianna Calisto, FracTracker PA Interns

Recently, a Grist.com article, entitled Hey! Did somebody frack my favorite beer? caught our attention here at FracTracker Alliance. In the piece, a concerned citizen questioned whether or not fracking could be affecting what many consider to be the crown jewel of Pennsylvania brewing – Yuengling. The author responded very thoroughly, but needed a map to help show the locations of breweries closest to drilling. To help identify any potential problems and hopefully allow the Commonwealth’s beer drinkers to drink easily tonight, we’ve pulled together such a map.

The PA Beer and Unconventional Drilling Map

Beer and Fracking Map

Click on the map to explore the breweries and nearby drilling activity

On this map you will see all of the drilled wells (orange), permitted wells (purple), and breweries / brewpubs that we could find in Pennsylvania as of 11-16-2014. The data was gathered from the PA DEP website and The Beer Mapping Project, as well as from a tool our map below contains that allows the viewer to measure distances between two points.

The breweries/brewpubs in the South Central and South Eastern parts of the state are located quite a long distance away from unconventional well pads. This means that Yuengling is likely safe so long as there are no pipeline or traffic incidents nearby!

Even the other areas of Pennsylvania show that brewing near areas of fracking is relatively uncommon. However, there are a few exceptions, particularly in the North Eastern and South Western parts of the state.

Select Results

  • Yuengling Brewery: 38 Miles from the nearest permitted well, 40 miles from the nearest drilled well.
  • Iron City Brewing Company: 12 miles from the nearest permitted well, 11.7 miles from the nearest drilled well. Both well sites are upstream from the brewery.
  • Nimble Hill Brewing Company: 0.5 miles from nearest drilled and permitted well

Use the measure tool on the fullscreen map to explore more about PA brewing and its proximity to drilling.

Things to Consider

The Grist article that we referred to earlier did a great job at outlining some of the risks of drilling and caveats to supporting your favorite brewery. Simply being located near a drilling site does not necessarily mean that the area’s water and air are polluted, but it is a risk. In addition to the points that Grist made, keep in mind that fracking can have other, more indirect effects on the beer industry; well pads are not the only places where effects on the environment can be seen. Spills and traffic involving the transportation of drilling resources, products, and waste pose very serious risks through the areas that these items are transported. This intense industrial activity can also give off localized air pollution. The map above only begins to highlight all of the potential beer-scare scenarios, unfortunately.

If you do feel that your favorite beer is being affected by nearby drilling activity, there are very easy things that you can do, as the Grist article explains. In the mean time, we at FracTracker will happily taste test each PA brewery’s product should the need arise!

If there are other maps that you would like to see made showing where drilling is located near you, just let us know.

The Water-Energy Nexus in Ohio, Part II

OH Utica Production, Water Usage, and Waste Disposal by County
Part II of a Multi-part Series
By Ted Auch, Great Lakes Program Coordinator, FracTracker Alliance

In this part of our ongoing “Water-Energy Nexus” series focusing on Water and Water Use, we are looking at how counties in Ohio differ between how much oil and gas are produced, as well as the amount of water used and waste produced. This analysis also highlights how the OH DNR’s initial Utica projections differ dramatically from the current state of affairs. In the first article in this series, we conducted an analysis of OH’s water-energy nexus showing that Utica wells are using an ave. of 5 million gallons/well. As lateral well lengths increase, so does water use. In this analysis we demonstrate that:

  1. Drillers have to use more water, at higher pressures, to extract the same unit of oil or gas that they did years ago,
  2. Where production is relatively high, water usage is lower,
  3. As fracking operations move to the perimeter of a marginally productive play – and smaller LLCs and MLPs become a larger component of the landscape – operators are finding minimal returns on $6-8 million in well pad development costs,
  4. Market forces and Muskingum Watershed Conservancy District (MWCD) policy has allowed industry to exploit OH’s freshwater resources at bargain basement prices relative to commonly agreed upon water pricing schemes.

At current prices1, the shale gas industry is allocating < 0.27% of total well pad costs to current – and growing – freshwater requirements. It stands to reason that this multi-part series could be a jumping off point for a more holistic discussion of how we price our “endless” freshwater resources here in OH.

In an effort to better understand the inter-county differences in water usage, waste production, and hydrocarbon productivity across OH’s 19 Utica Shale counties we compiled a data-set for 500+ Utica wells which was previously used to look at differenced in these metrics across the state’s primary industry players. The results from Table 1 below are discussed in detail in the subsequent sections.

Table 1. Hydrocarbon production totals and per day values with top three producers in bold

County

# Wells

Total

Per Day

Oil

Gas

Brine

Production

Days

Oil

Gas

Brine

Ashland

1

0

0

23,598

102

0

0

231

Belmont

32

55,017

39,564,446

450,134

4,667

20

8,578

125

Carroll

256

3,715,771

121,812,758

2,432,022

66,935

67

2,092

58

Columbiana

26

165,316

9,759,353

189,140

6,093

20

2,178

65

Coshocton

1

949

0

23,953

66

14

0

363

Guernsey

29

726,149

7,495,066

275,617

7,060

147

1,413

49

Harrison

74

2,200,863

31,256,851

1,082,239

17,335

136

1,840

118

Jefferson

14

8,396

9,102,302

79,428

2,819

2

2,447

147

Knox

1

0

0

9,078

44

0

0

206

Mahoning

3

2,562

0

4,124

287

9

0

14

Medina

1

0

0

20,217

75

0

0

270

Monroe

12

28,683

13,077,480

165,424

2,045

22

7,348

130

Muskingum

1

18,298

89,689

14,073

455

40

197

31

Noble

39

1,326,326

18,251,742

390,791

7,731

268

3,379

267

Portage

2

2,369

75,749

10,442

245

19

168

228

Stark

1

17,271

166,592

14,285

602

29

277

24

Trumbull

8

48,802

742,164

127,222

1,320

36

566

100

Tuscarawas

1

9,219

77,234

2,117

369

25

209

6

Washington

3

18,976

372,885

67,768

368

59

1,268

192

Production

Total

It will come as no surprise to the reader that OH’s Utica oil and gas production is being led by Carroll County, followed distantly by Harrison, Noble, Belmont, Guernsey and Columbiana counties. Carroll has produced 3.7 million barrels of oil to date, while the latter have combined to produce an additional 4.5 million barrels. Carroll wells have been in production for nearly 67,000 days2, while the aforementioned county wells have been producing for 42,886 days. The remaining counties are home to 49 wells that have been in production for nearly 8,800 days or 7% of total production days in Ohio.

Combined with the state’s remaining 49 producing wells spread across 13 counties, OH’s Utica Shale has produced 8.3 million barrels of oil as well as 251,844,311 Mcf3 of natural gas and 5.4 million barrels of brine. Oil and natural gas together have an estimated value of $2.99 billion ($213 million per quarter)4 assuming average oil and natural gas prices of $96 per barrel and $8.67 per Mcf during the current period of production (2011 to Q2-2014), respectively.

Potential Revenue at Different Severance Tax Rates:

  • Current production tax, 0.5-0.8%: $19 million ($1.4 Million Per Quarter (MPQ). At this rate it would take the oil and gas industry 35 years to generate the $4.6 billion in tax revenue they proposed would be generated by 2020.
  • Proposed, 1% gas and 4% oil: At Governor Kasich’s proposed tax rate, $2.99 billion translates into $54 million ($3.9 MPQ). It would still take 21 years to return the aforementioned $4.6 billion to the state’s coffers.
  • Proposed, 5-7%: Even at the proposed rate of 5-7% by Policy Matters OH and northeastern OH Democrats, the industry would only have generated $179 million ($12.8 MPQ) to date. It would take 11 years to generate the remaining $4.42 billion in tax revenue promised by OH Oil and Gas Association’s (OOGA) partners at IHS “Energy Oil & Gas Industry Solutions” (NYSE: IHS).5

The bottom-line is that a production tax of 11-25% or more ($24-53 MPQ) would be necessary to generate the kind of tax revenue proposed by the end of 2020. This type of O&G taxation regime is employed in the states of Alaska and Oklahoma.

From an outreach and monitoring perspective, effects on air and water quality are two of the biggest gaps in our understanding of shale gas from a socioeconomic, health, and environmental perspective. Pulling out a mere 1% from any of these tax regimes would generate what we’ll call an “Environmental Monitoring Fee.” Available monitoring funds would range between $194,261 and $1.8 million ($16 million at 55%). These monies would be used to purchase 2-21 mobile air quality devices and 10-97 stream quantity/quality gauges to be deployed throughout the state’s primary shale counties to fill in the aforementioned data gaps.

Per-Day Production

On a per-day oil production basis, Belmont and Columbiana (20 barrels per day (BPD)) are overshadowed by Washington (59 BPD) and Muskingum (40 BPD) counties’ four giant Utica wells. Carroll is able to maintain such a high level of production relative to the other 15 counties by shear volume of producing wells; Noble (268 BPD), Guernsey (147 BPD), and Harrison (136 BPD) counties exceed Carroll’s production on a per-day basis. The bottom of the league table includes three oil-free wells in Ashland, Knox, and Medina, as well as seventeen <10 BPD wells in Jefferson and Mahoning counties.

With respect to natural gas, Harrison (1,840 Mcf per day (MPD)) and Guernsey counties are replaced by Monroe (7,348 MPD) and Jefferson (2,447 MPD) counties’ 26 Utica wells. The range of production rates for natural gas is represented by the king of natural gas producers, Belmont County, producing 8,578 MPD on the high end and Mahoning and Coshocton counties in addition to the aforementioned oil dry counties on the low end. Four of the five oil- or gas-dry counties produce the least amount of brine each day (BrPD). Coshocton, Medina, and Noble county Utica wells are currently generating 267-363 barrels of BrPD, with an additional seven counties generating 100-200 BrPD. Only four counties – 1.2% of OH Utica wells – are home to unconventional wells that generate ≤ 30 BrPD.
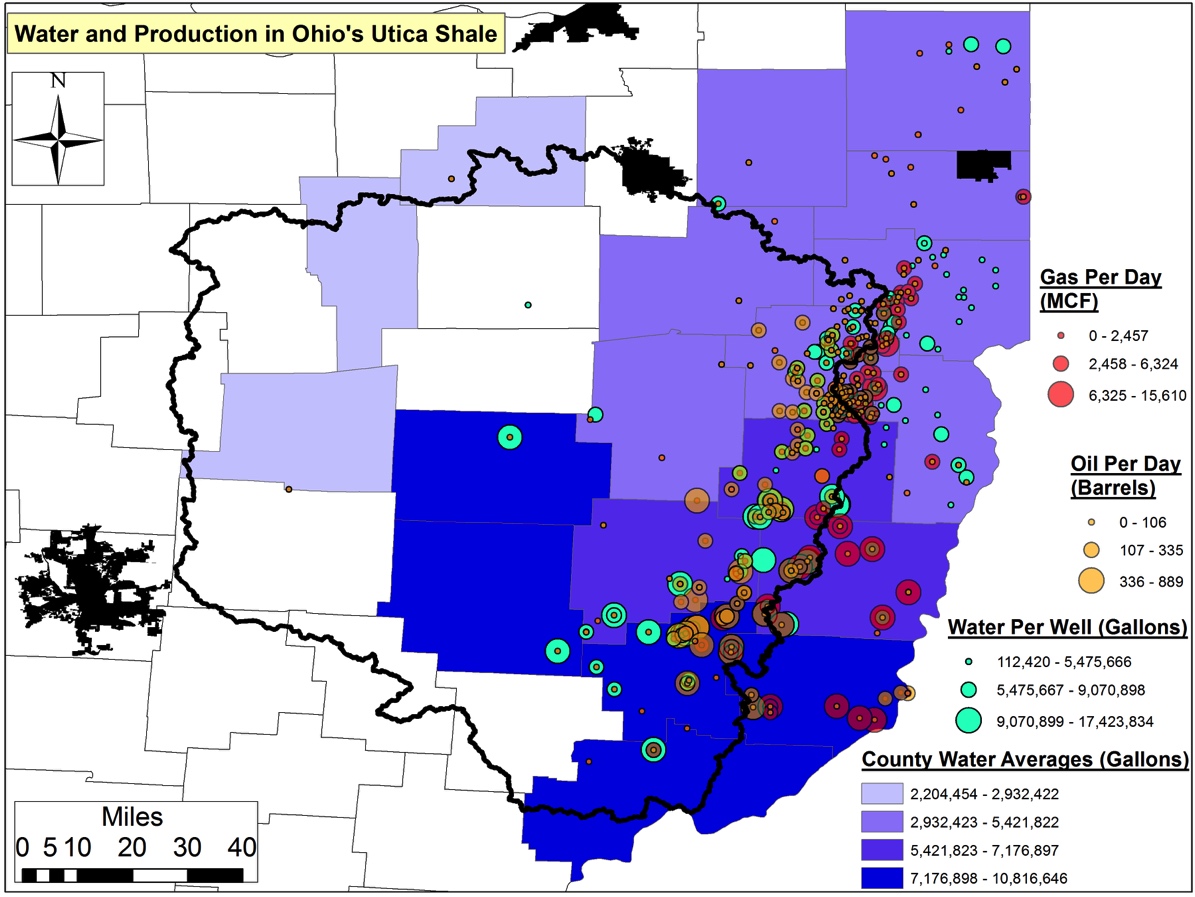
Water Usage

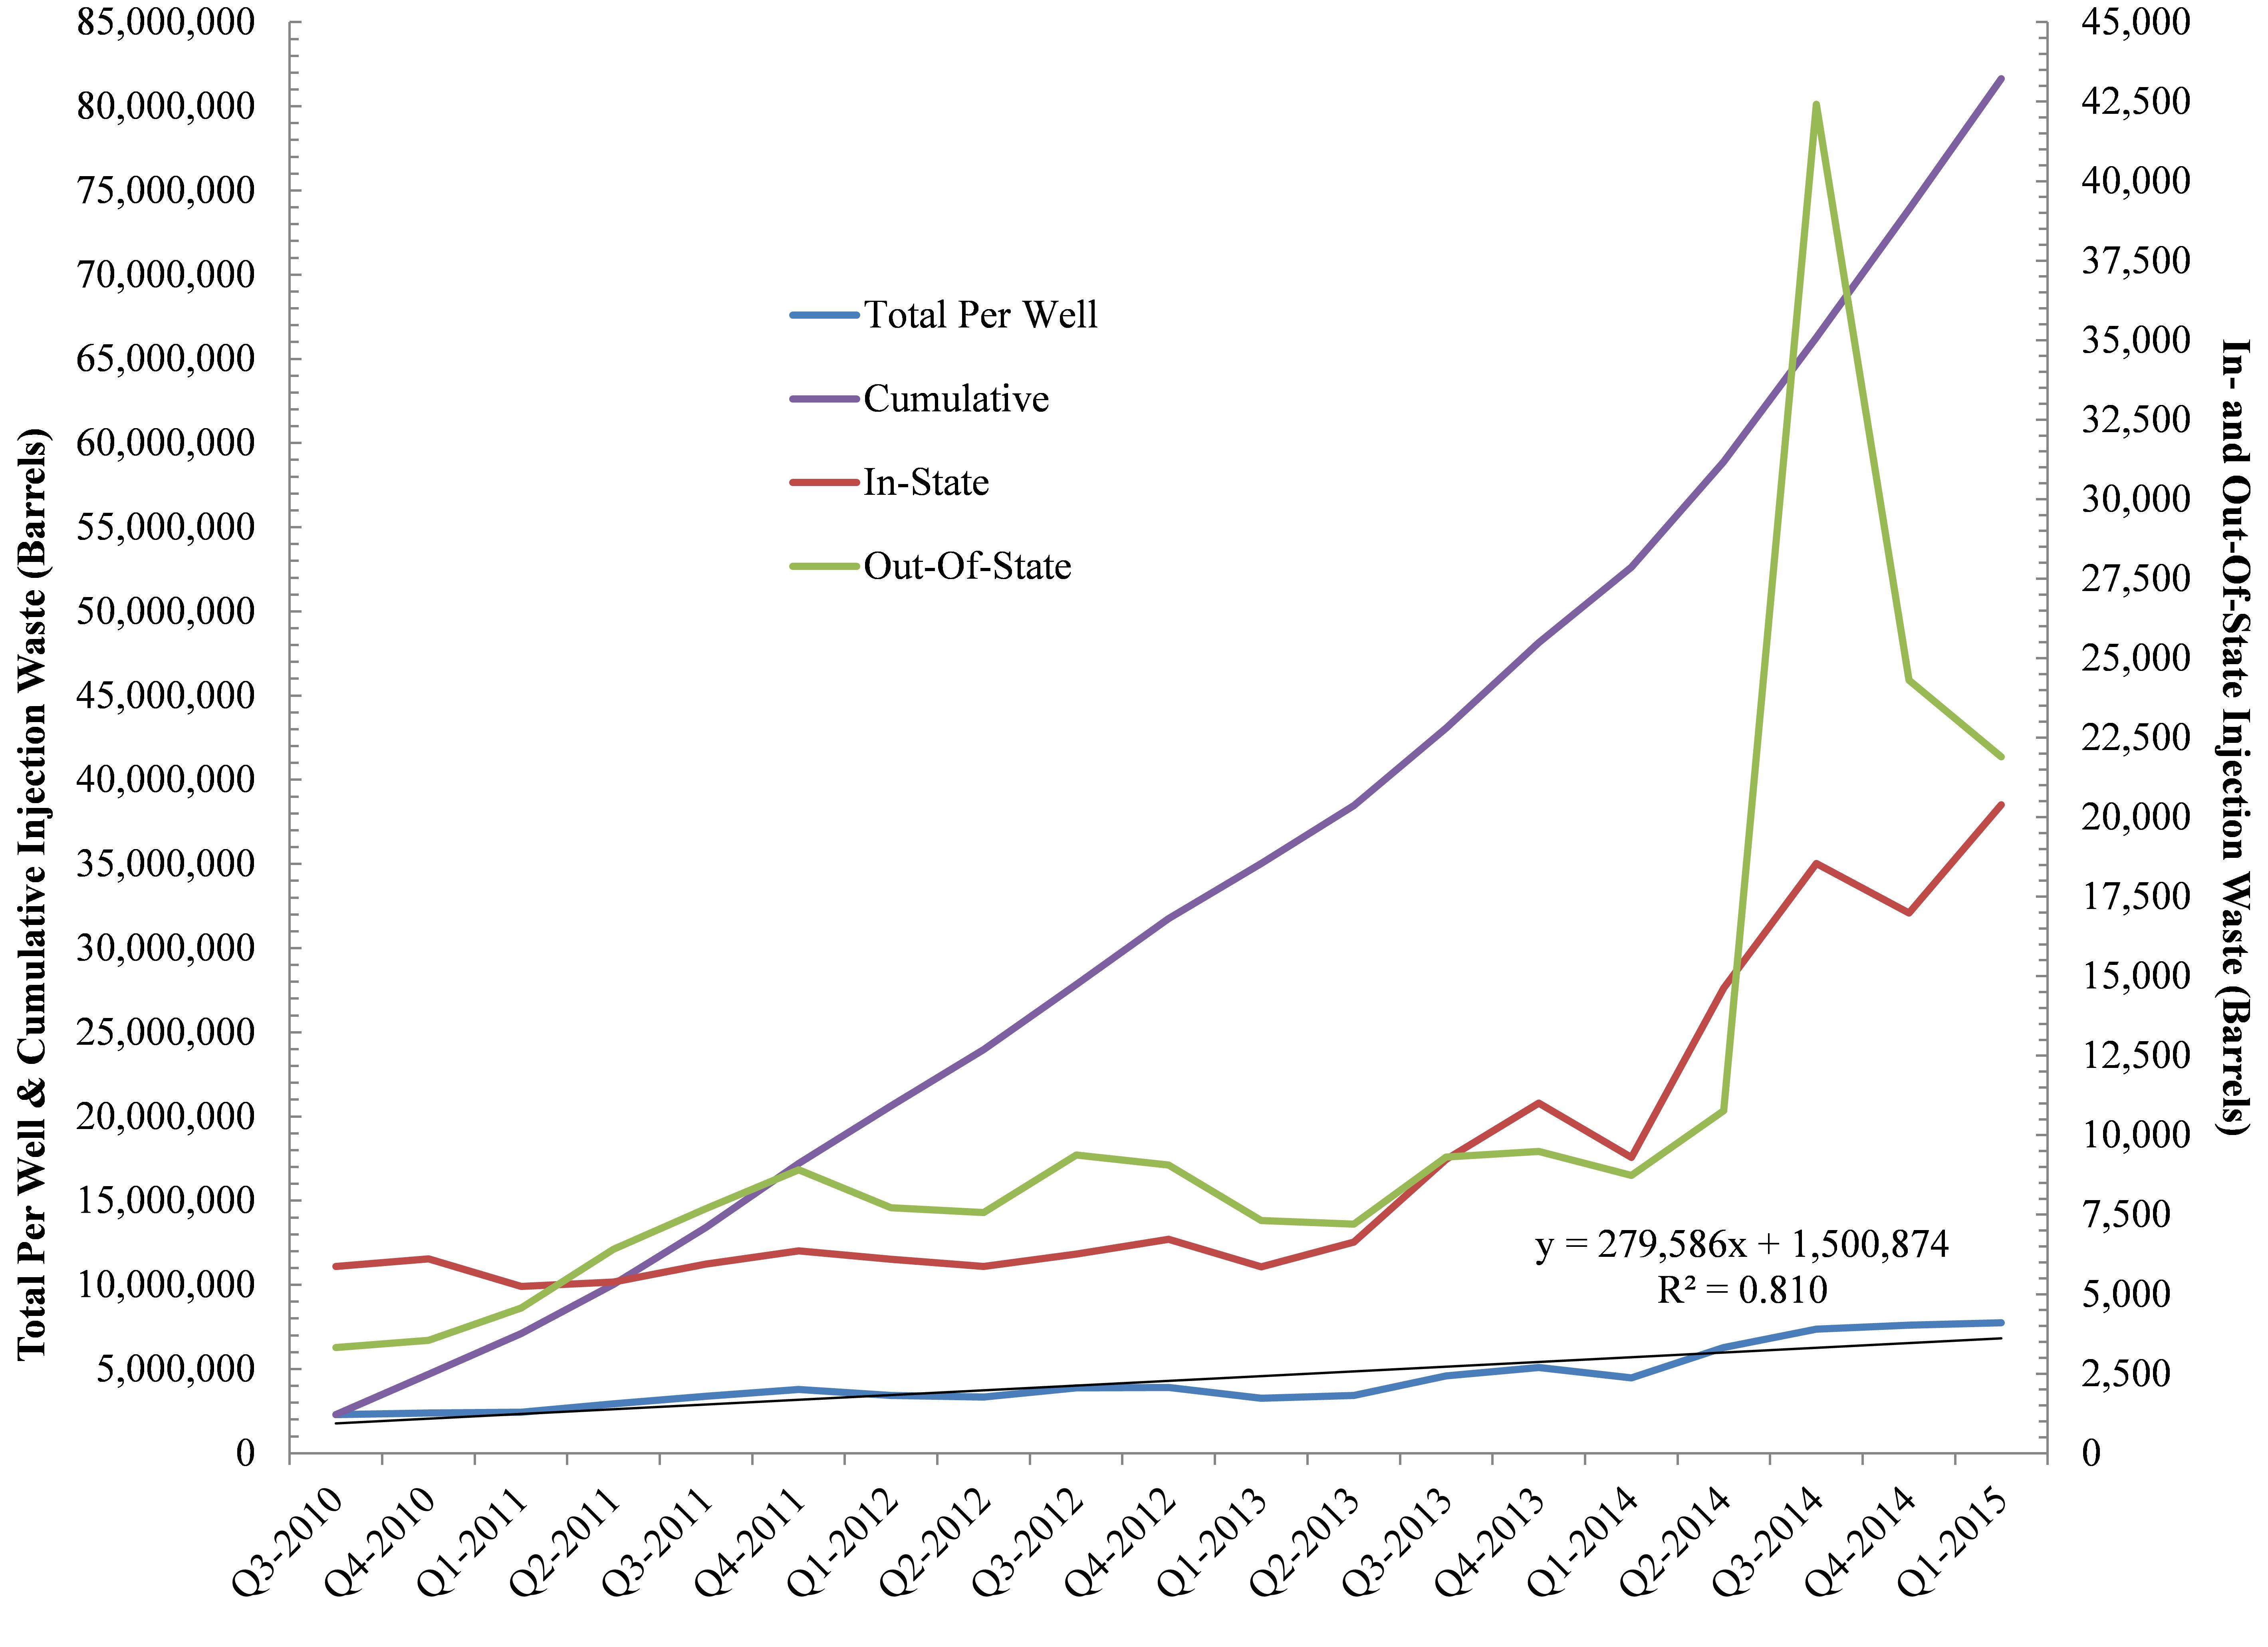
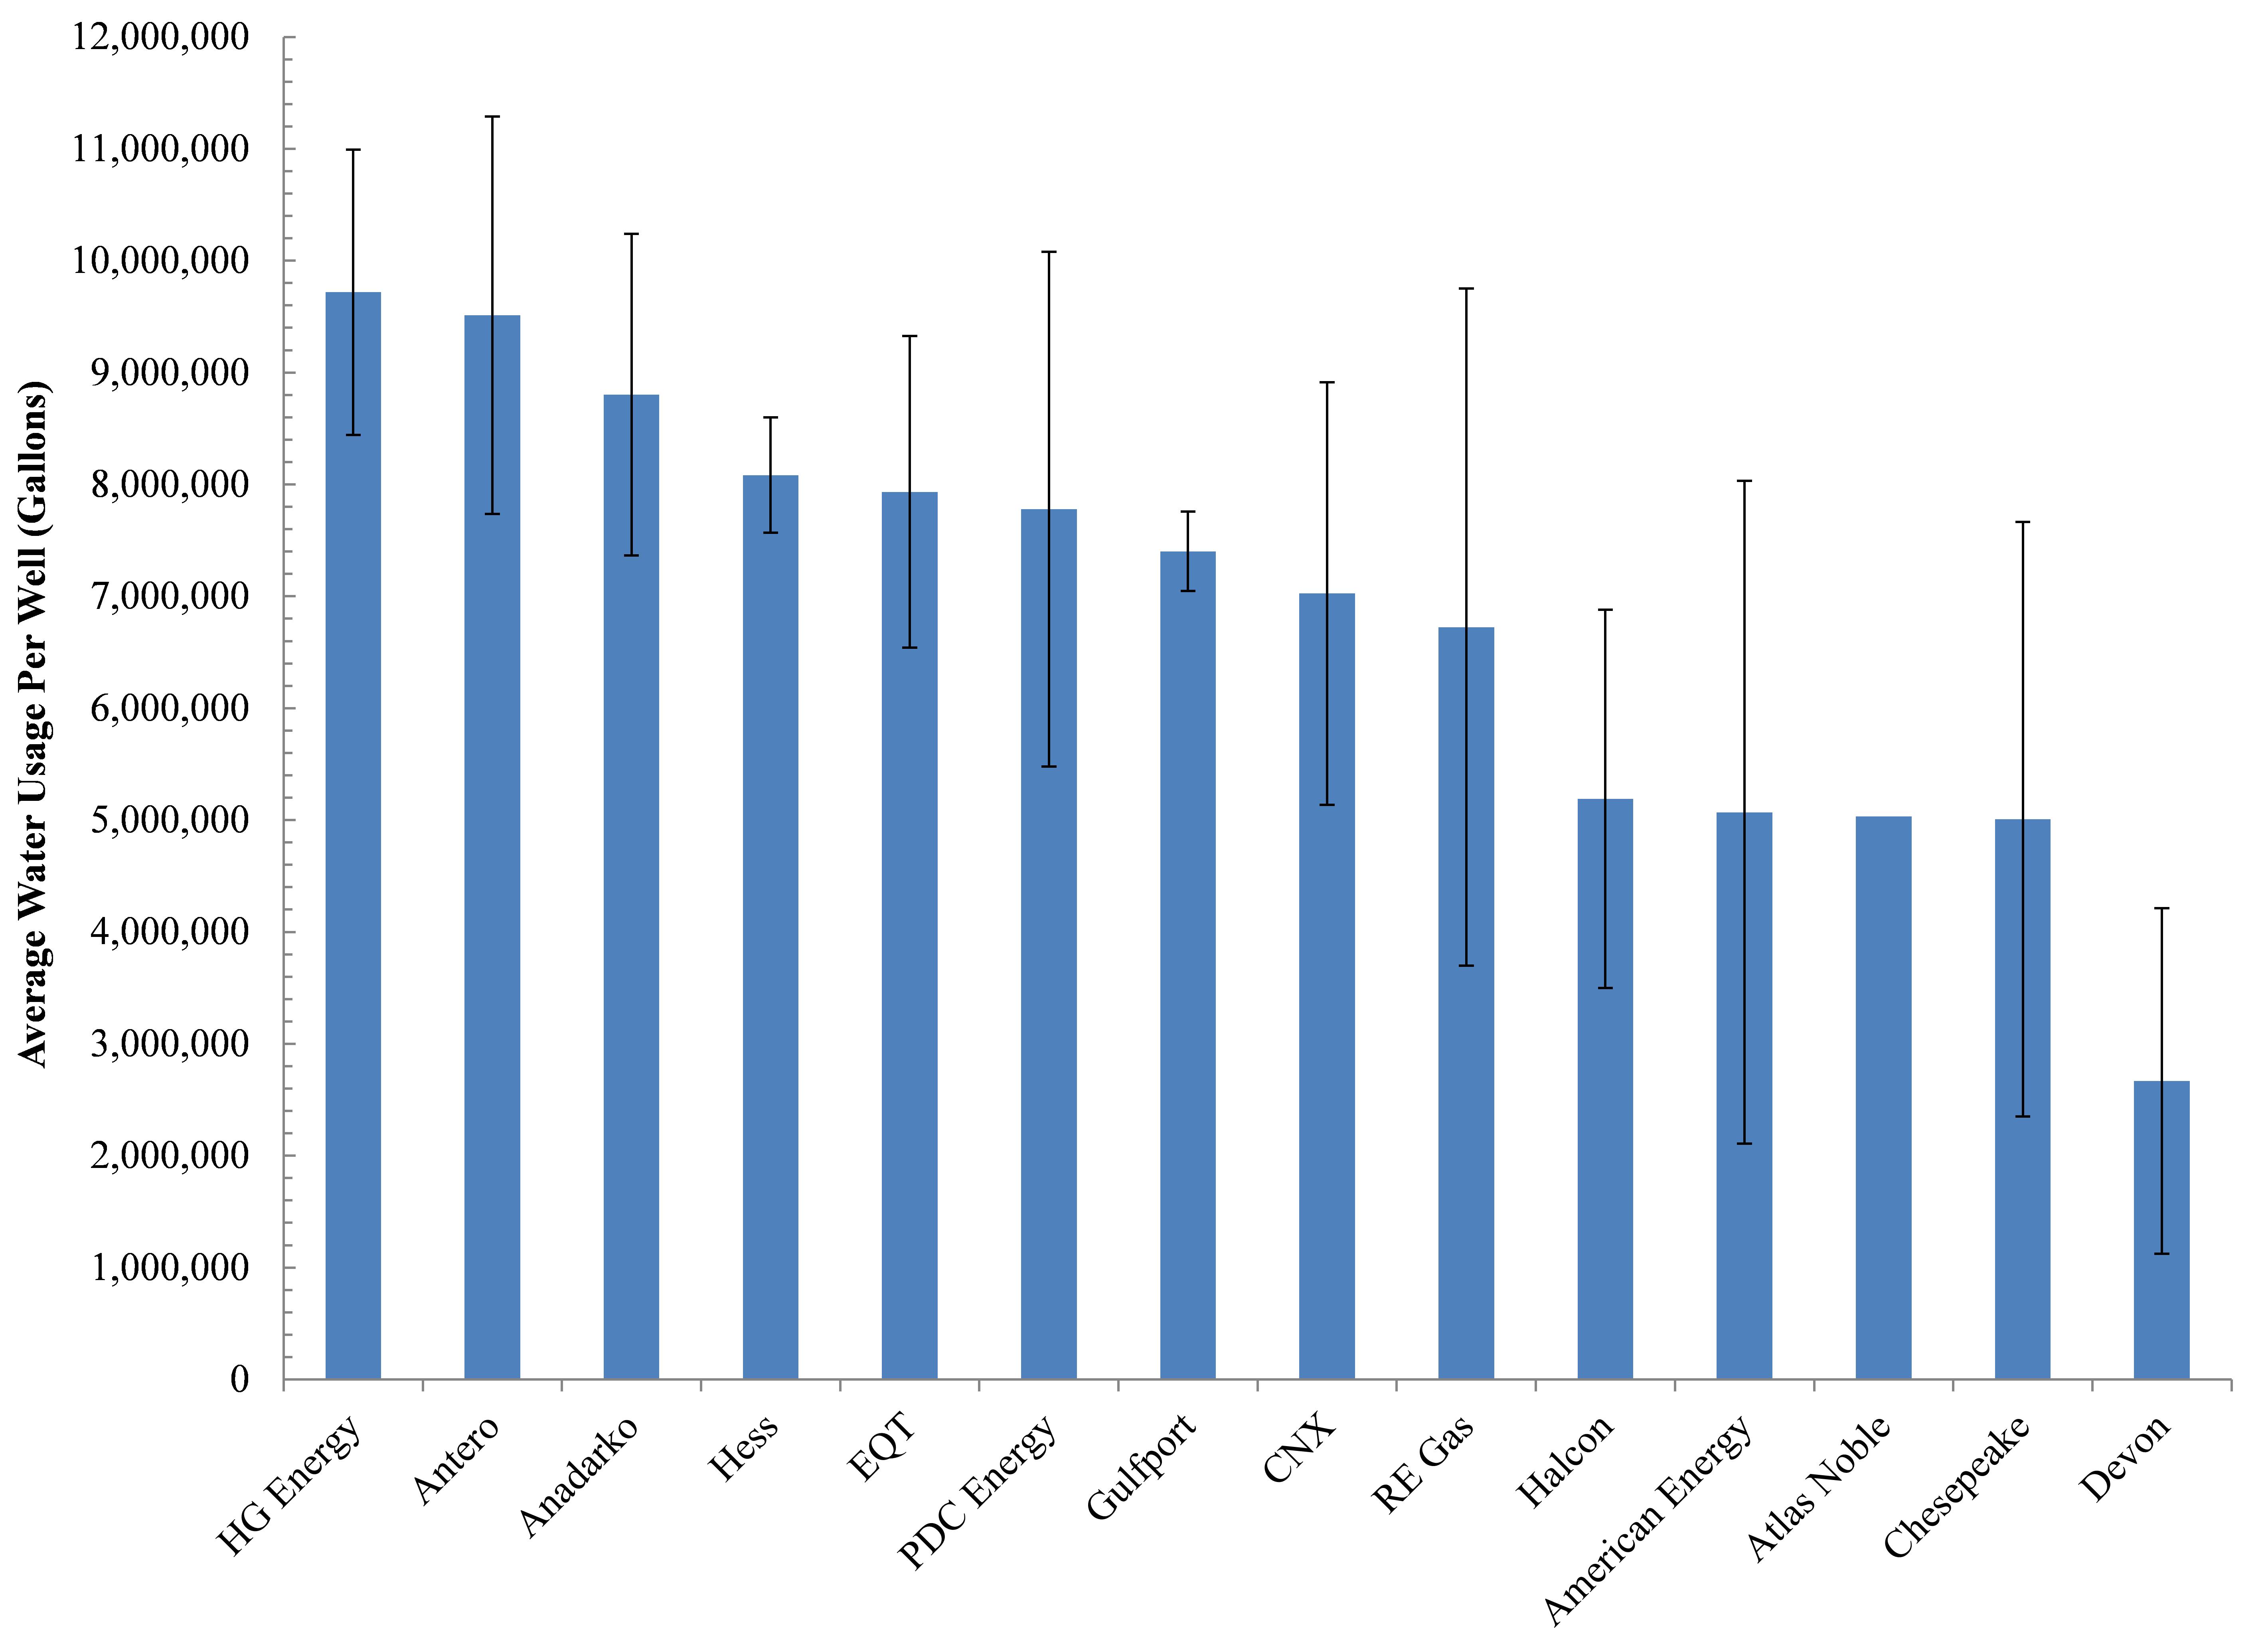
Freshwater is needed for the hydraulic fracturing process during well stimulation. For counties where we had compiled a respectable sample size we found that Monroe and Noble counties are home to the Utica wells requiring the greatest amount of freshwater to obtain acceptable levels of productivity (Figure 1). Monroe and Noble wells are using 10.6 and 8.8 million gallons (MGs) of water per well. Coshocton is home to a well that required 10.8 MGs, while Muskingum and Washington counties are home to wells that have utilized 10.2 and 9.5 MGs, respectively. Belmont, Guernsey, and Harrison reflect the current average state of freshwater usage by the Utica Shale industry in OH, with average requirements of 6.4, 6.9, and 7.2 MGs per well. Wells in eight other counties have used an average of 3.8 (Mahoning) to 5.4 MGs (Tuscarawas). The counties of Ashland, Knox, and Medina are home to wells requiring the least amount of freshwater in the range of 2.2-2.9 MGs. Overall freshwater demand on a per well basis is increasing by 220,500-333,300 gallons per quarter in Ohio with percent recycled water actually declining by 00.54% from an already trivial average of 6-7% in 2011 (Figure 2).

Water and production (Mcf and barrels of oil per day) in OH’s Utica Shale.

Figure 1. Average water usage (gallons) per Utica well by county

Average water usage (gallons) on a per well basis by OH’s Utica Shale industry, shown quarterly between Q3-2010 and Q2-2014.

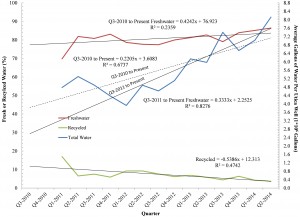
Figure 2. Average water usage (gallons) on per well basis by OH Utica Shale industry, shown quarterly between Q3-2010 & Q2-2014.

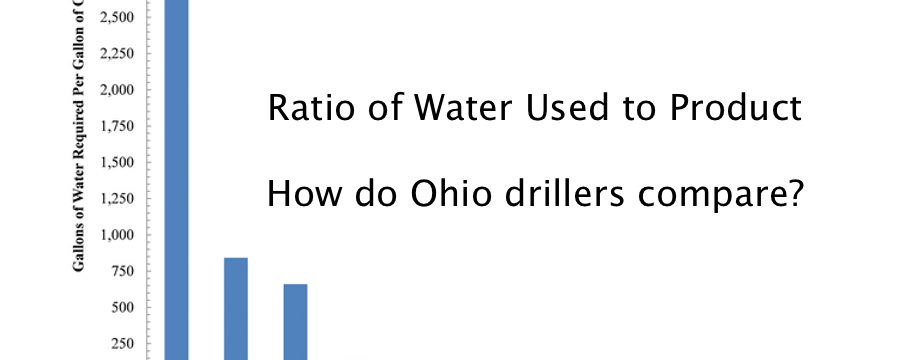
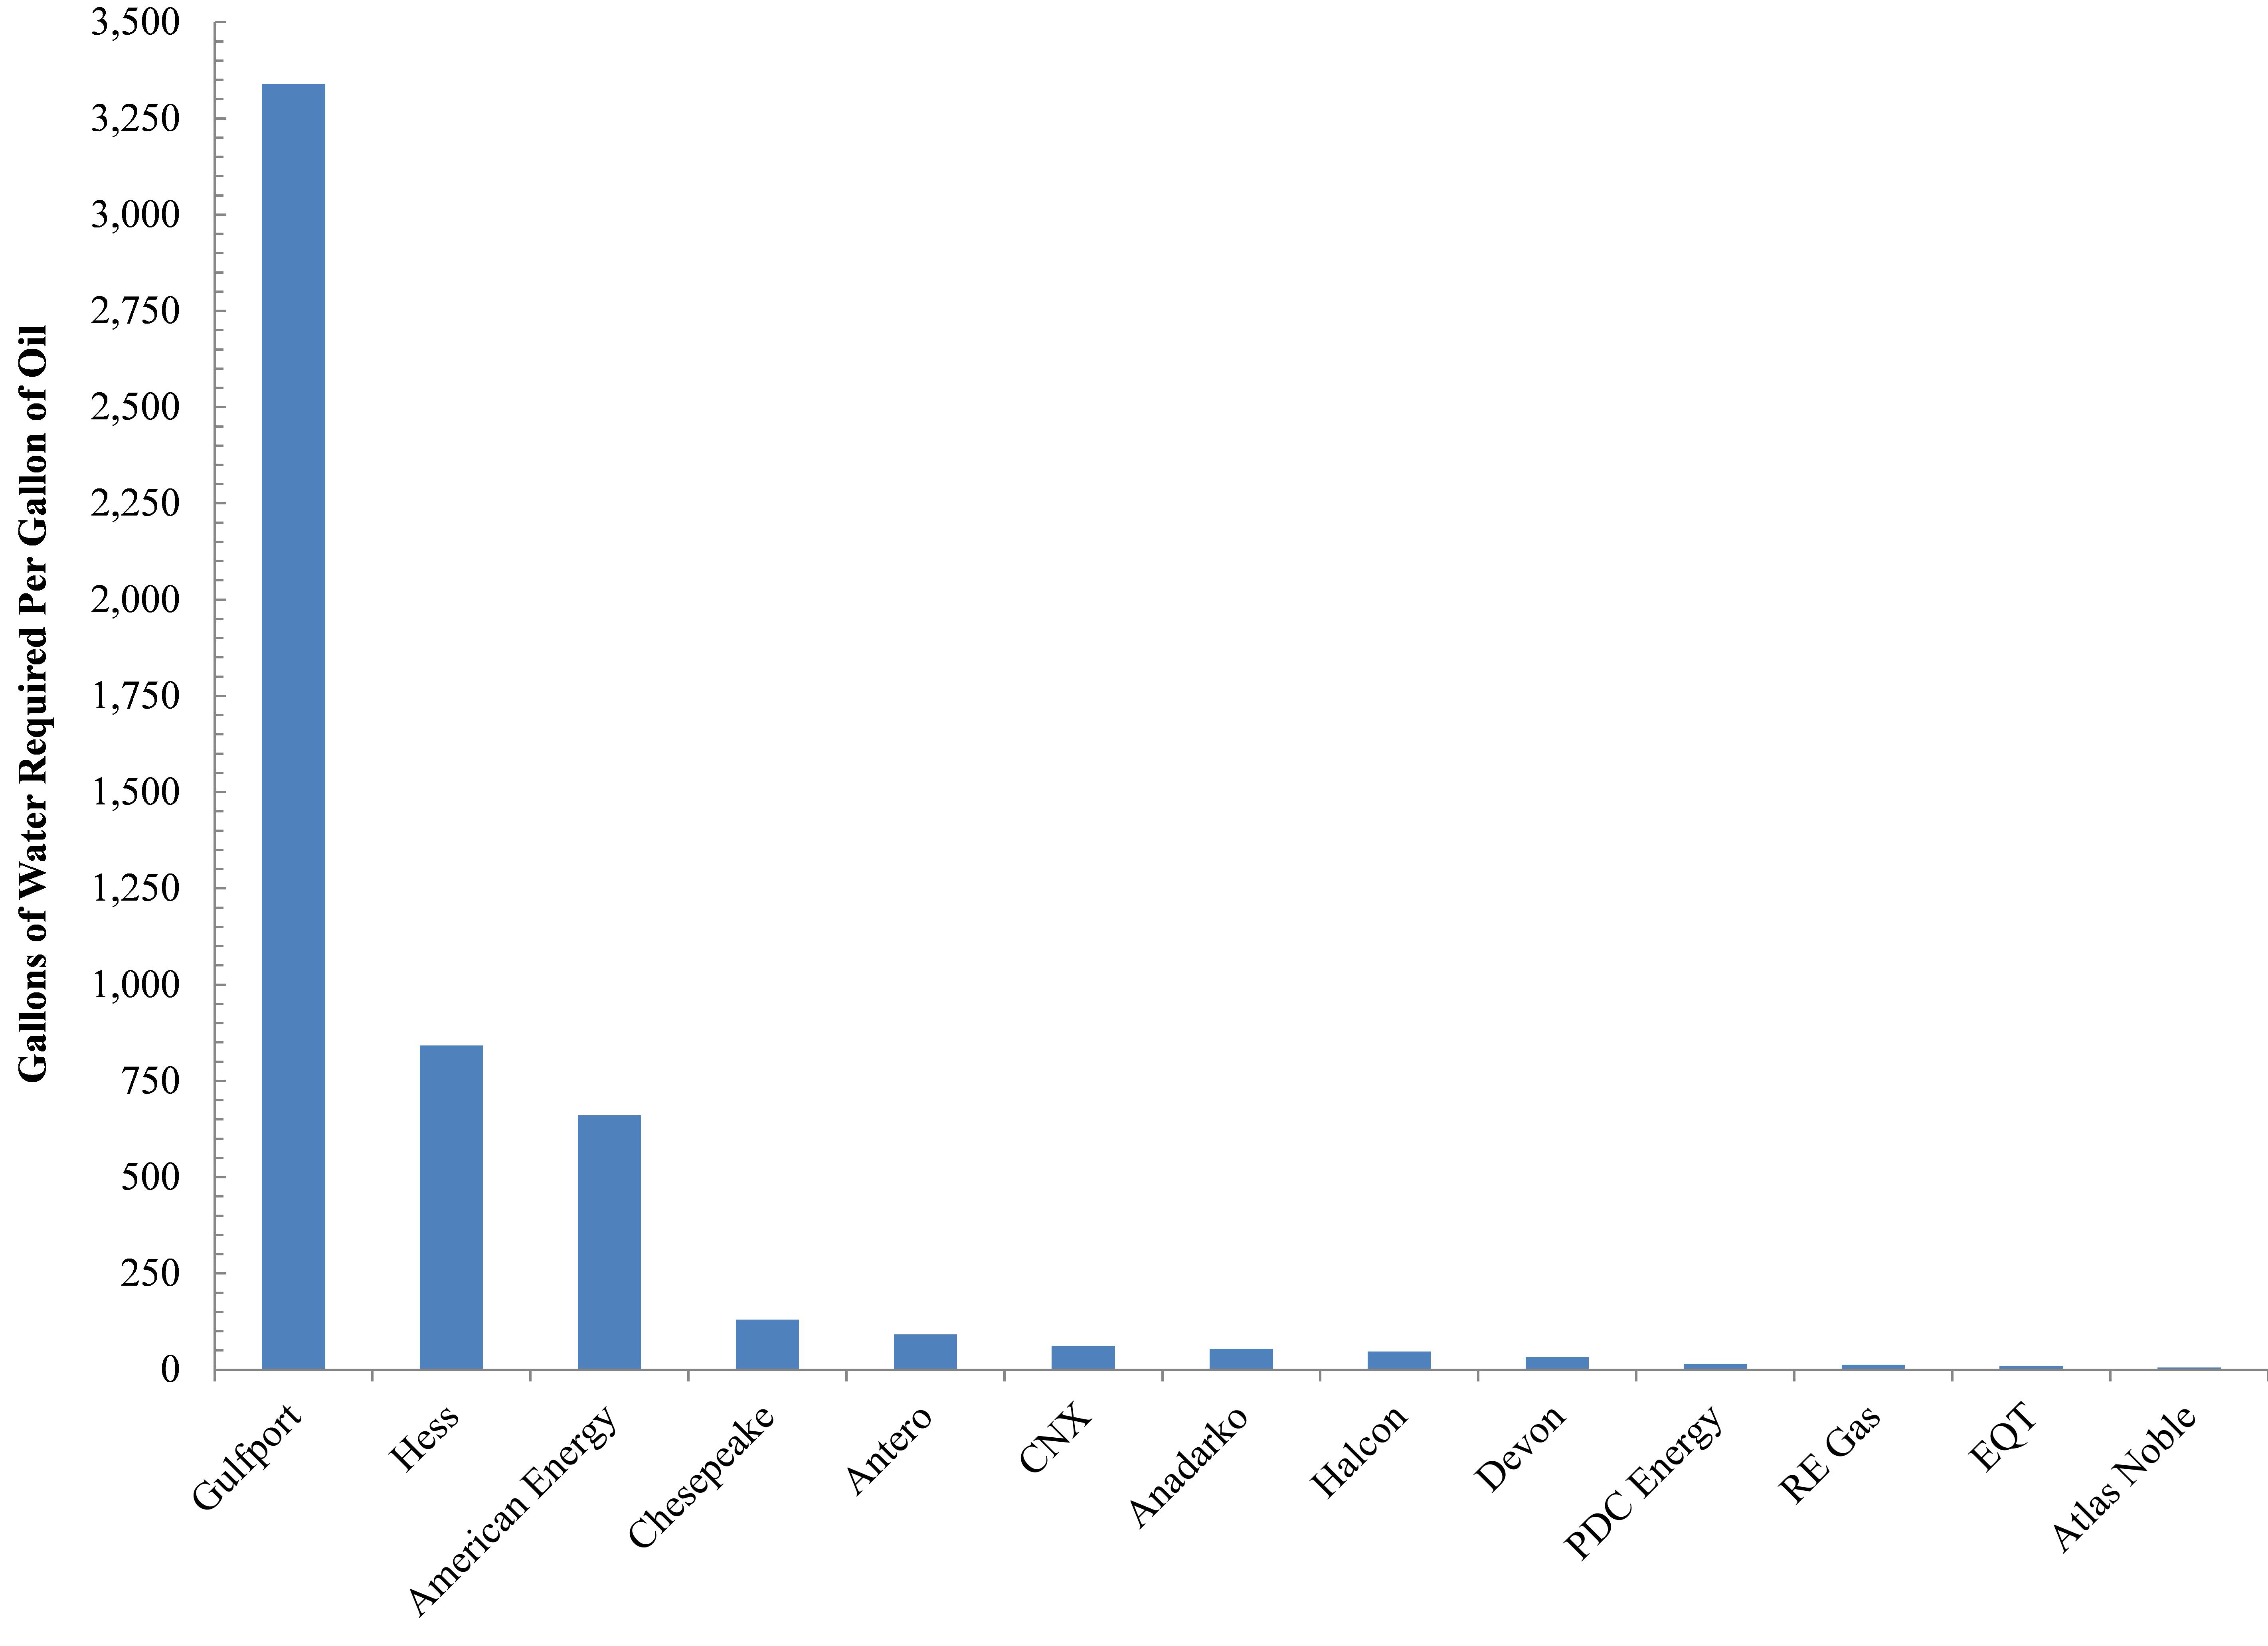
Belmont County’s 30+ Utica wells are the least efficient with respect to oil recovery relative to freshwater requirements, averaging 7,190 gallons of water per gallon of oil (Figure 3). A distant second is Jefferson County’s 14 wells, which have required on average 3,205 gallons of water per gallon of oil. Columbiana’s 26 Utica wells are in third place requiring 1,093 gallons of freshwater. Coshocton, Mahoning, Monroe, and Portage counties are home to wells requiring 146-473 gallons for each gallon of oil produced.

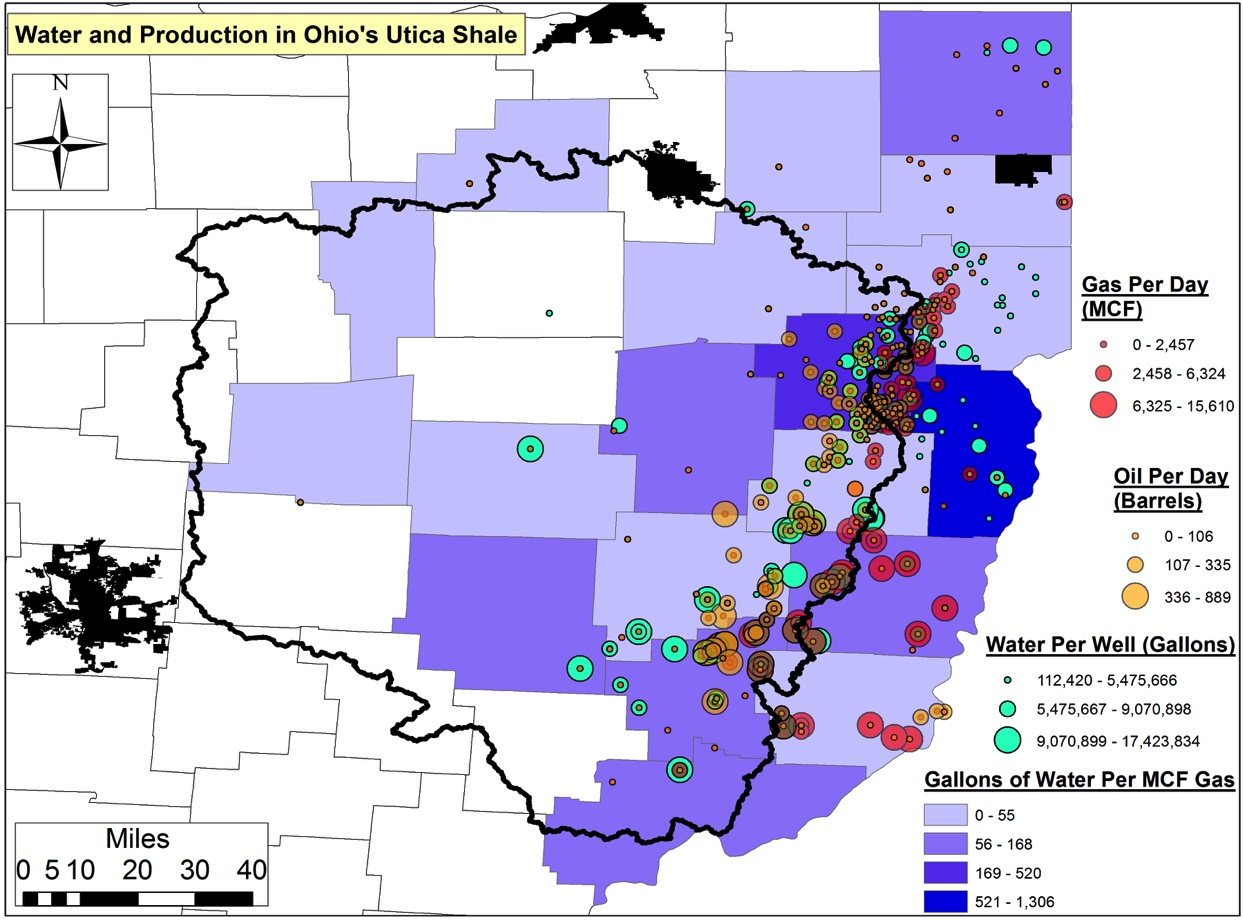
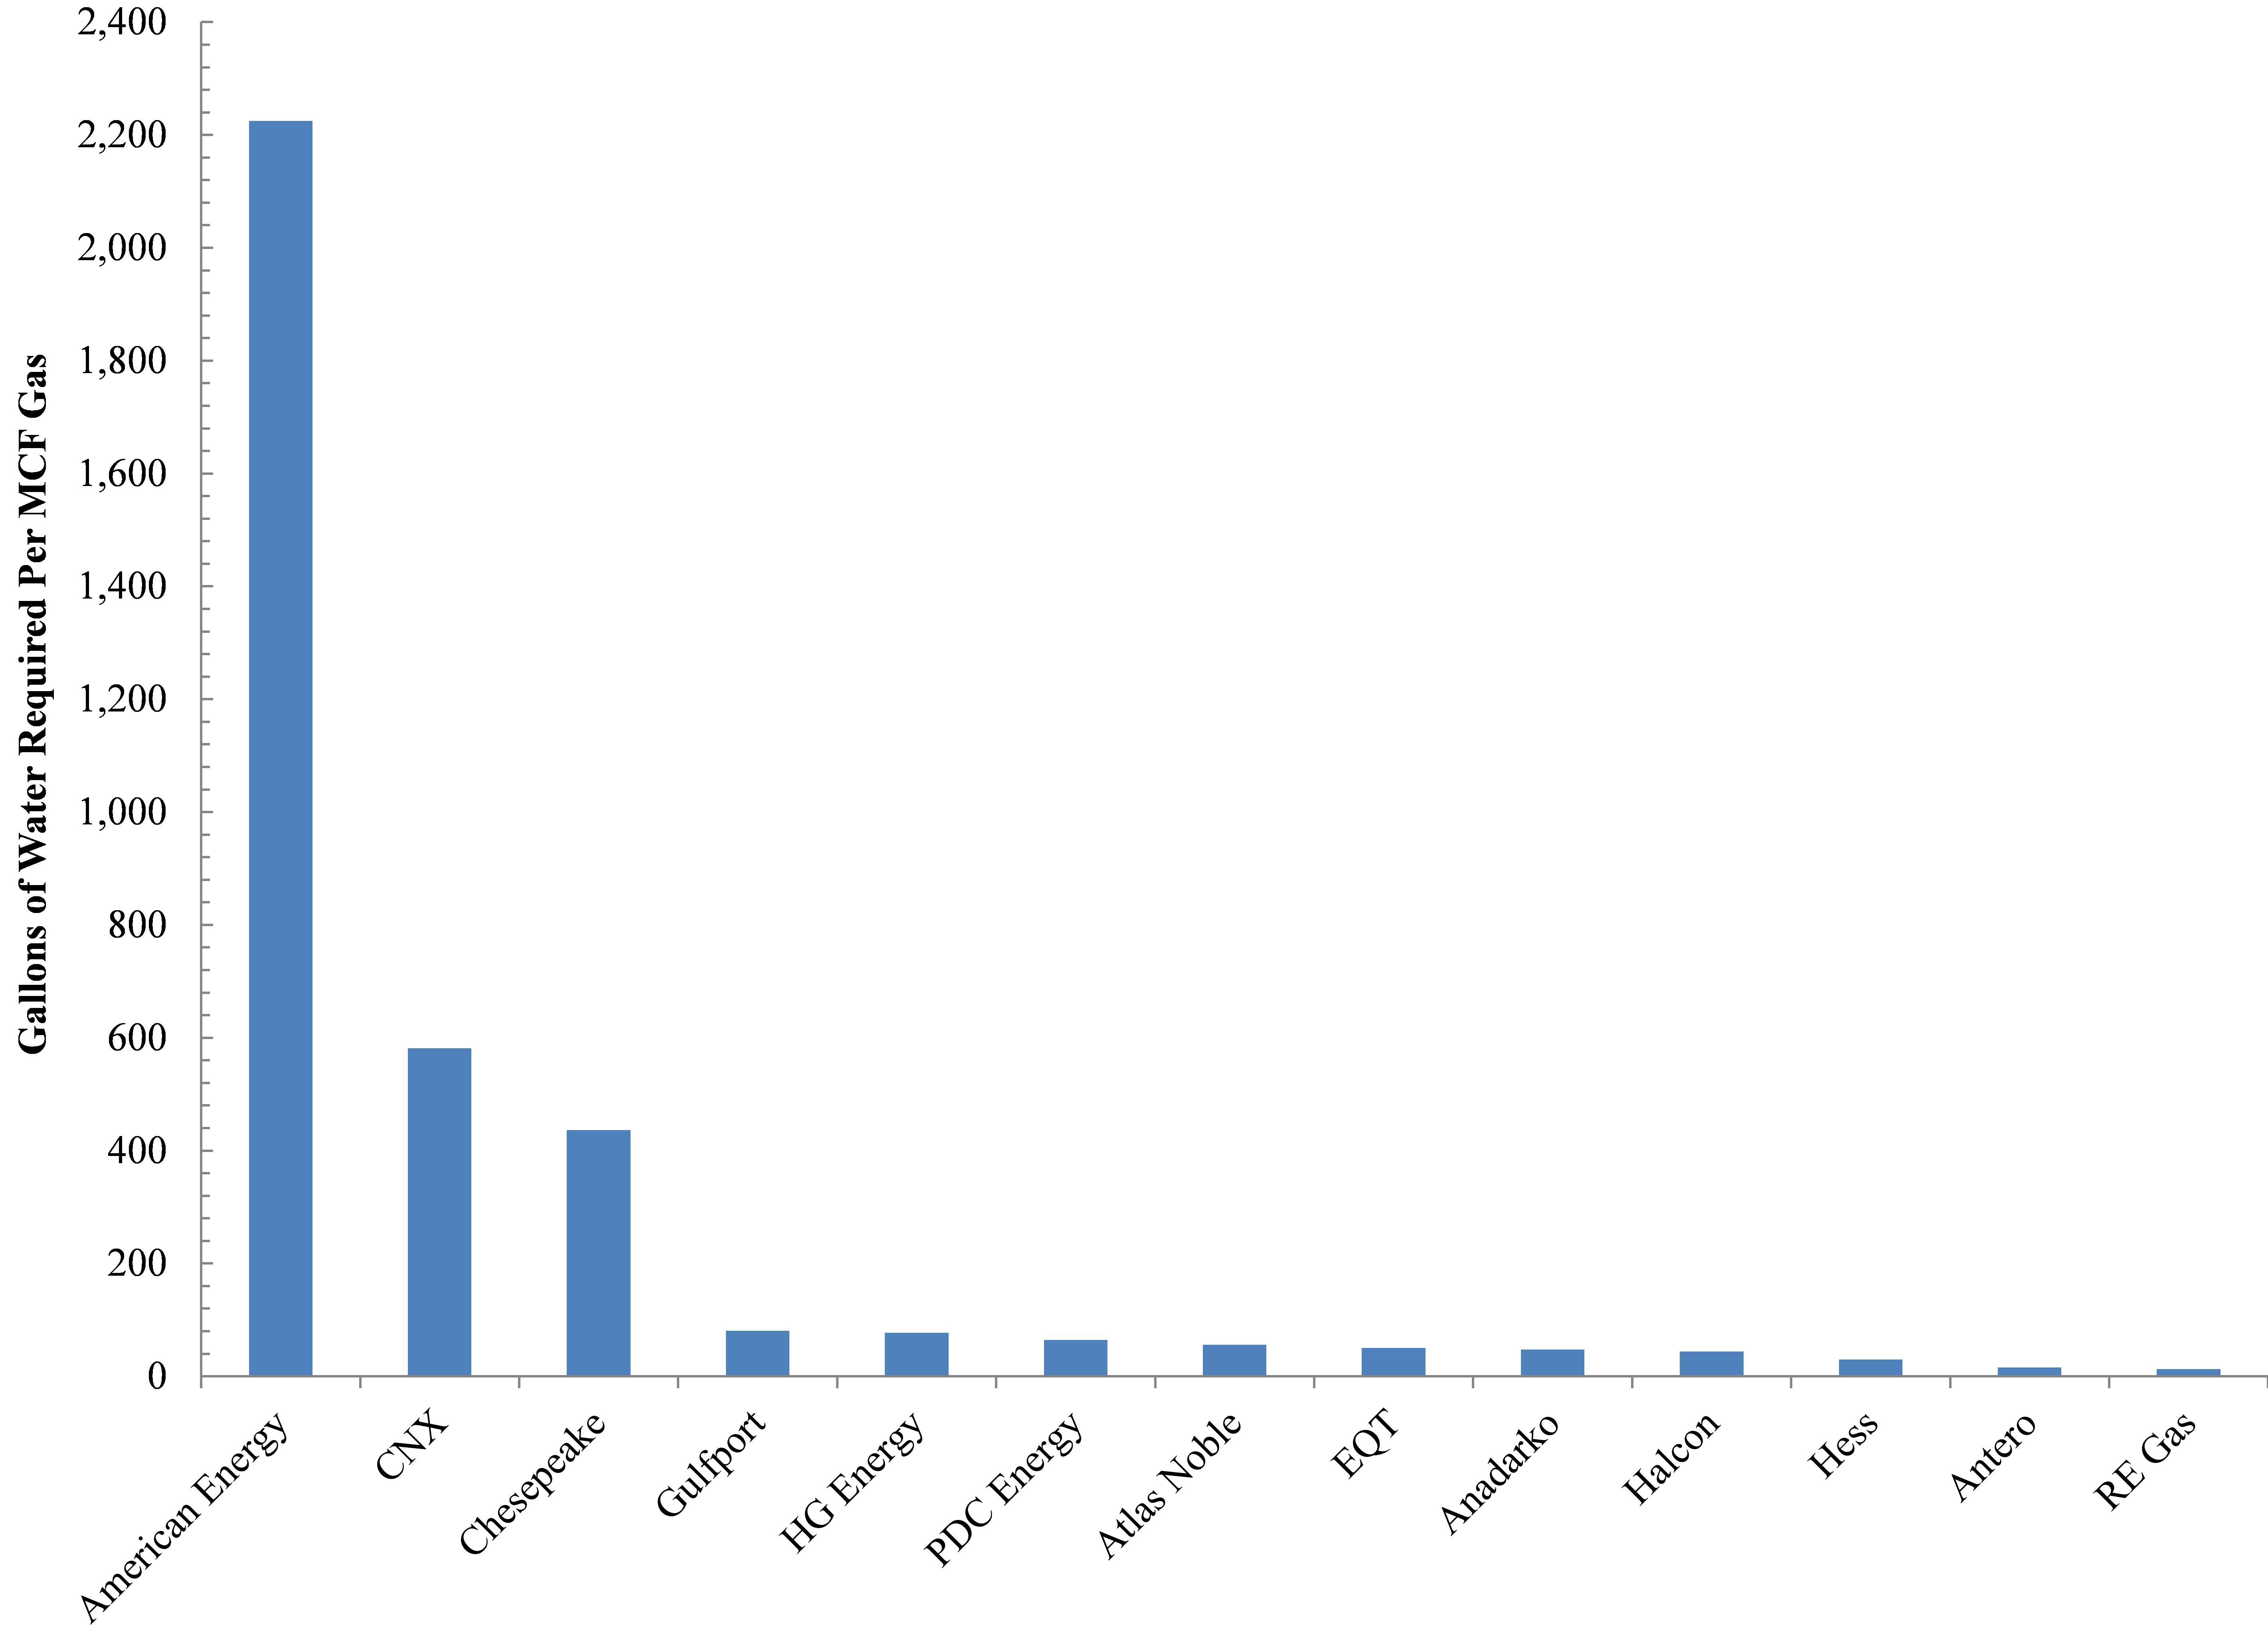
Belmont County’s 14 Utica wells are the least efficient with respect to natural gas recovery relative to freshwater requirements (Figure 4). They average 1,306 gallons of water per Mcf. A distant second is Carroll County’s 250+ wells, which have injected 520 gallons of water 7,000+ feet below the earth’s service to produce a single Mcf of natural gas. Muskingum’s Utica well and Noble County’s 39 wells are the only other wells requiring more than 100 gallons of freshwater per Mcf. The remaining nine counties’ wells require 15-92 gallons of water to produce an Mcf of natural gas.

Water and production (Mcf and barrels of oil per day) in OH’s Utica Shale – Average Water Usage Per Unit of Oil Produced (Gallons of Water Per Gallon of Oil).

Figure 3. Average water usage (gallons) per unit of oil (gallons) produced across 19 Ohio Utica counties

Water and production (Mcf and barrels of oil per day) in OH’s Utica Shale – Average Water Usage Per Unit of Gas Produced (Gallons of Water Per MCF of Gas)

Figure 4. Average water usage (gallons) per unit of gas produced (Mcf) across 19 Ohio Utica counties

Waste Production

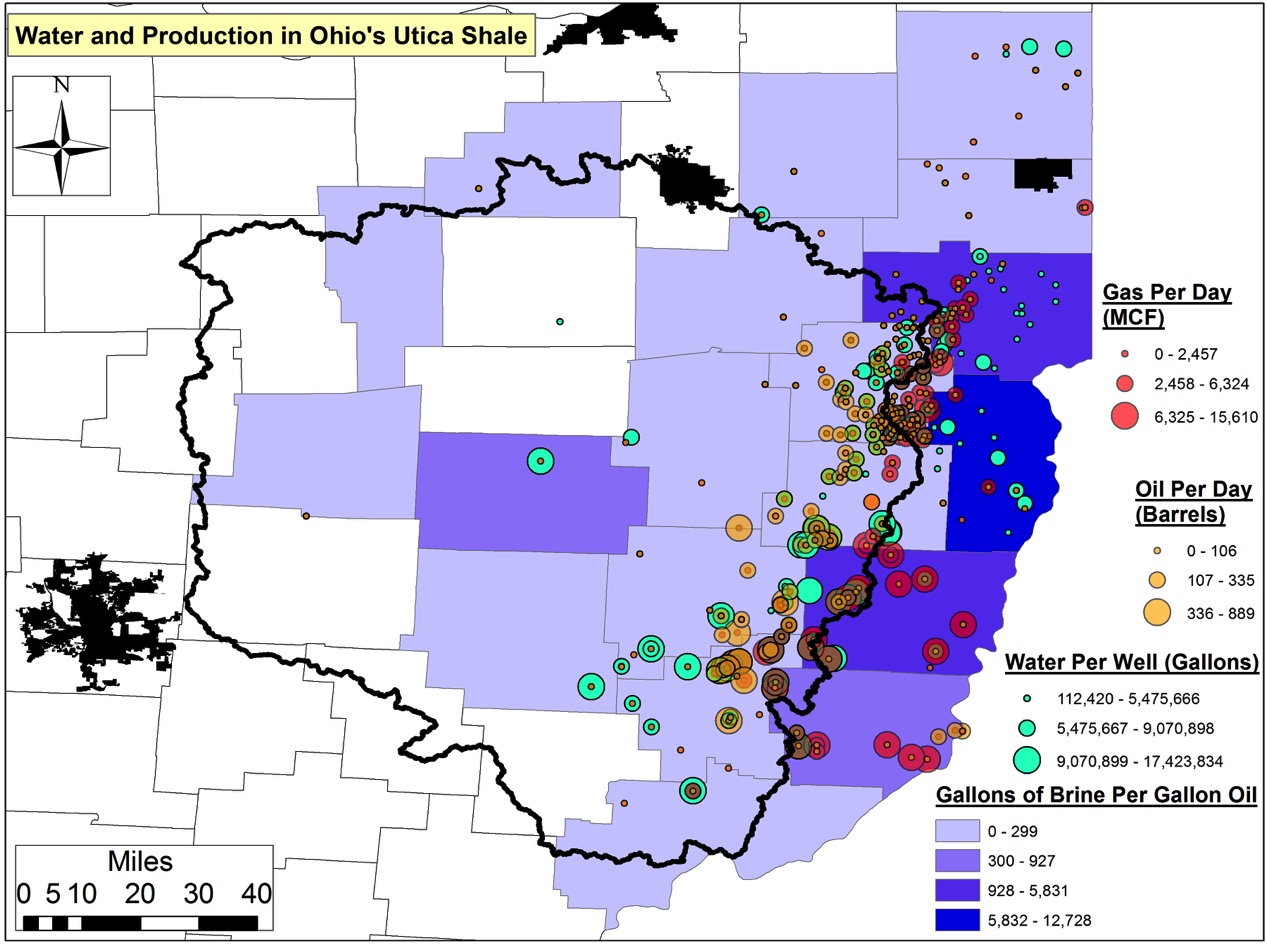
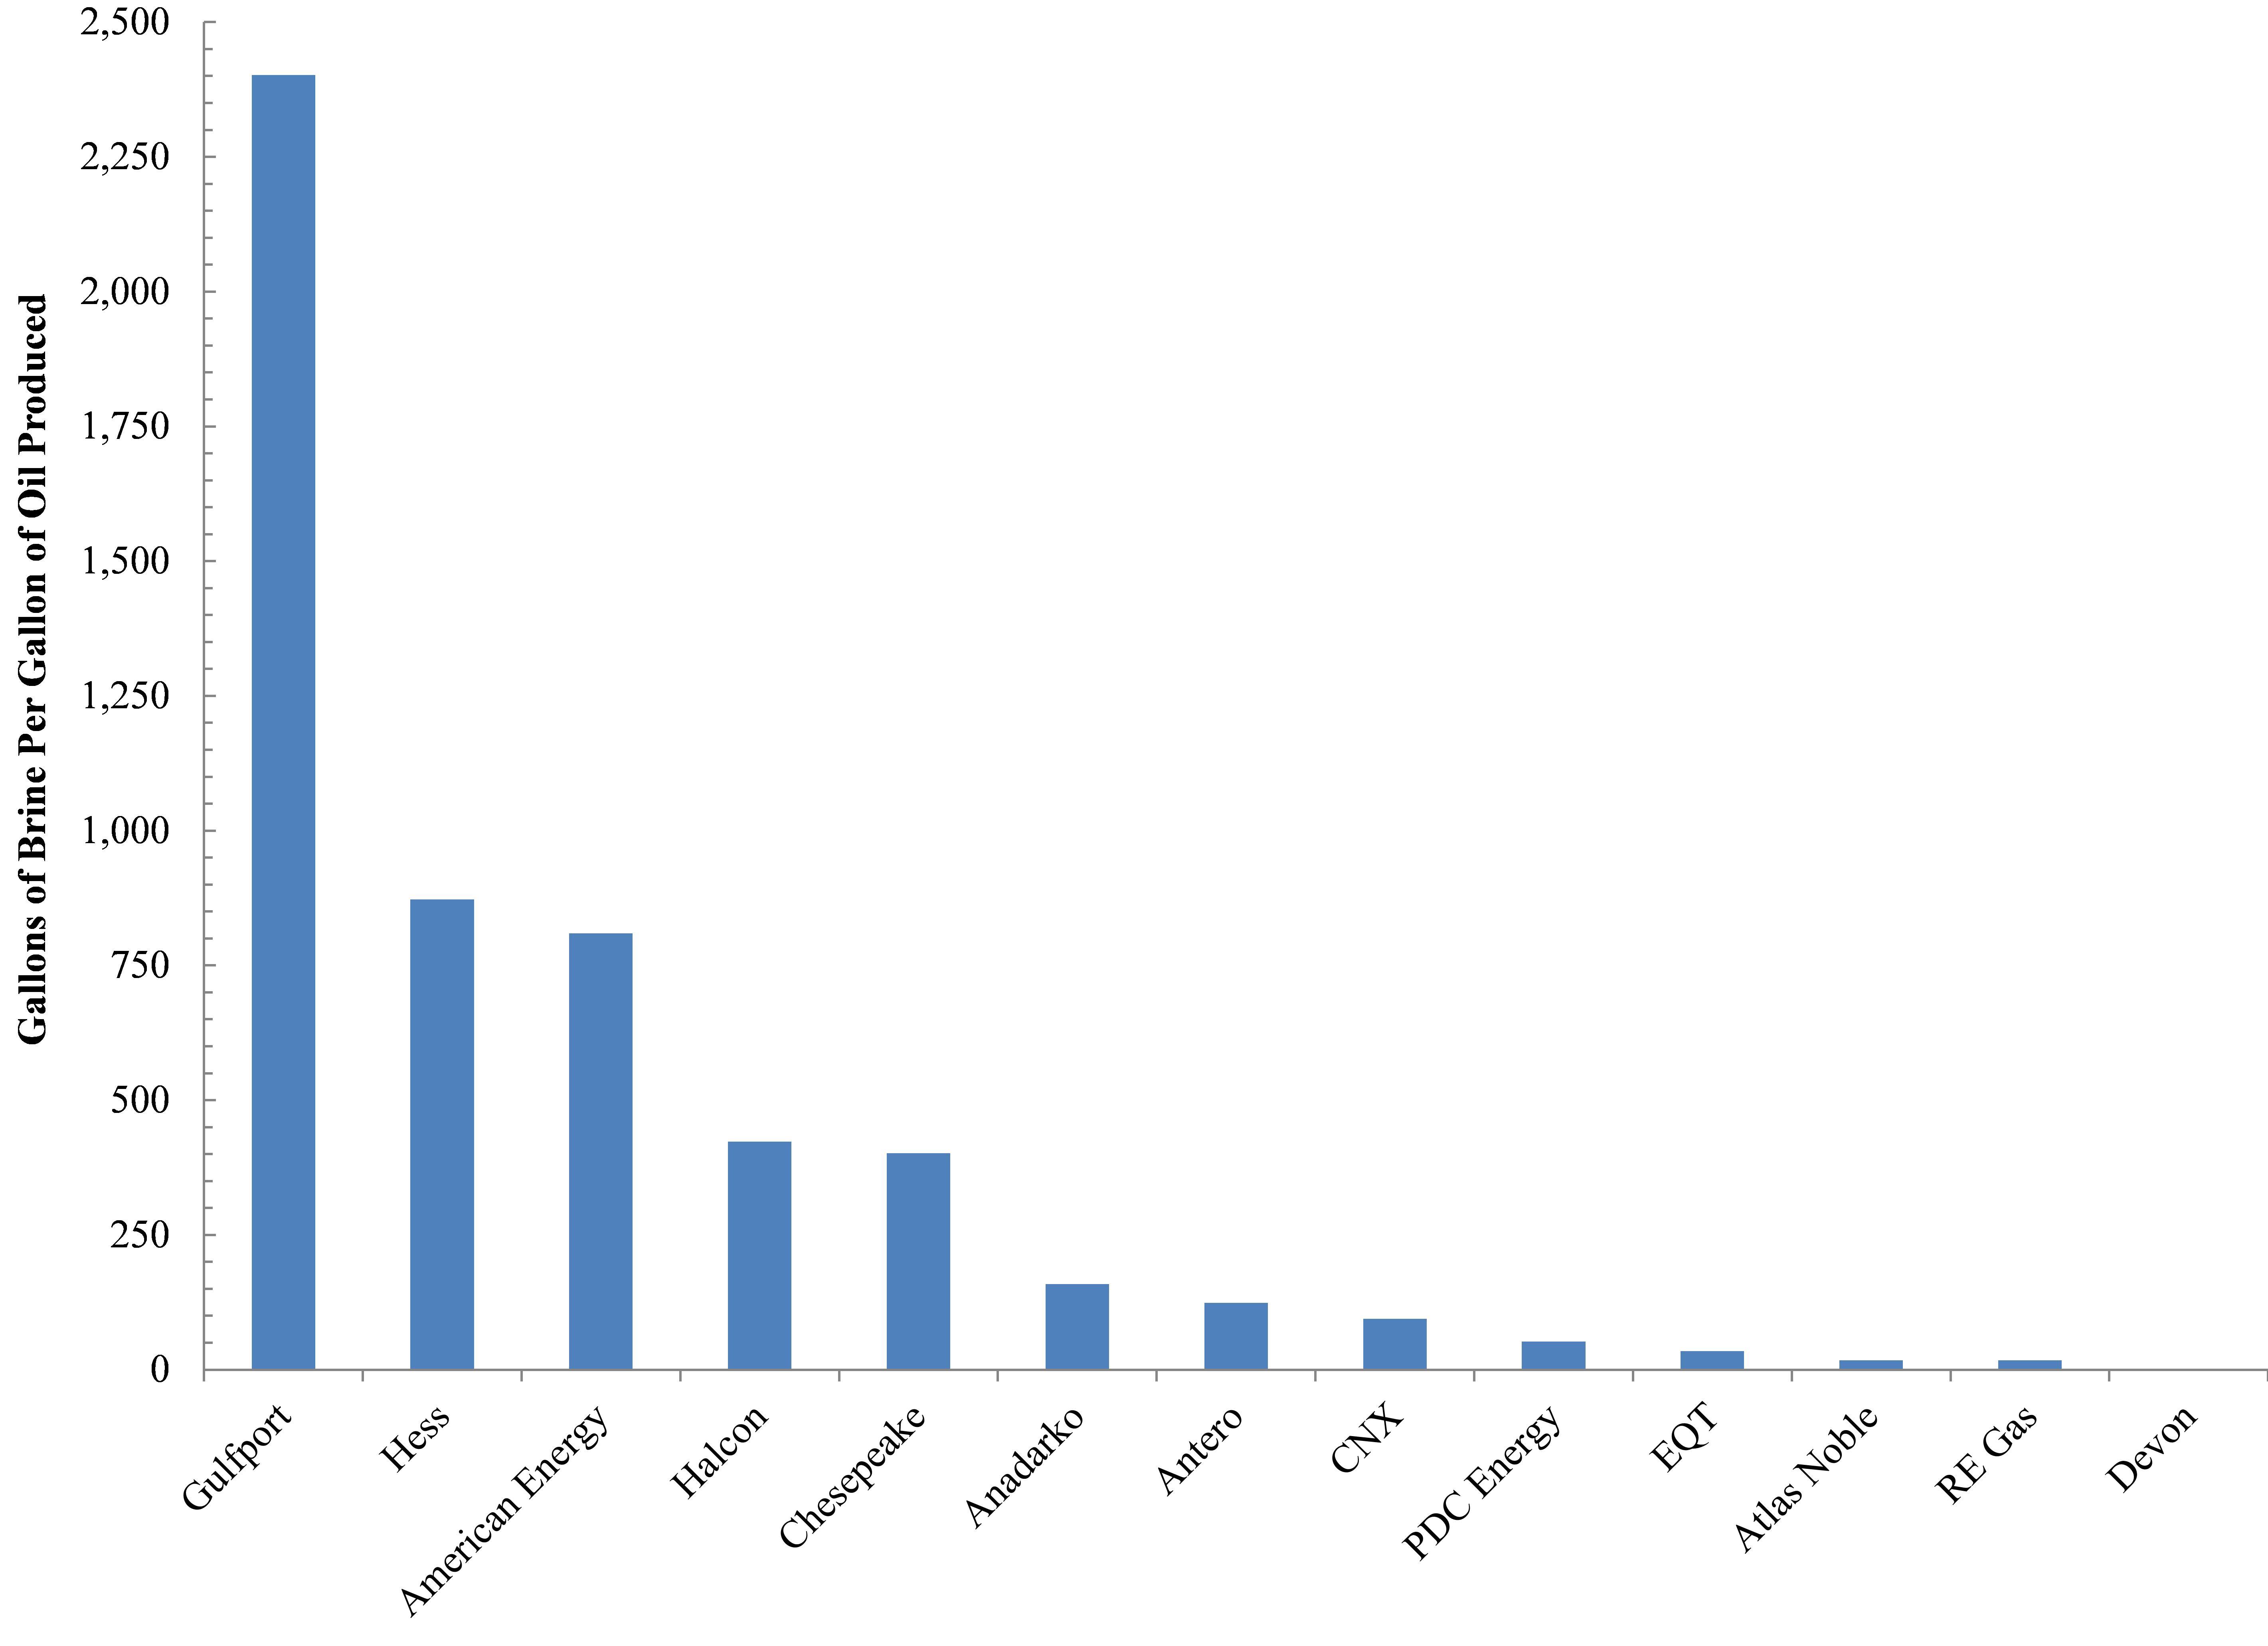
The aforementioned Jefferson wells are the least efficient with respect to waste vs. product produced. Jefferson wells are generating 12,728 gallons of brine per gallon of oil (Figure 5).6 Wells from this county are followed distantly by the 32 Belmont and 26 Columbiana county wells, which are generating 5,830 and 3,976 gallons of brine per unit of oil.5 The remaining counties (for which we have data) are using 8-927 gallons of brine per unit of oil; six counties’ wells are generating <38 gallons of brine per gallon of oil.

Water and production (Mcf and barrels of oil per day) in OH’s Utica Shale – Average Brine Production Per Unit of Oil Produced (Gallons of Brine Per Gallon of Oil)

Figure 5. Average brine production (gallons) per gallon of oil produced per day across 19 Ohio Utica Counties

The average Utica well in OH is generating 820 gallons of fracking waste per unit of product produced. Across all OH Utica wells, an average of 0.078 gallons of brine is being generated for every gallon of freshwater used. This figure amounts to a current total of 233.9 MGs of brine waste produce statewide. Over the next five years this trend will result in the generation of one billion gallons (BGs) of brine waste and 12.8 BGs of freshwater required in OH. Put another way…

233.9 MGs is equivalent to the annual waste production of 5.2 million Ohioans – or 45% of the state’s current population. 

Due to the low costs incurred by industry when they choose to dispose of their fracking waste in OH, drillers will have only to incur $100 million over the next five years to pay for the injection of the above 1.0 BGs of brine. Ohioans, however, will pay at least $1.5 billion in the same time period to dispose of their municipal solid waste. The average fee to dispose of every ton of waste is $32, which means that the $100 million figure is at the very least $33.5 million – and as much as $250.6 million – less than we should expect industry should be paying to offset the costs.

Environmental Accounting

In summary, there are two ways to look at the potential “energy revolution” that is shale gas:

  1. Using the same traditional supply-side economics metrics we have used in the past (e.g., globalization, Efficient Market Hypothesis, Trickle Down Economics, Bubbles Don’t Exist) to socialize long-term externalities and privatize short-term windfall profits, or
  2. We can begin to incorporate into the national dialogue issues pertaining to watershed resilience, ecosystem services, and the more nuanced valuation of our ecosystems via Ecological Economics.

The latter will require a more real-time and granular understanding of water resource utilization and fracking waste production at the watershed and regional scale, especially as it relates to headline production and the often-trumpeted job generating numbers.

We hope to shed further light on this new “environmental accounting” as it relates to more thorough and responsible energy development policy at the state, federal, and global levels. The life cycle costs of shale gas drilling have all too often been ignored and can’t be if we are to generate the types of energy our country demands while also stewarding our ecosystems. As Mark Twain is reported to have said “Whiskey is for drinking; water is for fighting over.” In order to avoid such a battle over the water-energy nexus in the long run it is imperative that we price in the shale gas industry’s water-use footprint in the near term. As we have demonstrated so far with this series this issue is far from settled here in OH and as they say so goes Ohio so goes the nation!

A Moving Target

ODNR projection map of potential Utica productivity from Spring, 2012

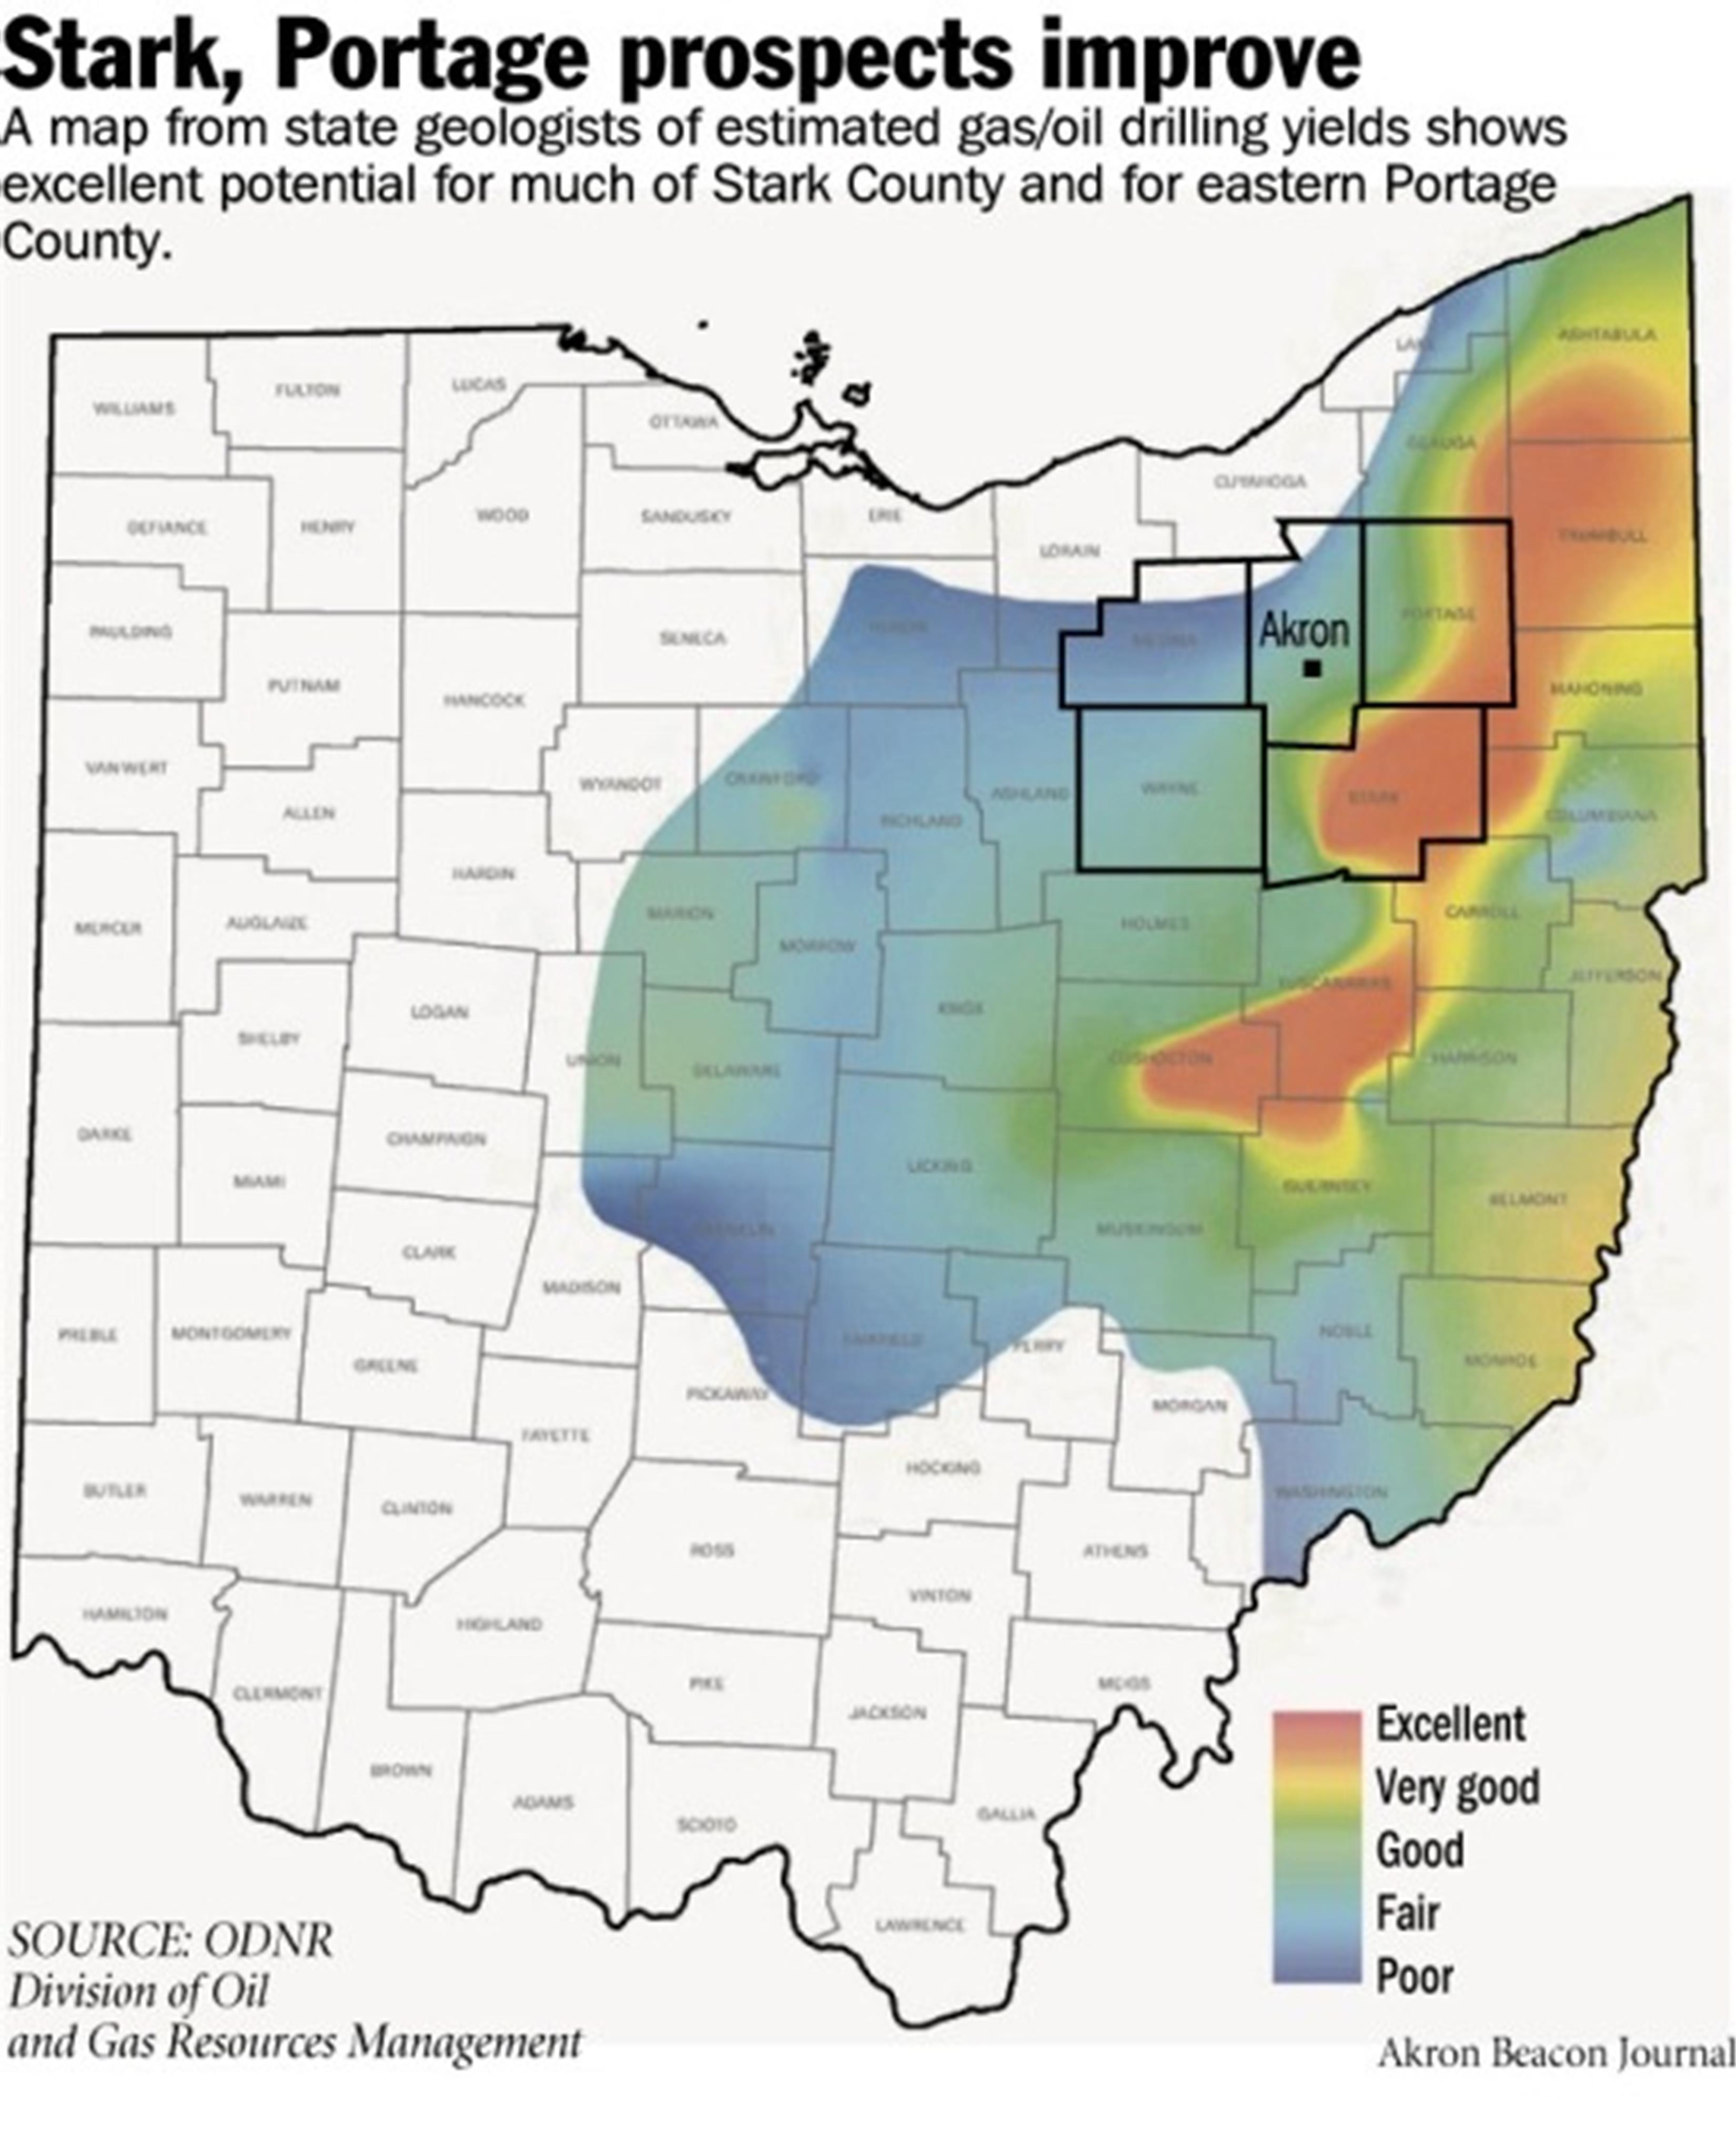
Figure 6. ODNR projection map of potential Utica productivity from spring 2012

OH’s Department of Natural Resources (ODNR) originally claimed a big red – and nearly continuous – blob of Utica productivity existed. The projection originally stretched from Ashtabula and Trumbull counties south-southwest to Tuscarawas, Guernsey, and Coshocton along the Appalachian Plateau (See Figure 6).

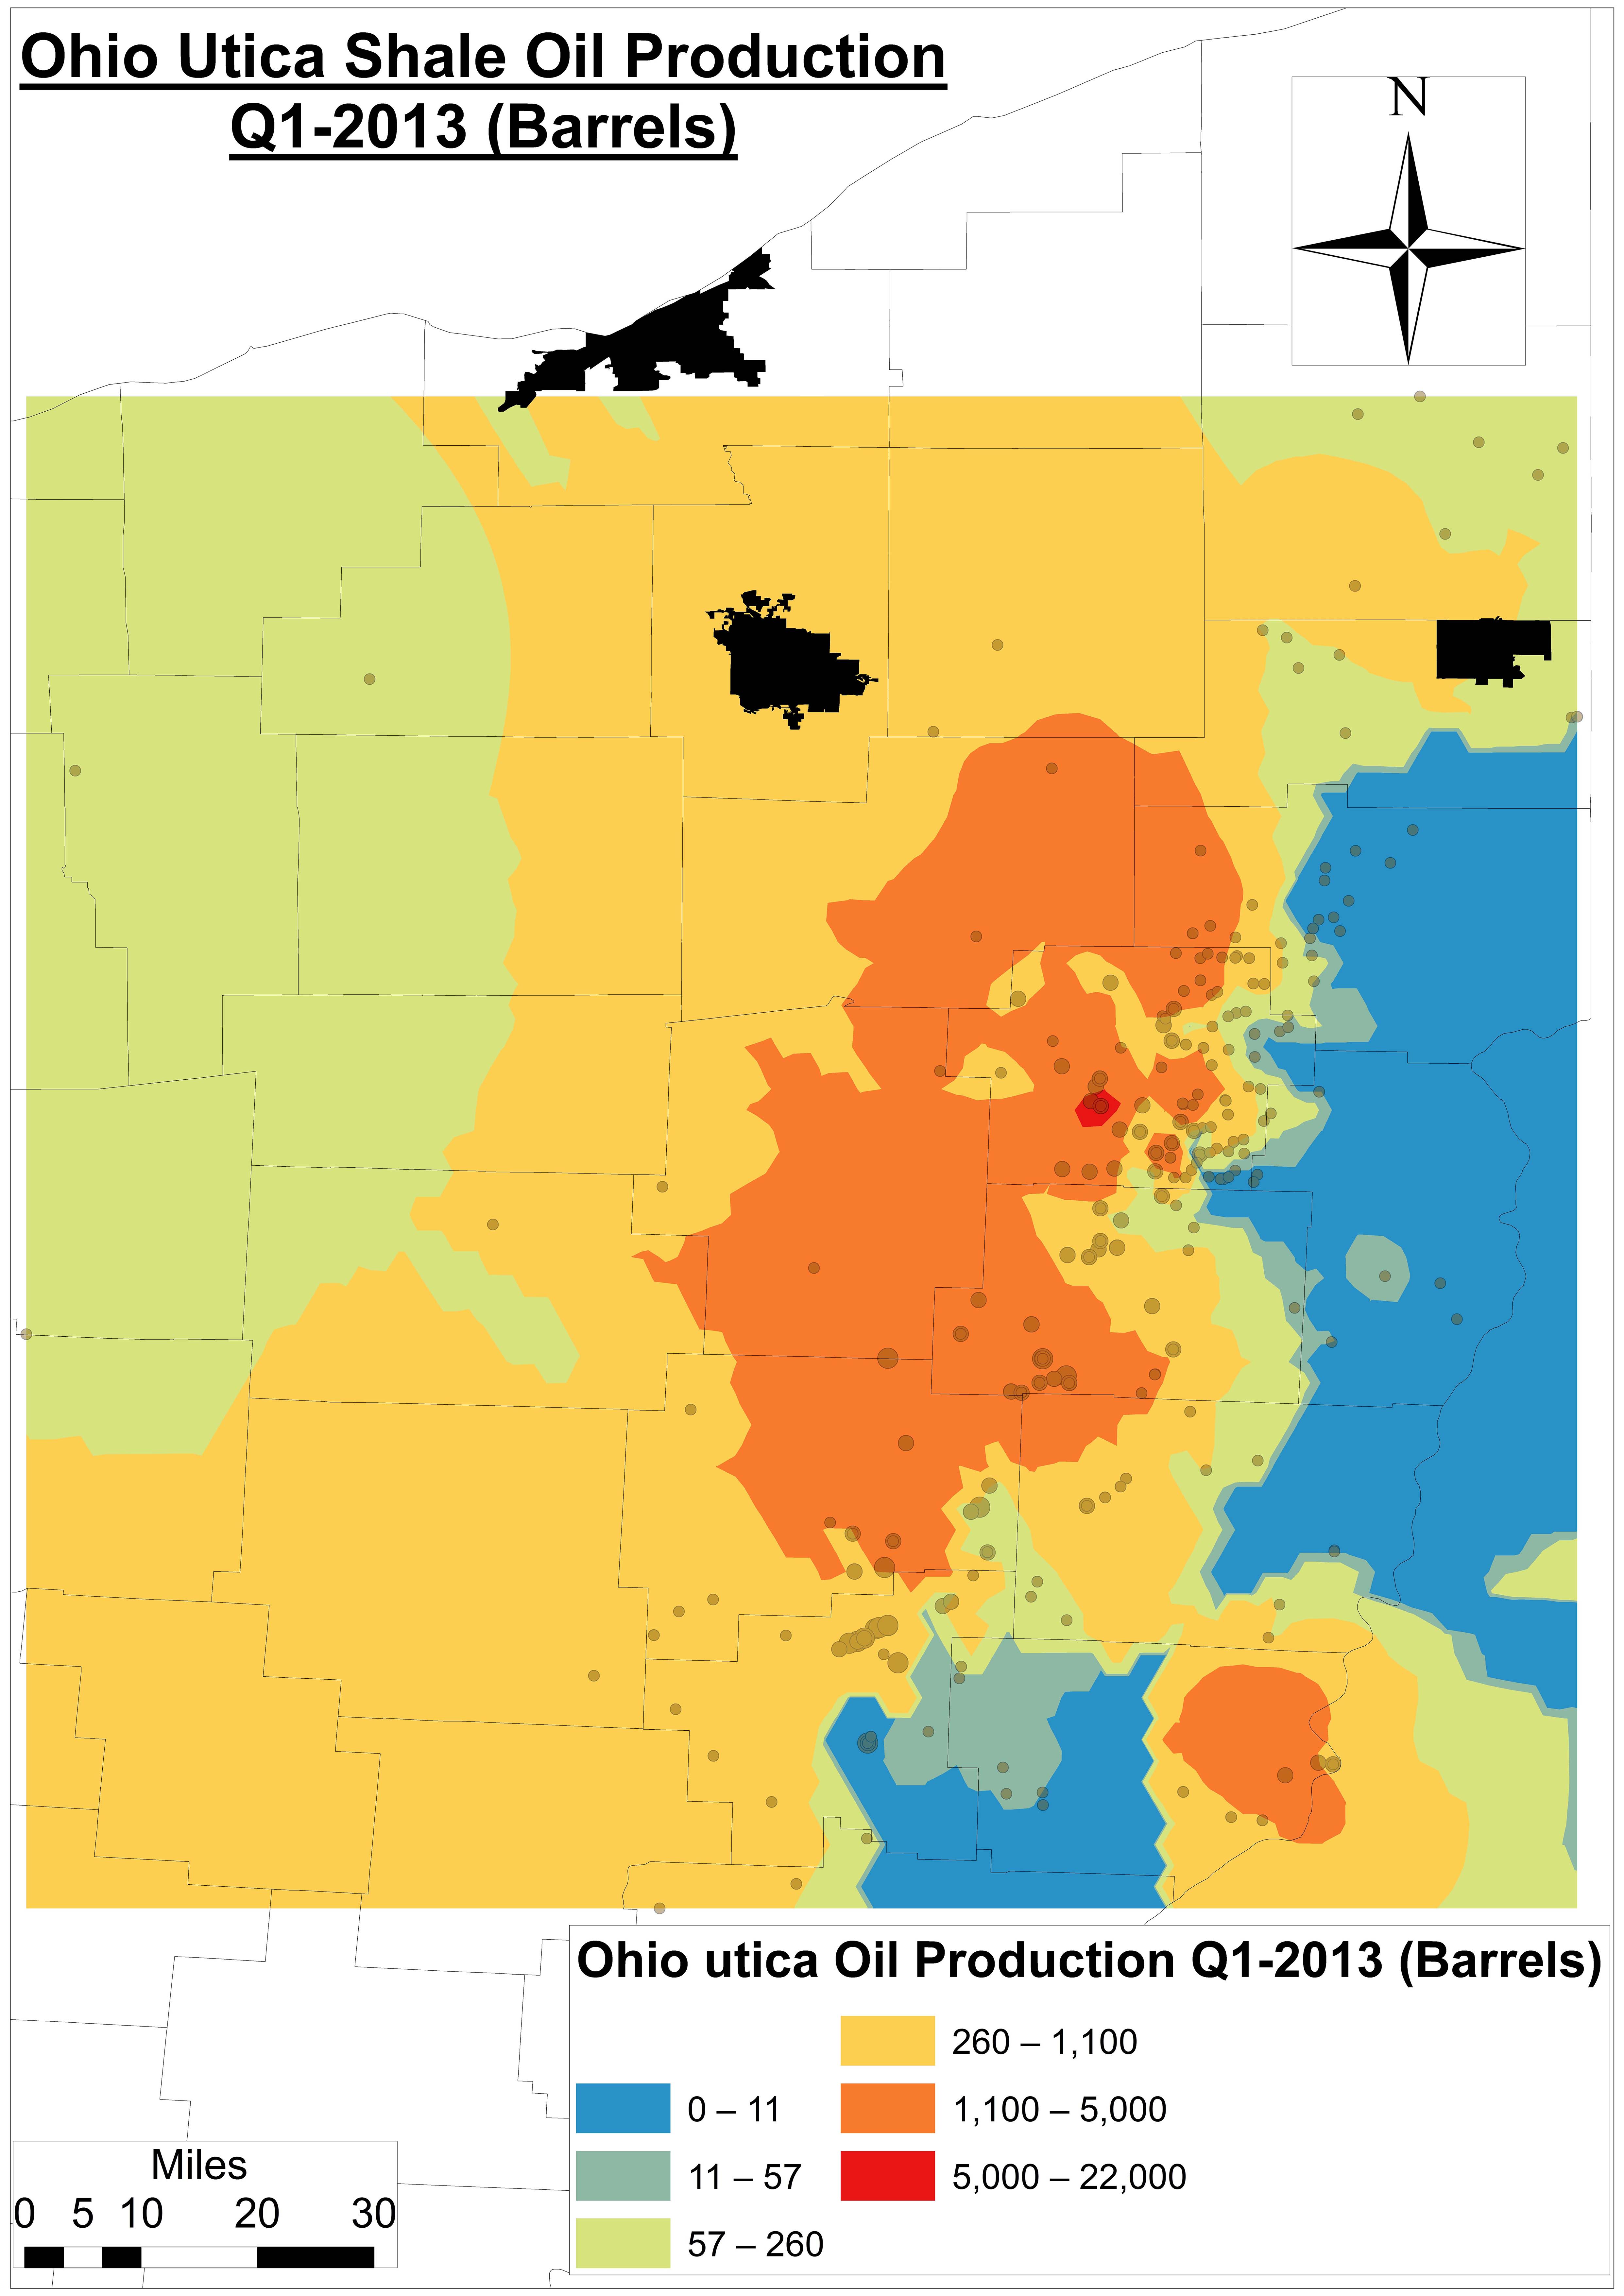
However, our analysis demonstrates that (Figures 7 and 8):

  1. This is a rapidly moving target,
  2. The big red blob isn’t as big – or continuous – as once projected, and
  3. It might not even include many of the counties once thought to be the heart of the OH Utica shale play.

This last point is important because counties, families, investors, and outside interests were developing investment and/or savings strategies based on this map and a 30+ year timeframe – neither of which may be even remotely close according to our model.

An Ohio Utica Shale oil production model for Q1-2013 using an interpolative Geostatistical technique called Empirical Bayesian Kriging.

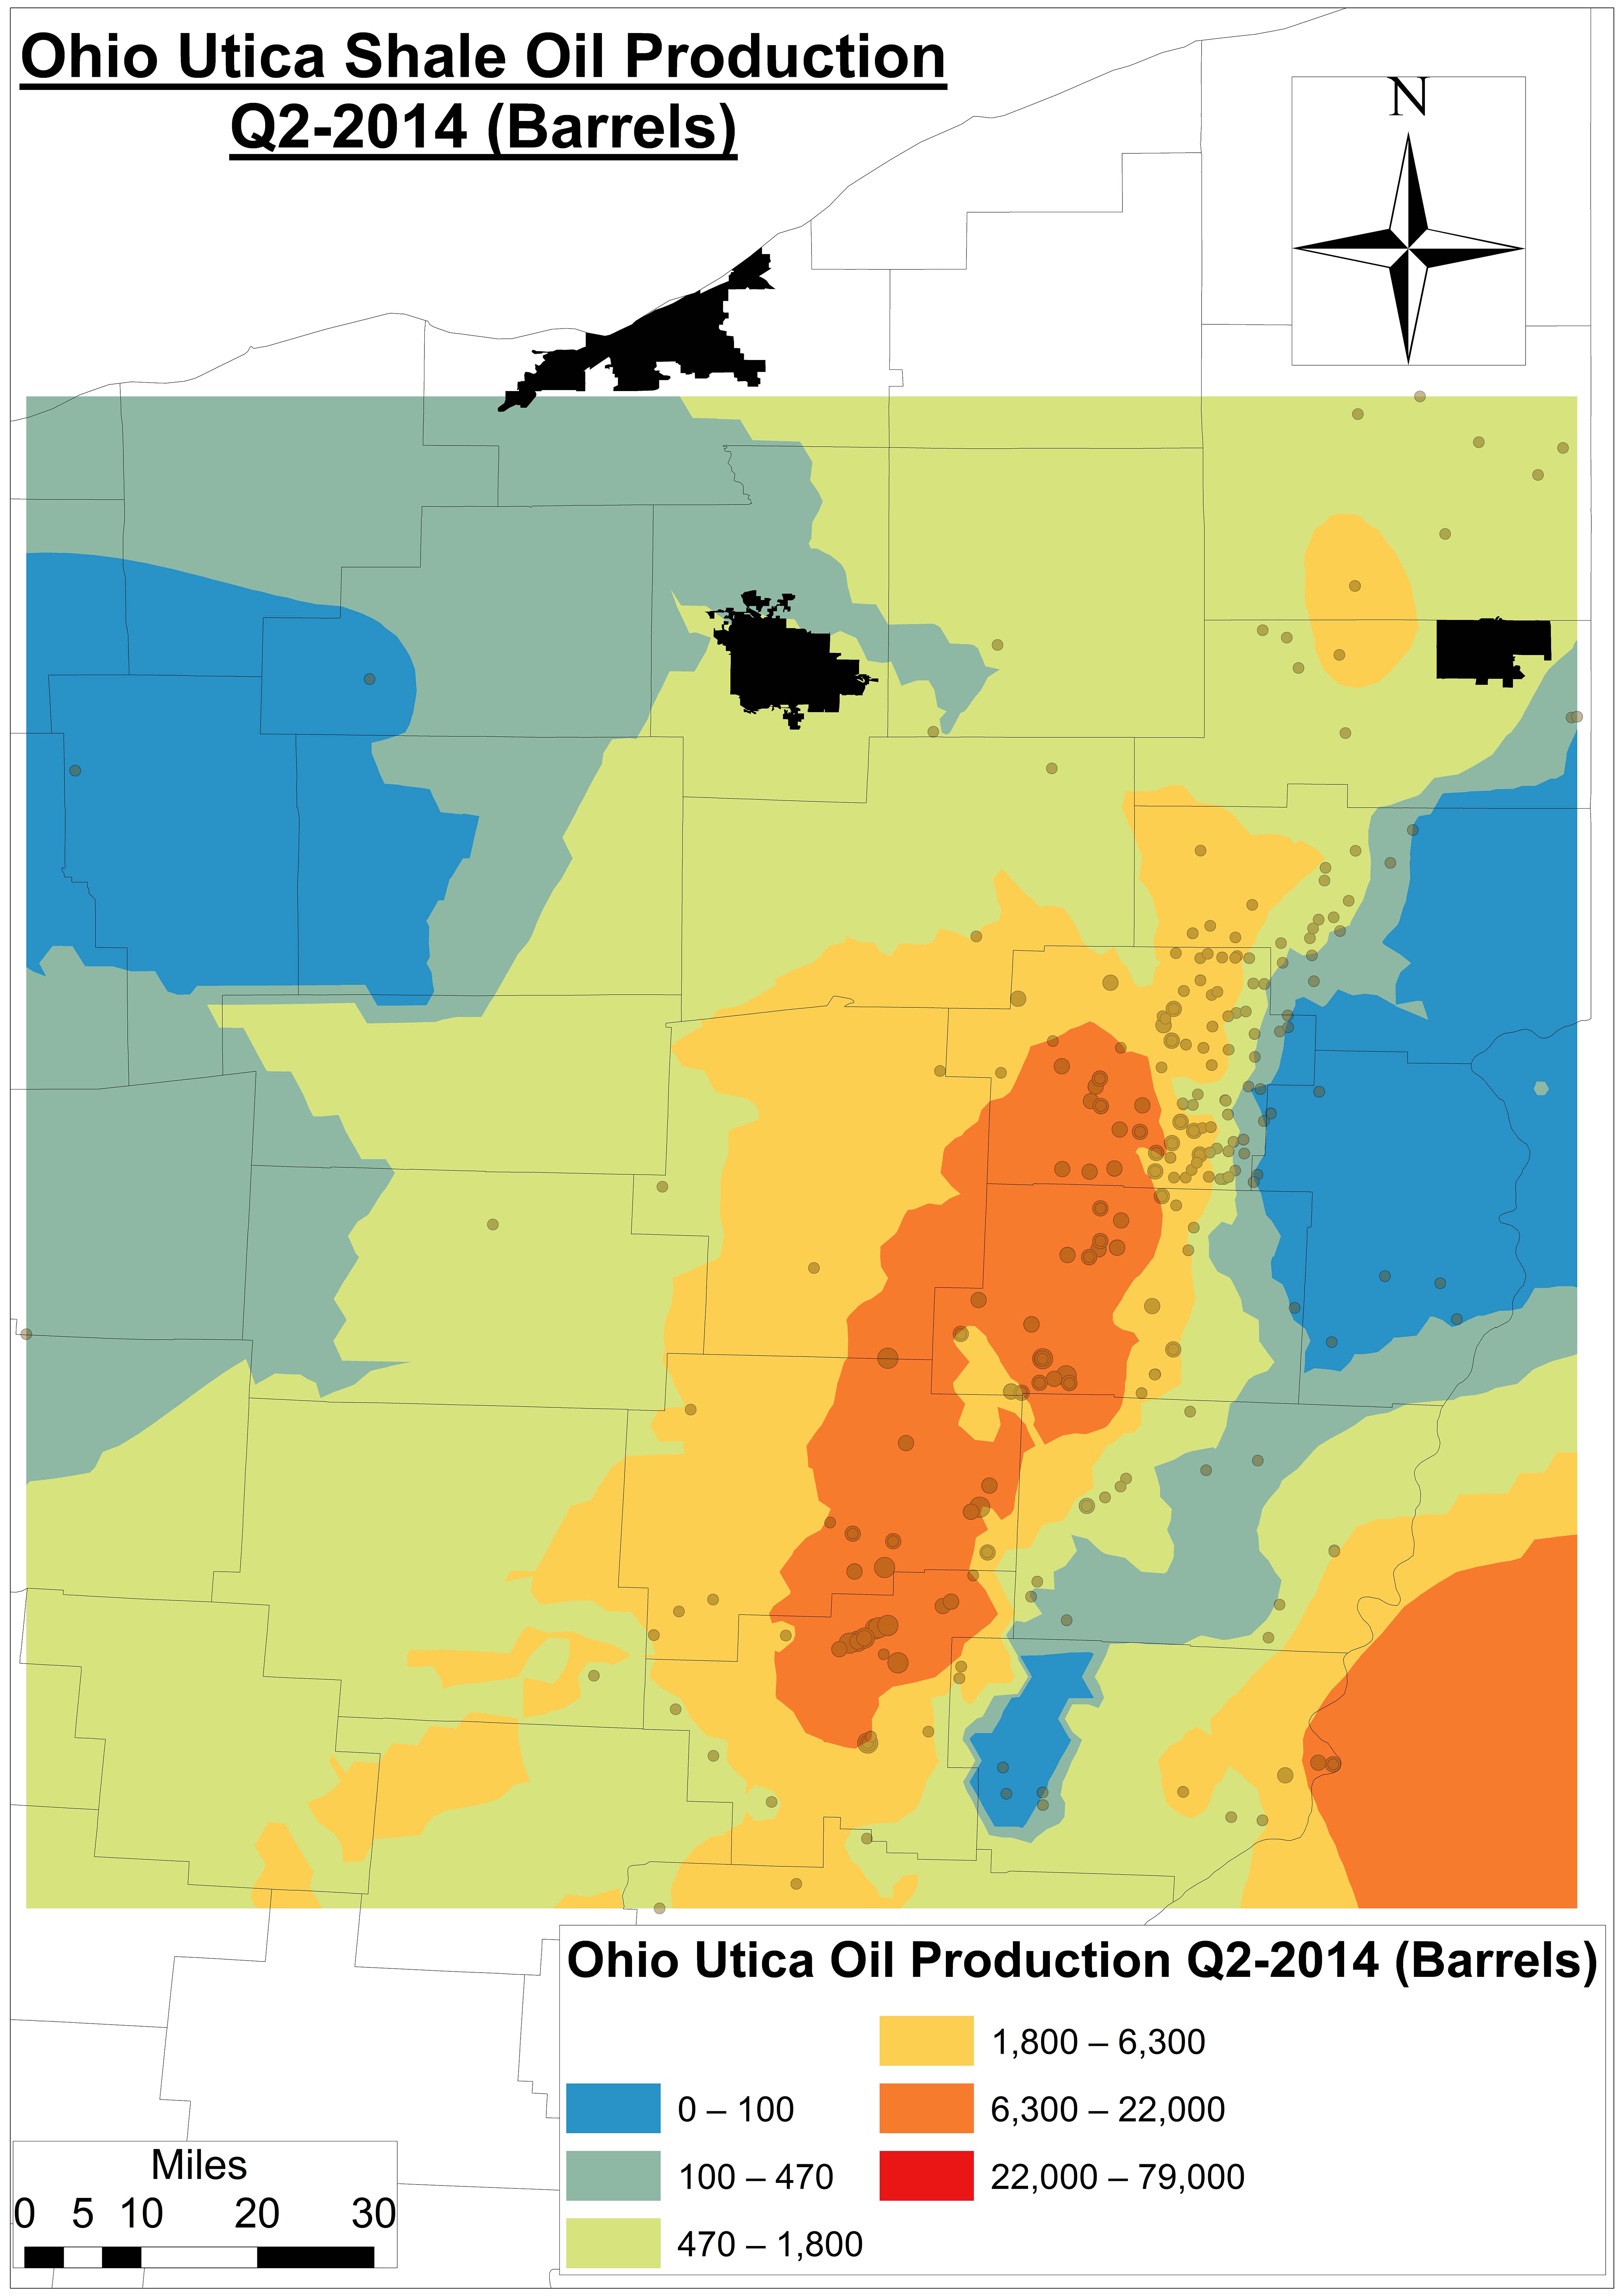
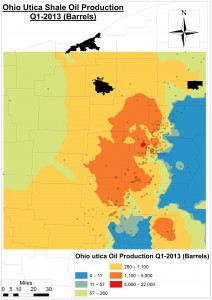
Figure 7a. An Ohio Utica Shale oil production model using Kriging6 for Q1-2013

An Ohio Utica Shale oil production model for Q2-2014 using an interpolative Geostatistical technique called Empirical Bayesian Kriging.

Figure 7b. An Ohio Utica Shale oil production model using Kriging for Q2-2014

An Ohio Utica Shale gas production model for Q1-2013 using an interpolative Geostatistical technique called Empirical Bayesian Kriging.

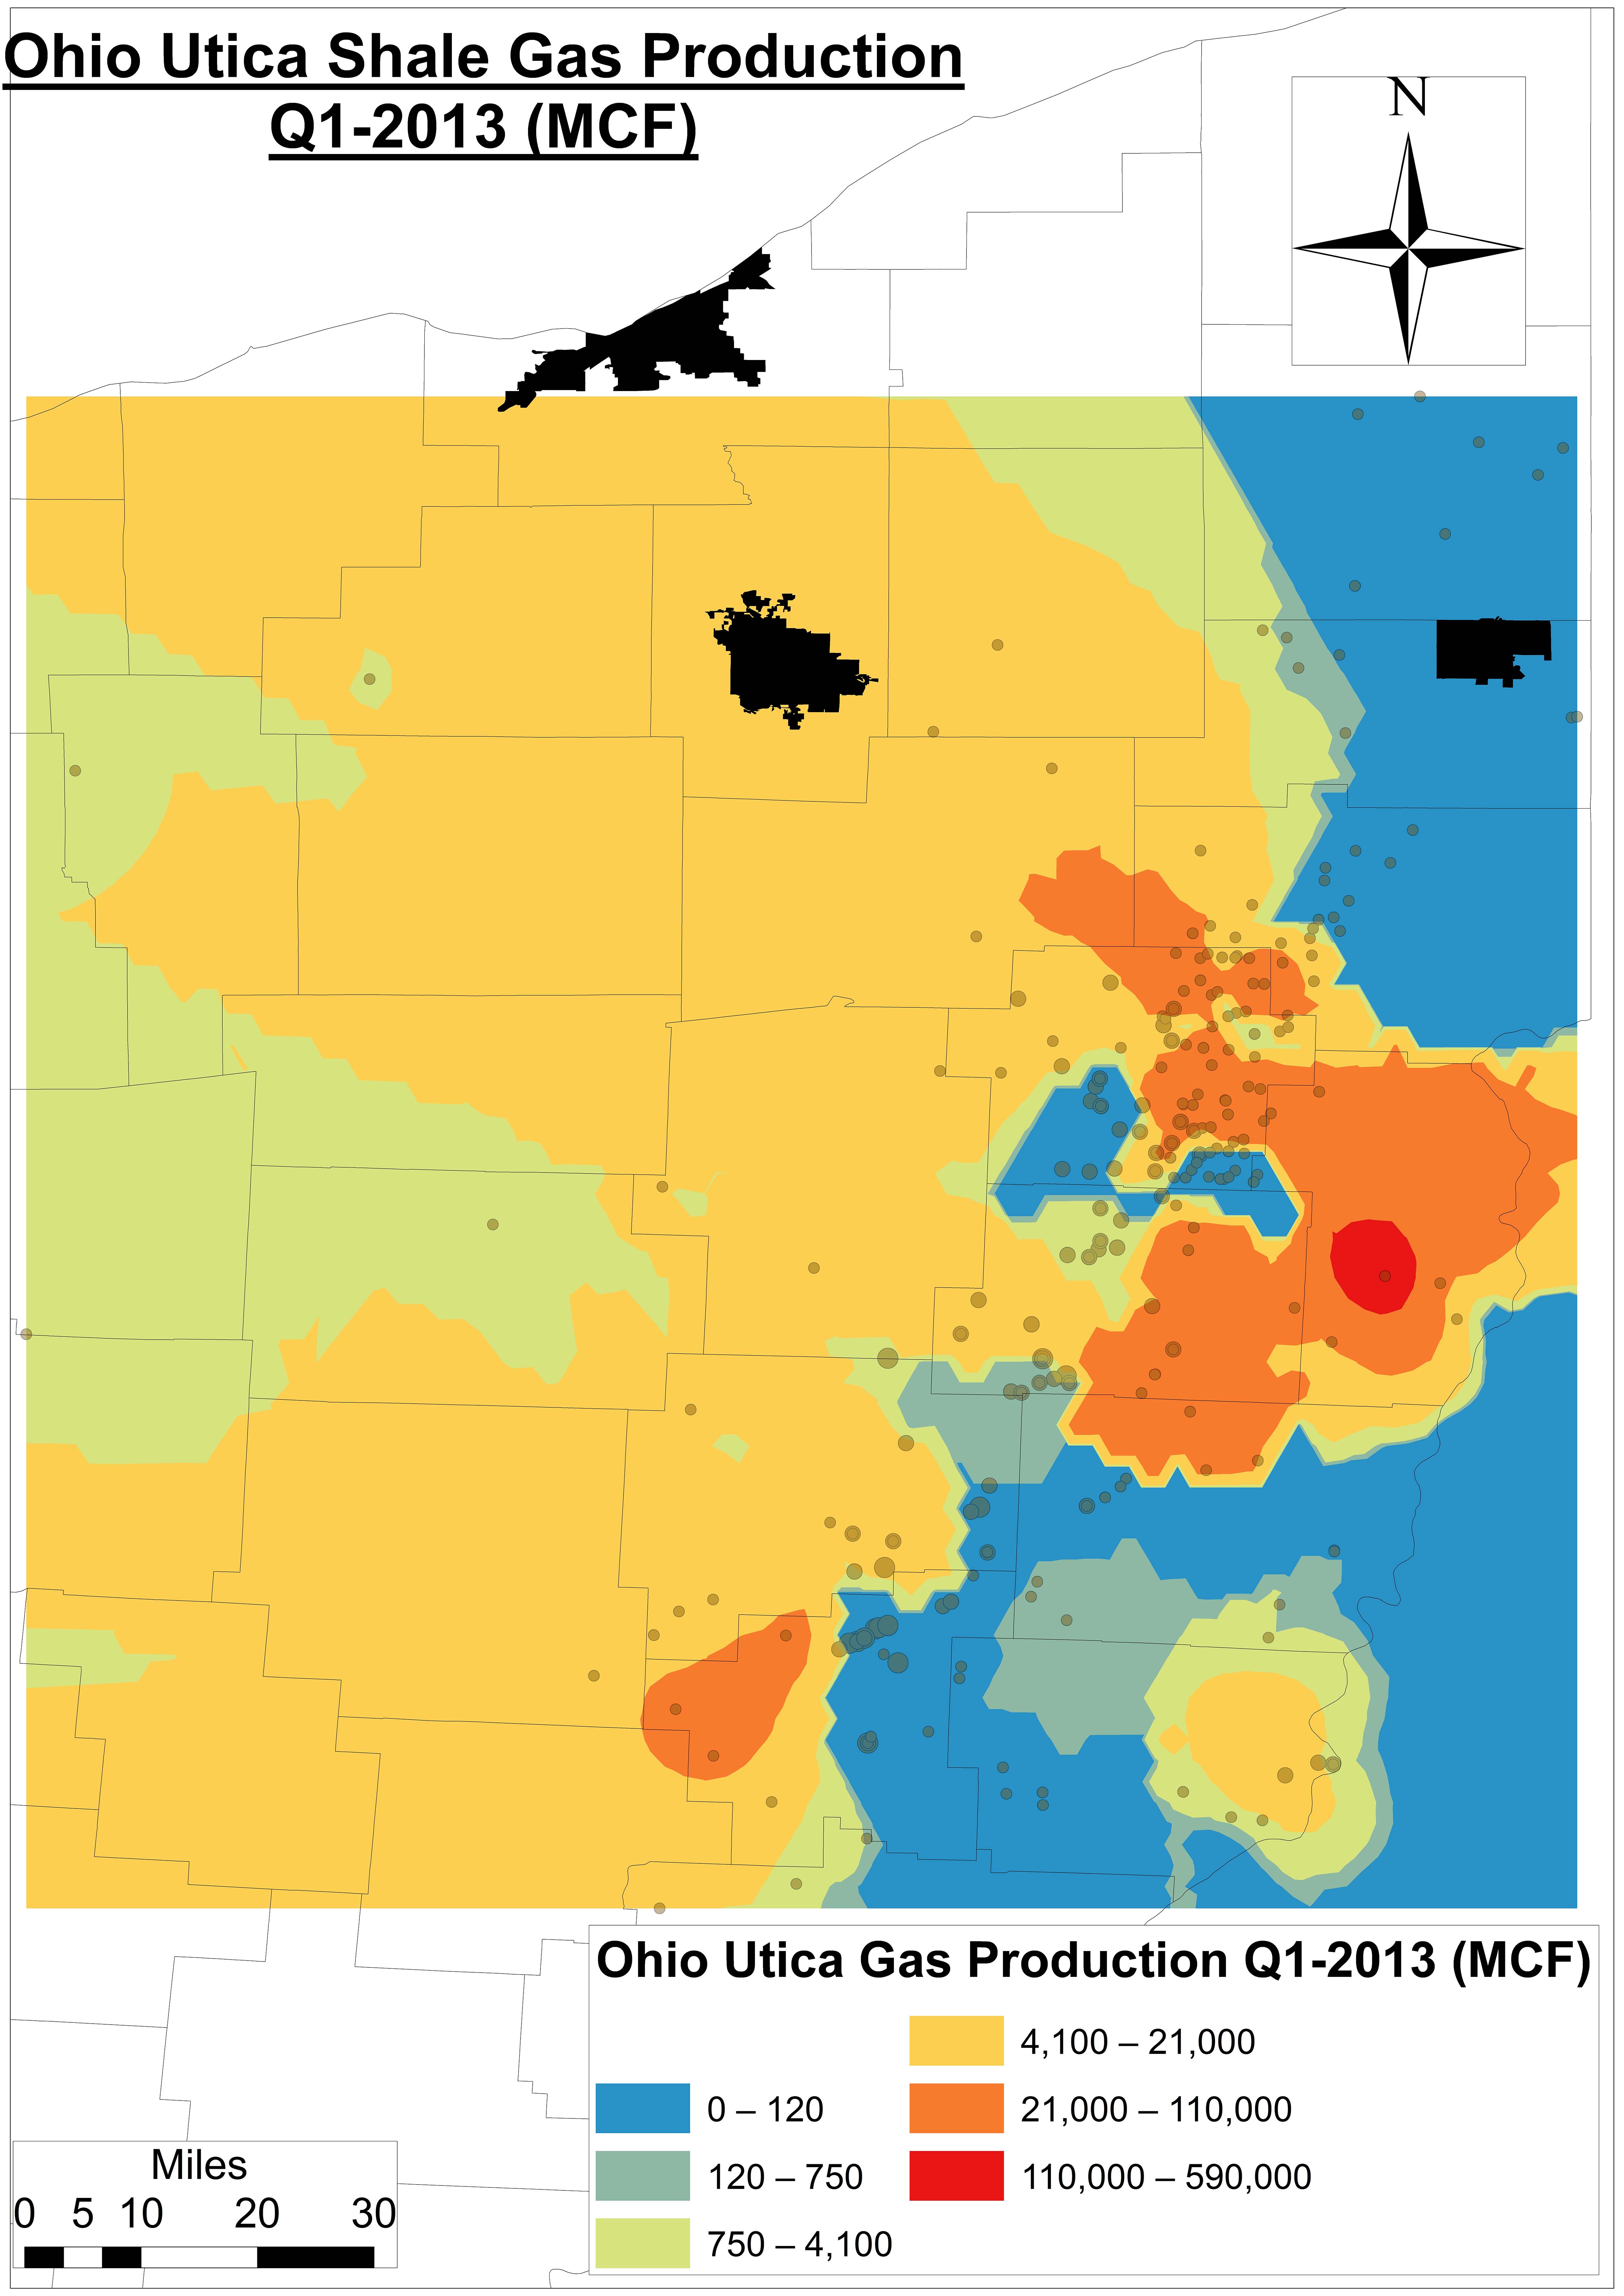
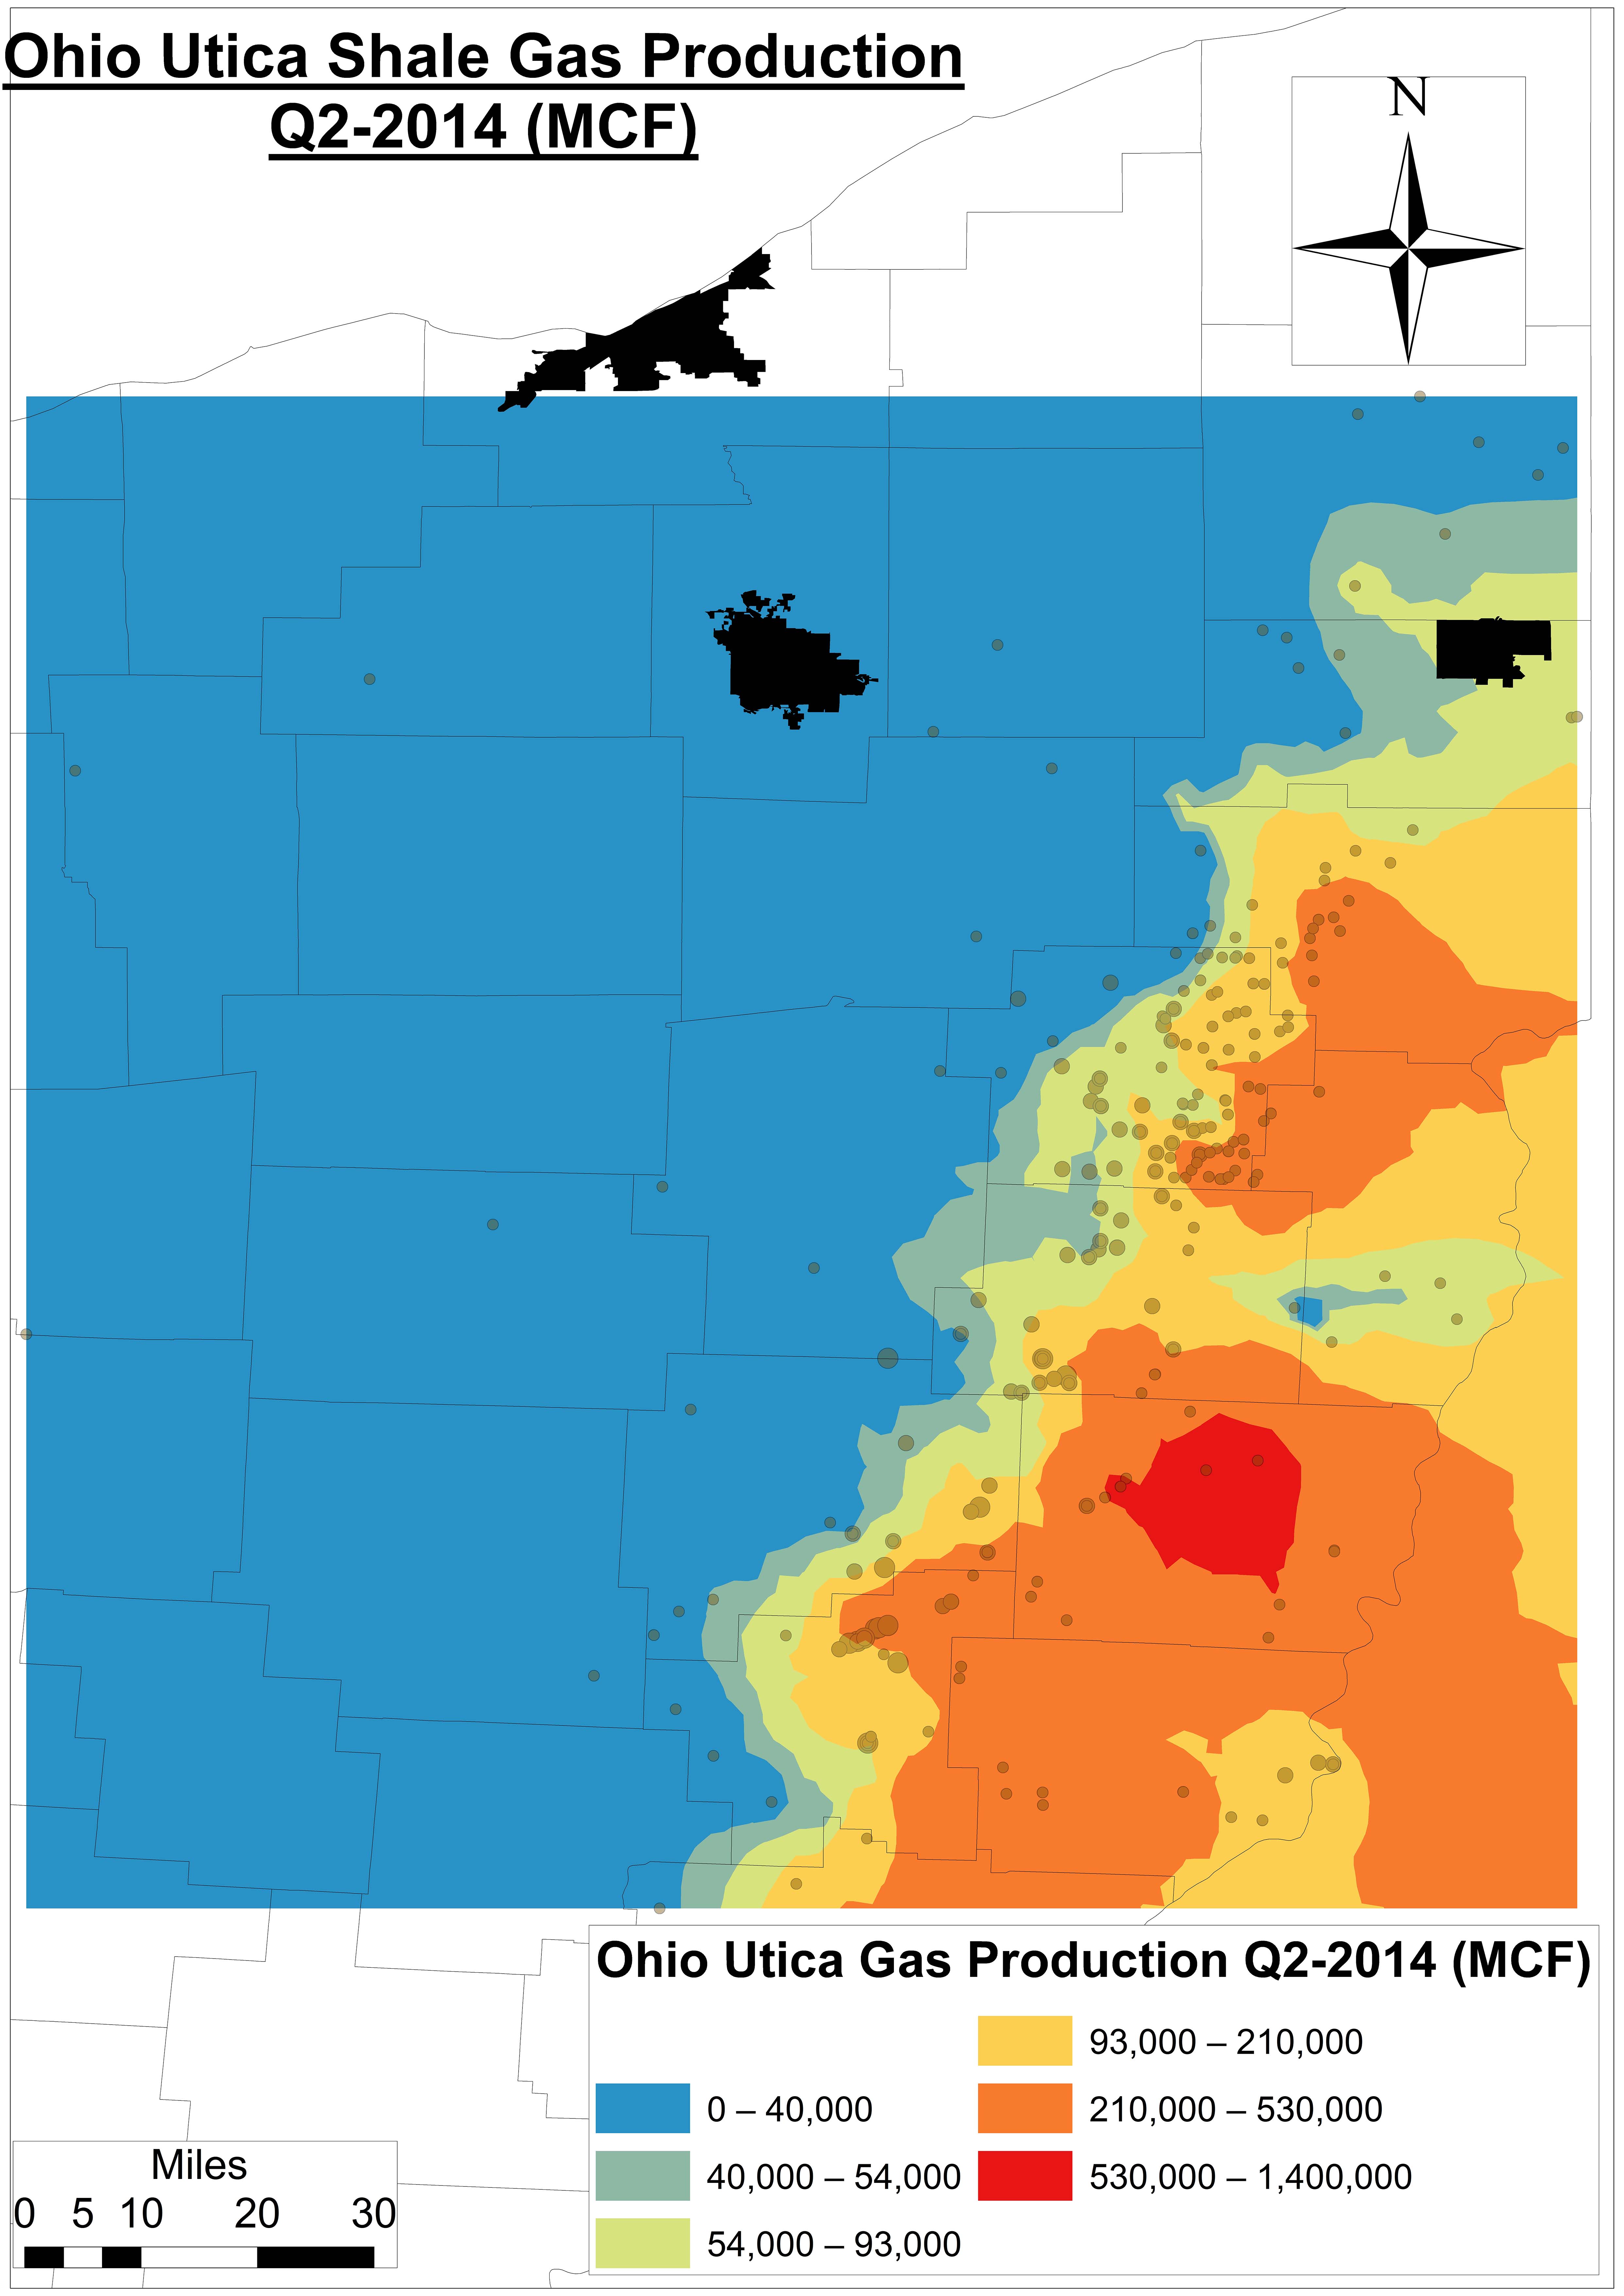
Figure 8a. An Ohio Utica Shale gas production model using Kriging for Q1-2013

An Ohio Utica Shale gas production model for Q2-2014 using an interpolative Geostatistical technique called Empirical Bayesian Kriging.

Figure 8b. An Ohio Utica Shale gas production model using Kriging for Q2-2014


Footnotes

  1. $4.25 per 1,000 gallons, which is the current going rate for freshwater at OH’s MWCD New Philadelphia headquarters, is 4.7-8.2 times less than residential water costs at the city level according to Global Water Intelligence.
  2. Carroll County wells have seen days in production jump from 36-62 days in 2011-2012 to 68-78 in 2014 across 256 producing wells as of Q2-2014.
  3. One Mcf is a unit of measurement for natural gas referring to 1,000 cubic feet, which is approximately enough gas to run an American household (e.g. heat, water heater, cooking) for four days.
  4. Assuming average oil and natural gas prices of $96 per barrel and $8.67 per Mcf during the current period of production (2011 to Q2-2014), respectively
  5. IHS’ share price has increased by $1.7 per month since publishing a report about the potential of US shale gas as a job creator and revenue generator
  6. On a per-API# basis or even regional basis we have not found drilling muds data. We do have it – and are in the process of making sense of it – at the Solid Waste District level.
  7. An interpolative Geostatistical technique formally called Empirical Bayesian Kriging.

The Water-Energy Nexus in Ohio, Part I

OH Utica Production, Water Usage, and Changes in Lateral Length
Part I of a Multi-part Series
By Ted Auch, OH Program Coordinator, FracTracker Alliance

As shale gas expands in Ohio, how too does water use? We conducted an analysis of 500+ Utica wells in an effort to better understand the water-energy nexus in Ohio between production, water usage, and lateral length across 500+ Utica wells. The following is a list of the primary findings from this analysis:

Lateral Length

Modified EIA.gov Schematic Highlighting the Lateral Portion of the Well

Figure 1. Modified EIA schematic highlighting the lateral portion of the unconventional well

In unconventional oil and gas drilling, often operators need to drill both vertically and then laterally to follow the formation underground. This process increases the amount of shale that the well contacts (see the modified EIA schematic in Figure 1). As a general rule Ohio’s Utica wells transition to the horizontal or lateral phase at around 6,800 feet below the earth’s surface.

1. The average Utica lateral is increasing in length by 51-55 feet per quarter, up from an average of 6,369 feet between Q3-2010 and Q2-2011 to 6,872 feet in the last four quarters. Companies’ lateral length growth varies, for example:

    • Gulfport is increasing by 46 feet (+67,206 gallons of water),
    • R.E. Gas Development and Antero 92 feet (+134,412 gallons of water), and
    • Chesapeake 28 feet (+40,908 gallons of water).

2. An increase in lateral length accounts for 40% of the increase in the water usage, as we have discussed in the past.

3. As a general rule, every foot increase in lateral length equates to an increase of 1,461 gallons of freshwater.

Regional and County-Level Trends

This section looks into big picture of shale gas drilling in OH. Herein we summarize the current state of water usage by the Utica shale industry relative to hydrocarbon production, as a percentage of residential water usage, as well as long-term water usage and waste production forecasts.

1. Freshwater Use

    • Across 516 wells, we found that the average OH Utica well utilizes 5.04-5.69 million gallons of freshwater per well.
    • This figure includes a ratio of 12:1 freshwater to recycled water used on site.
    • Water usage is increasing by 221-330,000 gallons per well per quarter.
      • Note: In neighboring – and highly OH freshwater reliant-West Virginia, the average Marcellus well uses 6.1-6.6 million gallons per well, with a trend increase of 189-353,000 gallons per quarter per well.
      • Water usage is up from 4.88 million gallons per well between 2010 and the summer of 2011 to 7.27 million gallons today.
    • Over the next five years, we will likely see 18.5 billion gallons of freshwater used for shale gas drilling in OH.
    • On average, drilling companies use 588 gallons of water to get a gallon of oil.
      • Average: 338 gallons of water required to get 1 MCF of gas
      • Average: 0.078 gallons of brine produced per gallon of water

2. Residential Water Allocation

    • A portion of residential water (3.8-6.1% of usage) is being allocated to the Utica drilling boom.
      • This figure is as high as 81% of residential water requirements in Carroll County.
      • And amounts to 2.2-3.5% of the available water in the Muskingum River Watershed.
    • The allocation will increase over time to amount to 8.2-10.5% of residential usage or 4.4-5.6% of Muskingum River available water.

3. Permitted Wells Potential

    • If all permitted Utica wells were to come online (active), we could expect 299.7 million gallons of additional brine to be produced and an additional 220 million gallons of freshwater a year to be used.
    • This trend amounts to 1.1 billion gallons of fracking brine waste looking for a home within 5 years.

4. Waste Disposal

    • Stallion Oilfield Services has recently purchased several Class II Injection wells in Portage County.
    • These waste disposal sites are increasing their intake at a rate of 2.13 million gallons per quarter, 4.76 times that of the rest of OH Class II wells.

Water Usage By Company

The data trends we have reviewed vary significantly depending on the company that is assessed. Below we summarize the current state of water usage by the major players in Ohio’s Utica shale industry relative to hydrocarbon production. 

1. Overall Statistics

    • The 15 biggest Water-To-Oil offenders are currently averaging 16,844 Gallons of Water per gallon of oil (PGO) (i.e., Shugert 2-12H, Salem-Grubbs 1H, Stutzman 1 and 3-14H, etc).
    • Removing the above 15 brings the Water-To-Oil ratio down from 588 to 52 gallons of water PGO.
    • The 9 biggest Water-To-Gas offenders are currently averaging 16,699 gallons of water per MCF of gas.
    • Removing the above 9 brings the Water-To-Gas ratio down from 338 to 27 gallons of water per MCF of gas.

Company differences are noticeable (Figure 2):

Water Usage by Hydraulic Fracturing Industry in Ohio

Figure 2. Average Freshwater Use Among OH Utica Operators

    • Antero and Anadarko used an average of 9.5 and 8.8 MGs of water per well during the course of the 45-60 drilling process, respectively (Note: HG Energy has the wells with the highest water usage but a limited sample size, with 9.8 MGs per well).
    • Six companies average in the middle with 6.7-8.1 MGs of water per well.
    • Four companies average 5 MGs per well, including Chesapeake the biggest player here in OH.
    • Devon Energy is the one firm using less than 3 MGs of freshwater for each well it drills.

2. Water-to-Oil Ratios

Water-Energy Nexus in Ohio: Water-to-Oil Ratios Among OH Utica Operators

Figure 3. Water-to-Oil Ratios Among OH Utica Operators

Freshwater usage is increasing by 3.6 gallons per gallon of oil. Companies vary less in this metric, except for Gulfport (Figure 3):

    • Gulfport is by far the least efficient user of freshwater with respect to oil production, averaging 3,339 gallons of water to extract one gallon of oil.
    • Intermediate firms include American Energy and Hess, which required 661 and 842 gallons of freshwater to produce a gallon of oil.
    • The remaining eleven firms used anywhere from 6 (Atlas Noble) to 130 (Chesapeake) gallons of freshwater to get a unit of oil.

3. Water-to-Gas Ratios (Figure 4)

Water-Energy Nexus in Ohio: Water-to-Gas Ratio Among OH Utica Operators

Figure 4. Water-to-Gas Ratio Among OH Utica Operators

    • American Energy is also quite inefficient when it comes to natural gas production utilizing >2,200 gallons of freshwater per MCF of natural gas produced
    • Chesapeake and CNX rank a distant second, requiring 437 and 582 gallons of freshwater per MCF of natural gas, respectively.
    • The remaining firms for which we have data are using anywhere from 13 (RE Gas) to 81 (Gulfport) gallons of freshwater per MCF of natural gas.

4. Brine Production (Figure 5)

Water-Energy Nexus in Ohio: Brine-to-Oil Ratios among Ohio Utica Operators

Figure 5. Brine-to-Oil Ratios among Ohio Utica Operators

    • With respect to the relationship between hydrocarbon and waste generation, we see that no firm can match Oklahoma City-based Gulfport’s inefficiencies with an average of 2,400+ gallons of brine produced per gallon of oil.
    • American Energy and Hess are not as wasteful, but they are the only other firms generating more than 750 gallons brine waste per unit of oil.
    • Houston-based Halcon and OH’s primary Utica player Chesapeake Energy are generating slightly more than 400 gallons of brine per gallon of oil.
    • The remaining firms are generating between 17 (Atlas Noble and RE Gas) and 160 (Anadarko) gallons of brine per unit of oil.

Part II of the Series

In the next part of this series we will look into inter-county differences as they relate to water use, production, and lateral length. Additionally, we will also examine how the OH DNR’s initial Utica projections differ dramatically from the current state of affairs.

Water and Production in Ohio's Utica Shale - Water Per Well

Water and Production in Ohio’s Utica Shale – Water Per Well


West Virginia shale viewer

West Virginia