These agencies differ greatly in how they oversee protections of their respective watersheds, particularly in the context of oil and gas development. For instance, the DRBC engages in a range of activities related to water quantity protection (like water supply allocation and water conservation), water quality, regulatory review and permitting, watershed-wide planning, flood mitigation and drought management, and recreational activities. Meanwhile, ORSANCO and the SRBC interpret their responsibilities very narrowly, primarily focusing on managing issues related to discharge standards in the case of ORSANCO, and water quantity in the case of the SRBC.
Major watershed boundaries in PA, with the Susquehanna River Basin shown in pale green. Source: DCNR
In this new series of articles, FracTracker Alliance, in partnership with the Sierra Club Pennsylvania Chapter and Clean Water Action, takes a closer look at the Susquehanna River Watershed and its many challenges related to industrial development, including deforestation and sedimentation issues, nutrient loading from poor agricultural practices, sewer and stormwater runoff. A significant component of Susquehanna River Basin impacts can be attributed to expanding oil and gas development. How will the Susquehanna River Watershed withstand future impacts from the oil and gas industry given the SRBC’s limited oversight? A first step in understanding the problem is to look at the state of the watershed today.
Oil & Gas in the Susquehanna River Watershed
As part of the ongoing Marcellus Shale oil and gas boom, nearly 5,500 unconventional wells on roughly 2,000 well pads have been drilled in the Susquehanna River Watershed since 2007. According to the Nature Conservancy, shale gas companies could drill 27,600 additional wells in the Susquehanna River basin by 2030, which would result in approximately 6,900 well pads (assuming four wells per pad, a relatively conservative number given recent trends where up to a dozen wells are being drilled on a single pad). These additional 4,900 well pads represent 31,850 acres of disturbed lands for the pads and access roads alone. Overall, the Nature Conservancy believes that up to 110,000 acres of forested land could be cleared in the Susquehanna River Watershed by 2030. In addition to well pads and access roads, one must also account for the impacts of associated pipelines. Estimates suggest that 12-15 acres of gathering line are installed per acre of well pad.
This explosive growth of the shale drilling industry, combined with declining resources for regulatory oversight, would complicate regional watershed management strategies. A growing body of evidence suggests that watersheds near hydraulic fracturing operations can be impacted by improper waste disposal, trucking accidents, migration of drilling fluids, as well as problems related to land disturbance such as pipeline and access road stream crossings, sedimentation and runoff (needs a reference). And while there are two major water monitoring programs operating in the Susquehanna River, one run by the Pennsylvania Department of Environmental Protection (PA DEP) and the other operated by the SRBC, significant questions remain about their ability to assess the Susquehanna River’s water quality. These concerns primarily stem from the infrequent and patchwork-like coverage of their sampling regimes, as well as inconsistencies in indicators measured at different sites.
Existing Water Monitoring Efforts
Watershed testing is key to understanding how industrial development affects water quality. It also significantly informs mitigation strategies. In this first map of the series (below), we have put together several layers to help illustrate the state of water testing in the Susquehanna River Basin. This map can be used to obtain summary information about unconventional oil and gas activity and monitoring efforts at the watershed level by clicking on individual features.
Note that there are two separate layers on this map depicting summary data — one outlined in dark green and one in light green, both at HUC-08 level. The dark green outlines are in PA only and contain oil and gas summaries of wells and violations. The light green outlines show agency-based monitoring activity, and are not restricted to PA boundaries. The reason for the two layers is that states classify oil and gas wells differently and so cannot be combined easily.
The Susquehanna River Basin has over 49,000 miles of waterways, according to the SRBC. While it may not be possible to fully document the impacts that the oil and gas industry has on the basin, there are some efforts underway to chronicle changes to the river system. In this map, we look at the efforts of governmental and quasi-governmental agencies to test the waters throughout the region, which range from periodic grab samples to automated data loggers that constantly evaluate several measures of water quality. There are advantages to both methods, as data loggers can capture short term spikes in conductivity, for example, that monthly sampling would likely miss altogether. However, grab sampling allows for a more in-depth analysis of the water in a laboratory than what the data loggers can provide.
While oil and gas is the focus of the map, it is not the only concern of the SRBC. Thus, considerable testing occurs in areas that are not seeing drilling activity. The drilling regions are shown on the map as a great orange arc, extending from Indiana County in the west-central part of Pennsylvania all the way to Susquehanna county in the Northern Tier. If you zoom in on this region, data for individual unconventional wells will become visible, along with permits for wells that have yet to be been drilled, and violations that have been issued by DEP.
Clusters of Development and Oversight
In some regions of the Susquehanna basin, there are significant clusters of oil and gas activity without a corresponding governmental monitoring regimen. Other areas have significant monitoring coverage. In many cases, periodic grab samples are taken from the same sites as data loggers – and may therefore appear twice on our map – to capture both aspects of monitoring activity. Our map can be used to find quick summary data for a given watershed. For example, the Upper Susquehanna-Tunkhannock watershed is being monitored with 53 testing sites and nine data loggers. The same region has 2,178 wells, and 2,347 violations associated with these wells.
We can also use the map to focus on concerns at different scales. The cluster of drilling activity in Ulysses Township, seen below, resulted in a number of violations (shown in yellow). Due to historical impact of the oil and gas industry in this sub-watershed, additional monitoring locations might be called for.
While we think that it is important to protect all the Susquehanna’s waters, certain areas are more fragile than others. For instance, headwater streams that are designated as high quality (HQ) or exceptional value (EV) are vital to the overall health of the river system and their protection is required by Pennsylvania law. However, many headwaters streams have no monitoring despite heavy oil and gas drilling, as can be seen in the below map. We have included HQ/EV designated streams on the map, although due to the large amount of data these streams are not displayed by default. They can be seen by activating the layer.
Broader Implications
The Susquehanna River provides drinking water to 4.1 million people, including residents in New York, Pennsylvania, and Maryland. In addition, through water that is diverted to areas outside the watershed, it is estimated that the Susquehanna also serves as a drinking water supply for 2 million people in more populated areas such as Baltimore, MD and Chester County, PA. With clean drinking water hanging in the balance, and the potential build-out of thousands more natural gas well pads in the watershed, it is more important than ever to understand how oil and gas activity could affect the watershed.
The Pennsylvania Constitution reminds us of our right to clean air, pure water, and the preservation of the environment. Prior to the adoption of the Environmental Rights Amendment — 80 years ago this year — and long before the federal Clean Water Act, the Pennsylvania legislature passed the state level Clean Streams Law in recognition of the need to protect the integrity of our valuable aquatic resources. In the spirit of this tradition to lead on clean water issues, the SRBC, Pennsylvania, and surrounding states must commit to putting the protection and preservation of the Susquehanna River watershed at the forefront of decision-making within the basin.
In future installments of this series, we seek to reveal gaps in watershed and land management plans in order to evaluate what these risks mean for the people and environments of the Susquehanna River Basin. The mapping and analysis provided in this series will be used to frame a series of conversations throughout the Basin with the goal of encouraging concerned residents to become more involved in public discussions about watershed management planning. Further, this project will result in recommendations for tangible solutions to filling oversight and management gaps and communicate these findings to relevant agencies. Only with adequate information can the public ensure strong protections for this life-sustaining waterway. Recognizing the important work that the SRBC has done in recent years, we also hope to identify areas where the Commission can direct additional resources to analyzing the cumulative impacts of shale gas development and expand their oversight strategies.
https://www.fractracker.org/a5ej20sjfwe/wp-content/uploads/2017/01/Susq_intro_header.jpg400900FracTracker Alliancehttps://www.fractracker.org/a5ej20sjfwe/wp-content/uploads/2025/09/2025-Wordmark-Logo.pngFracTracker Alliance2017-02-01 11:50:442021-04-15 15:03:47An Introduction to the Susquehanna River Basin Impacts Project
By Kyle Ferrar, Western Program Coordinator, FracTracker Alliance
Eliza Czolowski, Program Associate, PSE Healthy Energy
Since April 2016, demonstrators in North Dakota have been protesting a section of the Dakota Access Pipeline (DAPL) being built by Dakota Access LLC, a construction subsidiary of Energy Transfer Partners LP. The proposed pipeline passes just 1.5 miles north of the Standing Rock Sioux Tribal Lands, where it is planned to cross Lake Oahe, the largest Army Corps of Engineers reservoir created on the Missouri River. The tribe argues that the project will not only threaten their environmental and economic well-being, but will also cut through land that is sacred.
Given how quickly circumstances have changed on the ground, we have received numerous requests to post an overview on the issue. This article examines the technical aspects of the DAPL proposal and details the current status of protests at Standing Rock. It includes a discussion of what the Army Corps’ recent denial of DAPL’s permits means for the project as well as looks towards the impacts of incoming Trump administration. We have also created the below map to contextualize DAPL and protest activities that have occurred at Standing Rock.
DAPL is a $3.78 billion dollar project that was initially slated for completion on January 1, 2017. The DAPL is a joint venture of Phillips 66, Sunoco Logistics, and other smaller fossil fuel companies including Marathon Petroleum Corporation, and Enbridge Energy Partners. Numerous banks and investment firms are supporting the project and financing the related infrastructure growth, including Citi Bank, JP Morgan Chase, HSBC, PNC, Community Trust, Bank of America, Morgan Stanley, ING, Tokyo-Mitsubishi, Goldman Sachs, Wells Fargo, SunTrust, Us Bank, UBS, Compass and others.
Its route travels from Northwestern North Dakota, south of Bismarck, and crosses the waterway made up of the Missouri River and Lake Oahe just upriver of the Standing Rock Sioux Tribal Area. From North Dakota the pipeline continues 1,172 miles to an oil tank farm in Pakota, Illinois. DAPL would carry 470,000 barrels per day (75,000 m3/d) of Bakken crude oil with a maximum capacity up to 570,000 barrels per day. That’s the CO2 equivalent of 30 average sized coal fired power plants.
As documented by the NY Times map, in addition to the Missouri River and Lake Oahe, the pipeline crosses 22 other waterways that also require the pipeline to be drilled deep under these bodies of water. But Standing Rock portion is the only section disputed and as of yet unfinished. Now the pipeline project, known by the protesters as “the black snake,” is over 95% complete, despite having no official easement to cross the body of water created by the Missouri River and Lake Oahe. The easement is required for any domestic pipeline to cross a major waterway and because the land on either side of the Army Corps Lake Oahe project is managed by the Army Corps (shown in the protest map). An easement would allow Dakota Access LLC to drill a tunnel for the pipeline under the federally owned lands, including the lake and river.
Safety & Environmental Racism
Proponents of the project tout the opinion that pipelines are the safest method of moving oil large distances. Trucking oil in tankers on highways has the highest accident and spill rates, whereas moving oil by railways presents a major explosive hazard when incidents do occur. Pipeline spills are therefore considered the “safe” alternative. On November 11, Kelcy Warren was interviewed on CBS News, claiming Dakota Access, LLC takes every precaution to reduce leaks and that the likelihood of a leak is highly unlikely. The problem with comparing the risk for each of these transportation methods is that rates of incidence are the only comparison. The resulting hazard and impact is ignored. When pipelines rupture, they present a much larger hazard than trucks and trains. Large volumes of spilled oil result in much greater water and soil contamination.
We know that pipelines do rupture, and quite often. An analysis by the U.S. DOT Pipeline and Hazardous Materials Safety Administration in 2012 shows that there have been 201 major incidents (with volumes over 1,000 gallons) related to liquid leaks in the U.S. over the last ten years that were reported to the Department of Transportation. The “average” pipeline therefore has a 57% probability of experiencing a major leak, with consequences over the $1 million range, in a ten-year period. FracTracker’s recent analysis of PHMSA data shows the systemic issue of pipeline spills: there have been 4,215 pipeline spill incidents just since 2010 resulting in 100 reported fatalities, 470 injuries, and property damage exceeding $3.4 billion! The recent (December 12) spill of 176,000 gallons of crude oil into a stream just 150 miles from the Standing Rock protest site highlights the Tribes’ concerns.
A previously proposed route for the DAPL would have put Bismarck—a city that is 92% white—just downriver of its Missouri River crossing. This initial route was rejected due to its potential threat to Bismarck’s water supply, according to the Army Corps. In addition to being located upriver of Bismarck’s water intake, the route would have been 11 miles longer and would have passed through “wellhead source water protection” areas that are avoided to protect municipal water supply wells. Passing through this “high consequence area” would have required further actions and additional safety measures on the part of Dakota Access LLC. The route would also have been more difficult to stay at least 500 feet away from homes, as required by the North Dakota Public Service Commission. The route was changed and pushed as close to Sioux County as possible, the location of the Standing Rock Indian Reservation.
Protests: The Water Protectors
The Standing Rock Sioux Tribe has taken an active stance against Bakken Oil Development in the past. In 2007, the Reservation passed a resolution to prevent any oil and gas development or pipelines on the Tribal Lands. However, deep concerns about the safety of DAPL led protesters to begin demonstrations at Standing Rock in April, 2016. The Standing Rock Sioux Tribe then sued the Army Corps in July, after the pipeline was granted most of the final permits over objections of three other federal agencies. Construction of it, they say, will “destroy our burial sites, prayer sites and culturally significant artifacts.” A timeline of The Standing Rock Sioux Tribe’s litigation addressing DAPL through this period can be found on the EARTHJUSTICE website.
In August, a group organized on the Standing Rock Indian Reservation called ReZpect Our Water brought a petition to the Army Corps in Washington, D.C. stating that DAPL interferes with their ancestral land and water rights. The Tribe sued for an injunction citing the endangerment of water and soil, cultural resources, and the improper use of eminent domain. The suit argued that the pipeline presents a risk to Sioux Tribe communities who live near or downstream of the pipeline. The Missouri River is the main water source for the Standing Rock Sioux Tribe. In September, members of the Standing Rock Sioux tribe in North Dakota finally made headlines.
Federal Injunction
On September 9, District Judge James Boasberg denied the Standing Rock Sioux Tribes preliminary injunction request to prevent the Army Corps from granting the easement. The Judge ordered Dakota Access to stop work only on the section of pipeline nearest the Missouri river until the Army Corps granted the crossing easement. The excavation of Standing Rock burial grounds and other sacred sites, where direct action demonstrators were clashing with Dakota Access security and guard dogs, was allowed to continue. Later that same day, a joint statement was released by the U.S. Department of Justice, the Department of the Interior, and the U.S. Army:
“We request that the pipeline company voluntarily pause all construction activity within 20 miles east or west of Lake Oahe.”
In the map above the 20-mile buffer zone is shown in light green. Regardless of the request from the three federal agencies to pause construction, Dakota Access’s parent company Energy Transfer Partners LP ignored requests to voluntarily halt construction. Dakota Access LLC has also disregarded the instructions of the federal judge. The Army Corps declared Dakota Access LLC would not receive the easement required to cross the waterway until after 2016, but that has not stopped the company from pushing forward without the necessary permits. The pipeline has been built across all of Cannonball Ranch right up to Lake Oahe and the Missouri River, which can be seen in the map above and in drone footage taken November 2, 2016 showing the well pad for the drill rig has been built.
On November 4 the Army Corps requested Dakota Access LLC voluntarily halt construction for 30 days; then on November 8 (Election Day), Dakota Access ignored the request and announced they would begin horizontally drilling under the waterway within weeks. On November 14 Dakota Access filed a lawsuit against the Army Corps arguing that permits are not legally required. Later that day, the Army Corps responded with a statement that said any construction on or under Corps land bordering Lake Oahe cannot occur because the Army has not made a final decision on whether to grant an easement. In the issued statement, Assistant Secretary of the Army Jo-Ellen Darcy said “in light of the history of the Great Sioux Nation’s dispossession of lands [and] the importance of Lake Oahe to the Tribe,” the Standing Rock Sioux tribe would be consulted to help develop a timetable for future construction plans. The Army Corps has since denied the easement entirely.
Violence Against Protesters
Law enforcement has used physical violence to disrupt demonstrations on public lands and to prevent direct action activities as protesters aim to shut down construction on private land held by Energy Transfer Partners LP. Since September 4, law enforcement agencies led by the Morton County Sheriff’s Department have maintained jurisdiction over the protests. Officers from other counties and states have also been brought in to assist. Morton County and the State of North Dakota do not have the jurisdiction to evict protesters from the camps located on Army Corps land. Well over 500 activists have been arrested.
The majority of clashes with law enforcement have occurred on the roadways exiting the Army Corps lands, or at the access points to the privately owned Cannonball Ranch (shown on the map). Morton County has spent more than $8 million keeping direct action protesters from shutting down excavation and construction activities along the path of the pipeline. Meanwhile, the state of North Dakota has spent over $10 million on additional law enforcement officials to provide assistance to Morton County.
The first violent confrontation occurred on September 3 after Dakota Access bulldozed an area of Cannonball Ranch identified by the Tribe as a sacred site hosting burial grounds. At that time, the site was actively being contested in court and rulings still had not been made. The Tribe was seeking a restraining order, known as a “preliminary injunction” to protect their cultural heritage. Direct action demonstrators put themselves in the way of bulldozers to stop the destructive construction. In response, Dakota Access LLC security personnel assaulted protesters with pepper spray and attack dogs. The encounter was documented by Democracy Now reporter Amy Goodman.
October 27, the Morton County Sheriff’s Department reinforced with 300 police from neighboring counties and states, raided the frontline camp site making mass arrests. In response, demonstrators reinforced a blockade of the 1806 bridge, shown in the map above. The most violent clash was witnessed on public lands on November 20, 2016 at this bridge, which demarcates Army Corps land. The Police forces’ use of “non-lethal” bean bag rounds, rubber bullets, tear gas, pepper spray, water hoses, LRAD, and explosive flash grenades on peaceful demonstrators has been criticized by many groups. Fire hoses were used on protesters in freezing conditions resulting in dozens of demonstrators needing treatment for hypothermia. In total 300 people were injured according to a release from the standing rock medic and healer council.
Most recently, the Army Corps has targeted the Standing Rock Demonstration by determining that it is no longer safe to stay at the Sacred Stone and Oceti Sakowin camps located on Army Corps property. North Dakota Governor Jack Dalrymple has frequently blasted the Army Corps for not removing the protesters.
As of December 5th, federal authorities consider the protesters to be trespassing on federal lands, leaving protesters vulnerable to various citations and possible arrest. The Army Corps has also said that emergency services may no longer be provided in the evacuation area. The Army Corps has jurisdiction on Army Corps lands, and only federal authorities can remove the protesters from federal lands. There are now more than 5,000 activists demonstrating at Standing Rock, and an additional 2,000 U.S. veterans joined the protest this past week for an action of solidarity. Nevertheless, U.S. authorities have said that there are no plans to forcibly remove activists, despite telling them to leave.
Victory and an Uncertain Future
Perhaps as a result of this mass outcry, the Army Corps announced on December 4th—only a day before trespassing claims would be imposed—that Dakota Access LLC’s permit application to cross under the Missouri River and Lake Oahe had been denied. Jo-Ellen Darcy, the Army’s Assistant Secretary for Civil Works, announced:
“Although we have had continuing discussion and exchanges of new information with the Standing Rock Sioux and Dakota Access, it’s clear that there’s more work to do…The best way to complete that work responsibly and expeditiously is to explore alternate routes for the pipeline crossing.”
To determine alternate routes, the Army Corps has announced it will undertake an environmental impact statement which could take years to complete. While this is a major victory for the “water protectors” demonstrating at Standing Rock, it is not a complete victory. Following the Army Corps’ announcement, the two main pipeline investors, Energy Transfer Partners LP and Sunoco Logistics, responded that they:
“…are fully committed to ensuring that this vital project is brought to completion and fully expect to complete construction of the pipeline without any additional rerouting in and around Lake Oahe. Nothing this Administration has done today changes that in any way.”
In fact, prior to the Army Corps denying the easement, numerous democrats in congress called for President Obama to shut down the pipeline. While President Obama has not heeded these calls to shut down the project entirely, he also has not given the green light for the project either. Instead the President stated that the situation needed to be handled carefully and urged the Army Corps to consider rerouting the pipeline. “We’re monitoring this closely and I think, as a general rule, my view is that there’s a way for us to accommodate sacred lands of Native Americans…. I think right now the Army Corps is examining whether there are ways to reroute this pipeline,” the President said.
The Corps decision to conduct a lengthy environmental impact statement is encouraging but, ultimately, the Trump administration may have the final say on the DAPL easement. President-elect Trump has voiced support for the easement in the past, and on December 5th, just one day following the Army Corps’ decision, Trump spokesman Jason Miller commented:
“That’s something we support construction of, and we will review the full situation in the White House and make an appropriate determination at that time.”
Energy Transfer Partners LP CEO Kelcy Warren donated $103,000 to the Trump campaign and the President-elect has investments in Energy Transfer Partners LP totaling up to $1 million according to campaign financial disclosures. President-elect Trump has made it clear that pipeline projects, specifically the Keystone Access Pipeline rejected by President Obama, will be allowed to move forward along with additional fossil fuel extraction projects.
If the construction company, Dakota Access LLC, continues building the pipeline they are liable to be fined. It is not yet clear whether Dakota Access LLC will “eat” the fine to continue building and drilling, or whether the Army Corps will forcefully stop DAPL. Analysts say the expense of changing the route, such as to the south of the tribal lands, would make the economics of the pipeline a total loss. It is cheaper for Dakota Access LLC to continue to fight the protest despite overwhelming disapproval of the project.
Meanwhile, protestors have refused to leave Standing Rock in fear that the Army Corp will reverse its decision and allow DAPL to proceed, despite requests by the chairman of the Sioux Tribe that demonstrators go home. Many are hopeful that, by stalling the project past January 1st—the deadline by which Energy Transfer Partners LP promised oil companies it would complete construction—the possibility exists that contracts will expire and DAPL loses support from investors.
Other Mapping Resources
This web map shows the current construction progress of the pipeline.
The New York Times website is hosting a map focusing on the many water crossings of the pipeline route.
The Guardian has a static map on their website similar to our interactive map.
FracTracker has been increasingly looking at oil and gas drilling in Colorado, and we’re finding some interesting and concerning issues to highlight. Firstly, operators in Colorado are not required to report volumes of water use or freshwater sources. Additionally, this analysis looked at how wastewater in Colorado is injected, and found that the majority is injected into Class II disposal wells (85%) while recycling wastewater is not common. Open-air pits for evaporation and percolation of wastewater is still a common practice. Colorado has at least 340 zones granted aquifer exemptions from the Clean Water Act for injecting wastewater into groundwater. The analysis also found that Weld County produces the most oil and gas in the state, while Rio Blanco and Las Animas counties produce more wastewater. And finally, Rio Blanco injects the most wastewater of all Colorado counties. Learn more about groundwater threats in Colorado below:
Introduction
Working directly with communities in Weld County, Colorado the FracTracker Alliance has identified issues concerning oil and gas exploration and production in Colorado that are of particular concern to community stakeholder groups. The issues include air quality degradation, environmental justice concerns for communities most impacted by oil and gas extraction, and leasing of federal mineral estates. Analysis of data for Colorado’s Front Range has identified areas where setback regulations are not followed or are inadequate to provide sufficient protections for individuals and communities and our analysis of floodplains shows where oil and gas operations pose a significant risk to watersheds. In this article we focus on the specific threat to groundwater resources as a result of particular waste disposal methods, namely underground injection and land application in disposal pits and sumps. We also focus on the sources of the immense amount of water necessary for fracking and other extraction processes.
Groundwater Threats
Numerous threats to groundwater are associated with oil and gas drilling, including hydraulic fracturing. Research from other regions shows that the majority of groundwater contamination events actually occur from on-site spills and poor management and disposal of wastes. Disposal and storage sites and spill events can allow the liquid and solid wastes to leach and seep into groundwater sources. There have been many groundwater contamination events documented to have occurred in this manner. For example, in 2013, flooding in Colorado inundated a main center of the state’s drilling industry causing over 37,380 gallons of oil to be spilled from ruptured pipelines and damaged storage tanks that were located in flood-prone areas. There are serious concerns that the oil-laced floodwaters have permanently contaminated groundwater, soil, and rivers.
Waste Management
In Colorado, wastes are managed several ways. If the wastewater is not recycled and used again in other production processes such as hydraulic fracturing, drilling fluids disposal must follow one of three rules:
Additionally the wastes can be dried and buried in additional drilling pits, with restrictions for crop land. For oily wastes, those containing crude oil, condensate or other “hydrocarbon-containing exploration and production waste,” there are additional land application restrictions that mostly require prior removal of free oil. These various sites and facilities are mapped below, along with aquifer exemptions and other map layers related to water quality.
Figure 1. Interactive map of groundwater threats in Colorado
In 2015, Colorado injected a total of 649,370,514 barrels of oil and gas wastewater back into the ground. That is 27,273,561,588 gallons, which would fill over 41,000 Olympic sized swimming pools. Injected into the ground in deep formations, this water is forever removed from the water cycle.
Allowable injection fluids include a variety of things you do not want to drink:
Produced Water
Drilling Fluids
Spent Well Treatment or Stimulation Fluids
Pigging (Pipeline Cleaning) Wastes
Rig Wash
Gas Plant Wastes such as:
Amine
Cooling Tower Blowdown
Tank Bottoms
This means that federal exemptions to Underground Injection Control (UIC) regulations for oil and gas exploration and production have nothing to do with environmental chemistry and risk, and only consider fluid source.
Why the concern?
Why are we concerned about these wastes? To quote the regulation, “it is possible for an exempt waste and a non-exempt hazardous waste to be chemically very similar” (RCRA). Since oil and gas development is considered part of the United State’s strategic energy policy, the entire industry is exempt from many federal regulations, such as the Safe Drinking Water Act (SDWA), which protects underground sources of drinking water (USDW).
The Colorado Oil and Gas Conservation Commission has primacy over the UIC permits and the Colorado Department of Public Health and Environment (CDPHE) administers the environmental protection laws related to air quality, waste discharge to surface water, and commercial disposal facilities. Under the UIC program, operators are legally allowed to inject wastewater containing heavy metals, hydrocarbons, radioactive elements, and other toxic and carcinogenic chemicals into groundwater aquifers.
The State of CO Injection Wells
According to the COGCC production reports for the year 2015, there are 9,591 active injection wells with volumes reported to the regulatory agency. Additionally, there are of course distinctions within the UIC rules for different types of injection wells, although the COGCC does not provide comprehensive data to distinguish between these types.
Injecting into the same geological formation or “zone” as producing wells is typically considered EOR, although some of the injected water will ultimately remain in the ground. Injecting into a producing formation is an immediate qualification for receiving an aquifer exemption.
EOR operations require considerably more energy and resources than conventional wells, and therefore have a higher water carbon footprint. If the wastewater is “recycled” as hydraulic fracturing fluid, the injections are exempt from all UIC regulations regardless. These are two options for the elimination of produced wastewater, although much of it will return to the surface in the future along with other formation waters. When the produced waters reach a certain level of salinity the fluid can no longer be used in enhanced recovery or stimulation, so final disposal of wastewater is typically necessary. These liquid wastes may then go to UIC Class II Disposal Wells.
Class II Injection Wells
The wells injecting into non-producing formations are therefore disposal wells, since they are not “enhancing production.” Of the almost 10,000 active injection wells in Colorado there are OVER 670 class II disposal well facilities; 402 facilities are listed as currently active. These facilities may or may not host multiple wells. By filtering the COGCC production and injection well database by target formation, we find that there are over 1,070 wells injecting into non-producing formations. These disposal wells injected at least 66,193,874 barrels (2,780,142,708 gallons) of wastewater in 2015 alone.
Where is the waste going?
A simple life-cycle assessment of wastewater in Colorado shows that the majority of produced water is injected back underground into class II disposal and EOR wells. The percentage of injected produced waters has been increasing since 2012, and in 2015 85% of the total volume of produced water in 2015 was injected.
If we assume that all the volume injected was produced wastewater, this still leaves 60 million barrels of produced water unaccounted for. Some of this volume may have been recycled and used for hydraulic fracturing, but this is rarely the case. Other options for disposal include commercial oilfield wastewater disposal facilities (COWDF) that use wastewater sumps (pits) for evaporation and percolation, as well as land application, to dilute the solid and liquid wastes by mixing them into soil.
Centralized Exploration and Production Waste Management Facilities
Figure 2. Chevron Wastewater Land Application and Pit “Disposal” Facility. Photo by COGCC
As can be seen in the Figure 2 to the right, land application sites are little more than farms that don’t grow anything, where wastewater is mixed with soil. Groundwater monitoring wells around these sites measure the levels of some contaminants. Inspection reports show that sampling of the wastewater is not usually – if ever – conducted. The only regulatory requirement is that oil is not visibly noticeable as a sheen on the wastewater fluids in impoundments, such as the one in Figure 3 below, operated by Linn Operating Inc., which is covered in an oily sheen.
In most other hydrocarbon producing states, open-air pits or sumps are not allowed for a variety of reasons. At FracTracker, we have covered this issue in other states, as well. In New Mexico, for example, the regulatory agency outlawed the use of pits after finding cased where 369 pits were documented to have contaminated groundwater. California is another state that still uses above ground pits for disposal. At sites in California, plumes of contaminants are being monitored as they spread from the facilities into surrounding regions of groundwater. Additionally, these wastewater pit disposal sites present hazards for birds and wildlife. There have been a number of papers documenting bird deaths in pits, and the risk for migratory bird species is of high concern. Other states like California are struggling with the issue of closing these types of open-air pit facilities. Closing these facilities means that more wastewater will be injected in Class II disposal wells.
Figure 3. Linn energy oily wastewater disposal pit
Production and Injection Volumes
The data published by the COGCC for well production and injection volumes shows some unique trends. An analysis of injection and production well volumes shows Class II Injection is tightly connected to exploration and production activities. This finding is not surprising. Class II injection wells are considered a support operation for the production wells, and therefore should be expected to be similarly related. Wastewater injection wells are needed where oil and gas extraction is occurring, particularly during the exploration and drilling phases.
Looking at the graphs in Figures 4-6 below, it is obvious that injection volumes have been consistently tied to production of wastewater. It is also clear that the trend since 2012 shows that an increasingly larger percentage of wastewater is being injected each year. This trend follows the sharp increase in high volume hydraulic fracturing activity that occurred in 2012. During this boom in exploration and drilling activity, recycling of flowback for additional hydraulic fracturing activities most likely accounts for some of the discrepancy in accounting for the fact that 200% more wastewater was produced than was injected in 2012.
When Figure 4 (below) is compared to the graphs in Figures 5 and 6 (further below) it is also interesting to note that produced water volumes in 2015 are at a 5-year low as of 2015, while production volumes of both natural gas and oil are at a 5-year high. Wastewater volumes are linked to production volumes, but there are many other factors, including geological conditions and types of extraction technologies being used, that have a massive affect on wastewater volumes.
Figure 4. Colorado wastewater volumes by year (barrels)
The graphs in Figures 5 and 6 below show different trends. Gas production in Colorado has remained relatively constant over the last five years with a sharp increase in 2015, while oil production volumes have been continually increasing, with the largest increase of 49% from 2014 to 2015, and 46% the year prior.
Figures 5-6
Colorado’s Front Range, specifically Weld County, is increasing oil production at a fast rate. New multi-well well-pads are being permitted in neighborhoods and urban and suburban communities without consideration for even elementary schools. Weld County currently has 2,169 new wells permitted within the county. The figure is higher than the next 9 counties combined. The other top three counties with the most well permits are 2. Garfield (1,130) and 3. Rio Blanco (189), for perspective. Additionally, 74% of pending permits for new wells are located in Weld County.
How Counties Compare
The top 10 counties for oil production are very similar to the top 10 counties for both produced and injected volumes, although there are some inconsistencies (Table 1). For example, Las Animas County produces the second largest amount of produced wastewater, but is not in the top 10 of oil producing counties. This is because the majority of wells in Las Animas County produce natural gas. Natural gas wells do not typically produce as much wastewater as oil wells. The counties and areas with the most oil and gas production are also the regions with the most injection and surface waste disposal, and therefore surface water and groundwater degradation.
Table 1. Top 10 CO counties for gas production, oil production, wastewater production, and injection volumes in 2015.
Gas Production
Oil Production
Wastewater Production
Injection Volumes
Rank
County
Gas1
County
Oil2
County
Water2
County
Water2
1
Weld
568,919,168
Weld
112,898,400
Rio Blanco
113,132,037
Rio Blanco
138,502,742
2
Garfield
556,855,359
Rio Blanco
4,412,578
Las Animas
45,868,907
Weld
50,360,796
3
La Plata
322,029,940
Gardield
1,744,900
Weld
37,665,571
Garfield
29,022,147
4
Las Animas
78,947,042
Araahoe
1,661,204
Garfield
34,704,673
La Plata
23,211,646
5
Rio Blanco
57,284,876
Lincoln
1,194,435
Washington
25,075,998
Washington
15,105,886
6
Mesa
32,200,936
Cheyenne
1,192,162
La Plata
23,352,861
Las Animas
13,706,555
7
Yuma
25,960,947
Adams
664,530
Cheyenne
9,326,944
Cheyenne
10,309,413
8
Archuleta
13,648,006
Moffat
419,893
Moffat
7,712,323
Logan
5,930,937
9
Moffat
13,610,219
Washington
413,603
Logan
5,606,828
Mesa
5,611,075
10
Gunnison
4,805,541
Jackson
407,537
Morgan
4,197,849
La Plata
4,992,391
1. Units are in MCF = Thousand cubic feet of natural gas;
2. Units are in Barrels
Aquifer Exemptions
Operators are given permission by the U.S. EPA to inject wastewater into groundwater aquifers in certain locations where groundwater formations are particularly degraded or when operators are granted aquifer exemptions. Aquifer exemptions are not regions where the groundwater is not suitable for use as drinking water. Quite the contrary, as any aquifer with groundwaters above a 10,000 ppm total dissolved solids (TDS) threshold are fast-tracked for injection permits. When the TDS is below 10,000 ppm operators can apply for an exemption from SDWA (safe drinking water act) for USDWs (underground sources of drinking water), which otherwise protects these groundwater sources. An exemption can be granted for any of the following three reasons. The formation is:
hydrocarbon producing,
too deep to economically access, or
too “contaminated” to economically treat.
Since the first requirement is enough to satisfy an exemption, most class II wells are located within oil and gas fields. Other considerations include approval of mineral owners’ permissions within ¼ mile of the well. On the map above, you can see the ¼ mile buffers around active injection wells. If you live in Colorado, and suspect you live within the ¼ mile buffer of an injection well, you can input an address into the search field in the top-right corner of the map to fly to that location.
Sources of Water
The economic driver for increasing wastewater recycling is mostly influenced by two factors. First, states with many class II disposal wells, like Colorado, have much lower costs for wastewater disposal than states like Pennsylvania, for example. Additionally, the cost of water in drought-stricken states makes re-use more economically advantageous.
These two factors are not weighted evenly, though. On the Colorado front range, water scarcity should make recycling and reuse of treated wastewater a common practice. The stress of sourcing fresh water has not yet become a finanacial restraint for exploration and production. Water scarcity is an issue, but not enough to motivate operators to recycle. According to an article by Small, Xochitl T (2015) “Geologic factors that impact cost, such as water quality and availability of disposal methods, have a greater impact on decisions to recycle wastewater from hydraulic fracturing than water scarcity.” As long as it is cheaper to permit new injection wells and contaminate potential USDW’s than to treat the wastewater, recycling practices will be largely ignored. Even in Colorado’s arid Front Range where the demand for freshwater frequently outpaces supply, recycling is still not common.
Fresh Water Use
The majority of water used for hydraulic fracturing is freshwater, and much of it is supplied from municipal water systems. There are several proposals for engineering projects in Colorado to redirect flows from rivers to the specific municipalities that are selling water to oil and gas operators. These projects will divert more water from the already stressed watersheds, and permanently remove it from the water cycle.
The Windy Gap Firming Project, for example, plans to dam the Upper Colorado River to divert almost 10 billion gallons to six Front Range cities including Loveland, Longmont, and Greeley. These three cities have sold water to operators for fracking operations. Greeley in particular began selling 1,500 acre-feet (500 million gallons) to operators in 2011 and that has only increased . The same thing is happening in Fort Lupton, Frederick, Firestone, and in other communities. Additionally, the Northern Integrated Supply Project proposes to drain an additional 40,000 acre feet/year (13 billion gallons) out of the Cache la Poudre River northwest of Fort Collins. The Seaman Reservoir Project by the City of Greeley on the North Fork of the Cache la Poudre River proposes to drain several thousand acre feet of water out of the North Fork and the main stem of the Cache la Poudre. And finally, the Flaming Gorge Pipeline would take up to 250,000 acre feet/year (81 billion gallons) out of the Green and Colorado Rivers systems, among others.
Other Water Sources
Unfortunately, not much more is known about sources and amounts of water for used for fracking or other oil and gas development operations. Such a data gap seems ridiculous considering the strain on freshwater sources in eastern Colorado and the Front Range, but regulators do not require operators to obtain permits or even report the sources of water they use. Legislative efforts to require such reporting were unsuccessful in 2012.
Now that development and fracking operations are continuously moving into urban and residential areas and neighborhoods, sourcing water will be as easy as going to the nearest fire hydrant. Allowing oil and gas operators to use municipal water sources raises concerns of conflicts of interest and governmental corruption considering public water systems are subsidized by local taxpayers, not well sites.
Conclusions
In Colorado, exploration and drilling for oil and natural gas continues to increase at a fast pace, while the increase in oil production is quite staggering. As this trend continues, the waste stream will continue to grow with production. This means more Class II injection wells and other treatment and disposal options will be necessary.
While other states are working to end the practices that have a track record of surface water and groundwater contamination, Colorado is issuing new permits. Colorado has issued 7 permits for CEPWMF’s in 2016 alone, some of them renewals. While there aren’t any eco-friendly methods of dealing with all the wastewater, the use of pits and land application presents high risk for shallow groundwater aquifers. In addition, sacrificing deep groundwater aquifers with aquifer exemptions is not a sustainable solution. These are important considerations beyond the obvious contribution of carbon dioxide and methane to the issue of climate change when considering the many reasons why hydrocarbon fuels need to be eliminated in favor of clean energy alternatives.
By Kyle Ferrar, Western Program Coordinator & Kirk Jalbert, Manager of Community Based Research & Engagement, FracTracker Alliance
Cover photo by COGCC
https://www.fractracker.org/a5ej20sjfwe/wp-content/uploads/2016/09/Chevronwastewaterpit_Coverphoto.jpg400900Kyle Ferrar, MPHhttps://www.fractracker.org/a5ej20sjfwe/wp-content/uploads/2025/09/2025-Wordmark-Logo.pngKyle Ferrar, MPH2016-09-20 09:01:182021-04-15 15:04:27Groundwater Threats in Colorado
Mariner East 2 (ME 2) is a $2.5 billion, 350 mile-long pipeline that, if built, would be one of the largest pipeline construction projects in Pennsylvania’s history—carving a fifty-foot wide path through 17 counties. A project of Sunoco Logistics, ME 2 would have the capacity to transport 275,000 barrels a day of propane, ethane, butane, and other hydrocarbons from the shale fields of Western Pennsylvania and neighboring states to an international export terminal in Marcus Hook, located on the Delaware River.
ME 2 has sparked a range of responses from residents in Pennsylvania, however, including concerns about recent pipeline accidents, the ethics of taking land by eminent domain, and the unknown risks to sensitive ecosystems. Below we explore the watersheds that could be impacted by this proposed pipeline.
Watershed Impacts
While some components of Sunoco’s ME 2 proposal are approved, the project requires more permits from the Pennsylvania Department of Environmental Protection (DEP) before construction can begin. Among those are permits to build through and under stream and wetlands. Many of the waters threatened by ME 2 are designated by the Commonwealth as “exceptional value” (EV) or “high quality” (HQ) and are supposed to be given greater protections from harm. Water Obstruction and Encroachment Permits, also known as “Chapter 105” permits, are required for any building activities that would disrupt any body of water, including wetlands and streams. Sunoco applied for these so-called “Chapter 105” permits in the summer of 2015, but its applications were rejected as incomplete several times.
The below map shows the ME 2 route as of May 2016 relative to the watersheds and streams it will cross. Zoom into the map to see additional layers. Note that this is the most accurate representations of ME 2’s route we have seen to date. MWA provided the shapefiles for ME 2’s route to FracTracker Alliance and continues its investigations into potential watershed impacts.
In total, ME 2’s path will include 1,227 stream crossings, 570 wetland crossings, and 11 pond crossings. Of the 1,227 stream crossings, 19 are EV and 318 are HQ, meaning that 337 crossings will disturb what DEP refers to as “special protection” waters. In addition, there are 129 exceptional value wetlands being crossed. These numbers were compiled by Mountain Watershed Association (MWA) from Sunoco’s permitting applications. MWA also identified 2 HQ streams in Washington County, and 3 HQ streams in Blair County, that are proposed to be crossed that are not acknowledged as being HQ in Sunoco’s permits.
Public Comment Period Open
People living along the proposed route are sometimes in the best position to see what the route looks like from the ground, where wetlands and streams are, and what kinds of wetlands and streams they are. The DEP is accepting public comments on Sunoco’s ME 2 Ch. 105 permit application through Wednesday, August 24. Each DEP regional office receives separate Ch. 105 applications depending on where the pipeline routes through different counties. Those wishing to comment on the project can do so through the DEP regional office websites: DEP Southwest Region, DEP South-central Region, DEP Southeast Region. For guidance on how to write comments on permits, see MWA’s Pipeline Project Information & Talking Points.
Written by Kirk Jalbert, PhD, MFA – Manager of Community-Based Research & Engagement, FracTracker Alliance
https://www.fractracker.org/a5ej20sjfwe/wp-content/uploads/2016/08/Mariner-East-2-Feature.jpg400900FracTracker Alliancehttps://www.fractracker.org/a5ej20sjfwe/wp-content/uploads/2025/09/2025-Wordmark-Logo.pngFracTracker Alliance2016-08-23 09:55:022020-03-12 17:14:44Mariner East 2 and Watershed Risks
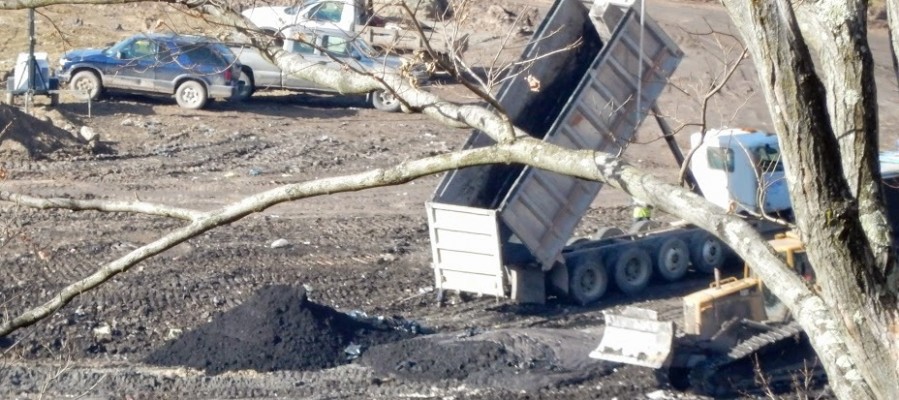
By Ted Auch, PhD – Great Lakes Program Coordinator
Hydraulic Fracturing “Fracking” at a well-pad outside Barnesville, Ohio operated by Halliburton
The industrial practice of disposing of oil and gas drilling waste into Class II injection wells causes a lot of strife for people on both sides of the fracking debate. This process has exposed many “hidden [geologic] faults” across the US as a result of induced seismicity. It has been linked in recent months and years with increases in earthquake activity in states like Arkansas, Kansas, Texas, and Ohio.
Locally, there is growing evidence in counties – from Ashtabula to Washington – that Ohio Class II injection well volumes and quarterly rates of change are related to upticks in seismic activity (Figs. 1-3). But exactly how much waste are these sites receiving, and where is it coming from? Since it has been a little over a year since last we looked at the injection well landscape here in Ohio, we decided to revisit the issue here.
Figures 1-3. Ohio Class II Injection Well disposal during Q3-2010, Q2-2012, and Q2-2015
The Class II Landscape in Ohio
In Ohio 245+ Class II Salt Water Disposal (SWD) Disposal Wells are permitted to accept unconventional oil and gas waste. Their disposal capacity and number of wells served is by far the most of any state across the Marcellus and Utica Shale plays.
Ohio’s Class II Injection wells have accepted an average of 22,750 barrels per quarter per well (BPQPW) (662,632 gallons) of oil and gas wastewater over the last year. In comparison, our last analysis uncovered a higher quarterly average (29,571 BPQPW) between the initiation of frack waste injection in 2010 and Q2-2015 (Fig. 4). This shift is likely due to the significant decrease in overall drilling activity from 2012 to 2015. Between Q3-2010 and Q1-2016, however, OH’s Class II injection wells saw an exponential increase in injection activity. In total, 109.4 million barrels (3.8-4.6 billion gallons) of waste was disposed in Ohio. From a financial perspective this waste has generated $3.4 million in revenue for the state or 00.014% of the average state budget (Note: 2.5% of ODNR’s annual budget).
The more important point is that even in slow times (i.e., Q2-2015 to the present) the trend continues to migrate from the bottom-left to the top-right, with each of Ohio’s Class II injection wells seeing quarterly demand increases of 972 BPQPW (34,017-40,821 gallons). This means that the total volume coming into our Class II Wells is increasing at a rate of 8.2-9.8 MGs per year, or the equivalent to the water demand of several high volume hydraulically fractured wells.
With respect to the source of this waste, the story isn’t as clear as we had once thought. Slightly more than half the waste came from out-of-state during the first two years for which we have data, but this statistic plummeted to as low as 32% in the last year-to-date (Fig. 5). This change is likely do to the high levels of brine being produced in Ohio as the industry migrates towards the perimeter of the Utica Shale.
Figures 4 and 5
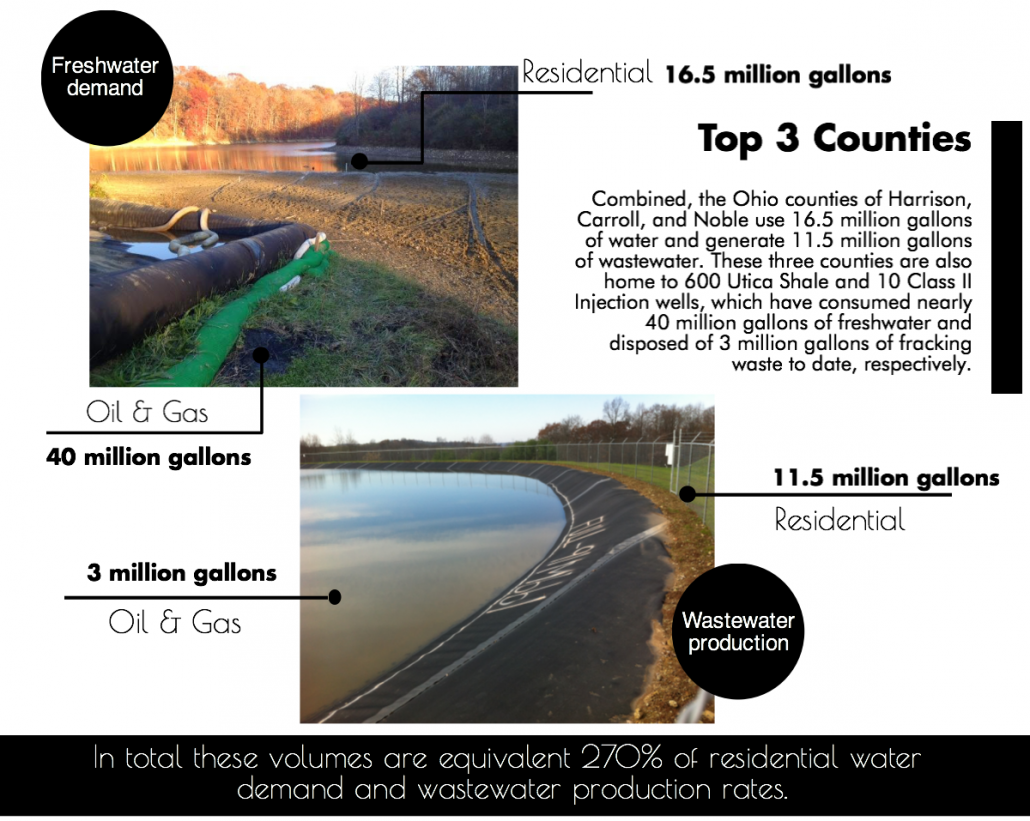
Freshwater Demand and Brine Production
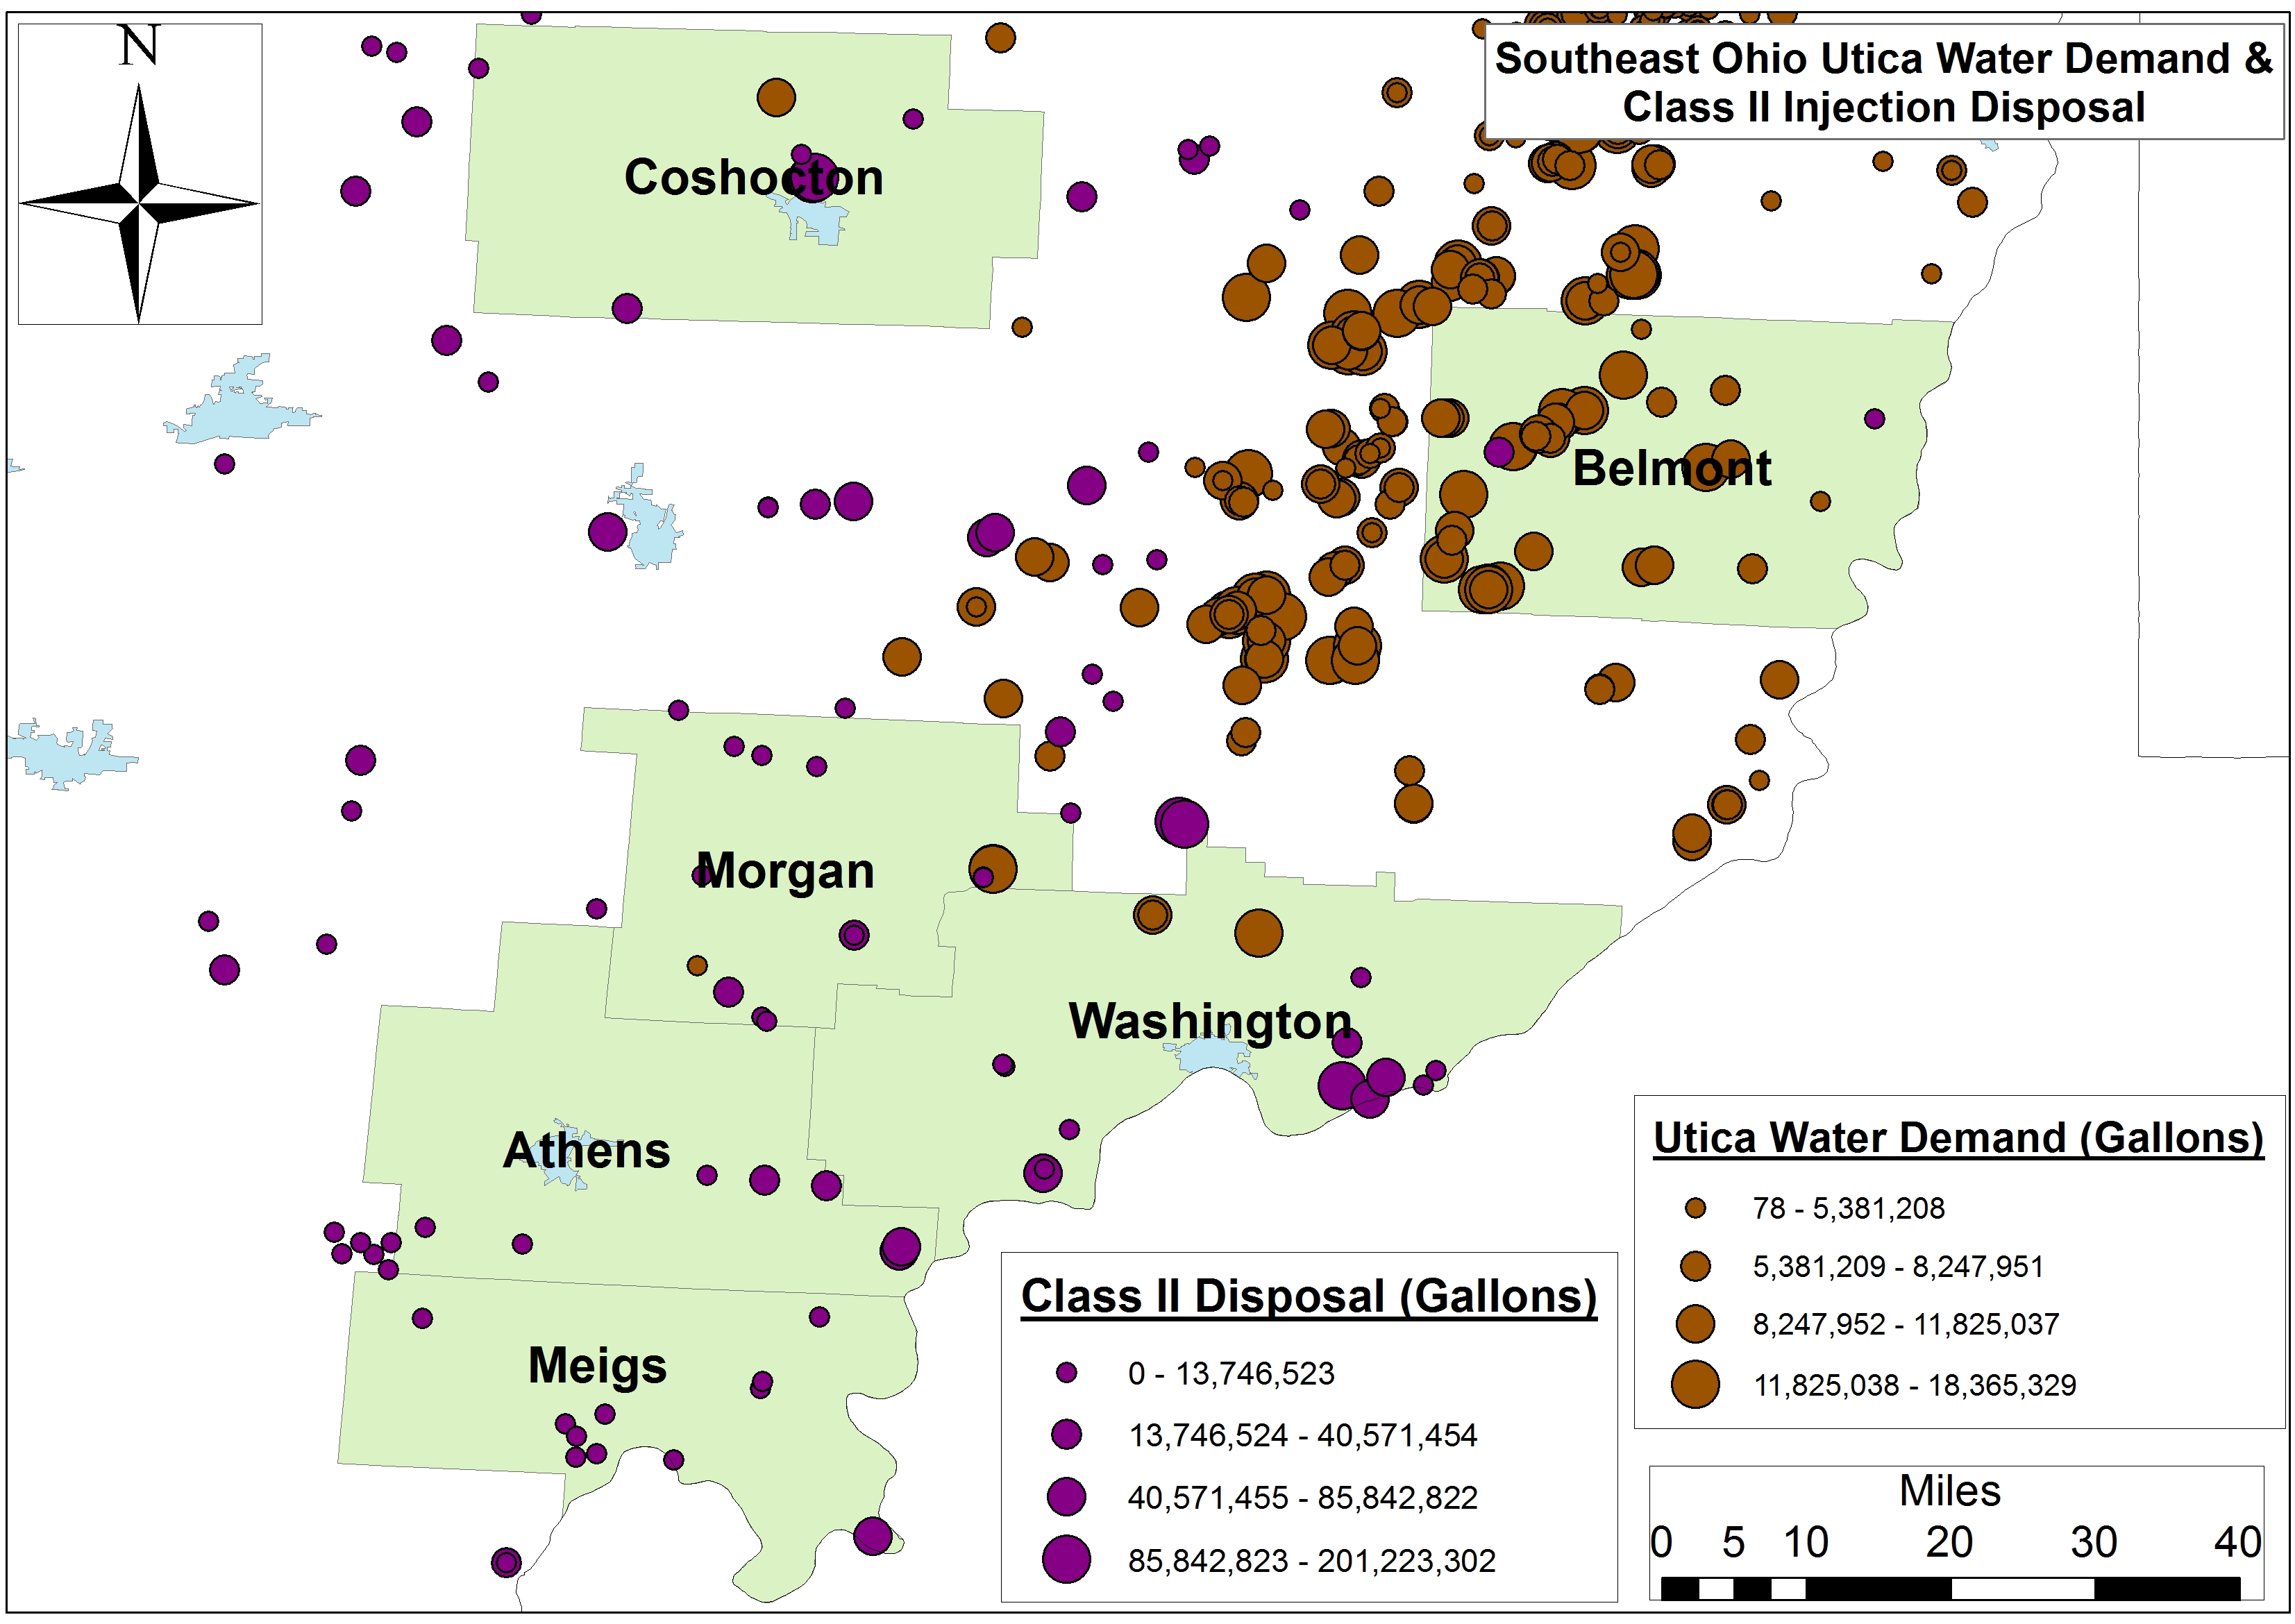
Map of Ohio Utica Brine Production and Class II Injection Well Disposal
Figure 6. Ohio Class II Injection Well disposal as a function of freshwater demand by the shale industry in Ohio between Q3-2010 and Q1-2015
To gain a more comprehensive understanding of what’s going on with Class II wastewater disposal in Ohio, it’s important to look into the relationship between brine and freshwater demand by the hydraulic fracturing industry. The average freshwater demand during the fracking process, accounts for 87% of the trend in brine disposal in Ohio (Fig. 6).
As we mentioned, demand for freshwater is growing to the tune of 405-410,000 gallons PQPW in Ohio, which means brine production is growing by roughly 12,000 gallons PQPW. This says nothing for the 450,000 gallons of freshwater PQPW increase in West Virginia and their likely demand for injection sites that can accommodate their 13,500 gallons PQPW increase.
Conclusion
Essentially, the seismic center of Ohio has migrated eastward in recent years; originally it was focused on Western counties like Shelby, Logan, Auglaize, Darke, and Miami on the Indiana border, but it has recently moved to injection well hotbed counties like Ashtabula, Trumbull, and Washington along the Pennsylvania and West Virginia borders. This growth in “induced seismicity” resulting from the uptick in frack waste disposal puts Ohio in the company of Oklahoma, Arkansas, Colorado, Kansas, New Mexico, and Texas. Each of those states have reported ≥4.0 magnitude “man-made” quakes since 2008. Between 1973 and 2008 an average of 21 earthquakes of ≥M3 were reported in the Central/Eastern US. This number jumped to 99 between 2009 and 2013, with 659 of M3+ in 2014 alone according to the USGS and Virginia Tech Seismological Observatory (VTSO). This “hockey stick moment” is exemplified in the below figure from a recent USGS publication (Fig. 7). Figure 8 illustrates the spatial relationship between recent seismic activity and Class II Injection well volumes here in Ohio. The USGS even went so far as to declare the following:
An unprecedented increase in earthquakes in the U.S. mid-continent began in 2009. Many of these earthquakes have been documented as induced by wastewater injection…We find that the entire increase in earthquake rate is associated with fluid injection wells. High-rate injection wells (>300,000 barrels per month) are much more likely to be associated with earthquakes than lower-rate wells.
– From USGS Report High-rate injection is associated with the increase in U.S. mid-continent seismicity
Figures 7 and 8
The sentiment here in Ohio regarding Class II Injection wells is best summed up by Dr. Ray Beiersdorfer, Distinguished Professor of Geology, Youngstown State University and his wife geologist Susie Beiersdorfer who jointly submitted the following quote regarding the North Star (SWIW #10) Class II Injection Well in Mahoning County, which processed 555,030 barrels (21,368,655 gallons) of fracking waste between Q4-2010 and Q4-2011[1].
The operator, D&L, and the ODNR denied the correlation in space and time between the injection of toxic fracking fluids into the well and earthquakes for over eight months in 2011. The well was shut down on December 30 and the largest seismic event, a 4.0 happened at 3:04 p.m. on December 31, 2011. Though the rules say that a “shut-in” well must be plugged after 60 days, this well is still “open” after 1656 days (July 12, 2016). This well must be plugged [and abandoned] to prevent further risks to the health and safety of the Youngstown community… According to Rick Simmers, the only thing holding this up is bankruptcy procedures. It was drilled into a fault, triggered over five hundred earthquakes, including a Magnitude 4.0 that caused damage to homes. [It is likely] that any other use of this well would trigger additional hazardous earthquakes.
Images From Across Ohio
Click on the images below to explore visual documentation and volumes disposed (as of Q1-2016) into Class II Injection wells in Ohio.
https://www.fractracker.org/a5ej20sjfwe/wp-content/uploads/2016/07/ClassIIOhio-Feature.jpg400900Ted Auch, PhDhttps://www.fractracker.org/a5ej20sjfwe/wp-content/uploads/2025/09/2025-Wordmark-Logo.pngTed Auch, PhD2016-07-15 14:03:162020-03-12 17:19:05OH Class II Injection Wells – Waste Disposal Trends and Images From Around Ohio
By Sierra Shamer, Visiting Scholar, FracTracker Alliance
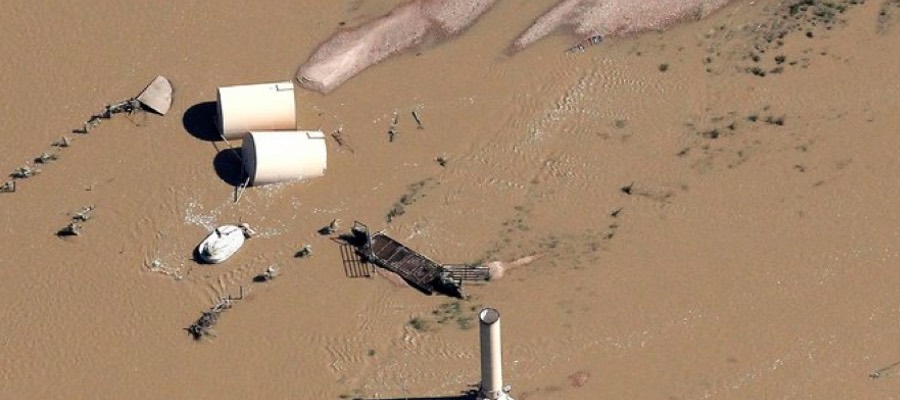
Historic 2013 flooding in the Colorado Front Range damaged homes, bridges, roads, and other infrastructure — including hundreds of oil and gas facilities. Companies shut down wells and scrambled to contain spills in their attempts to prevent extensive water contamination. Colorado has since adopted new regulations that require oil and gas companies to identify and secure all infrastructures located within floodplains. However, FEMA’s Flood Hazard maps, which the state uses to calculate flood risk, are largely incomplete, leaving only the industry accountable for reporting facilities that may be at risk in future flooding events. This article highlights the unknown flood contamination risk threatening the Front Range by oil and gas, and the featured map identifies known floodplain infrastructure.
Front Range Realities
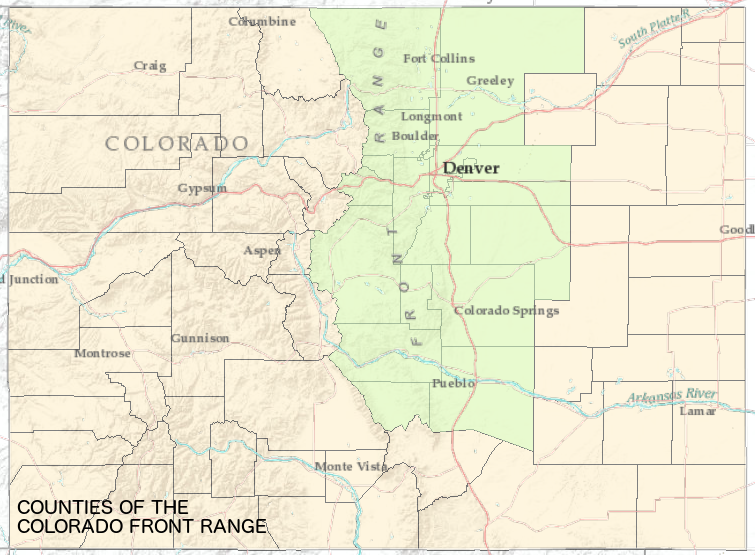
Counties of the Colorado Front Range
The Colorado Front Range is the most populated region of the state, covering 17 counties and 7 cities including Boulder, Denver, and Colorado Springs. This region has experienced devastating flash flooding events throughout history, most notably the Big Thompson flood of 1976, which dumped 12-14 inches of rain along the Front Range in only 4-6 hours. The 2013 Colorado Front Range Flood brought almost 15 inches to the region, 9 of which falling within a period of 24 hours. A state of emergency was declared in the region and recovery projects continue to this day.
The Front Range region is not only one of the most populated in Colorado, it is also home to 40% of Colorado’s oil and gas wells. Oil and gas development occurs so rapidly that data reports on pending permits, active permits, and well locations are updated daily by the Colorado Oil and Gas Conservation Commission (COGCC). The damage to oil and gas facilities due to the 2013 floods prompted the COGCC to adopt Rule 603.h, requiring companies to identify proposed and current infrastructure within the floodplain and to create flood mitigation and response plans. On April 1st of this year, all companies with existing infrastructure must comply with Rule 603.h. With over 109,000 wells in the state, an incomplete FEMA database, and only 22 field inspectors, the COGCC has limited capacity to ensure these reports identify all infrastructure within the floodplain.
FEMA Floodplain Gaps
The Federal Emergency Management Agency (FEMA) maintains a national map of the 100-year floodplain for insurance determinations that are in the process of being digitized. These maps show the extent of flooding expected from rain events with a 1% chance of occurring in any given year. They are determined by a combination of topography, satellite imagery, and maps from local jurisdictions. However, in many portions of the western US, these mapped areas are incomplete, including large regions of Colorado. FEMA maps are also the primary floodplain data source used by industry and the by the COGCC. The map below shows the oil and gas infrastructure that is located within the known digital 100-year floodplain as of early February 2016. This map underrepresents the actual number of facilities within the floodplains due to incomplete FEMA data, but provides a clear visual of a widespread problem.
Although FEMA is routinely working to update their dataset, large regions with widespread extraction remain digitally unmapped. While there is accessible floodplain info for the companies to use to determine their status and for the COGCC to verify what the industry reports, the incomplete digitized FEMA data means there is no accessible or efficient way for the COGCC to know if there is infrastructure within a floodplain that hasn’t been reported. This means that more is at risk here than we can calculate. Weld County, a Front Range county and recipient of severe flooding in 2013, starkly exemplifies this reality. In the aftermath of the 2013 flood, Weld County became a disaster zone when 1,900 oil and gas wells were shut down, submerged completely by the rushing water, as thousands of gallons of oil drained out. Until January 2016, Weld County lacked digitally mapped floodplains, and currently only 16% of the river and stream network is available.
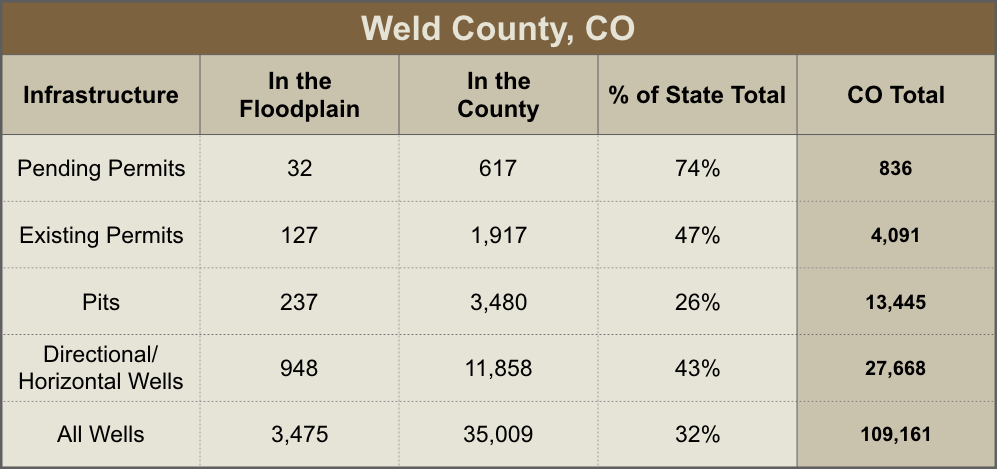
The table below lists the percentages of oil and gas infrastructure that exist in Weld County alone that can be calculated using this limited dataset. As of February of this year, 3,475 wells of 35,009 are within the known floodplain in Weld County. Of greater concern, 74% of pending permits statewide are in Weld County – 5% of those in the known floodplain – indicating either an underestimation of flood risk, a blatant disregard of it, or both.
Flooding in the Future
According to the CO Climate Change Vulnerability Study, the state expects a 2.5–5 degree Fahrenheit annual temperature increase by 2050. While this increase is likely to cause earlier spring runoff, more rain at lower elevations, and higher evaporation rates, it is unclear if annual precipitation will increase or decrease with rising temperatures. This uncertainty makes it difficult to know if increased flood risk is in the future. Current flood risk, however, is a known threat. The CO Department of Public Safety’s Flood Hazard Mitigation Plan calculates, based on historical events, that Colorado experiences a flood disaster once every five years. This means that each year, there is a 20% chance a major flood will occur. With incomplete data, limited oversight, and uncertain future trends, oil and gas flood contamination risk is incalculable – and on the Front Range, the majority of Colorado’s population, extractive industry, and environment are in danger.
Dealing with the Unknown
The unknown risks of climate change and known risks of historical flood trends emphasize that identifying oil and gas infrastructure in floodplains must be a high priority for the COGCC. These realities also put into question whether or not future infrastructures should be permitted within floodplains at all. In April, floodplain infrastructure will be identified by the industry and when these data are made available, a more accurate analysis of risk will me made.
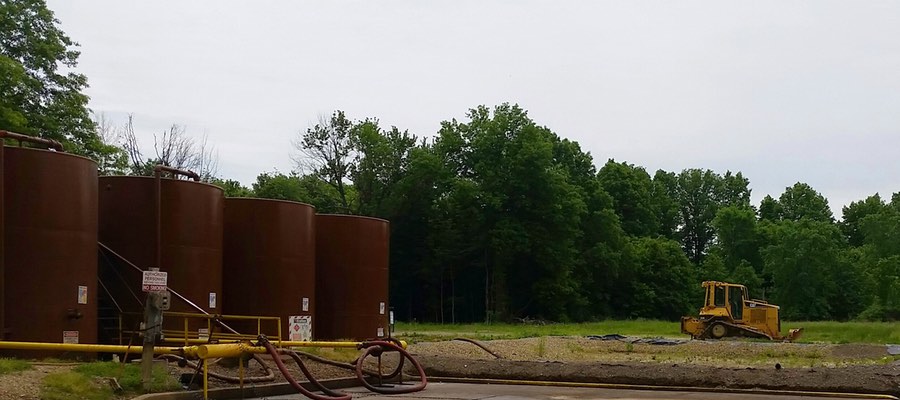
Feature photo shows a flooded well and toppled oil storage tanks in Weld County, Colorado 2013 – by Rick Wilking/Reuters.
https://www.fractracker.org/a5ej20sjfwe/wp-content/uploads/2016/03/COFlood-Feature.jpg400900FracTracker Alliancehttps://www.fractracker.org/a5ej20sjfwe/wp-content/uploads/2025/09/2025-Wordmark-Logo.pngFracTracker Alliance2016-03-17 15:28:302020-03-11 17:09:25Oil and Gas Flood Contamination Risk Incalculable on CO Front Range
FracTracker Alliance worked with Public Herald this spring to update and map oil and gas complaints filed by citizens to the Pennsylvania Department of Environmental Protection (PA DEP) as of March 2015. The result is the largest release of oil and gas records on water contamination due to fracking in PA. Additionally, Public Herald’s investigation revealed evidence of Pennsylvania state officials keeping water contamination related to fracking “off the books.”
The mission of Public Herald, an investigative news non-profit formed in 2011, is two-fold: truth + creativity. Their work uses investigative journalism and art to empower readers and hold accountable those who put the public at risk. For this project, Public Herald aims to improve the public’s access to oil and gas information in PA by way of file reviews and data digitization. Public Herald maintains an open source website called #fileroom, where people can access a variety of digital information originally housed on paper within the PA DEP. This information is collected and synthesized with the help of donors, journalists and researchers in a collective effort with the community. To date, these generous volunteers have already donated more than 2,000 hours of their time collecting records.
The site includes complaints, permits, waste, legal cases, and gas migration investigations (GMI) conducted by the PA DEP. Additionally, there is a guide on how to conduct file reviews and how to access information through the “Right-to-Know” law at the PA DEP. They have broken down complaints and permits by county; wastes and GMI categories by cases, all of which include test results from inspections; and correspondence and weekly reports.
Some partners and contributors to the file team include Joshua Pribanic as the co-founder and Editor-in Chief, Melissa Troutman as co-founder and Executive Director, John Nicholson, who collects and researches for several databases, Nadia Steinzor as a contributor through Earthworks, and many more. Members of FracTracker working on this project include Matt Kelso, Samantha Rubright, and Kirk Jalbert.
#fileroom’s update expands the number of complaint data records collected to 18 counties – and counting!
While I must commend the State for looking into this important issue, much more needs to be done, and I have serious concerns about the validity of several aspects of this study. Since the report is almost 200 pages long, I will summarize its findings and my critiques below.
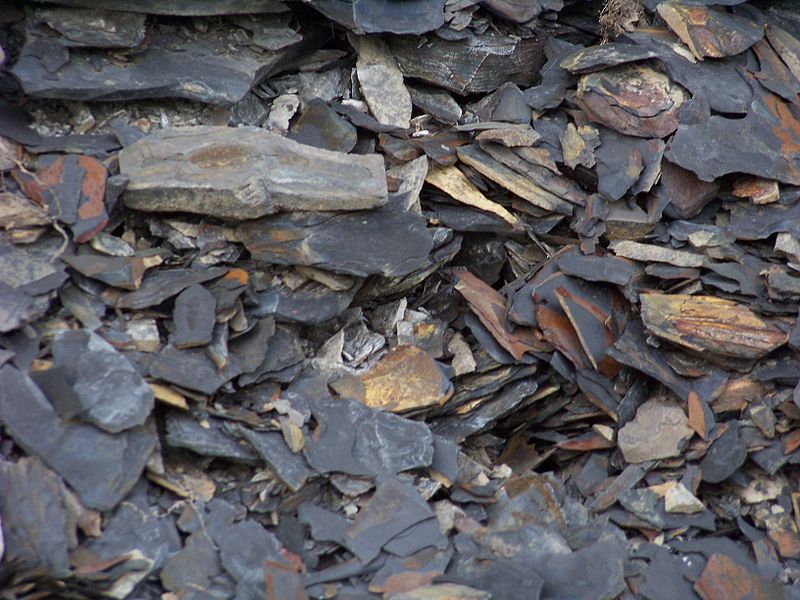
Marcellus shale cuttings are radioactive: pgs. 17, 139, 142, 154
We do not know if there is a long term problem: pg. 19
About 30 million tons of waste in next few decades: pg. 176
Landfill liners leak: pg. 20
Owning & operating their own landfill would be expensive & risky for gas companies: pgs. 186-7
Toxicity and biotic risk from drill cuttings is uncharted territory: pg. 78
Landfill leachate is toxic to plants & invertebrates: pgs. 16, 95, 97
Other landfills also have radioactive waste: pgs. 14-15
We have no idea if this will get worse: pgs. 96, 154
If all systems at landfills work as designed, leachate might not affect ground water: pg. 41
Introduction
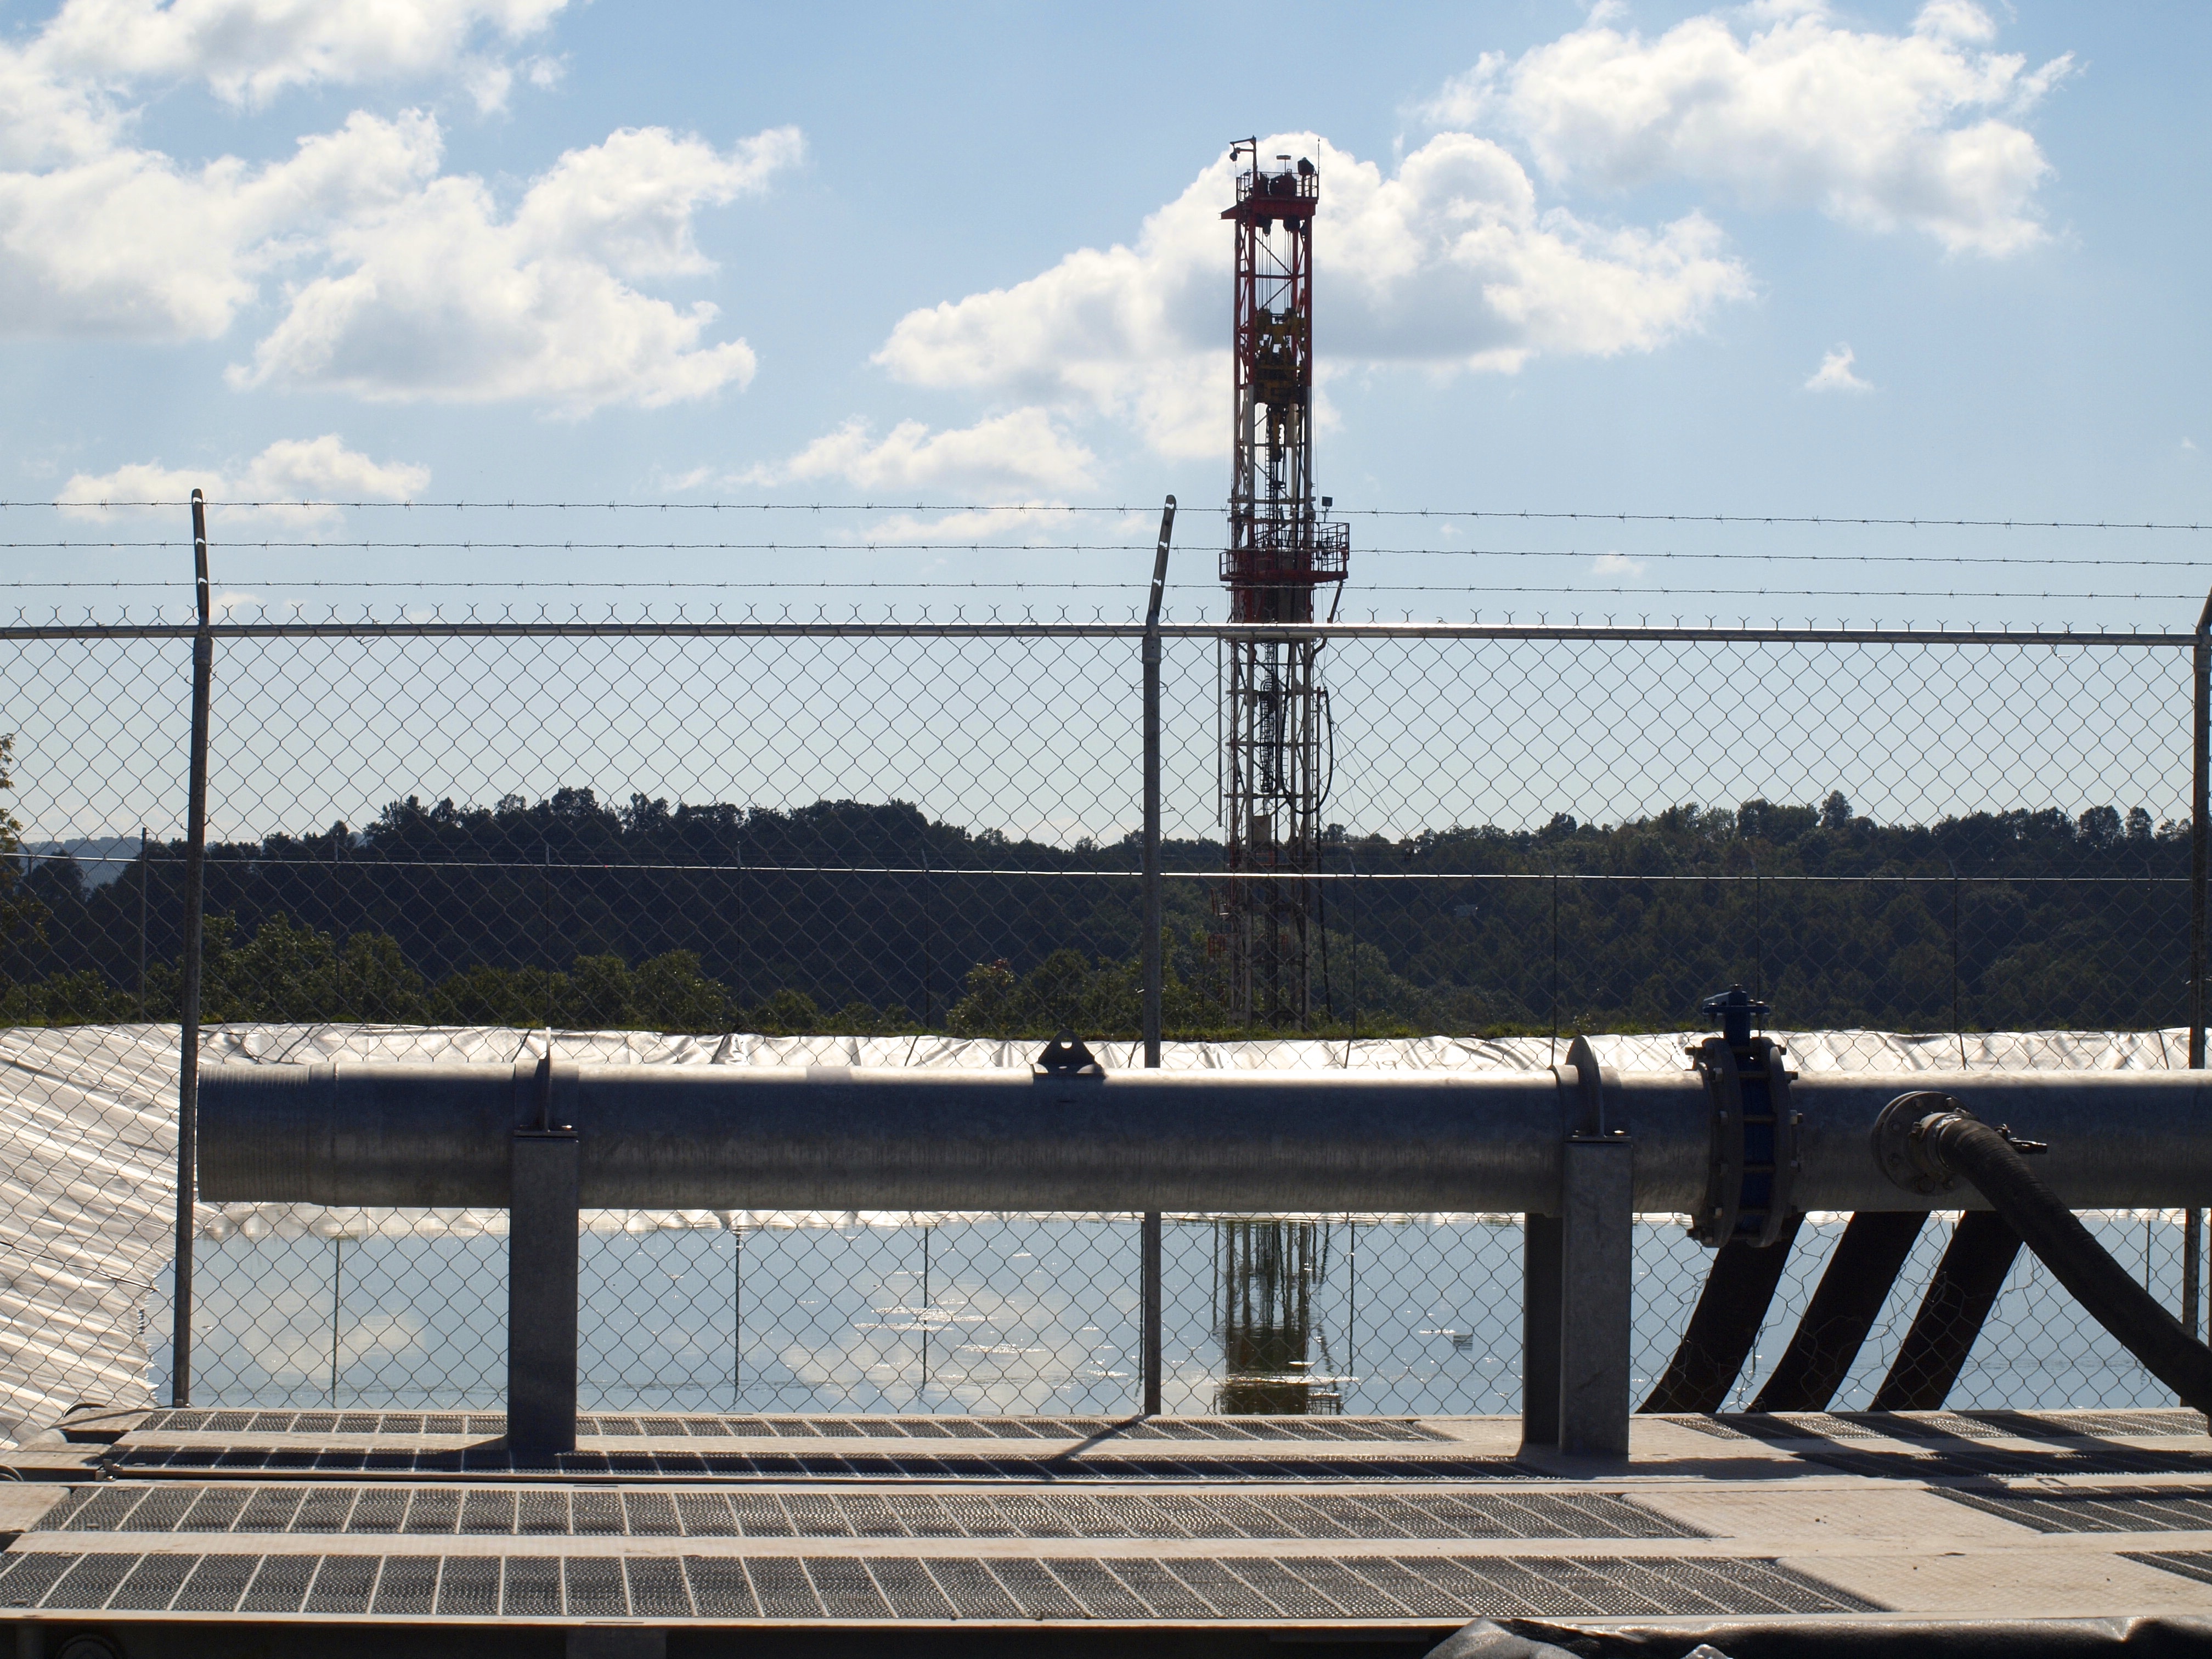
Drilling rig behind a wastewater pond in West Virginia
Any formal report comprised of 195 pages generated by a reputable school like Marshall University with additional input from Glenville State College – supported by over 2,300 pages of semi-raw data and graphs and charts and tables – requires some serious investigation prior to making comprehensive and final conclusions. However, some initial observations are needed to provide independent perspective and to help reflect on how sections of this report might be interpreted.
The overarching perspective that must be kept in mind is that the complete study was first limited by exactly what the legislature told the WV Department of Environmental Protection DEP to do. Secondly, the DEP then added other research guidelines and determined exactly what needed to be in the study and what did not belong. There were also budget and time constraints. The most constricting factor was the large body of existing data possessed by the DEP that was provided to the researchers and report writers. Because of the time restrictions, only a small amount of additional raw data could be added.
And most importantly, similar to the WVU Water Research Institute (WVU WRI) report from two years ago, it must be kept in mind that these types of studies, initiated by those elected to our well-lobbied legislature and funded and overseen by a state agency, do not occur in a political power vacuum. It was surely anticipated that the completed report might have the ability to affect the growing natural gas industry – which is supported by most in the political administration. Therefore, we must be cautious here. The presence and influence of political and economic factors need to be considered. Also, for universities to receive research contracts and government paid study requests, the focus must include keeping the customer satisfied.
My comments below on the report’s methods and findings are organized into three broad and overlapping categories:
GOOD – positive aspects, good suggestions, important observations
GENERAL – general comments
FLAW – problems, flaws, limitations
MOVING FORWARD – my suggestions & recommendations
I. Water Quality: EPA Test Protocols & Datasets
Marcellus Shale (at the surface)
GENERAL It is obvious that a very smart and well-trained set of researchers put a lot of long, detailed thought into analyzing all of the available data. There must be tens of thousands of data points. Meticulous attention was put into how to assemble all of the existing years’ worth of leachate chemical and radiological information.
GOOD There is an elaborate and detailed discussion of how to best analyze everything and how to utilize the best statistical methods and generate a uniform and integrated report. This was made difficult with non-uniform time intervals, some non-detect values, and some missing items. The researchers used a credible process, explaining how they applied the various appropriate statistical analysis methods to all the data. They provided some trends and observations and draw some conclusions.
FLAW 1 The most glaring flaw and the greatest limitation pertaining to the data sets is the nature of the very data set, which was provided to the researchers from the DEP. It is to the commendable credit of the DEP that the leachate at landfills receiving black shale drill cuttings from the Marcellus and other shale formations were, from the beginning, required to start bi-monthly testing of leachate samples at landfills that were burying drill waste products. And in general, when compared to on-site disposal as done for conventional wells, it was initially a good requirement to have the drill cuttings put into some type of landfill; that way we could keep track of where the drill cuttings are located when there are future problems.
To the best of my knowledge, until the states in the Marcellus region started allowing massive quantities of black shale waste material to be put into local landfills, we have never knowingly deposited large quantities of known radioactive industrial waste products into generic municipal waste landfills. The various waste products and drill cuttings of Marcellus black shales have been known for decades by geologists and radiochemists to be radioactive. We know better than to depose of hazardous radioactive waste in an improper way. Therefore, it is very understandable that we might not know how to best solve the problems of this particular waste product. This was and still is new territory.
FLAW 2 All of the years of leachate test samples were processed for radioactivity using what is called the clean drinking water test protocols, also referred to as the EPA 900 series. Three years ago, given the unfamiliarity of regulatory agencies with the uniqueness of this waste problem, we chose the wrong test protocol for assessing leachate samples. We speculated that the commonly used and familiar clean drinking water test procedure would work. So now we have a massive set of test results all derived from using the wrong test protocol for the radiologicals. Fortunately, all of the chemistry test results should still be reasonably useful and accurate.
At first, three years ago, this was understandable and possibly not an intentional error. Now it is widely known by hydrogeologists and radiochemists, however, that the plain EPA 900 series of test methods for determining the radioactivity of contaminated liquids do not work on liquids with high TDS — Total Dissolved Solids. Method 900.0 is designed for samples with low dissolved solid like finished drinking water supplies.
Despite this major and significant limitation, the effort by Marshall University still has some utility. For example, doing comparisons between and among the various landfills accepting drill waste might provide some interesting observations and correlations. It is clearly known now, however, that the protocols that were used for all samples from the start when testing for gross alpha, gross beta and radium-226 and radium-228 in leachate, can only result in very inaccurate, under-reported data. Therefore, it is not possible to draw any valid conclusions on several very important topics, including:
surface water quality,
potential ground water contamination,
exposure levels at landfills and public health implications,
and policy and regulations considerations.
Labs certified to test for radiological compounds and elements are very familiar with the 900 series of EPA test procedures. These protocols are intended to be used on clean drinking water. They are not intended to be used on “sludgy” waters or liquids contaminated with high dissolved solids like all the many liquid wastes from black shale operations like flowback and produced water and brines and leachate. The required lab process for sample size, preparation, and testing will guarantee that the results will be incorrect.
In no place in the final 195 page report have I seen any discussion of which EPA test protocol was used for the newer samples and why was it used. It has also not yet been seen in the 2,300+ pages of supportive statistical and analytical results, either. The fact that the wrong protocol was used three years ago is very understandable. However, this conventional EPA 900 series was still being used on the additional very recent (done in fall of 2014 and spring of 2015) samples that were included in the final report. The researchers, without any justification or discussion or explanations continued to use the wrong test protocol.
The clean drinking water procedures should have been used along with the 901.1M (gamma spec) process, for comparison. It is understandable for the new data to be consistent and comparable with the very large existing dataset that a case could be made for using the incorrect protocol and the proper one also. There should have been a detailed discussion of what and why any test method was being used, however. That discussion is usually one of the first topics investigated and explained in the Methods section. Having that type of discussion and justification seems to represent a basic science method and accepted research process – and that omission is a serious flaw.
MOVING FORWARD We all know that if we want to bake an appetizing and attractive cake we must use the correct measuring cups for the ingredients. If we want to take our child’s temperature we need an accurate thermometer. When our doctor helps us understand our blood test results, we all want to be confident the right test was used at the lab. The proper test instrument, recently calibrated and designed for the specific sample, is crucial to get useable test results from which conclusions can be drawn and policy enacted.
It seems that the best suggestion so far to test high TDS liquids similar to leachate would be to use what is referred to as Gamma-ray Spectrometry with a high purity germanium instrument with at least a 21-day hold period (30 days are better), while the sample is sealed then counted for at least 16 hours. Many of the old leachate test results indicate high uncertainties that might be attributed to short hold times and short counting times. This procedure is referred to as the 901.1 M (modified). If the sample is sealed, the sample will reach about 99% equilibrium after 30 days. Radon 222 (a gas) must not be allowed to escape.
The potential environmental impacts to water quality section of this report seems to demonstrate that if you do not want to find out something, there are always justifiable options to avoid some inconvenient facts. Given the very narrow scope as defined, some the Marshall University folks did not seem to have the option to stray into important scientific foundational assumptions and, for the most part, just had to work with the stale data sets given to them. All of which, as we have known for close to a year now, have used the wrong test protocol. Therefore we have incorrect results of limited value.
II. Marcellus is Radioactive
GOOD 1 Of course, geologists have known that the Marcellus Shale is radioactive for many decades, but also for decades there has been great reluctance by the natural gas exploration and production companies to acknowledge this fact to the public. And finally we now have a public report that clearly and unambiguously states that Marcellus shale is radioactive. Interestingly enough, it was not much more than a year ago that some on the WV House of Delegates Judiciary Committee, seemed to be echoing the industry’s intentional deception by declaring that:
…it was only dirt and rock…
So this report represents progress and provides a very valuable contribution to beginning to recognize some of the potential problems with shale wastes and their disposal challenges.
GOOD 2 Another very important advance is that finally after eight years of drilling here in Wetzel County, we now have a test sample from near the horizontal bore. The WVU WRI study researchers were never given access to any samples taken from the horizontal bore material itself, however. That was, of course, what they were supposed to have been allowed to do, but they were only given access to study material from the vertical section of the well bore. This report describes how we are getting closer to actually testing good samples of the black shale. It seems that we have gotten closer – but let’s see how close.
Page 11 describes that only three Antero wells in Doddridge County were chosen as the place to try to obtain samples from the horizontal bore. Considering that over 1,000 deviated/horizontal wells or wells with laterals have been drilled in the past few years, that number represents a very small fraction of wells drilled: less than .3%. Even if a high quality sample could have been obtained it might be a challenge to extrapolate test results to the waste being produced from the other wells in WV. These limitations are completely ignored in the report, however. Given the available documentation from the DEP, this seems to be a serious flaw that compromises the reliability of the entire report.
III. Samples From Vertical vs. Horizontal Well Bores
FLAW The actual samples tested from at least two of the three wells used in the study do not seem to be from the horizontal bore material. The sample from the third well might have come from the horizontal bore, but just barely. There is no way to know for sure. I will try to show this within the below chart using information provided by Antero to DEP Office of Oil & Gas. This information is in state records on Antero’s well plats, which become part of the well work application and also part of the final permit.
Table 1. Details about the samples taken from three Antero wells in Doddridge County, WV – and my concerns about the sampling process*
Antero well ID
API #
Sample’s drilling depth
Marcellus depth**
Horizontal bore length**
Comments / Issues
Morton 1H
47-017-06559
6,856 ft.
7,900 TVD***
10,600 ft.
~1,044 ft. short of reaching Marcellus formation
McGee 2H
47-017-06622
6,506 ft.
6,900 TVD
8,652 ft.
~394 ft. short of reaching Marcellus
Wentz1 H
47-017-06476
8,119 ft.
7,900 TVD
8,300 ft.
Just drilled into Marcellus by 219 ft.
* Original chart found on page 11 of report
** Based on information from Antero’s well plat
*** TVD = Total Vertical Depth
Antero is an active driller in Doddridge County. If any company knows where to find the Marcellus formation it is that company. Well plats are very detailed, technical documents provided to the DEP by the operator regarding the well location, watershed, and leased acres and property boundaries. We need to trust that the information on those plats is accurate and has been reviewed and approved by the permitting agency. Those plats also give the depth of the Marcellus and the length and heading of the lateral or horizontal bore. The Marshall University report gives the drilling depth when the sample was taken on the surface. Using these available well plat records from the DEP it appears that at two of the wells the sample (and its test results included in the report) came from material produced when the experienced drilling operator was not yet into the shale formation.
On the third well, Wentz 1H, the numbers seem to indicate that the sample was taken when the driller said that they were just barely within the shale layer – by 219 feet. Since the drill cuttings take some time to return to the surface from over 7,000 feet down, drilling just a few hundred feet would not at all guarantee that the returned cuttings were totally from the black shale. The processing of the drill cuttings at the shaker table and separator and centrifuge and the mixing in the tubs all cast some doubt on whether the sample, wherever it was taken from, was truly from the horizontal bore material.
On page 11 there is a clear and unambiguous statement:
Three representative sets of drill cuttings from the horizontal drilling activities within the Marcellus Shale formation were collected.
A successful attempt to get three such samples might have then allowed an appropriate waste characterization to be done as needed to accomplish the five required research topics listed in the report’s cover letter. Only an accurate chemical and radiological waste characterization would have allowed scientifically justifiable conclusions to be formulated and then allow for accurate legislation and regulations. It does not seem that West Virginia yet has the required scientific data upon which to confidently formulate laws and regulations to protect public health with regard to shale waste disposal.
Would it not seem prudent – if one wanted a good, representative sample – to make absolutely sure that the operator was, in fact, drilling in the black shale and that the cuttings returning to the surface were, in fact, from the Marcellus bore? That approach would have been eminently defensible and easily accomplished by just waiting for drilling to progress into the lateral bore far enough that the drill cuttings returning to the surface were in fact from the black shale. There might be plausible explanations for this apparent inconsistency or error. Of course, it might be speculated that the Antero-provided information on the well plats is incorrect and not intended to be accurate, or perhaps the driller is not really sure yet where the Marcellus layer starts. There may be many other possible scenarios of explanations. Time will tell.
IV. Research Observations Review
Landfill disposal of drill cuttings
GOOD There are a number of recommendations and suggestions in the study on landfills and leachate related conditions. It seems that a number of these proposals are very accurate and should be implemented. For example:
The report clearly restates that drill cuttings are known to contain radioactive compounds. Since all landfill liners will eventually leak, and since landfills already have ground water test wells for monitoring for potential ground water contamination due to leaking liners, then the well samples should be tested for radiological isotopes. Good idea. They are not required to do that now, but this recommendation should be implemented immediately (pgs. 17 and 21).
GOOD The report recommends that the Publicly Owned Treatment Works (POTW) or in the case of Wetzel County, the on-site wastewater treatment plants, should also test their effluent for radioactive isotopes. This is very important since there is no way to efficiently filter out many of the radioactive isotopes. Such contaminants will pass through traditional wastewater treatment plants.
It is also very useful that the report recommends that all the National Pollution Discharge Elimination System (NPDES) limits at the POTWs be reviewed and required to take into consideration the significantly more challenging chemical and radiological makeup of the shale waste products.
V. Economic Considerations on an Industry Supported Mono-Fill
The legislature asked that the DEP evaluate the feasibility of the natural gas industry to build, own, or operate its own landfill solely for the disposal of the known radioactive waste. This request seems to be a very reasonable approach, since for decades we have only put known radioactive waste products into dedicated landfills that are exclusively and specifically designed for the long term storage of the special waste material.
The discussion of the economic considerations is extremely complete and detailed. They are given in Appendix I and take into consideration a very thorough economic feasibility study of such a proposed endeavor. This section seems to have been compiled by a very talented professional team.
FLAW However, some of the basic assumptions are a bit askew. For example:
The initial Abstract of the financial analysis states that two new landfills would be needed because we do not want to have the well operators to drive any further than they do now. Interesting. This seems to be not too different than a homeowner while in search for privacy and quiet, builds a home far out into the country and then expects the public sewage lines to be extended miles to his new home so he would not have to incur the cost of a septic system. Homebuilders in rural settings should know they will have to incur expenses for their waste disposal needs. Should gas companies expect that communities to provide cheap waste disposal for them?
More than 15 pages later, the most important aspect is clearly stated that, “…the most salient benefit of establishing a separate landfill sited specifically to receive (radioactive) drill cuttings would be the preservation of existing disposal capacity of existing fills for future waste disposal”. Meaning for my (our) grandchildren. See page 175.
Comprehensive and sound financial details later explain that having the natural gas operators build, operate, and eventually close their own radioactive waste depository landfill would involve a lot of their capital and involve some risk to them. It is stated that their money would be better used drilling more wells. The conclusion then seems to be that, all around, it is simply cheaper and less risky for the gas industry to put all their waste products into our Municipal Waste Landfills, and later residents should incur the costs and risk to build another land fill for their household garbage when needed.
VI. Report Omissions
Within the report section dealing with the leachate test results, it is casually mentioned that not only do the landfills receiving shale waste materials have radioactive contaminated leachate, but the other tested landfills do, as well. However, rather than raising a very red flag and expressing concern over a problem that no one has looked into, the report implies we should not worry about any radioactive waste because it might be in all landfills (pg. 139).
Nowhere within the radiological discussion is there any mention of what might be called speciation of radioactive isotopes. The report does state that the test for both gross alpha and gross beta, are considered a “scanning procedure.” The speciation process is sort of a slice and dice procedure, showing exactly what isotopes are responsible for the activity that is being indicated. This process, however, does not seem to have been done on the landfill leachate test samples. The general scanning process cannot do that. Appendix H, pages 141-142, contains detailed facts on radiation dose, risk, and exposure. This might have been a good place to also discuss the proper EPA testing protocols, used or not used, and why.
A short discussion of the DEP-required landfill entrance radiation monitors is included on page 146. The installed monitors are the goalpost type. Trucks drive between them at the entrance and when they cross the scales. It seems that the report should have emphasized that that type of monitor will primarily only detect high-energy gamma radiation. However what is omitted on page 144 is that the primary form of decay for radium-226 is releasing alpha particles. The report is ambiguous in saying the decay products of radium-226 include both alpha particles and some gamma radiation, but radium-266 is not a strong gamma emitter. It is very unlikely that a normal steel enclosed roll-off box would ever trip the alarm setting with a load of drill cuttings. However those monitors are still useful since they will detect the high-energy gamma radiation from a truck carrying a lot of medical waste (pg. 17).
It is stated on page 144 that the greatest health risk due to the presence of radium-226 is the fact that its daughter product is radon-222. Radium-226 has a half-life of 1,600 years, compared to radon’s 3.8 days. This difference might seem to imply that radon is less of a concern. Given the multitude of radium-226 going into our landfills means that we will be producing radon for a very long time.
https://www.fractracker.org/a5ej20sjfwe/wp-content/uploads/2015/05/Drill-cuttings-at-landfill-3894-crop-e1432757459333.jpg400899FracTracker Alliancehttps://www.fractracker.org/a5ej20sjfwe/wp-content/uploads/2025/09/2025-Wordmark-Logo.pngFracTracker Alliance2015-08-18 09:06:432020-03-12 14:04:17Landfill Disposal of WV Oil and Gas Waste – A Report Review
Ohio waterways face headwinds in the form of hydraulic fracturing water demand and waste disposal
By Ted Auch, PhD – Great Lakes Program Coordinator, and Elliott Kurtz, GIS Intern and University of Michigan Graduate Student
In just 44 of its 88 counties, Ohio houses 1,134 wells – including those producing oil and natural gas and Class II injection wells into which the industry’s waste is disposed. Last month we wrote about Ohio’s disturbing fracking waste disposal trend and the disproportionate influence of neighboring states. (Prior to that Ariel Conn at Virginia Tech outlined the relationship between Class II Injection Wells and induced seismicity on FracTracker.) This time around, we are digging deeper into how water demand is related to Class II disposal trends.
Ohio’s Utica oil and gas wells are using 7 million gallons of freshwater – or 2.4-2.8 million more than the average well cited by the US EPA.1 Below we explore the inter-county differences of the water used in these oil and gas wells, and how demand compares to residential water demand and wastewater production.
Please refer to Table 1 at the end of this article regarding the following findings.
Utica Shale Freshwater Demand
Data indicate that there may be serious threats to Ohio’s water security on the horizon due to the oil and gas industry.
The counties of Guernsey and Monroe are next up with water demand and waste water generation at rates of 14.6 and 10.3 million gallons per year. However, the 11.4 million gallons of freshwater demand and fracking waste produced by these two counties 114 Utica and Class II wells still accounts for roughly 81% of residential water demand.
The wells within the six-county region including Meigs, Washington, Athens, and Belmont along the Ohio River use 73 million gallons of water and generate 51 million gallons of wastewater per year, while the hydraulic fracturing industry’s water-use footprint ranges between 48 and 17% of residential demand in Coshocton and Athens, respectively. Class II Injection well disposal accounts for a lion’s share of this footprint in all but Belmont County, with injection well activities equaling 77 to 100% of the industry’s water footprint (see Figure 1 for county locations and water stress).
Figure 1. Primary Southeast Ohio counties experiencing Utica Shale and Class II water stress
The next eight-county cohort is spread across the state from the border of Pennsylvania and the Ohio River to interior Appalachia and Central Ohio. Residential water demand there equals 428 million gallons, while the eight county’s 92 Utica and 90 Class II wells have accounted for 15 million gallons of water demand and disposal. Again the injection well component of the industry accounts for 5.8% of the their 7.7% footprint relative to residential demand. The range is nearly 10% in Vinton and 5.3% in Jefferson County.
The next cohort includes twelve counties that essentially surround Ohio’s Utica Shale region from Stark and Mahoning in the Northeast to Pickaway, Hocking, and Gallia along the southwestern perimeter of “the play.” These counties’ residents consume 405 million gallons of water and generate 329 million gallons of wastewater annually. Meanwhile the industry’s 69 Class II wells account for 53 million gallons – a 2.8% water footprint.
Finally, the 11 counties with the smallest Utica/Class II footprint are not suprisingly located along Lake Erie, as well as the Michigan and Indiana border, with water demand and wastewater production equalling nearly 117 billion gallons per year. Meanwhile the region’s 3 Utica and 18 Class II wells have utilized 59 million gallons. These figures equate to a water footprint of roughly 00.15%, more aligned with the 1% of total annual water use and consumption for the hydraulic fracturing industry cited by the US EPA this past June.
Future Concerns and Projections
Industry will see their share of the region’s hydrology increase in the coming months and years given that injection well volumes and Utica Shale demand is increasing by 1.04 million gallons and 405-410 million gallons per quarter per well, respectively. The number of people living in these 42 counties is declining by 0.6% per year, however, 1.4% in the 10 counties that have seen the highest percentage of their water resources allocated to Utica and Class II operations. Additionally, hydraulic fracturing permitting is increasing by 14% each year.2
Table 1. Residential, Utica Shale, and Class II Injection well water footprint across forty-two Ohio Counties (Note: All volumes are in millions of gallons)
2. Auch, W E, McClaugherty, C, Gallemore, C, Berghoff, D, Genshock, E, Kurtz, E, & Jurjus, R. (2015). Ramification of current and future production, resource utilization, and land-use change in the Ohio Utica Shale Basin. Paper presented at the National Environmental Monitoring Conference, Chicago, IL.
https://www.fractracker.org/a5ej20sjfwe/wp-content/uploads/2015/08/InjectionWells-Feature.jpg400900Ted Auch, PhDhttps://www.fractracker.org/a5ej20sjfwe/wp-content/uploads/2025/09/2025-Wordmark-Logo.pngTed Auch, PhD2015-08-11 10:42:442020-03-12 14:04:43Threats to Ohio’s Water Security
By Ted Auch, Great Lakes Program Coordinator, and Elliott Kurtz, GIS Intern
The Great Lakes may see a major increase in the number of sand mines developed in the name of fracking. What impacts has the area already seen, and does future development mean for the region’s ecosystem and land use?
Wisconsin’s 125+ silica sand mines and processing facilities are spread out across 15,739 square miles of the state’s West Central region, adjacent to the Minnesota border in the Northern Mississippi Valley. These mines have dramatically altered the landscape while generating proppant for the shale gas industry; approximately 2.5 million tons of sand are extracted per mine. The length of the average shale gas lateral well grows by > 50 feet per quarter, so we expect silica sand usage will grow from 5,500 tons to > 8,000 tons per lateral. To meet this increase in demand, additional mines are being proposed near the Great Lakes.
Migration of the sand industry from the Southwest to the Great Lakes in search of this silica sand has had a large impact on regional ecosystem productivity and watershed resilience[1]. The land in the Great Lakes region is more productive, from a soil and biomass perspective; much of the Southwest sandstone geology is dominated by scrublands that have accrue plant biomass at much slower rates, while the Great Lakes host productive forests and agricultural land. Great Lakes ecosystems produce 1.92 times more soil organic matter and 1.46 times more perennial biomass than Southwestern ecosystems.
Effects on the Great Lakes
Quantifying what the landscape looks like now will serve as a baseline for understanding how the silica sand industry will have altered the overall landscape, much like Appalachia is doing today in the aftermath of strip-mining and Mountaintop Removal Mining[2]. West Central Wisconsin (WCW) has a chance to learn from the admittedly short-cited and myopic mistakes of their brethren across the coalfields of Appalachia.
Herein we aim to present numbers speaking to the diversity and distribution of WCW’s “working landscape” across eight types of land-cover. We will then present numbers speaking to how the silica mining industry has altered the region to date and what these numbers mean for reclamation. The folks at UC Berkeley’s Department of Environmental Science, Policy , and Management describe “Working Landscapes” as follows:
a broad term that expresses the goal of fostering landscapes where production of market goods and ecosystem services is mutually reinforcing. It means working with people as partners to create landscapes and ecosystems that benefit humanity and the planet… A goal is finding management and policy synergies—practices and policies that enhance production of multiple ecosystem services as well as goods for the market…Collaborative management processes can help discover synergies and create better decisions and policy. Incentives can help private landowners support management that benefits society.
Methods
We used the 1993 WISCLAND satellite imagery to determine how WCW’s landscape is partitioned and then we applied these data to an updated inventory of silica sand mine boundaries to determine what existed within their boundaries prior to mining. The point locations of Wisconsin’s current inventory of silica sand mines was determined using the “Geocode Address” function in ArcMap 10.2 using the Composite_US Address Locator. Addresses were drawn from mine inventory information originally maintained by the West Central WI Regional Planning Commission (WCWRPC) and now managed by the WI Department of Natural Resources’ Mines, pits and quarries division. Meanwhile current mine extent boundary polygons were determined using one of three satellite data-sets:
Fig 1. Square mileage of various land cover types replaced by silica sand mining in WCW
Thirty-nine percent of the WCW landscape is currently allocated to forests, 43% to agriculture broadly speaking, and 13% is occupied by various types of wetlands. Open waters occupy 2.6% of the landscape with tertiary uses including barren lands (1.3%), golf courses (0.03%), high and low-density urban areas (0.9%), and miscellaneous shrublands (0.6%) (See Figure 1).
Effects by Land Cover Type
Fig 2. Forest Cover in WCW
Fig 3. Agricultural Cover
Fig 4. Open Water & Wetland Cover
Fig 5. Forested Wetland Cover
Fig 6. Lowland Shrub Wetlands
Fig 7. Miscellaneous Cover
Figure 2. The wood in these forests has a current stumpage value of $253-936 million and by way of photosynthesis accumulates 63 to 131 million tons of CO2 and has accumulated 4.8-9.8 billion tons of CO2 if we assumed that on average forests in this region are 65-85 years old. Putting a finer point on WCW forest cover and associated quantifiables is difficult because most of these tracts (2.7 million acres) fall within a catchall category called “Mixed Forest”. Pine (2.3% of the region), Aspen (4.7%), and Oak (3.8%) most of the remaining 1.2 million forested acres with much less sugar (Acer saccharum) and soft (Acer rubrum) maple acreage than we expected scattered in a horseshoe fashion across the Northeastern portion of the study area.
Figure 3. Seven different agricultural land-uses occupy 4.3 million WCW acres with forage crops and grasslands constituting 29% of the region followed by 1.4 million acres of row crops and miscellaneous agricultural activities. Additionally, 2% of WI’s 19,700 cranberry bog acres are within the study area generating $4.02 million worth of cranberries per year. The larger agricultural categories generate $3.2 billion worth of commodities.
Figure 4. Nearly 16% of WCW is characterized by open waters or various types of wetlands with a total area of 2,396 square miles clustered primarily in two Northeast and one Southeast segment. Open waters occupy 398 square miles with forested wetlands – possibly vernal pool-type systems – amounting to 5.4% of the region or 841 square miles. Lowland shrub and emergent/wet meadows occupy 540 and 618 square miles, respectively.
Figure 5. Of the nine types of wetlands present in this region the forested broad-leaved deciduous and emergent/wet meadow variety constitute the largest fraction of the region at 1,107 square miles (7.1% of region). Some percentage of the former would likely be defined by Wisconsin DNR as vernal pools, which do the following according to their Ephemeral Pond program. The WI DNR doesn’t include silica sand mining in its list of 14 threats to vernal pools or potential conservation actions, however.
These ponds are depressions with impeded drainage (usually in forest landscapes), that hold water for a period of time following snowmelt and spring rains but typically dry out by mid-summer…They flourish with productivity during their brief existence and provide critical breeding habitat for certain invertebrates, as well as for many amphibians such as wood frogs and salamanders. They also provide feeding, resting and breeding habitat for songbirds and a source of food for many mammals. Ephemeral ponds contribute in many ways to the biodiversity of a woodlot, forest stand and the larger landscape…they all broadly fit into a community context by the following attributes: their placement in woodlands, isolation, small size, hydrology, length of time they hold water, and composition of the biological community (lacking fish as permanent predators).
Figure 6. Broad-leaved evergreen lowland shrub wetlands constitute ≈2.1% of the region or 319 square miles with most occurring around the Legacy Boggs silica mines and several cranberry operations turned silica mines in Jackson County. Meanwhile broad-leaved deciduous and needle-leaved lowland shrub wetlands are largely outside the current extent of silica sand mining in the region occupying 1.9% of the region with 293 square miles spread out within the northeastern 1/5th of the study area.
Figure 7. Finally, miscellaneous land-covers include 200 square miles of barren land, 145 square miles of low/high intensity urban areas including the cities of Eau Claire (Pop. 67,545) and Stevens Point (Pop. 26,670) as well as towns like Marshfield, Wisconsin Rapids, Merrill, and Rib Mountain-Weston. WCW also hosts 3,204 acres (0.03% of region) worth of golf courses which amounts to roughly 21 courses assuming the average course is 157 acres. Shrublands broadly defined occur throughout 0.6% of the region scattered throughout the southeast corner and north-central sixth of the region, with the both amalgamations poised to experience significant replacement or alteration as they are adjacent to two large silica mine groupings.
Producing Mine Land-Use/Land-Cover Change
To date we have established the current extent of land-use/land-cover change associated with 25 producing silica mines occupying 12 square miles of WCW. These mines have displaced 3 square miles of forests and 7 square miles of agricultural land-cover. These forested tracts accumulated 31,446-64,610 tons of CO2 per year or 2.4-4.9 million tons over the average lifespan of a typical Wisconsin forest. These values equate to the emissions of 144,401-295,956 Wisconsinites or 2.5-5.1% of the state’s population. The annual wood that was once generated on these parcels would have had a market value of $126,097-197,084 per year. Meanwhile the above agricultural lands would be generating roughly $1.5-3.3 million in commodities if they had not been displaced.
However, putting aside measurable market valuations it turns out the most concerning result of this analysis is that these mines have displaces 871 acres of wetlands which equals 11% of all mined lands. This alteration includes 158 acres of formerly forested wetlands, 352 acres of lowland shrub wetlands, and 361 acres of emergent/wet meadows. As we mentioned previously, the chance that these wetlands will be reconstituted to support their original plant and animal assemblages is doubtful.
We know that the St. Peter Sandstone formation is the primary target of the silica sand industry with respect to providing proppant for the shale gas industry. We also know that this formation extend across seven states and approximately 8,884 square miles, with all 91 square miles overlain by wetlands in Wisconsin. To this end carbon-rich grasslands soils or Mollisols, which we discussed earlier, sit atop 36% of the St. Peter Sandstone and given that these soils are alread endangered from past agricultural practices as well as current O&G exploration this is just another example of how soils stand to be dramatically altered by the full extent of the North American Hydrocarbon Industrial Complex. The following IFs would undoubtedly have a dramatic effect on the ability of the ecosystems overlying the St. Peter Sandstone to capture and store CO2 to the extent that they are today not to mention dramatically alter the landscape’s ability to capture, store, and purify precipitation inputs.
IF silica sand mining continues at the rate it is on currently
IF reclamation continues to result in “very poor stand of grass with some woody plants of very poor quality and little value on the whole for wildlife. Some areas may be reclaimed as crop land, however it is our opinion that substantial inputs such as commercial fertilizer as well as irrigation will be required in most if not all cases in order to produce an average crop.”
IF the highly productive temperate forests described above are not reassembled on similar acreage to their extent prior to mining and reclamation is largely to the very poor stands of grass mentione above
For example: Great Lakes forests like the ones sitting atop the St. Peter Sandstone capture 20.9 tons of CO2 per acre per year Vs their likely grass/scrublands replacement which capture 10.6-12.8 tons of CO2 per acre per year… You do the math!
“None two sites are capable of supporting the growing of food. They grow trees and some cover grass, but that is all. General scientific research says that the reclaimed soils lose up to 75% of their agricultural productivity.”
Quote from a concerned citizen:
I often wonder what it was like before the boom, before fortunes were built on castles of sand and resultant moonscapes stretched as far as the eye could see. In the past few years alone, the nickname the “Silica Sand Capital of the World” has become a curse rather than a blessing for the citizens of LaSalle County, Illinois. Here, the frac sand industry continues to proliferate and threaten thewellbeing of our people and rural ecosystem.
The US Forest Service defined Watershed Resilience as “Over time, all watersheds experience a variety of disturbance events such as fires and floods [and mining]. Resilient watersheds have the ability to recover promptly from such events and even be renewed by them. Much as treating forests can make them more resilient to wildfire, watershed restoration projects can improve watershed resilience to both natural and human disturbances.”
https://www.fractracker.org/a5ej20sjfwe/wp-content/uploads/2015/07/SandMine-WI-Feature.jpg400900Ted Auch, PhDhttps://www.fractracker.org/a5ej20sjfwe/wp-content/uploads/2025/09/2025-Wordmark-Logo.pngTed Auch, PhD2015-07-16 14:24:562020-03-12 14:05:24West Central Wisconsin’s Landscape and What Silica Sand Mining Has Done to It
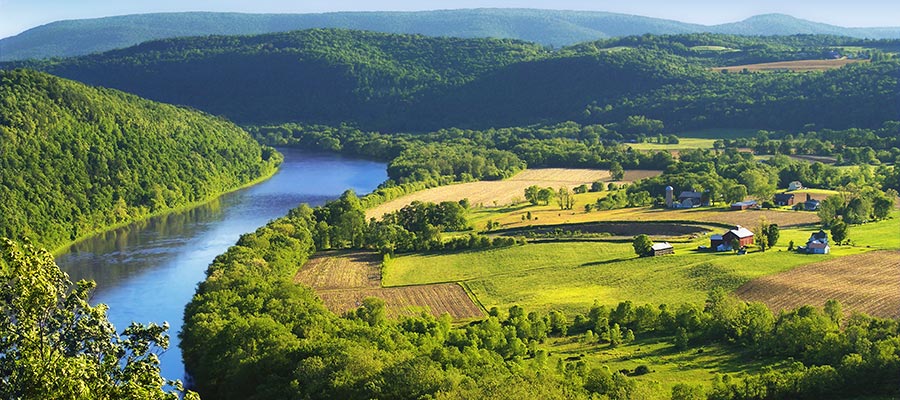


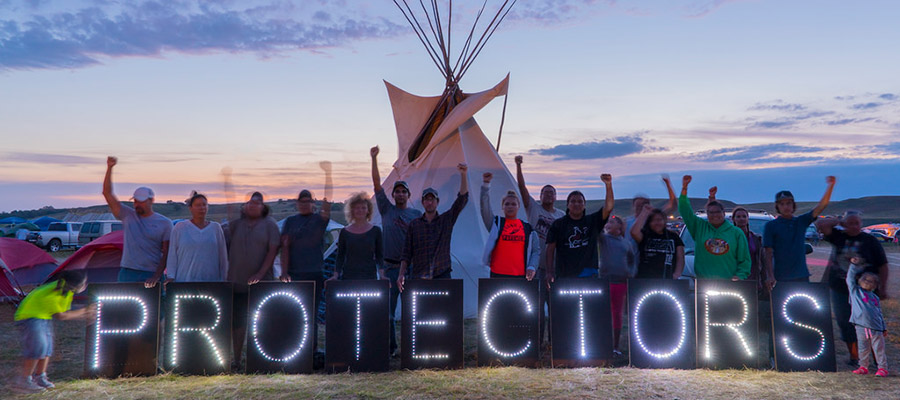
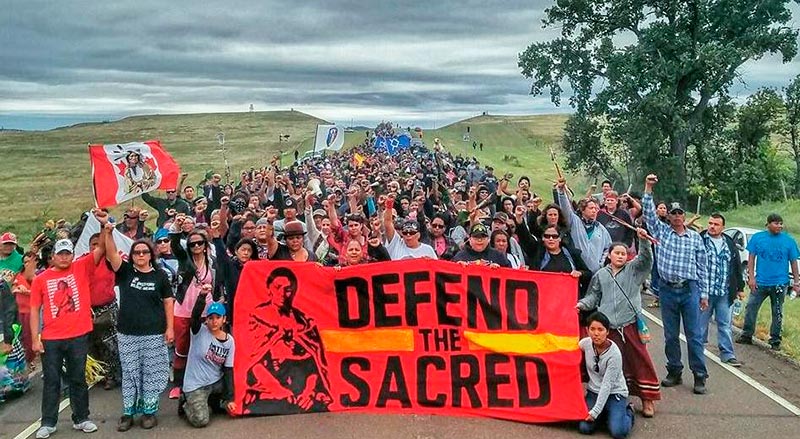
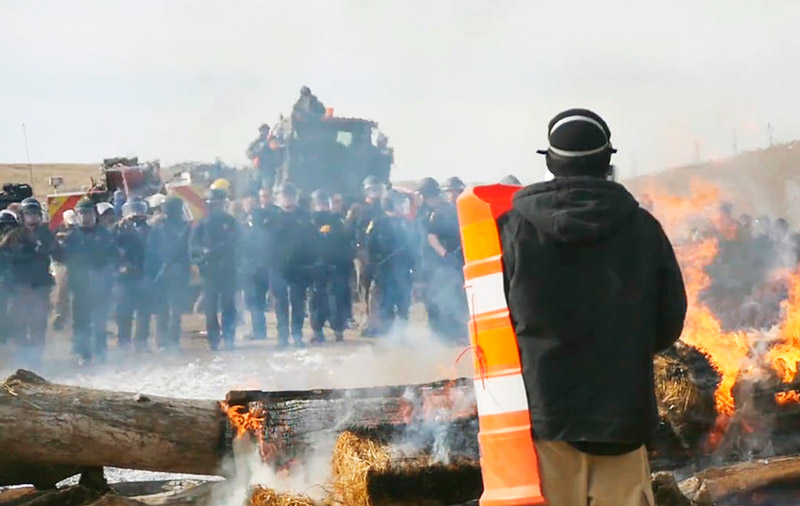
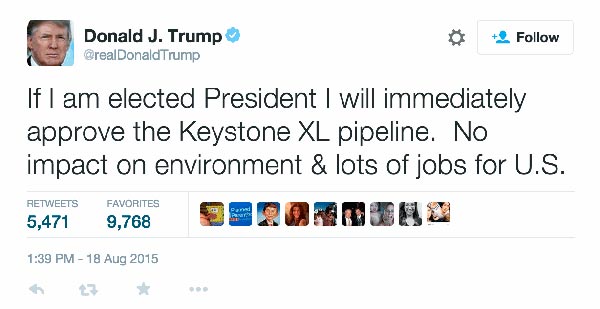
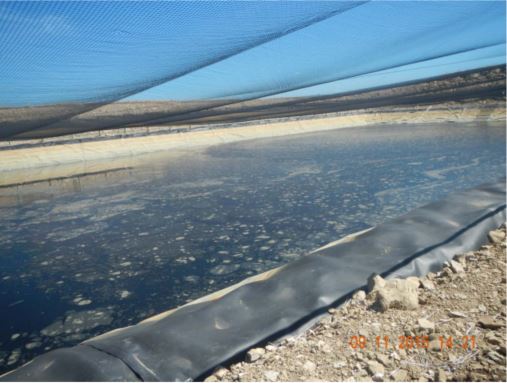
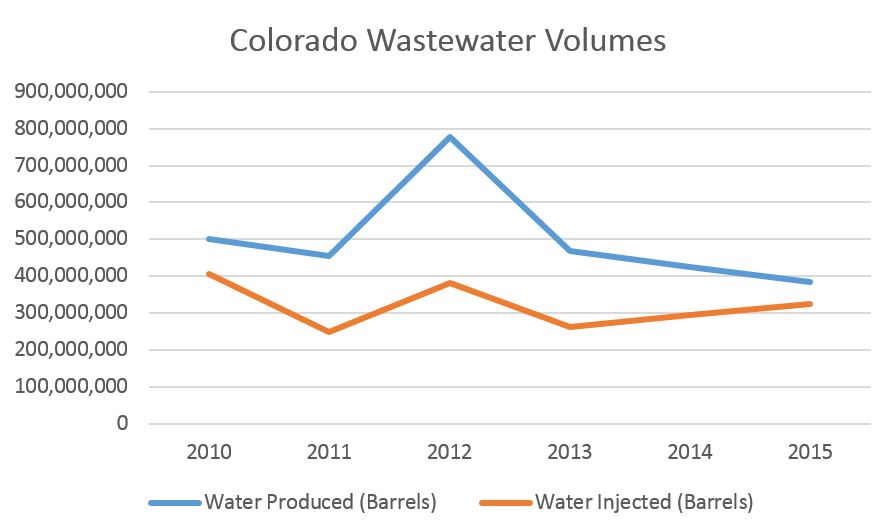


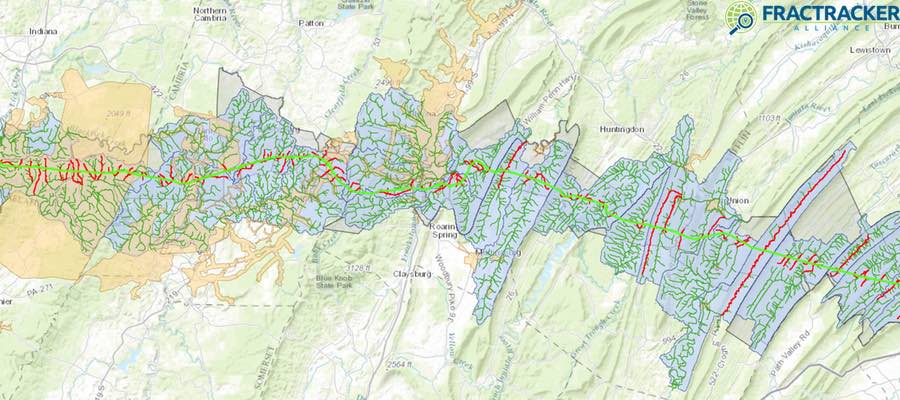
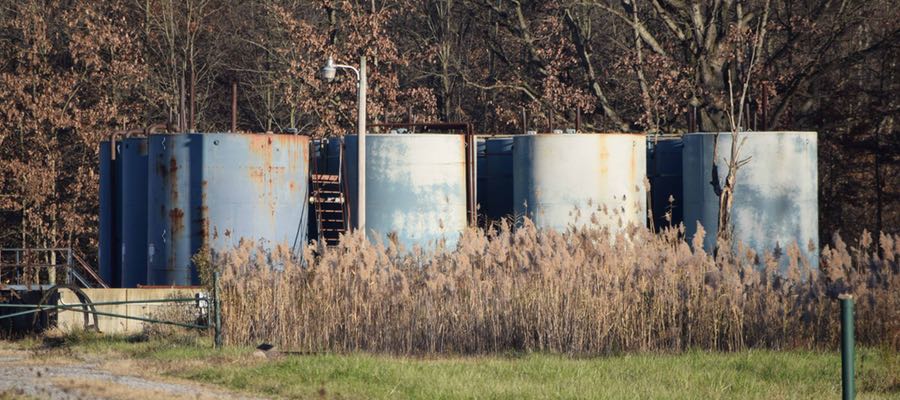
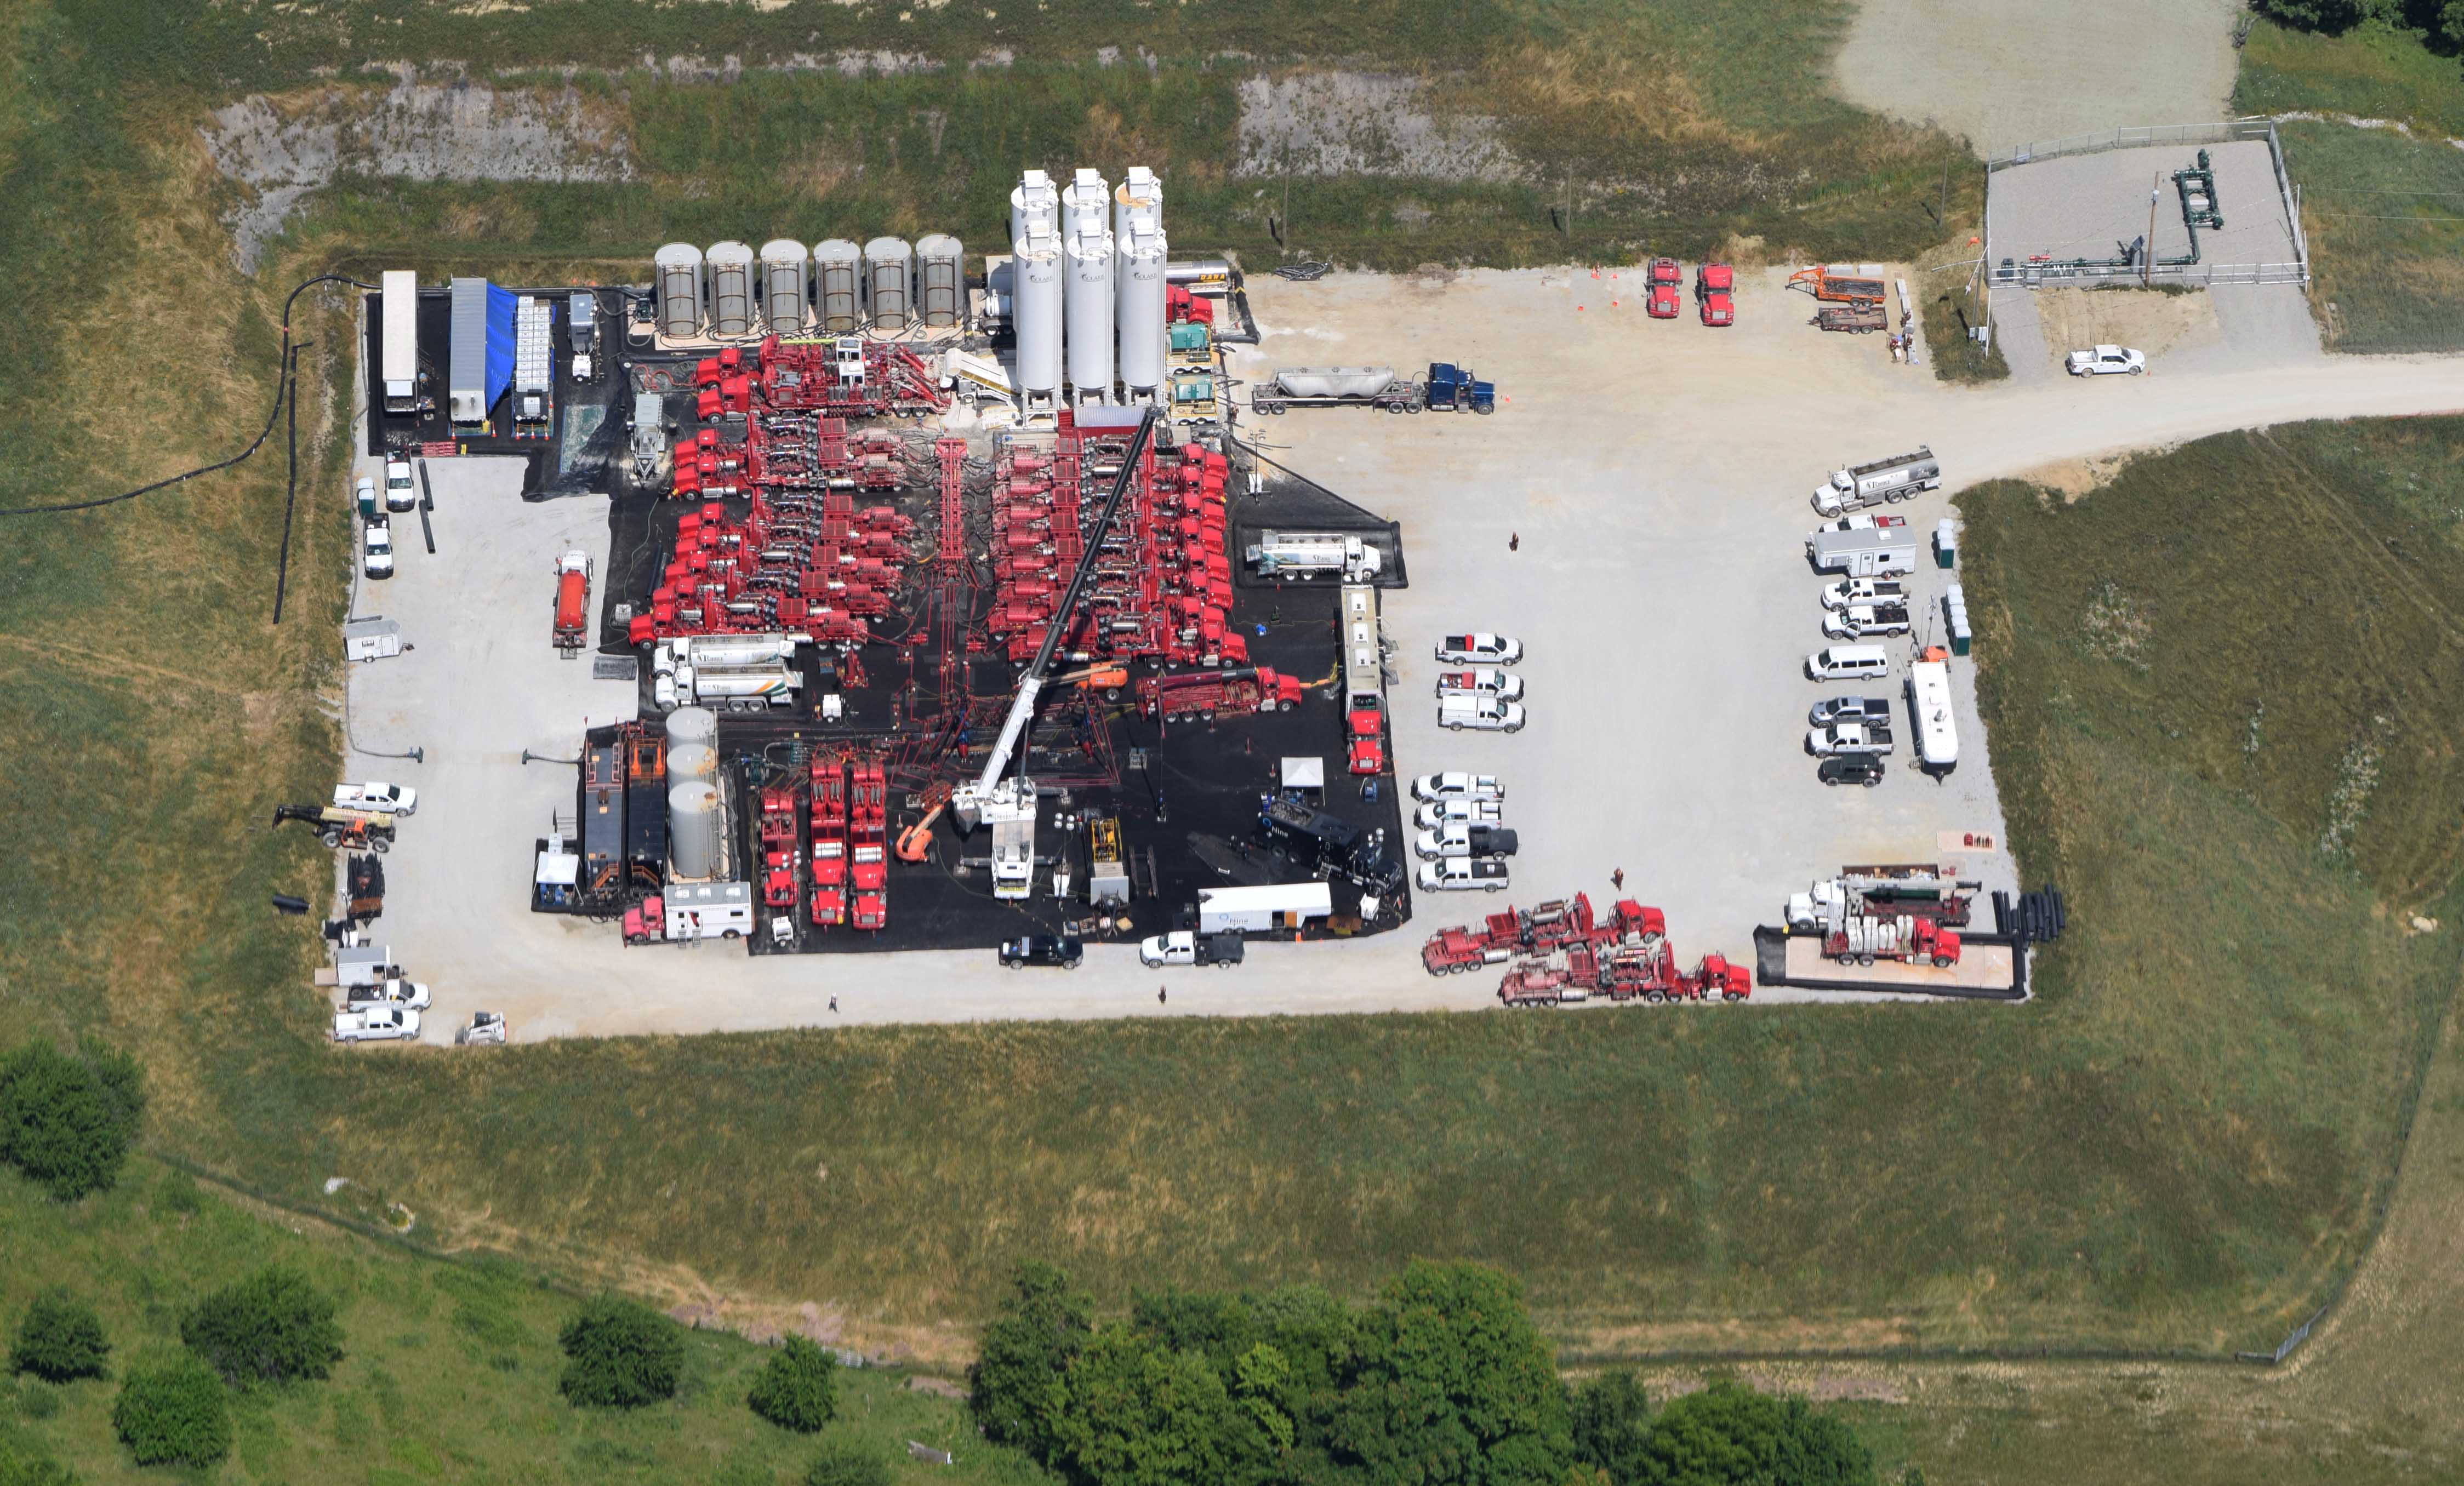


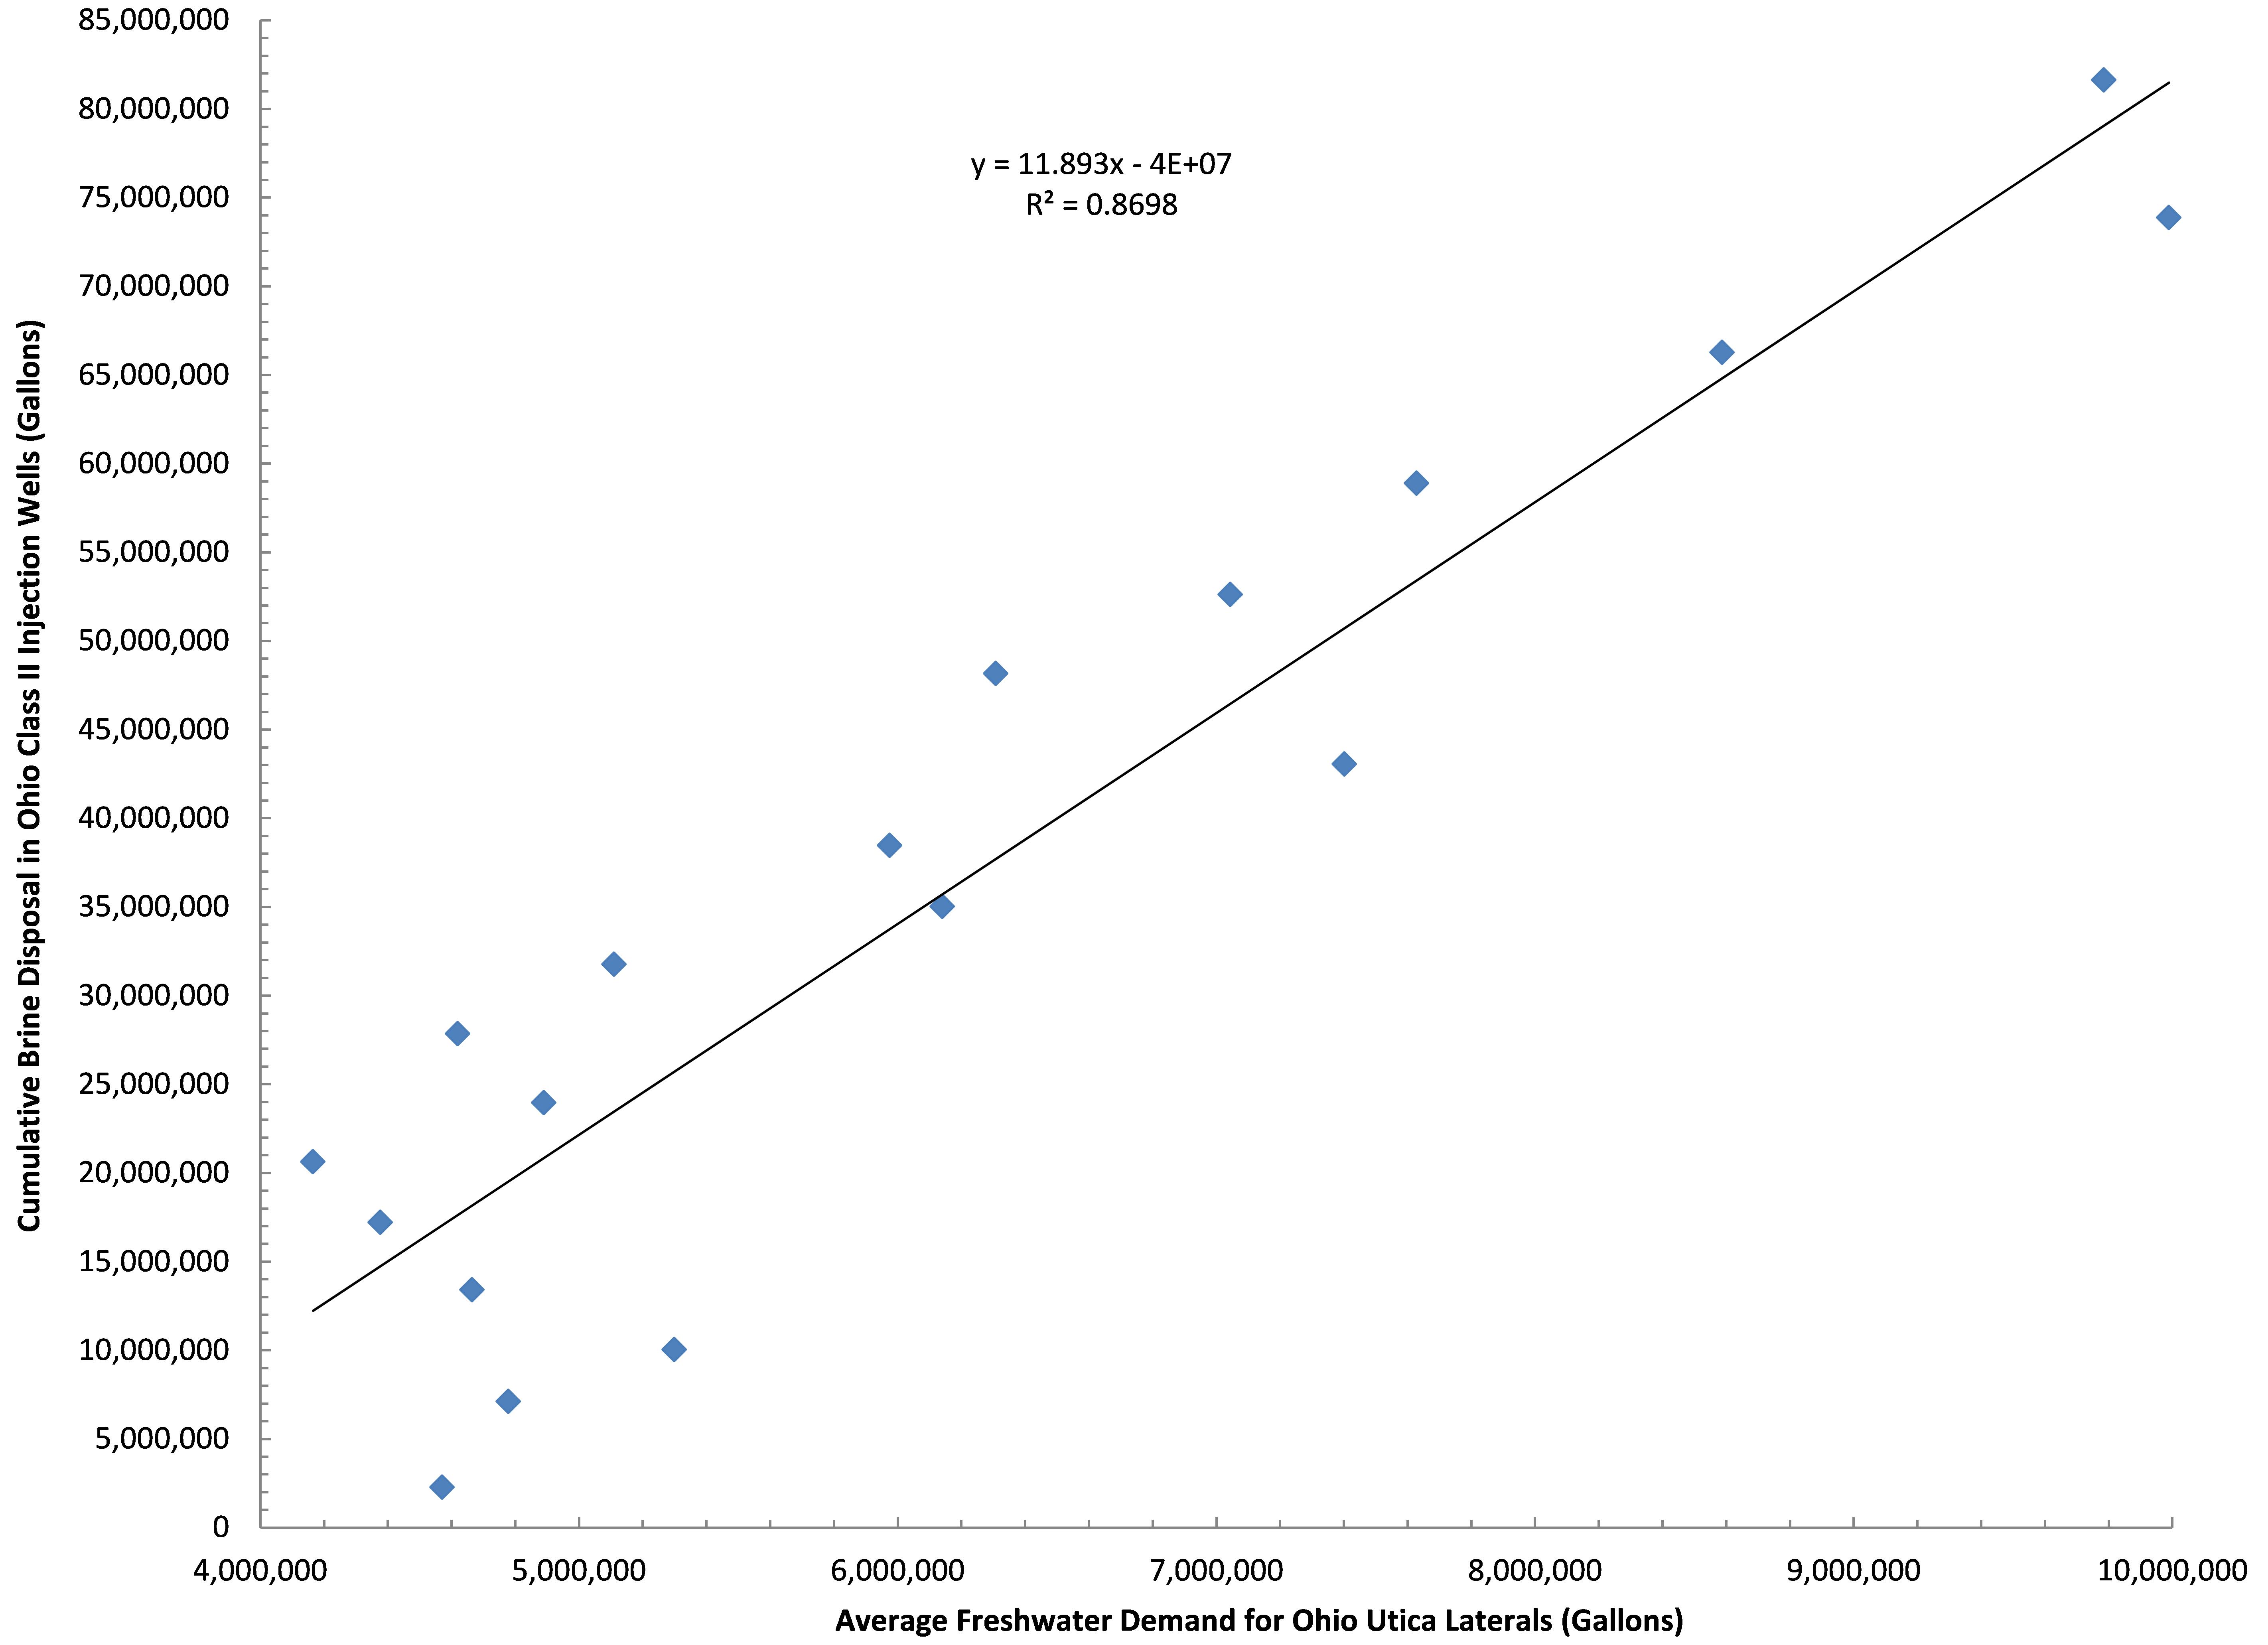


 Class II Injection Well, Ashtabula County, Ohio")
 Class II Injection Well, Ashtabula County, Ohio")
 Class II Injection Well, Lake County, Ohio")
 Class II Injection Well, Lake County, Ohio")


, Knox County, Ohio")

 Class II Injection Well in Mahoning County, Ohio")