A new plan is in the works to construct a natural gas pipeline that would run approximately 190 miles through Maryland. Lawmakers said in January they are anxious to see the Delmarva Pipeline built, but still want to exercise caution.
Starting in Cecil County, MD, and terminating in Accomack County, VA, the proposed Delmarva Pipeline is nearly the length of Maryland’s Eastern Shore. North Carolina-based Spectrum Energy wants to piggyback on this infrastructure and build a gas-powered power plant near Denton, MD, according to a report by WBOC 16 News. The combined price tag on the two projects is $1.25 billion, and is funded entirely by private interests based in Baltimore. The target start-up date for the two projects is 2021.
Local Support
Company officials promise the pipeline would bring down energy costs and bring jobs to the area. According to a 2016 Towson University study, the project would create about 100 jobs in Wicomico and Somerset Counties by 2026. In addition, the proposed power plant in Denton, MD would result in 350 construction jobs and 25-30 permanent jobs.
According to lawmaker Carl Anderton:
…it’s great. You know, anytime we can multiply our infrastructure for energy production, it’s something you really want.
Anderton, who claims to also support solar power and offshore wind, is skeptical about the sustainability of renewable energy to stand on its own if “the sun goes down or the wind’s not blowing.”
However, Senator Stephen Hershey emphasized the need to balance infrastructure build-out with costs to the environment. Said Hershey:
We have to make sure we’re taking all the possible steps to protect that.
Similarly, Democratic Delegate Sheree Sample-Hughes indicated the need to keep the well-being and concerns of citizens “at the forefront.”
Grassroots Opposition
The pipeline project has encountered considerable opposition from the grassroots group “No! Eastern Shore Pipeline.” The group has cited concerns about how all fossil fuels add to global warming, and asserted natural gas is not a cleaner alternative to propane or oil.
Jake Burdett, a supporter of No! Eastern Shore Pipeline, wants a complete transition to renewable fuels in Maryland by 2035, and argues that in the near-term, climate change impacts will be devastating and not reversible for residents of the Chesapeake Bay area, “the third most at-risk area in the entire country for sea level rise.”
In addition to driving climate change, hydraulic fracturing and the construction of the pipeline along the rural and historic Eastern Shore poses serious threats of fouling ground and surface water through sediment run-off and leaks. The possibility of pipeline explosions also puts nearby communities at risk.
Assessing Risks
H4 Capital Partners, the company contracted to build the pipeline, registered as a corporation in May of 2017, and this may be the first pipeline project it has undertaken. H4’s public relations spokesperson Jerry Sanders claimed that the environmental risks posed by the pipeline — which will drill under rivers and wetlands — will be nothing like those encountered by pipelines such as the Keystone XL. Said Sanders, “It is a gas, not a liquid…[so] you don’t have leak-type issues.”
The actual record about pipeline leaks and explosions suggests otherwise, notably summarized here by FracTracker Alliance in 2016, for combined oil and natural gas projects. That research indicates that since 2010, there have been 4,215 pipeline incidents resulting in 100 reported fatalities, 470 injuries, and property damage exceeding $3.4 billion. Additional records of natural gas transmission and distribution pipeline accidents, and hazardous liquid pipeline accidents collected by PHMSA (Pipeline and Hazardous Materials Safety Administration) have been summarized by the Pipeline Safety Trust.
It is unclear whether Maryland’s Department of the Environment (MDE) has completed an analysis of threats to wetlands and other water bodies, or is relying on industry and perhaps residents to do that work for them. Said MDE spokesperson Jay Apperson, “MDE would encourage the project proponents to come in early and often for discussions of routes so that we can… avoid and minimize impacts to these important natural resources.”
Delmarva Pipeline Map
Therefore, in the map below, we have done an analysis of the Delmarva Pipeline route – which we estimated from documents – and calculated the number of times the proposed pipeline crosses wetlands and streams along its route from northern Maryland to its terminus in Accomack County, VA.
In all, there were 172 stream crossings and 579 traverses of wetlands mapped by the US Fish and Wildlife Service’s National Wetland Inventory. Be sure to zoom in on the map above to view the detail. These wetland and stream crossings included:
in Virginia:
88 forested wetlands
13 emergent wetlands
27 riverine wetlands
9 ponds
And in Maryland:
276 forested wetlands
90 riverine wetlands
35 emergent wetlands
13 estuarine wetlands
11 ponds
5 lakes
Rather than focusing on threats to these natural resources or environmental justice issues associated with the nearly 200-mile pipeline, industry is utilizing a different tactic, preferring to view the project as an “economic justice issue [that] would allow the area to have access to low-cost fuels.”
For the Eastern Shore residents of Maryland and Virginia, it remains to be seen whether potential lower energy costs justify the risks of contaminated waterways, property damage, and a shifting shoreline associated with climate change driven by use of fossil fuels.
By Karen Edelstein, Eastern Program Coordinator, FracTracker Alliance
By Kyle Ferrar, Western Program Coordinator, FracTracker Alliance
California’s 2nd Largest Waste Stream
Every year the oil and gas industry in California generates billions of gallons of wastewater, also known as produced water. According to a study by the California Council on Science and Technology, in 2013, more than 3 billion barrels of produced water were extracted along with some 0.2 billion barrels of oil across the state. This wastewater is usually contaminated with a mixture of heavy metals, hydrocarbons, naturally occurring radioactive materials, and high levels of salts. Yet, contaminated wastewater from oil-field operations is exempt from the hazardous waste regulations enforced by the Resource Conservation and Recovery Act (RCRA).
Operators are, therefore, not required to measure or report the chemistry of this wastewater. Even with these unknowns, it is legally re-injected back into groundwater aquifers for disposal. Once an aquifer is contaminated it can be extremely difficult, if not impossible, to clean up again. Particularly in California, where water resources are already stretched thin, underground injection of oil and gas wastewater is a major environmental and economic concern.
The California department responsible for managing these aquifer exemption permits – the Division of Oil, Gas, and Geothermal Resources (DOGGR) – has for decades failed in its regulatory capacity. In 2015, for example, DOGGR admitted that at least 2,553 wells had been permitted to inject oil and gas waste into non-exempt aquifers – aquifers that could be used for drinking water. Independent audits of DOGGR showed decades of poor record-keeping, lax oversight, and in some cases, outright defiance of the law – showing the cozy relationship between regulators and the oil and gas industry. While 176 wells (those that were injecting into the cleanest drinking water) were initially shut down, most of the rest of the 2,377 permits were allowed to continue injecting into disputed wells through the following two years of the regulatory process.
The injection wells targeted by the Environmental Protection Agency (EPA), including those that were shut down, are shown in the map below (Figure 1).
Figure 1. Map of EPA-targeted Class II Injection Wells
The timeline of all this is just as concerning. The State of California has known about these problems since 2011, when the EPA audited California’s underground injection program and identified substantial deficiencies in its program, including failure to protect some potential underground sources of drinking water, a one-size-fits-all geologic review, and inadequate and under-qualified staffing for carrying out inspections. In 2014, the Governor’s office requested that the California EPA perform an independent review of the program. EPA subsequently made a specific remediation plan and timeline for DOGGR, and in March of 2015 the State finalized a Corrective Action Plan, to be completed by February 2017.
Scientific Review of CA Oil and Gas Activities
Meanwhile, in 2013, the California Senate passed SB-4, which set a framework for regulating hydraulic fracturing in California. Part of the bill required an independent scientific study to be conducted on oil and gas well stimulation, including acid well stimulation and hydraulic fracturing. The California Council on Science and Technology organized and led the study, in collaboration with the Lawrence Berkeley National Laboratories, which combined original technical data analyses and a review of relevant literature, all of which was extensively peer-reviewed. The report argues that both direct and indirect impacts of fracking must be accounted for, and that major deficiencies and inconsistencies in data remained which made research difficult. They also recommended that DOGGR improve and modernize their record keeping to be more transparent.
Figure 2*. Depths of groundwater total dissolved solids (a common measure of groundwater quality) in five oil fields in the Los Angeles Basin. Blue and aqua colors represent protected groundwater; the heavy black horizontal line indicates the shallowest hydraulically fractured well in each field. In three of the five wells (Inglewood, Whittier, and Wilmington), fracking and wastewater injection takes place directly adjacent to, or within, protected groundwater.
A major component of the SB-4 report covered California’s Class II injection program. Researchers analyzed the depths of groundwater aquifers protected by the Safe Drinking Water Act, and found that injection and hydraulic fracturing activity was occurring within the same or neighboring geological zones as protected drinking water (Figure 2*).
*Reproduced from California Council on Science and Technology: An Independent Scientific Assessment of Well Stimulation in California Vol. 3.
More Exemptions to be Granted
Now, EPA is re-granting exemptions again. Six aquifer exemptions have been granted, and more are on the docket to be considered. In this second time around, it is imperative that regulatory agencies be more diligent in their oversight of this permitting process to protect groundwater resources. At the same time, the 2015 California bill SB 83 mandates the appointment of an independent review panel to evaluate the Underground Injection Control Program and to make recommendations on how to improve the effectiveness of the program. This process is currently in the works and a panel has been assembled, and FracTracker Alliance will be working to provide data, maps and analyses for this panel.
Stay tuned for more to come on which aquifers are being exempted, why, and what steps are being taken to protect groundwater in California.
https://www.fractracker.org/a5ej20sjfwe/wp-content/uploads/2018/03/PatSullivan_AP_Fracwater.png400900Kyle Ferrar, MPHhttps://www.fractracker.org/a5ej20sjfwe/wp-content/uploads/2025/09/2025-Wordmark-Logo.pngKyle Ferrar, MPH2018-03-22 14:43:392021-04-15 15:01:22California regulators need to protect groundwater from oil and gas waste this time around
https://www.fractracker.org/a5ej20sjfwe/wp-content/uploads/2025/09/2025-Wordmark-Logo.png00Matt Kelso, BAhttps://www.fractracker.org/a5ej20sjfwe/wp-content/uploads/2025/09/2025-Wordmark-Logo.pngMatt Kelso, BA2018-03-20 16:25:062021-04-15 15:01:23Report: Potential Impacts of Unconventional Oil and Gas on the Delaware River Basin
The Mariner East 2 (ME2) pipeline, currently being built by Sunoco Pipeline (Energy Transfer Partners), is a massive 350-mile long pipeline that, if completed, will carry 275,000 barrels of propane, ethane, butane, and other hydrocarbons per day from the shale gas fields of Western Pennsylvania to a petrochemical export terminal located on the Delaware River.
ME2 has faced numerous challenges from concerned citizens since Sunoco first announced plans for the project in 2014. Fights over taking private property by eminent domain, eyebrow raising permit approvals with known technical deficiencies, as well as nearly a hundred drilling mud spills — inadvertent returns (IRs) — at horizontal directional drilling (HDD) sites have occurred since work began in 2017.
This article and the accompanying map brings us up-to-date on the number, location, and status of ME2’s HDD spills. We also summarize the growing list of violations and settlements related to these events. Finally, we highlight the most recent concerns related to ME2’s construction: sinkholes emerging along the pipeline’s path in karst geological formations.
Map of ME2 Updated HDDs, IRs & Karst
The map below shows an updated visual of ME2’s IRs, as of the DEP’s latest tally on March 1, 2018. Included on this map are HDDs where DEP ordered Sunoco reevaluate construction sites to prevent additional spills. Also identified on this map are locations where Sunoco was ordered to notify landowners in close proximity to certain HDDs prior to additional drilling. Finally, the below map illustrates how sinkholes are not a problem unique to one site of construction but are, in fact, common to many areas along ME2’s route. These topics are discussed in greater depth below.
Open the map full-screen to view additional layers not available in the embedded version below.
HDD IR in Washington County
(image: Observer-Reporter)
Despite these issues, and despite Sunoco being cited for 33 violations, ME2 was allowed to proceed under an August 7th agreement that stated Sunoco must reevaluate their HDD plans to minimize additional spills. These studies were to include re-examining the site’s geology and conducting seismic surveys. Sites for reevaluation were selected based on factors such as proximity water supplies, nearby streams and wetlands, problematic geologic conditions, and if an IR had occurred at that site previously. Of ME2’s 230 HDDs, 64 were ordered for reevaluation — 22 of these were selected due to prior IRs occurring at the site.
The DEP mandated that Sunoco’s reevaluation studies be put out for public comment. A table of which HDD studies are currently out for comment can be found here. DEP’s settlement also required Sunoco to notify landowners in proximity to certain HDDs prior to commencing construction due to elevated risks. Of the 64 HDD sites under review, Sunoco must notify 17 residents within 450ft of an HDD site, and 22 residents within 150ft of other sites. The HDD reevaluation sites are shown on the FracTracker map above. Below is an illustration of one site where Sunoco is required to notify landowners within 450ft.
One issue residents have raised with these notifications is that Sunoco is allowed to offer landowners the option to connect their homes to a water buffalo during drilling as an alternative to using their groundwater well. The catch is that, if their well does become contaminated, they would also waive their right to have Sunoco drill them a new replacement well.
“Egregious Violations”
In January 2018, the DEP again suspended ME2’s construction, this time indefinitely revoking their permits, due to even more IRs. DEP also cited Sunoco for “egregious and willful” permit violations —mainly executing HDDs at sites where they had no permission to do so. The DEP noted of their decision that, “a permit suspension is one of the most significant penalties DEP can levy.”
Nevertheless, Sunoco was again allowed to resume construction on February 8, 2018, after paying a $12.6 million fine. The DEP press release accompanying the decision assured the public that, “Sunoco has demonstrated that it has taken steps to ensure the company will conduct the remaining pipeline construction activities in accordance with the law and permit conditions, and will be allowed to resume.”
A few weeks later, Sunoco ran a full-page advertisement in the Harrisburg Patriot-News, shown above, lauding their safety record. Among other notables, the piece boasts, “State and federal regulators spent more than 100 inspection days during 2017 on the Mariner East project, more inspection days than on any other pipeline in Pennsylvania.” Critics have noted that the inordinate number of inspections are due to the comedy of errors associated with ME2’s construction.
Karst Formations & Sinkholes
Which brings us to the current ME2 debacle. Last week, the PA Public Utility Commission (PUC) ordered a temporary shutdown of Mariner East 1 (ME1), another natural gas liquids pipeline owned by Sunoco/ETP. ME1 was built in the 1930s and its right-of-way is being used for most of ME2’s route across the state. This latest construction setback comes in the wake of numerous sinkholes that emerged beginning in December along Lisa Drive in West Whitehead Township, a suburb of Philadelphia in Chester County.
The most recent of these sinkholes grew into a 20ft-deep, 15ft-wide chasm that exposed portions of ME1 and came within 10ft of a house. It is worth noting that, until only a few days ago, ME1 was an operational 8in pipeline with a potential impact radius (aka “blast zone”) of some 500ft. The PUC ordered that Sunoco must now run a line inspection on ME1 for a mile upstream and a mile downstream from the sinkhole sites along Lisa Drive, seen in the image below. Note the proximity of these sinkholes to Amtrak’s Keystone rail lines (connecting Pittsburgh to Philadelphia), under which ME2 also runs. The Federal Railway Administration only recently learned of the sink holes from a nearby resident.
The Lisa Drive sinkholes are being credited to Sunoco executing an HDD in an area known to have karst geological formations. Sunoco has been ordered by the PUC to conduct more geophysical testing and seismic analyses of the area because of this. Karst is often called the “Swiss cheese” of geology — notorious for caves, sinkholes, and underground rivers. As these geological formations change shape, pipelines can bend and settle over time, ultimately leading to potentially dangerous gas leakages or explosions. For instance, the 2015 Atex-1 pipeline explosion in Follansbee, WV, was ultimately determined by the Pipeline and Hazardous Materials Safety Administration (PHSA) as having been caused by ground settling. That explosion released some 24,000 barrels of ethane, burning more than five acres of surrounding land.
The US Geological Survey (USGS) maintains fairly detailed maps of rock formations for most states, including formations known to have karst. In PA, there are a number of “carbonate” rock families known for karst features and settlement issues: limestone and dolostone, and, to a lesser extent, shale. Meanwhile, the PA Department of Conservation and Natural Resources (DCNR) has maintained a record of karst “features” — sinkholes and surface depressions — documented since 1985. A great explanation of the different types of karst features can be found here.
Underestimating the Risks
What is concerning about the Lisa Drive sinkholes is that Sunoco had supposedly already conducted additional karst geological reviews of the area as part of the August DEP settlement, subsequently ranking a nearby HDD (#PA-CH-0219) as “low risk” for running into karst issues—despite knowing the HDD runs through a karst formation with sinkholes and surface depressions in the area. For the HDD that runs the length of Lisa Drive (#PA-CH-0256), the study rated its risk as “very low.” These two HDDs are shown below, along with the area of ME1 now under structural review.
The likely result of these inaccurate assessments led to two IRs at Lisa Drive, one in October and another in November 0f 2017. DEP’s writeup of these events note that the total volume of drilling muds spilled remains unknown because Sunoco didn’t report the incident. Then, only a month later, sinkholes emerged in the same locations. An image of the November HDD IR is shown below.
It is important to note two additional things of Sunoco’s karst study, an except of which is seen in their map of the West Whiteland area below. First, Lisa Drive is just on the edge of a karst limestone formation. USGS data suggest the location is actually mica schist, but the USGS data is also only a rough estimate of different formations. This underscores why pipeline companies must be required to conduct detailed geotechnical analysis of all HDD sites at the onset of their projects.
The other notable aspect of Sunoco’s study is that it does not fully represent all rock formations known to have karst features. In Sunoco’s map, we see orange shading for limestone, but this does not include dolostone that underlies the many surface depressions and sinkholes surrounding West Whiteland. FracTracker’s map includes these formations for greater accuracy.
Interestingly, as Anya Litvak of the Pittsburgh Post-Gazette observed in her reporting on the Lisa Drive incident, Sunoco’s updated karst assessment ranked the entire route of the ME2 pipeline through the state as “low to very low” risk for potential issues. Furthermore, Sunoco has tried to downplay the Lisa Drive incident, stating that “all areas have been secured,” and that additional incidents are unlikely to occur.
But the overall relationship between Mariner East 2’s IRs, HDD sites, and known karst features tells a very different story than Sunoco’s about the potential risks of ME2. In addition to the concerns about new sinkholes near Lisa Drive, FracTracker found the following in our analysis:
7 sinkholes and 386 surface depressions are within 1,500ft of a ME2 HDD site.
Of the 230 HDDs, 87 are located in carbonate rock areas (52 in limestone/dolostone, 35 in shale).
Of the 99 IRs, 39 have occurred in carbonate rock areas (23 in limestone/dolostone, 16 in shale).
In other words, nearly half of the IRs caused by ME2 HDDs were located in areas known to have karst formations. Worth noting is that an additional 15 occurred in sandstone formations, also known to cause settlement over time. The remaining IRs are split across nine other formation types.
Considering that the DEP’s current review of Sunoco’s ability to safely execute future HDDs are based on the same karst study that missed the Lisa Drive HDD and ranked nearby HDDs as a “low” risk, one can only assume that additional spills will occur. There are many more HDD sites yet to be drilled, and also not likely studied fully for potential karst risks. As illustrated by the continuing saga of spills, violations, and omissions, it is clear that Sunoco has not maintained a high standard of construction in building ME2 from the onset.
We thank Eric Friedman from the Middletown Coalition for Community Safety for supplying photos of the Lisa Drive site used in this article.
By Kirk Jalbert, FracTracker Alliance
https://www.fractracker.org/a5ej20sjfwe/wp-content/uploads/2018/03/ME2_sinkholes_header.jpg400900FracTracker Alliancehttps://www.fractracker.org/a5ej20sjfwe/wp-content/uploads/2025/09/2025-Wordmark-Logo.pngFracTracker Alliance2018-03-12 21:06:462021-04-15 15:01:23Mariner East 2: More Spills & Sinkholes Too?
Water is the key ingredient in the hydraulic fracturing process, and its usage – in total and per well – is increasing at an exponential rate. Below, FracTracker takes a look at water withdrawal and use for fracking across 23 Eastern Ohio counties between 2010 and 2016.
Mapping Hydraulic Fracturing Freshwater Supply and Demand in Ohio
Below is a map of annual and cumulative water withdrawal volumes by the hydraulic fracturing industry across Ohio between 2010 and 2016. It displays 312 unique sites, as well as water usage per lateral. The digital map, which can be expanded fullscreen for more features, includes data up until May 2017 for 1,480 Ohio laterals (vertical wells can host more than one lateral well).
The primary take-home message from this analysis and the resulting map is that we can only account for approximately 73% of the industry’s more than 13-billion-gallon freshwater demand by considering withdrawals alone. Another source or sources must be supplying water for these hydraulic fracturing operations.
Hydraulic fracturing rig on the banks of the Ohio River in Marshall County, West Virginia, Winter 2018 (Flight provided by SouthWings)
When Leatra Harper at Freshwater Accountability Project and Thriving Earth Exchange and I brought up this issue with Ohio Division of Water Resources Water Inventory and Planning Program Manager, Michael Hallfrisch, the following correspondence took place on January 24, 2018:
Mr. Hallfrisch: “Where did the water usage per lateral data come from? Does the water usage include reused/recycled water? I know that many of the larger operators reuse a significant amount of their flow back because of the high cost of disposal in class II injection wells.”
FracTracker: “[We’]ve been looking at Class II disposal economics in several states and frankly the costs here in Ohio are quite cheap and many of the same players in Ohio operate in the other states [We]’ve looked at. Granted they usually own their own Class II wells in those other states (i.e., OK, or CO) but the fact that they are “vertically integrated” still doesn’t excuse the fact that the cost of disposing of waste in Ohio is dirt cheap. As for recycling that % was always a rounding error and last [we] checked the data it was going down by about 0.25-0.35% per year from an average of about 5.5-8.0%. [We respectfully] doubt the recycling % would fill this 25% gap in where water is coming from. This gap lends credence to what Lea and [FracTracker] hear time and again in counties like Belmont, Monroe, Noble etc with people telling us about frequent trenches being dug in 1st and 2nd order streams with operators topping off their demands in undocumented ways/means. Apologies for coming down hard on this thing but we’ve been looking/mapping this thing since 2012 and increasingly frustrated with the gap in our basic understanding of flows/stocks of freshwater and waste cycling within Ohio and coming into the state from PA and WV.”
The fracking industry in Ohio uses roughly 10-14 million gallons per well, up from 4-5 million gallon demands in 2010, which means that freshwater demand for this industry is increasing 15% per year (Figures 1 and 2). (This rate is more than double the volumes cited in a recent publication by the American Chemical Society, by the way.) If such exponential growth in hydraulic fracturing’s freshwater demand in Appalachia continues, by 2022 each well in Ohio and West Virginia will likely require[1*]at least 43 million gallons of freshwater (Table 1).
Table 1. Projected annual average freshwater demand per well (gallons) for the hydraulic fracturing industry in Ohio and West Virginia based on a 15% increase per year.
Year
Water Use Per Well (gallons)
Ohio
West Virginia
2019
19,370,077
19,717,522
2020
23,658,666
23,938,971
2021
28,896,760
29,064,215
2022
35,294,582
35,286,756
2023
43,108,900
42,841,519
Water quantity and associated watershed security issues are both acute and chronic concerns at the local level, where fracking’s freshwater demands equal 14% of residential demands across Ohio. These quantities actually exceed 85% of residential demand in several Ohio counties (e.g., Carroll and Harrison), as well as West Virginia (e.g., Doddridge, Marshall, and Wetzel). Interestingly the dramatic uptick in Ohio freshwater demand that began at the end of 2013 coincides with a 50% decline in the price of oil and gas (Figure 3). The implication here is that as the price of gas and oil drops and/or unproductive wells are drilled at an unacceptable rate, the industry uses more freshwater and sand to ensure acceptable financial returns on investments.
To date, the fracking industry has taken on average 90 million gallons of freshwater per county out of Ohio’s underlying watersheds, resulting in the production of 9.6 million gallons of brine waste that cannot be reintroduced into waterways. This massive waste stream is destined for one of Ohio’s Class II Injection wells, but the industry spends less than 1.25% of available capital on water demand(s) and waste disposal. All of this means that the current incentive (cost) to become more efficient is too low. Sellers of water to the industry like the Muskingum Watershed Conservancy District, which we’ve chronicled frequently in the past[2], have actually dropped their price for every 1,000 gallons of water – from roughly $9 to now just $4-6 – for the fracking industry in recent years.
Hydraulic fracturing’s demand is becoming an increasingly larger component of total water withdrawals in Ohio, as other industries, agriculture, and mining become more efficient. Oil and gas wells drilled at the perimeter of the Utica Shale are utilizing 1.25 to 2.5 times more water than those that are staged in the shale “Sweet Spots.” Furthermore, the rise in permitting of so called “Super Laterals” would render all of our water utilization projections null and void. Laterals are the horizontal wells that extend out underground from the vertical well. Most well pads are home to multiple laterals in the range of 4-7 laterals per pad across Ohio and West Virginia.
These laterals, which can reach up to 21,000 feet or almost 4 miles, demand as much as 87 million gallons of freshwater each.
Even accounting for the fact that the super laterals are 17-21,000 feet in length – vs. an average of 7,452 feet – such water demand would dwarf current demands and their associated pressures on watershed security and/or resilience; typically, Ohio’s hydraulically fractured laterals require 970-1,080 gallons of freshwater per lateral foot (GPLF), but super laterals would need an astounding 4,470 GLPF.
Conclusions and Next Steps
The map above illustrates the acute pressures being put upon watersheds and public water supplies in the name of “energy independence.” Yet, Ohio regulators and county officials aren’t putting any pressure on the high volume hydraulic fracturing (HVHF) industry to use less water and produce less waste. We can’t determine exactly how water demand will change in the future. The problem is not going away, however, especially as climate change results in more volatile year-to-year fluctuations in temperature and precipitation. This means that freshwater that was/is viewed as a surplus “commodity” will become more valuable and hopefully priced accordingly.
Furthermore, the Appalachian Ohio landscape is undergoing dramatic transformations at the hands of the coal and more recently the HVHF industry with strip-mines, cracking plants, cryogenic facilities, compressor stations, gas gathering lines – and more – becoming ubiquitous.
We are seeing significant acreage of deciduous forests, cropland, or pasture that once covered the region replaced with the types of impervious surfaces and/or “clean fill” soil that has come to dominate HVHF landscapes in other states like North Dakota, Texas, and Oklahoma.
This landscape change in concert with climate change will mean that the region will not be able to receive, processes, and store water as effectively as it has in the past.
It is too late to accurately and/or more holistically price the HVHF’s current and past water demand in Ohio, however, such holistic pricing would do wonders for how the industry uses freshwater in the future. After all, for an industry that believes so devotedly in the laws of supply and demand, one would think they could get on board with applying such laws to their #1 resource demand in Appalachia. The water the HVHF industry uses is permanently removed from the hydrological cycle. Now is the time to act to prevent long term impacts on Ohio’s freshwater quantity and quality.
Relevant Data
Ohio hydraulic fracturing lateral freshwater demand by individual well between 2010 and the end of 2016. Download
Ohio hydraulic fracturing lateral freshwater withdrawals by site between 2010 and the end of 2016. Download
Endnotes
*Certainty, with respect to this change in freshwater demand, is in the range of 86-90% assuming the exponential functions we fit to the Ohio and West Virginia data persist for the foreseeable future. Downing, Bob, 2014, “Ohio Drillers’ Growing Use of Fresh Water Concerns Environmental Activists”, March 19th, Akron, Ohio
Downing, Bob, 2014, “Group Reacts to Muskingum Watershed Leasing Deal with Antero”, April 22nd, Akron, Ohio
By Ted Auch, Great Lakes Program Coordinator, FracTracker Alliance
https://www.fractracker.org/a5ej20sjfwe/wp-content/uploads/2018/02/Rig-River-Feature.jpg400900Ted Auch, PhDhttps://www.fractracker.org/a5ej20sjfwe/wp-content/uploads/2025/09/2025-Wordmark-Logo.pngTed Auch, PhD2018-02-28 11:12:392021-04-15 15:01:25Fracking’s Freshwater Supply and Demand in Eastern Ohio
In this section of the Falcon Public EIA Project, we explore the hydrological and geological conditions of the pipeline’s construction areas. We first identify the many streams, wetlands, and ponds the Falcon must cross, as well as describe techniques Shell will likely use in these water crossings. The second segment of this section highlights how the areas in the Falcon’s path are known for their complex geological features, such as porous karst limestone and shallow water tables that can complicate construction.
Quick Falcon Facts
Intersects 319 streams; 361 additional streams located only 500ft from construction areas
Intersects 174 wetlands; 470 additional wetlands located only 500ft from construction areas
Majority of crossings will be open cuts and dry-ditch trenching
A total of 19 horizontal directional drilling (HDD) sites; 40 conventional boring sites
25 miles of pipeline overlap karst limestone formations, including 9 HDD sites
240 groundwater wells within 1/4 mile of the pipeline; 24 within 1,000ft of an HDD site
Map of Falcon water crossings and hazards
The following map will serve as our guide in breaking down the Falcon’s risks to water bodies. Expand the map full-screen to explore its contents in greater depth. Some layers only become visible as you zoom in. A number of additional features of the map are not shown by default, but can be turned on in the “layers” tab. These include information on geological features, water tables, soil erosion characteristics, as well as drinking reservoir boundaries. Click the “details” tab in full-screen mode to read how the different layers were created.
The parts of Pennsylvania, West Virginia, and Ohio where the Falcon pipeline will be built lie within the Ohio River Basin. This landscape contains thousands of streams, wetlands, and lakes, making it one of the most water rich regions in the United States. Pipeline operators are required to identify waters likely to be impacted by their project. This two-step process involves first mapping out waters provided by the U.S. Geological Survey’s national hydrological dataset. Detailed field surveys are then conducted in order to locate additional waters that may not yet be accounted for. Many of the streams and wetlands we see in our backyards are not represented in the national dataset because conditions can change on the ground over time. Yet, plans for crossing these must also be present in pipeline operator’s permit applications.
Streams
Streams (and rivers) have three general classifications. “Perennial” streams flow year-round, are typically supplied by smaller up-stream headwaters, and are supplemented by groundwater. In a sense, the Ohio River would be the ultimate perennial stream of the region as all smaller and larger streams eventually end up there. “Intermittent” streams flow for only a portion of the year and are dry at times, such as during the summer when water tables are low. Finally, “ephemeral” streams flow only during precipitation events.
These classifications are important because they can determine the extent of aquatic habitat that streams can support. Working in streams that have no dry period can put aquatic lifeforms at elevated risk. For this and other reasons, many states further designate streams based on their aquatic life “use” and water quality. In Pennsylvania, for instance, the PA DEP uses the designations: Warm Water Fishes (WWF), Trout Stocked (TSF), Cold Water Fisheries (CWF) and Migratory Fishes (MF). Streams with exceptional water quality may receive an additional designation of High Quality Waters (HQ) and Exceptional Value Waters (EV).
Wetlands
Similar to streams, wetlands also have unique designations. These are based on the U.S. Fish and Wildlife Services’ national wetlands inventory. Wetlands are generally defined as “lands transitional between terrestrial and aquatic systems where the water table is usually at or near the surface or the land is covered by shallow water.” As such, wetlands are categorized by their location (such as a tidal estuary or an inland wetland that lacks flowing water), its substrate (bedrock, sand, etc.), and plant life that might be present. While there are hundreds of such categories, only four pertain to the wetlands present in the regions where the Falcon pipeline will be built. Their designations roughly translate to the following:
Palustrine Emergent (PEM): Marshes and wet meadows hosting perennial small trees, shrubs, mosses, or lichens
Palustrine Shrub (PSS): Similar to PEMs, but characterized by also having well-established shrubs
Palustrine Forested (PFO): Similar to PEMs and PSSs, but having trees larger than 6 meters high
Palustrine Unconsolidated Bottom (PUB) and Palustrine Opem Water (POW) (aka ponds)
Pipeline operators are required to report the crossing length of each wetland they will encounter, as well as the area of permanent and temporary disturbance that would occur in each of these wetlands. When building the pipeline, operators are required to ensure that all measures are taken to protect wetlands by minimizing impacts to plant life, as well as by taking “upland protective measures” to prevent sedimentation runoff during precipitation events. When undergoing FERC EIA scrutiny, operators are also required to limit the width of wetland construction areas to 75 feet or less.
Crossing Methods
Open-Cut Trenching
Pipeline operators use a variety of methods when crossing streams, wetlands, and ponds. Shorter length crossings often employ a rudimentary trench. After the cuts, construction crews attempts to repair damage done in the process of laying the pipeline. For longer crossings, operators can use boring techniques to go underneath water features.
Open-cut trenching
There are two general types of trenches. The first, “open-cut” crossings, are typically used for smaller waterbodies, such as in intermittent streams where flow may not be present during time of construction, or when construction can be completed in a short period of time (typically 24-48 hours). In this process, a trench is laid through the water body without other provisions in place.
The second type, “dry-ditch” crossing, are required by FERC for waterbodies up to 30 feet wide “that are state-designated as either coldwater or significant coolwater or warmwater fisheries, or federally-designated as critical habitat.” In these spaces, pumps are used to transfer stream flow around the area where trenching occurs. In places where sensitive species are present, dry-ditches must include a flume to allow these species to pass through the work area.
Conventional Boring
Conventional boring consists of creating a tunnel for the pipeline to be installed below roads, waterbodies, and other sensitive resources. Bore pits are excavated on either sides of the site. A boring machine is then used to tunnel under the resource and the pipeline is pushed through the bore hole.
Horizontal Directional Drilling
In more difficult or lengthy crossings, operators may choose to bore under a water feature, road, or neighborhood. Horizontal directional drilling (HDD) involves constructing large staging areas on either side of the crossing. A large drill bit is piloted through the ground along with thousands of gallons of water and bentonite clay for lubricant (commonly referred to as drilling muds). HDDs are designed to protect sensitive areas, but operators prefer not to use them as HDDs can be expensive and require in-depth planning in order for things to go well.
Bentonite sediment pollutes a stream at a Mariner East HDD spill site
(source: Washington, PA, Observer-Reporter)
An example of what happens when things are rushed can be seen in Sunoco’s Mariner East 2 pipeline. The PA DEP has cited Sunoco for over 130 inadvertent returns (accidental releases of drilling muds) since construction began. These spills led to damaged water wells and heavy sedimentation in protected streams, as exemplified in the image above. Making matters worse, Sunoco later violated terms of a settlement that required them to re-survey before recommencing construction. See FracTracker’s article on these spills.
Footprint of the Falcon
The overwhelming majority of Falcon’s water body crossings will be executed with either open-cut or dry-ditch methods. There are 40 locations where conventional boring will be used, but only a 3 are used for crossing water resources. Shell intends to use 19 HDDs and, of these, only 13 are used for crossing water bodies of some kind (the longest of which crosses the Ohio River). All other conventional and HDD boring locations will be used to cross under roads and built structures. This is not entirely unusual for pipelines. However, we noted a number of locations where one would expect to see HDDs but did not, such as in the headwaters of the Ambridge and Tappen Reservoirs, as was seen in the images above.
Stream Impacts
Shell identified and/or surveyed a total of 993 stream sections in planning for the Falcon’s construction. As shown on FracTracker’s map, the pipeline’s workspace and access roads will directly intersect 319 of these streams with the following classifications: perennial (96), ephemeral (79), and intermittent (114). An additional 361 streams are located only 500ft from construction areas.
A number of these streams have special designations assigned by state agencies. For instance, in Pennsylvania, we found 10 stream segments listed as Trout Stocked (TS), which are shown on our interactive map.
Crossing HQ headwater streams of the Ambridge Reservoir
Perhaps more concerning, the Falcon will cross tributaries to the Service Creek watershed 13 times. These feed into three High Quality Cold Water Fishes (HQ/CWF) headwater streams of the Ambridge Reservoir in Beaver County, PA, shown in the image above. They also support the endangered Southern Redbelly Dace (discussed in greater depth here). On the eastern edge of the watershed, the Falcon will cross the raw water line leading out of the reservoir.
The reservoir supplies 6.5 million gallons of water a day to five townships in Beaver County (Ambridge, Baden, Economy, Harmony, and New Sewickley) and four townships in Allegheny County (Leet, Leetsdale, Bell Acres & Edgeworth). This includes drinking water services to 30,000 people.
We found a similar concern in Ohio where the Falcon will cross protected headwaters in the Tappan Reservoir watershed at six different locations. The Tappan is the primary drinking water source for residents in Scio. Below is a page from Shell’s permit applications to the PA DEP outlining the crossing of one of the Ambridge Reservoir’s CWF/HQ headwater streams.
Wetland Impacts
Shell identified a total of 682 wetland features relevant to Falcon’s construction, as well as 6 ponds. Of these, the pipeline’s workspace and access roads will directly intersect 174 wetlands with the following classifications: PEM (141), PSS (13), PFO (7), PUB (10), POW (3). An additional 470 of these wetlands, plus the 6 ponds, are located only 500ft from construction areas.
Example 1: Lower Raccoon Creek
A few wetland locations stand out as problematic in Shell’s construction plans. For instance, wetlands that drain into Raccoon Creek in Beaver County will be particularly vulnerable in two locations. The first is in Potter Township, where the Falcon will run along a wooded ridge populated by half a dozen perennial and intermittent streams that lead directly to a wetland of approximately 14 acres in size, seen below. Complicating erosion control further, Shell’s survey data shows that this ridge is susceptible to landslides, shown in the first map below in dotted red.
Landslide areas along Raccoon Creek wetlands and streams
This area is also characterized by the USGS as having a “high hazard” area for soil erosion, as seen in this second image. Shell’s engineers referenced this soil data in selecting their route. The erosion hazard status within 1/4 mile of the Falcon is a layer on our map and can be activated in the full-screen version.
High erosion hazard zones along Raccoon Creek
Shell’s permit applications to the PA DEP requires plans be submitted for erosion and sedimentation control of all areas along the Falcon route. Below are the pages that pertain to these high hazard areas.
Example 2: Independence Marsh
The other wetland area of concern along Raccoon Creek is found in Independence Township. Here, the Falcon will go under the Creek using horizontal drilling (highlighted in bright green), a process discussed in the next section. Nevertheless, the workspace needed to execute the crossing is within the designated wetland itself. An additional 15 acres of wetland lie only 300ft east of the crossing but are not accounted for in Shell’s data.
This unidentified wetland is called Independence Marsh, considered the crown jewel of the Independence Conservancy’s watershed stewardship program. Furthermore, the marsh and the property where the HDD will be executed are owned by the Beaver County Conservation District, meaning that the CCD signed an easement with Shell to cross publicly-owned land.
Independence Marsh, unidentified in Shell’s survey data
Groundwater Hazards
The Falcon’s HDD locations offer a few disturbing similarities to what caused the Mariner East pipeline spills. Many of Sunoco’s failures were due to inadequately conducted (or absent) geophysical surveys prior to drilling that failed to identify karst limestone formations and shallow groundwater tables, which then led to drilling muds entering nearby streams and groundwater wells.
Karst Limestone
Karst landscapes are known for containing sinkholes, caves, springs, and surface water streams that weave in and out of underground tunnels. Limestone formations are where we are most likely to see karst landscapes along the Falcon’s route.
In fact, more than 25 of the Falcon’s 97 pipeline miles will be laid within karst landscapes, including 9 HDD sites. However, only three of these HDDs sites are identified in Shell’s data as candidates for potential geophysical survey areas. The fact that the geology of the other 10 HDD sites will not be investigated is a concern.
One site where a geophysical survey is planned can be seen in the image below where the Falcon crosses under PA Highway 576. Note that this image shows a “geological formations” layer (with limestone in green). This layer shows the formation types within 1/4 mile of the Falcon and can activated in the full-screen version of our interactive map.
A potential HDD geophysical survey area in karst limestone
Water Tables
We also assessed the Falcon’s HDDs relative to the groundwater depths and nearby private groundwater wells. The USGS maintains information on minimum water table depths at different times of the year. In the image below we see the optional “water table depth” layer activated on the FracTracker map. The groundwater at this HDD site averages 20ft on its western side and only 8ft deep on the eastern side.
Shallow groundwater and private wells near a planned HDD site
Groundwater Wells
Also seen in the above image is the “groundwater wells” layer from the FracTracker map. We found 240 private water wells within 1/4 mile of the Falcon. This data is maintained by the PA Department of Natural Resources as well as by the Ohio Department of Natural Resources. Comparable GIS data for West Virginia were not readily available thus not shown on our map.
While all of these wells should be assessed for their level of risk with pipeline construction, the subset of wells nearest to HDD sites deserve particular attention. In fact, Shell’s data highlights 24 wells that are within 1,000 feet of a proposed HDD site. We’ve isolated the groundwater wells and HDD sites in a standalone map for closer inspection below. The 24 most at-risk wells are circled in blue.
In this segment of the Falcon Public EIA Project we continue to explore the different ways that pipelines are assessed for potential risk – in this case, relative to population centers, drinking water systems, and sensitive habitats. We outline methods dictated by the Pipeline and Hazardous Materials Safety Administration (PHMSA) called “high consequence areas” (HCAs) and how they determine potential impact zones for highly volatile liquid (HVL) pipelines. These methods are then applied to the Falcon to understand its possible dangers.
Quick Falcon Facts
An estimated 940-foot potential impact radius (PIR)
60 of 97 pipeline miles qualifying as High Consequence Areas (HCA)
More than 8,700 people living in the “vapor zone”
5 schools, 6 daycare centers, and 16 emergency response centers in “vapor zone”
In proximity to 8 source-water (drinking water) protection areas
Affecting habitats populated by 11 endangered, protected, or threatened species
Map of Falcon High Consequence Areas
The following map will serve as our guide in breaking down the Falcon’s High Consequence Areas. Expand the map full-screen to explore its contents in greater depth. Some layers only become visible as you zoom in. A number of additional layers are not shown by default, but can be turned on in the “layers” tab. Click the “details” tab in full-screen mode to read how the different layers were created.
Two considerations are used when determining pipeline proximity to population centers:
High Population Areas – an urbanized area delineated by the Census Bureau as having 50,000 or more people and a population density of at least 1,000 people per square mile; and
Other Populated Areas – a Census Bureau designated “place” that contains a concentrated population, such as an incorporated or unincorporated city, town, village, or other designated residential or commercial area – including work camps.
USAs: Drinking Water
PHMSA’s definition of drinking water sources include things such as:
Community Water Systems (CWS) – serving at least 15 service connections and at least 25 year-round residents
Non-transient Non-community Water Systems (NTNCWS) – schools, businesses, and hospitals with their own water supplies
Source Water Protection Areas (SWPA) for a CWS or a NTNCWS
Wellhead Protection Areas (WHPA)
Sole-source karst aquifer recharge areas
These locations are typically supplied by regulatory agencies in individual states.
With the exception of sole-source aquifers, drinking water sources are only considered if they lack an alternative water source. However, PHMSA is strict on what alternative source means, stating that they must be immediately usable, of minimal financial impact, with equal water quality, and capable of supporting communities for at least one month for a surface water sources of water and at least six months for a groundwater sources.
One very important note in all of these “drinking water” USA designations is that they do not include privately owned groundwater wells used by residences or businesses.
USAs: Ecological Resource
Ecological resource areas are established based on any number of qualities with different variations. In general terms, they contain imperiled, threatened, or endangered aquatic or terrestrial species; are known to have a concentration of migratory waterbirds; or are a “multi-species assemblage” area (where three or more of the above species can be found).
Calculating HCAs
Like Class locations, HCAs are calculated based on proximity. The first step in this process is to determine the pipeline’s Potential Impact Radius (PIR) — the distance beyond which a person standing outdoors in the vicinity of a pipeline rupture and fire would have a 99% chance of survival; or in which death, injury, or significant property damage could occur. PIR is calculated based on the pipeline’s maximum allowable operating pressure (MAOP), diameter, and the type of gas. An example of this calculation is demonstrated in FracTracker’s recent article on the Mariner East 2 pipeline’s PIR.
Once the PIR is known, operators then determine HCAs in one of two ways, illustrated in the image below:
Method 1: A Class 3 or Class 4 location, or a Class 1 or Class 2 location where “the potential impact radius is greater than 660 feet (200 meters), and the area within a potential impact circle contains 20 or more buildings intended for human occupancy”; or a Class 1 or Class 2 location where “the potential impact circle contains an “identified site.”
Method 2: An area within PIR containing an “identified site” or 20 or more buildings intended for human occupancy.
Calculating HCAs
(source: PHMSA)
In these definitions, “identified sites” include such things as playgrounds, recreational facilities, stadiums, churches, office buildings, community centers, hospitals, prisons, schools, and assisted-living facilities. However, there is a notable difference in how HCAs are calculated for natural gas pipelines vs. hazardous liquid pipelines.
Beyond just looking at what lies within the PIR, pipelines that contain gasses such as ethane potentially impact a much broader area as vapors flow over land or within a river, stream, lake, or other means. A truly accurate HCA analysis for an ethane pipeline leak requires extensive atmospheric modeling for likely vapor dispersions, such as seen in the example image below (part of a recent ESRI GIS conference presentation).
HCAs determine if a pipeline segment is included in an operator’s integrity management program (IMP) overseen by PHMSA or its state equivalent. IMPs must include risk assessments that identify the most likely impact scenarios in each HCA, enhanced management and repair schedules, as well as mitigation procedures in the event of an accident. Some IMPs also include the addition of automatic shut-off valves and leak detection systems, as well as coordination plans with local first responders.
The Falcon Risk Zones
Shell’s permit applications to the PA DEP state the pipeline:
…is not located in or within 100 feet of a national, state, or local park, forest, or recreation area. It is not located in or within 100 feet of a national natural landmark, national wildlife refuge, or federal, state, local or private wildlife or plant sanctuaries, state game lands. It is also not located in or within 100 feet of a national wild or scenic river, the Commonwealth’s Scenic Rivers System, or any areas designated as a Federal Wilderness Area. Additionally, there are no public water supplies located within the Project vicinity.
This is a partial truth, as “site” and “vicinity” are vague terms here. A number of these notable areas are within the PIR and HCA zones. Let’s take a closer look.
The PIR (or “Blast Zone”)
Shell’s permit applications state a number of different pipeline dimensions will be used throughout the project. Most of the Falcon will be built with 12-inch steel pipe, with two exceptions: 1) The segment running from the Cadiz, OH, separator facility to its junction with line running from Scio, OH, will be a 10-inch diameter pipe; 2) 16-inch diameter pipe will be used from the junction of the Falcon’s two main legs located four miles south of Monaca, PA, to its end destination at the ethane cracker. We also know from comments made by Shell in public presentations that the Falcon’s maximum allowable operating pressure (MOAP) will be 1,440 psi. These numbers allow us to calculate the Falcon’s PIR which, for a 16″ ethane pipeline at 1,440psi, is about 940 feet. We’ve termed this the “blast zone” on our maps.
The HCA (or “Vapor Zone”)
Shell’s analysis uses an HCA impact radius of 1.25 miles. This much larger buffer reflects the fact that vapors from hazardous liquid pipelines can travel unpredictably at high concentrations for long distances before ignition. This expanded buffer might be called the “vapor zone,” a term we used on our map. Within the HCA “vapor zone” we find that 60 of the Falcon’s 97 miles qualify as high consequence areas, with 35 miles triggered due to their proximity to drinking water sources, 25 miles trigger for proximity to populated areas, and 3 miles for proximity to ecological areas.
Populated Areas
Shell’s HCA buffer intersects 14 US Census-designated populated areas, shown in the table below. Falcon’s right-of-way directly intersects two of these areas: Cadiz Village in Harrison County, Ohio, and Southview CDP (Census Designated Place) in Washington County, PA. These areas are listed below. Additionally, we included on the FracTracker map the locations of public facilities that were found inside the HCA buffer. These include 5 public schools, 6 daycare centers, 10 fire stations, and 6 EMS stations.
Area
Population
State
HCA
Pittsburgh Urbanized Area
High
PA
Indirect
Weirton-Steubenville Urbanized Area
High
WV/OH/PA
Indirect
Scio Village
Other
OH
Indirect
Cadiz Village*
Other
OH
Direct
Amsterdam Village
Other
OH
Indirect
Shippingport Borough
Other
PA
Indirect
Industry Borough
Other
PA
Indirect
Hookstown Borough
Other
PA
Indirect
Midway Borough
Other
PA
Indirect
Clinton CDP
Other
PA
Indirect
Imperial CDP
Other
PA
Indirect
Southview CDP*
Other
PA
Direct
Hickory CDP
Other
PA
Indirect
Westland CDP
Other
PA
Indirect
* Indicates an area the Falcon’s right-of-way will directly intersect
While it is difficult to determine the actual number of people living in the PIR and HCA vapor zone, there are ways one can estimate populations. In order to calculate the number of people who may live within the HCA and PIR zones, we first identified U.S. Census blocks that intersect each respective buffer. Second, we calculated the percentage of that census block’s area that lies within each buffer. Finally, we used the ratio of the two to determine the percentage of the block’s population that lies within the buffer.
Based on 2010 Census data, we estimate that 2,499 people live within a reasonable projection of the Falcon’s PIR blast zone. When expanded to the HCA vapor zone, this total increases to 8,738 people. These numbers are relatively small compared to some pipelines due to the fact that a significant portion of the Falcon runs through fairly rural areas in most places.
PIR est. pop.
HCA est. pop.
OHIO
Carroll County
11
47
Harrison County
274
915
Jefferson County
334
1,210
Total
619
2,172
WEST VIRGINIA
Hancock County
242
1,155
Total
242
1,155
PENNSYLVANIA
Allegheny County
186
969
Beaver County
990
3,023
Washington County
461
1,419
Total
1,637
5,410
Grand Total
2,499
8,738
Drinking Water Sources
Shell’s data identified a number of drinking water features considered in their HCA analysis. Metadata for this information show these sites were obtained from the Ohio Division of Drinking and Ground Waters, the West Virginia Source Water Assessment and Wellhead Protection Program, and the Pennsylvania DEP Wellhead Protection Program. The exact locations of public drinking water wells and intake points are generally protected by states for safety reasons. However, we duplicated the 5-mile buffer zones used on Shell’s map around these points, presumably denoting the boundaries of source water protection areas, wellhead protection areas, or intake points.
Drinking water buffers in Shell’s HCA analysis
As shown on FracTracker’s interactive map, five of these areas serve communities in the northern portions of Beaver County, shown in the image above, as well as the Cadiz and Weirton-Steubenville designated populated areas. Recall that HCA drinking water analysis only requires consideration of groundwater wells and not surface waters. This is an important distinction, as the Ambridge Reservoir is within the HCA zone but not part of Shell’s analysis — despite considerable risks outlined in our Falcon article on water body crossings.
Ecological Areas
Shell’s permits state that they consulted with the U.S. Fish and Wildlife Service (USFWS), Pennsylvania Game Commission (PGC), Pennsylvania Fish & Boat Commission (PFBC), and the Pennsylvania Department of Conservation and Natural Resources (DCNR) on their intended route in order to determine potential risks to protected species and ecologically sensitive areas.
DCNR responded that the pipeline had the potential to impact six sensitive plant species: Vase-vine Leather-Flower, Harbinger-of-spring, White Trout-Lily, Purple Rocket, Declined Trillium, and Snow Trillium. PFBC responded that the project may impact the Southern Redbelly Dace, a threatened temperate freshwater fish, within the Service Creek watershed. PGC responded that the pipeline had potential impact to habitats used by the Short-Eared Owl, Northern Harrier, and Silver-Haired Bat. Finally, the USFWS noted the presence of freshwater mussels in a number of water features crossed by the Falcon.
https://www.fractracker.org/a5ej20sjfwe/wp-content/uploads/2017/01/Falcon_header_HCA.jpg200900FracTracker Alliancehttps://www.fractracker.org/a5ej20sjfwe/wp-content/uploads/2025/09/2025-Wordmark-Logo.pngFracTracker Alliance2018-01-24 10:39:082021-04-15 15:02:00The Falcon: High Consequence Areas & Potential Impact Zones
Report Calculates Impacts from PA’s Planned Natural Gas Infrastructure
FracTracker Alliance released the report: A Hazy Future: Pennsylvania’s Energy Landscape in 2045 today, which details the potential future impacts of a massive buildout of Marcellus Shale wells and associated natural gas infrastructure.
Industry analysts forecast 47,600 new unconventional oil and gas wells may be drilled in Pennsylvania by 2045, fueling new natural gas power plants and petrochemical facilities in PA and beyond. Based on industry projections and current rates of consumption, FracTracker – a national data-driven non-profit – estimates the buildout would require 583 billion gallons of fresh water, 386 million tons of sand, 798,000 acres of land, 131 billion gallons of liquid waste, 45 million tons of solid waste, and more than 323 million truck trips to drilling sites.
“Only 1,801 of the 10,851 unconventional wells already drilled count as a part of this projection, meaning we could see an additional 45,799 such wells in the coming decades,” commented Matt Kelso, Manager of Data and Technology for FracTracker and lead author on the report.
Why the push for so much more drilling? Out of state – and out of country – transport is the outlet for surplus production.
“The oil and gas industry overstates the need for more hydrocarbons,” asserted FracTracker Alliance’s Executive Director, Brook Lenker. “While other countries and states are focusing more on renewables, PA seems resolute to increase its fossil fuel portfolio.”
The report determined that the projected cleared land for well pads and pipelines into the year 2045 could support solar power generation for 285 million homes, more than double the number that exist in the U.S.
“A Hazy Future shows that a fossil fuel-based future for Pennsylvania would come at the expense of its communities’ health, clean air, water and land. It makes clear that a dirty energy future is unnecessary,” said Earthworks’ Pennsylvania Field Advocate, Leann Leiter. Earthworks endorsed FracTracker’s report. She continued, “I hope Governor Wolf reads this and makes the right choices for all Pennsylvanians present and future.”
A Hazy Future reviews the current state of energy demand and use in Pennsylvania, calculates the footprint of industry projections of the proposed buildout, and assesses what that would look like for residents of the Commonwealth.
Started in 2010 as a southwestern Pennsylvania area website, FracTracker Alliance is a national organization with regional offices across the United States in Pennsylvania, the District of Columbia, New York, Ohio, and California. The organization’s mission is to study, map, and communicate the risks of oil and gas development to protect our planet and support the renewable energy transformation. Its goal is to support advocacy groups at the local, regional, and national level, informing their actions to positively shape our nation’s energy future.
We live in a complex environment of local, regional, national, and international issues. We are constantly bombarded with a news cycle that regenerates at increasingly dizzying speeds. How can we possibly know what is truly important when hyped up twitter controversies clog up our news feeds?
In this quantity-over-quality culture, many of the most important issues and fights for civil rights and energy justice become casualties of a regression to ignorance.
At FracTracker, we disagree with this tactic – especially as it relates to the protests at Standing Rock. FracTracker has previously written about these demonstrations (shown in the map above), and has also analyzed and mapped data on oil spills from pipelines in North Dakota. We will continue FracTracker’s coverage of Standing Rock and the Water Protectors who fought – and continue to fight – the Dakota Access Pipeline (DAPL), known as the Black Snake.
Following the Fight
For those unaware, the fight against the Dakota Access Pipeline operated by Energy Transfer Partners, continues. While the project was green-lighted by the Trump Administration and Bakken oil began flowing in June of 2017, the court has returned the permits to the U.S. Army Corps of Engineers. A U.S. District Court judge ruled that the initial approval of the pipeline did not undergo adequate study of its environmental consequences. The finding stated that the Army Corps provided a flawed model, inadequate for predicting the full impacts of a leak under Lake Oahe. The model does not consider what would happen in the event of a leak under the lake. It models only benzene — one of many toxic chemicals present in crude oil — and models its movement in an unrealistic manner. Energy Transfer Partners claims the model is conservative, but it massively underestimates the potential impacts on human health and wildlife. The Army Corps provides no plan to contain an underground leak or clean contaminated soil and groundwater under Lake Oahe.
On a related note, DAPL’s parent company, Energy Transfer Partners, said in a recent annual report that it may not have sufficient liquid assets to finance a major cleanup project and would likely pass those costs onto local landowners and federal taxpayers. Energy Transfer Partners has since filed a racketeering lawsuit seeking $300 million in damages from the Red Warrior Camp at Standing Rock.
… the agency could simply revise or update its environmental review and again conclude that no EIS (environmental impact statement) is required. If that happens, additional legal challenges are likely. The Tribe believes this court decision should trigger a full EIS, including consideration of route alternatives, just as the Obama administration proposed in December.
Normally, when a permit is issued in violation of the National Environmental Protection Act (NEPA), operations are suspended, which would have forced the DAPL to shut down while the review is conducted. Contrary to the usual protocol, on October 11, 2017 a federal judge ruled that the pipeline will remain operational pending the environmental review by the Army Corps. Standing Rock Sioux Chairman Dave Archambault II has said in a statement, however, “Just because the oil is flowing now doesn’t mean that it can’t be stopped.”
More Information and Resources
The Lakota People’s Law Project (LPLP) has been a resource to Lakota country – an area comprised of nine Indian reservation in North and South Dakota – since 2004. The LPLP supports a number of campaigns including divestment and energy justice, and has published several reports:
Special thanks to the Lakota People’s Law Project and Rachel Hallett-Ralston for the information provided.
In January of 2017, 76 Water Protectors including Chase Iron Eyes were arrested on land granted to the Standing Rock Lakota Sioux Tribe under the 1851 Treaty of Fort Laramie. Chase Iron Eyes, Lead Counsel of the Lakota People’s Law Project, has been charged with felony incitement to riot and misdemeanor criminal trespass. In the interview above, Chase Iron Eyes discusses his involvement with Standing Rock and the political pressures to make an example out of him. Read the Lakota People’s Law Project petition here.
By Kyle Ferrar, Western Program Coordinator, FracTracker Alliance
When we hear his call, we hear no mere bird. We hear the trumpet in the orchestra of evolution. He is the symbol of our untamable past, of that incredible sweep of millennia which underlies and conditions the daily affairs of birds and men…” ~ Aldo Leopold, on the Sandhill Crane, in “Marshland Elegy”
Dilbit – or diluted bitumen – is refined from the naturally-occurring tar sands deposits in Alberta, Canada. In March 2017, I applied to the Nebraska Public Service Commission for standing as an intervenor in the Commission’s consideration of TransCanada’s request for a permit to construct a pipeline transporting dilbit – a project referred to as the Keystone XL pipeline. Below are my reflections on the battle against the permitting process, and how FracTracker’s maps ensured the Sandhill Crane’s voice made it into public record.
A Pipeline’s History
The Keystone 1 pipeline carries the dilbit from Alberta, to Steele City, Nebraska, and ultimately to Port Arthur, Texas and export refineries along the Gulf Coast. The state of Montana had already approved the Keystone XL project, as had the state of South Dakota. The decision of the South Dakota Public Utilities Commission was appealed, however, and has now worked its way to the South Dakota Supreme Court, where it is pending.
Resistance to TransCanada’s oil and gas infrastructure projects is not new. Beginning in 2010, some Nebraska farmers and ranchers joined forces with tribal nations in the Dakotas, who were also fighting TransCanada’s lack of proper tribal consultation regarding access through traditional treaty territory. The indigenous nations held certain retained rights as agreed in the 1868 Fort Laramie Treaty between the United States government and the nine tribes of the Great Sioux Nation. The tribes were also protesting TransCanada’s flaunting of the National Historic Preservation Act’s protections of Native American sacred sites and burial grounds. Further, although TransCanada was largely successful in securing the easements needed in Nebraska to construct the pipeline, there were local holdouts refusing to negotiate with the company. TransCanada’s subsequent attempts to exercise eminent domain resulted in a number of lawsuits.
In January of 2015, then-President Barack Obama denied the international permit TransCanada needed. While that denial was celebrated by many, everyone also understood that a new president could well restore the international permit. Indeed, as one of his first actions in January 2017, the new Republican president signed an executive order granting the permit, and the struggle in Nebraska was reignited.
“What Waters Run Through My Veins…”
While I am a long-time resident of New York, I grew up in the Platte River Valley of South Central Nebraska, in a town where my family had and continues to have roots – even before Nebraska became a state. There was never a question in my mind that in this particular permitting process I would request status as an intervenor; for me, the matter of the Keystone XL Pipeline went far beyond the legal and political and energy policy questions that were raised and were about to be considered. It was about who I am, how I was raised, what I was taught, what waters run through my veins as surely as blood, and who my own spirit animals are, the Sandhill Cranes.
Bardaglio (age 3) and her father, along the banks of the Platte River
When we were growing up, our father told us over and over and over about why Nebraska was so green. The Ogallala Aquifer, he said, was deep and vast, and while eight states partially sat atop this ancient natural cistern, nearly all of Nebraska floated on this body. Nebraska was green, its fields stretching to the horizon, because, as our father explained, the snow runoff from the Rockies that flowed into our state and was used eleven times over was cleansed in water-bearing sand and gravel on its way to the Missouri on our eastern boundary, thence to the Mississippi, and finally to the Gulf.
I grew up understanding that the Ogallala Aquifer was a unique treasure, the largest freshwater aquifer in the world, the lifeblood for Nebraska’s agriculture and U.S. agriculture generally, and worthy of protection. I thought about the peril to the aquifer because of TransCanada’s plans, should there be a spill, and the additional threats an accident would potentially pose to Nebraska’s rivers, waterways and private wells.
The Ogallala Aquifer
Knowing that climate change is real, terrifying, and accelerating, I recognized that a warming world would increasingly depend on this aquifer in the nation’s midsection for life itself.
Migration of the Sandhill Cranes
As I thought about how I would fight the KXL, another narrative took shape rising out of my concern for the aquifer. Growing up in the South Central Platte River Valley, I – and I daresay most everyone who lives there – have been captivated by the annual migration of the Sandhill Cranes, plying the skies known as the Central Flyway. As sure as early spring comes, so do the birds. It may still be bitterly cold, but these birds know that it is time to fly. And so they do – the forward scouts appearing in winter grey skies, soon followed by some 500,000 – 600,000 thousand of them, darkening the skies, their cries deafening and their gorgeous archaeopteryx silhouettes coming in wave after wave like flying Roman Legions.
To this day, no matter where I am, the first thing in my sinews and bones when winter begins to give way is the certainty that the birds are coming, I feel them; they are back. They are roosting on the sandbars in the braided river that is the Platte and gleaning in the stubbled fields abutting it… they are home.
Scientists estimate that at least one-third of the entire North American population of Sandhill Cranes breed in the boreal forest of Canada and Alaska…
Scientists estimate that approximately 80 percent of all Sandhill Cranes in North America use a 75-mile stretch of Nebraska’s Platte River during spring migration. From March to April, more than 500,000 birds spend time in the area preparing for the long journey north to their breeding grounds in Canada and Alaska. During migration, the birds may fly as much as 400 miles in one day.
Sandhill Cranes rely on open freshwater wetlands for most of their lifecycle. Degradation of these kinds of wetland habitats is among the most pressing threats to the survival of Sandhill Cranes. (Emphasis added)
Giving Sandhill Cranes a Voice
But how could I make the point about the threat TransCanada posed to the migratory habitat of the Sandhill Cranes (and endangered Whooping Cranes, pelicans, and hummingbirds among the other thermal riders who also migrate with them)? Books, scientific papers, lectures – all the words in the world – cannot describe this ancient rite, this mysterious primal navigation of the unique pathway focusing on this slim stretch of river, when viewed from a global perspective a fragile skein in a fragile web in a biosphere in peril.
In my head I called it a river of birds in the grassland of sky. And I am so grateful to my friend, Karen Edelstein at FracTracker Alliance, for her willingness to help map and illustrate the magnificence of the migration flyway in the context of the three proposed options for the KXL pipeline.
Karen prepared two maps for me, but my favorite is the one above.
It shows an ancient, near-primordial, near-mystical event. Guided by rudders and instinct we can barely comprehend, in concert with earth’s intrinsic and exquisitely-designed balance, and as certain as a sunrise, a sunset or a moon rise, these oldest of crane species find their ways through the heavens. They hew to certainties that eclipse the greed of multinational corporations like TransCanada, who barely even pay lip service to the integrity of anything over which they can’t exert dominion. To say they don’t respect the inherent rights of species other than our own, or to ecological communities that don’t directly include us, is an understatement, and a damning comment on their values.
I was prepared for pushback on these maps from TransCanada. And in truth, the company was successful in an in limine motion to have certain exhibits and parts of my testimony stricken from the official record of the proceedings.
But not the maps.
In fact, too many other intervenors to count, as well as several of the lawyers involved in the proceedings commented to me on the beauty and accuracy of the maps. And not only are they now a part of the permanent record of the Nebraska Public Service Commission, should there be an appeal (which all of us expect), on both sides of the issue, there is a very good possibility they will be incorporated into the formal testimonies by the lawyers as the matter moves through the appeals process.
Taking Action, Speaking Out
Ordinary citizens must figure out how to confront the near-impenetrable stranglehold of multi-national corporations whose wealth is predicated on the continuance of fossil fuels as the primary sources of energy. We have had to become more educated, more activist, and more determined to fight the destruction that is now assured if we fail to slow down the impacts of climate change and shift the aggregate will of nations towards renewable energy.
Many activists do not realize that they can formally intervene at the state level in pipeline and infrastructure permitting processes. In doing so, the voice of the educated citizen is amplified and becomes a threat to these corporations whose business models didn’t account for systematic and informed resistance in public agencies’ heretofore pro forma proceedings. The publicly-available documents and filings from corporations can be important tools for “speaking truth to power” when paired with the creative tools born of necessity by the environmental movement.
Technology is value-neutral, but as I learned – as did many others in the Keystone XL Pipeline fight – in skilled hands it becomes a weapon in the struggle for the greater good.
I will be forever grateful for FracTracker, and will be interested to see how others use this tool in the fights that are sure to come.
EXCELSIOR!
For more background on the natural history of Sandhill Cranes, please view this video produced by The Crane Trust.
Wrexie Bardaglio is a Nebraska native living in Covert, New York. She worked for ten years for a member of Congress as a legislative assistant with a focus on Indian affairs and for a DC law firm as legislative specialist in Indian affairs. She left politics to open a bookstore in suburban Baltimore. She has been active in the Keystone XL fights in Nebraska and South Dakota and in fracking and gas infrastructure fights in New York.
This article’s feature image of a Sandhill Crane is the work of a U.S. Fish and Wildlife Service employee, taken or made as part of that person’s official duties. As a work of the U.S. federal government, the image is in the public domain.
FracTracker Alliance makes hundreds of maps, analyses, and photos available for free to frontline communities, grassroots groups, NGO’s, and many other organizations concerned about the industry to use in their oil and gas campaigns. To address an issue, you need to be able to see it.
However, we rely on funders and donations – and couldn’t do all of this without your help!
https://www.fractracker.org/a5ej20sjfwe/wp-content/uploads/2017/11/Sandhill-Crane-CreativeCommons-Feature.jpg400900Guest Authorhttps://www.fractracker.org/a5ej20sjfwe/wp-content/uploads/2025/09/2025-Wordmark-Logo.pngGuest Author2017-11-08 15:02:182021-04-15 15:02:07Giving Voice to the Sandhill Cranes: Place-based Arguments against Keystone XL
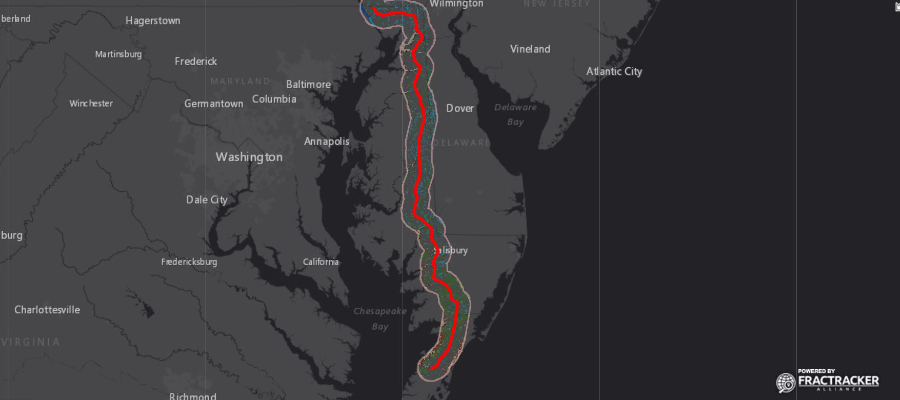
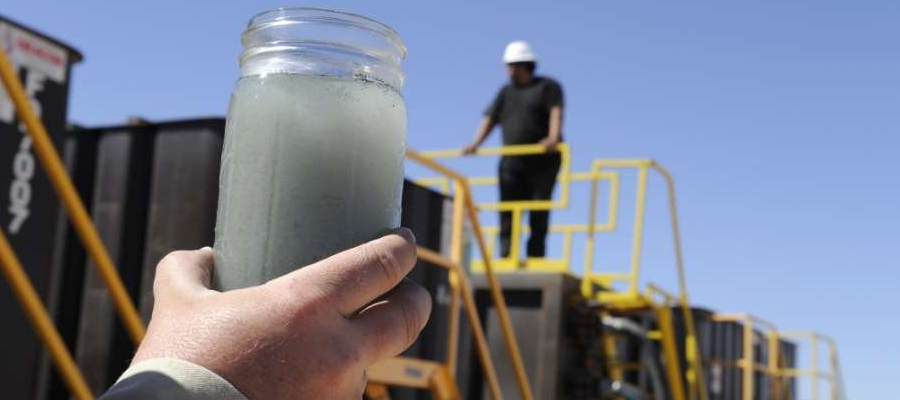
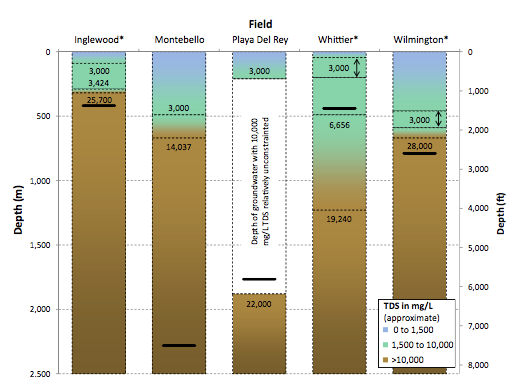
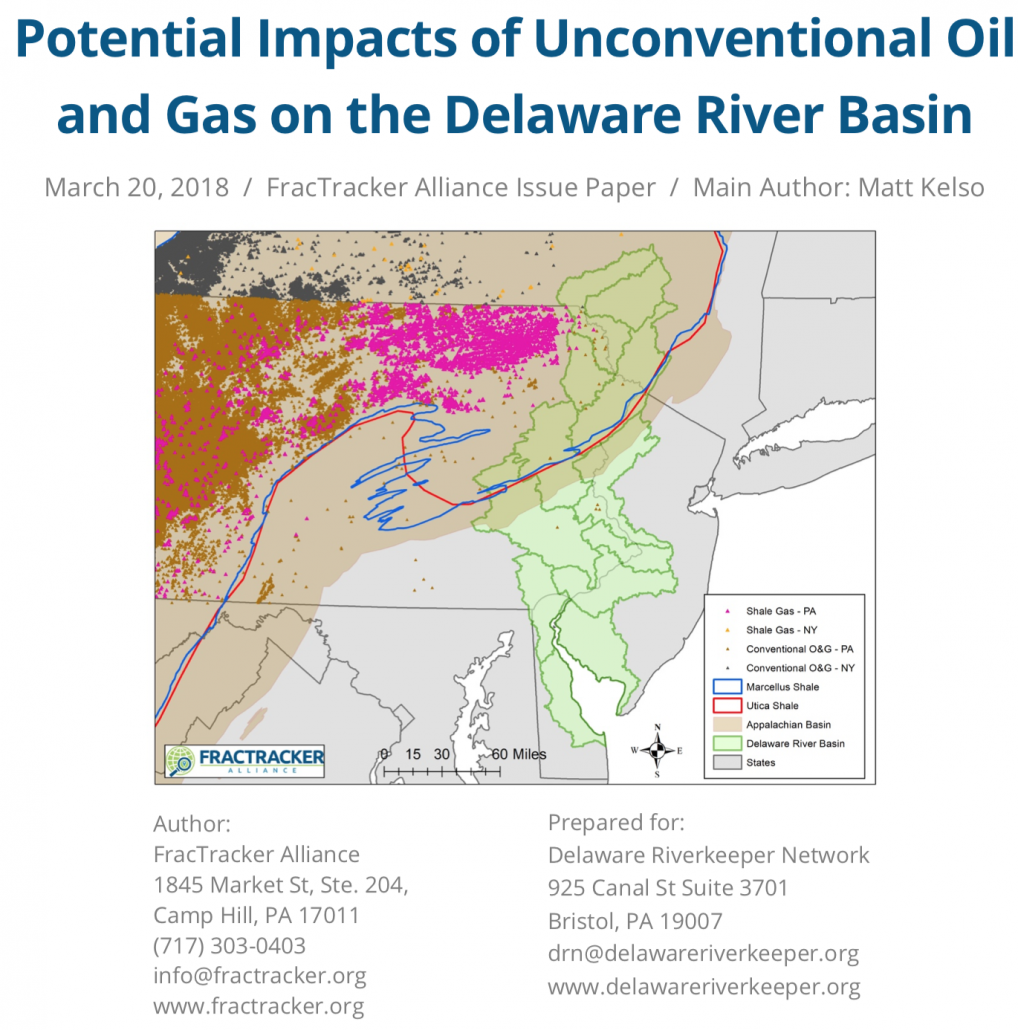
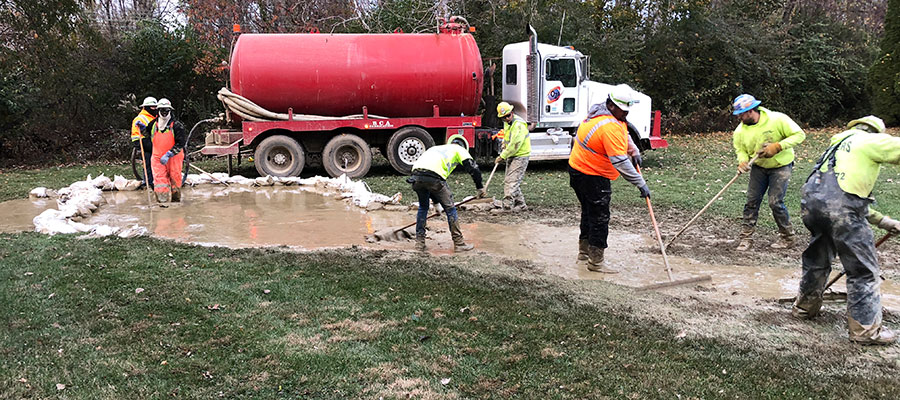


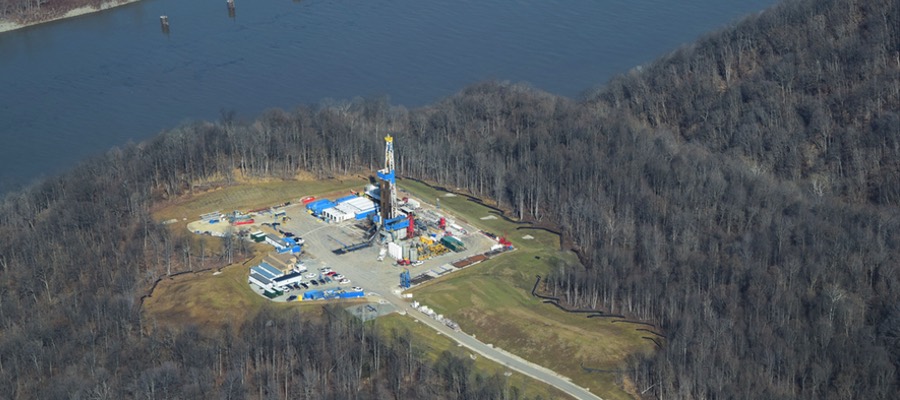
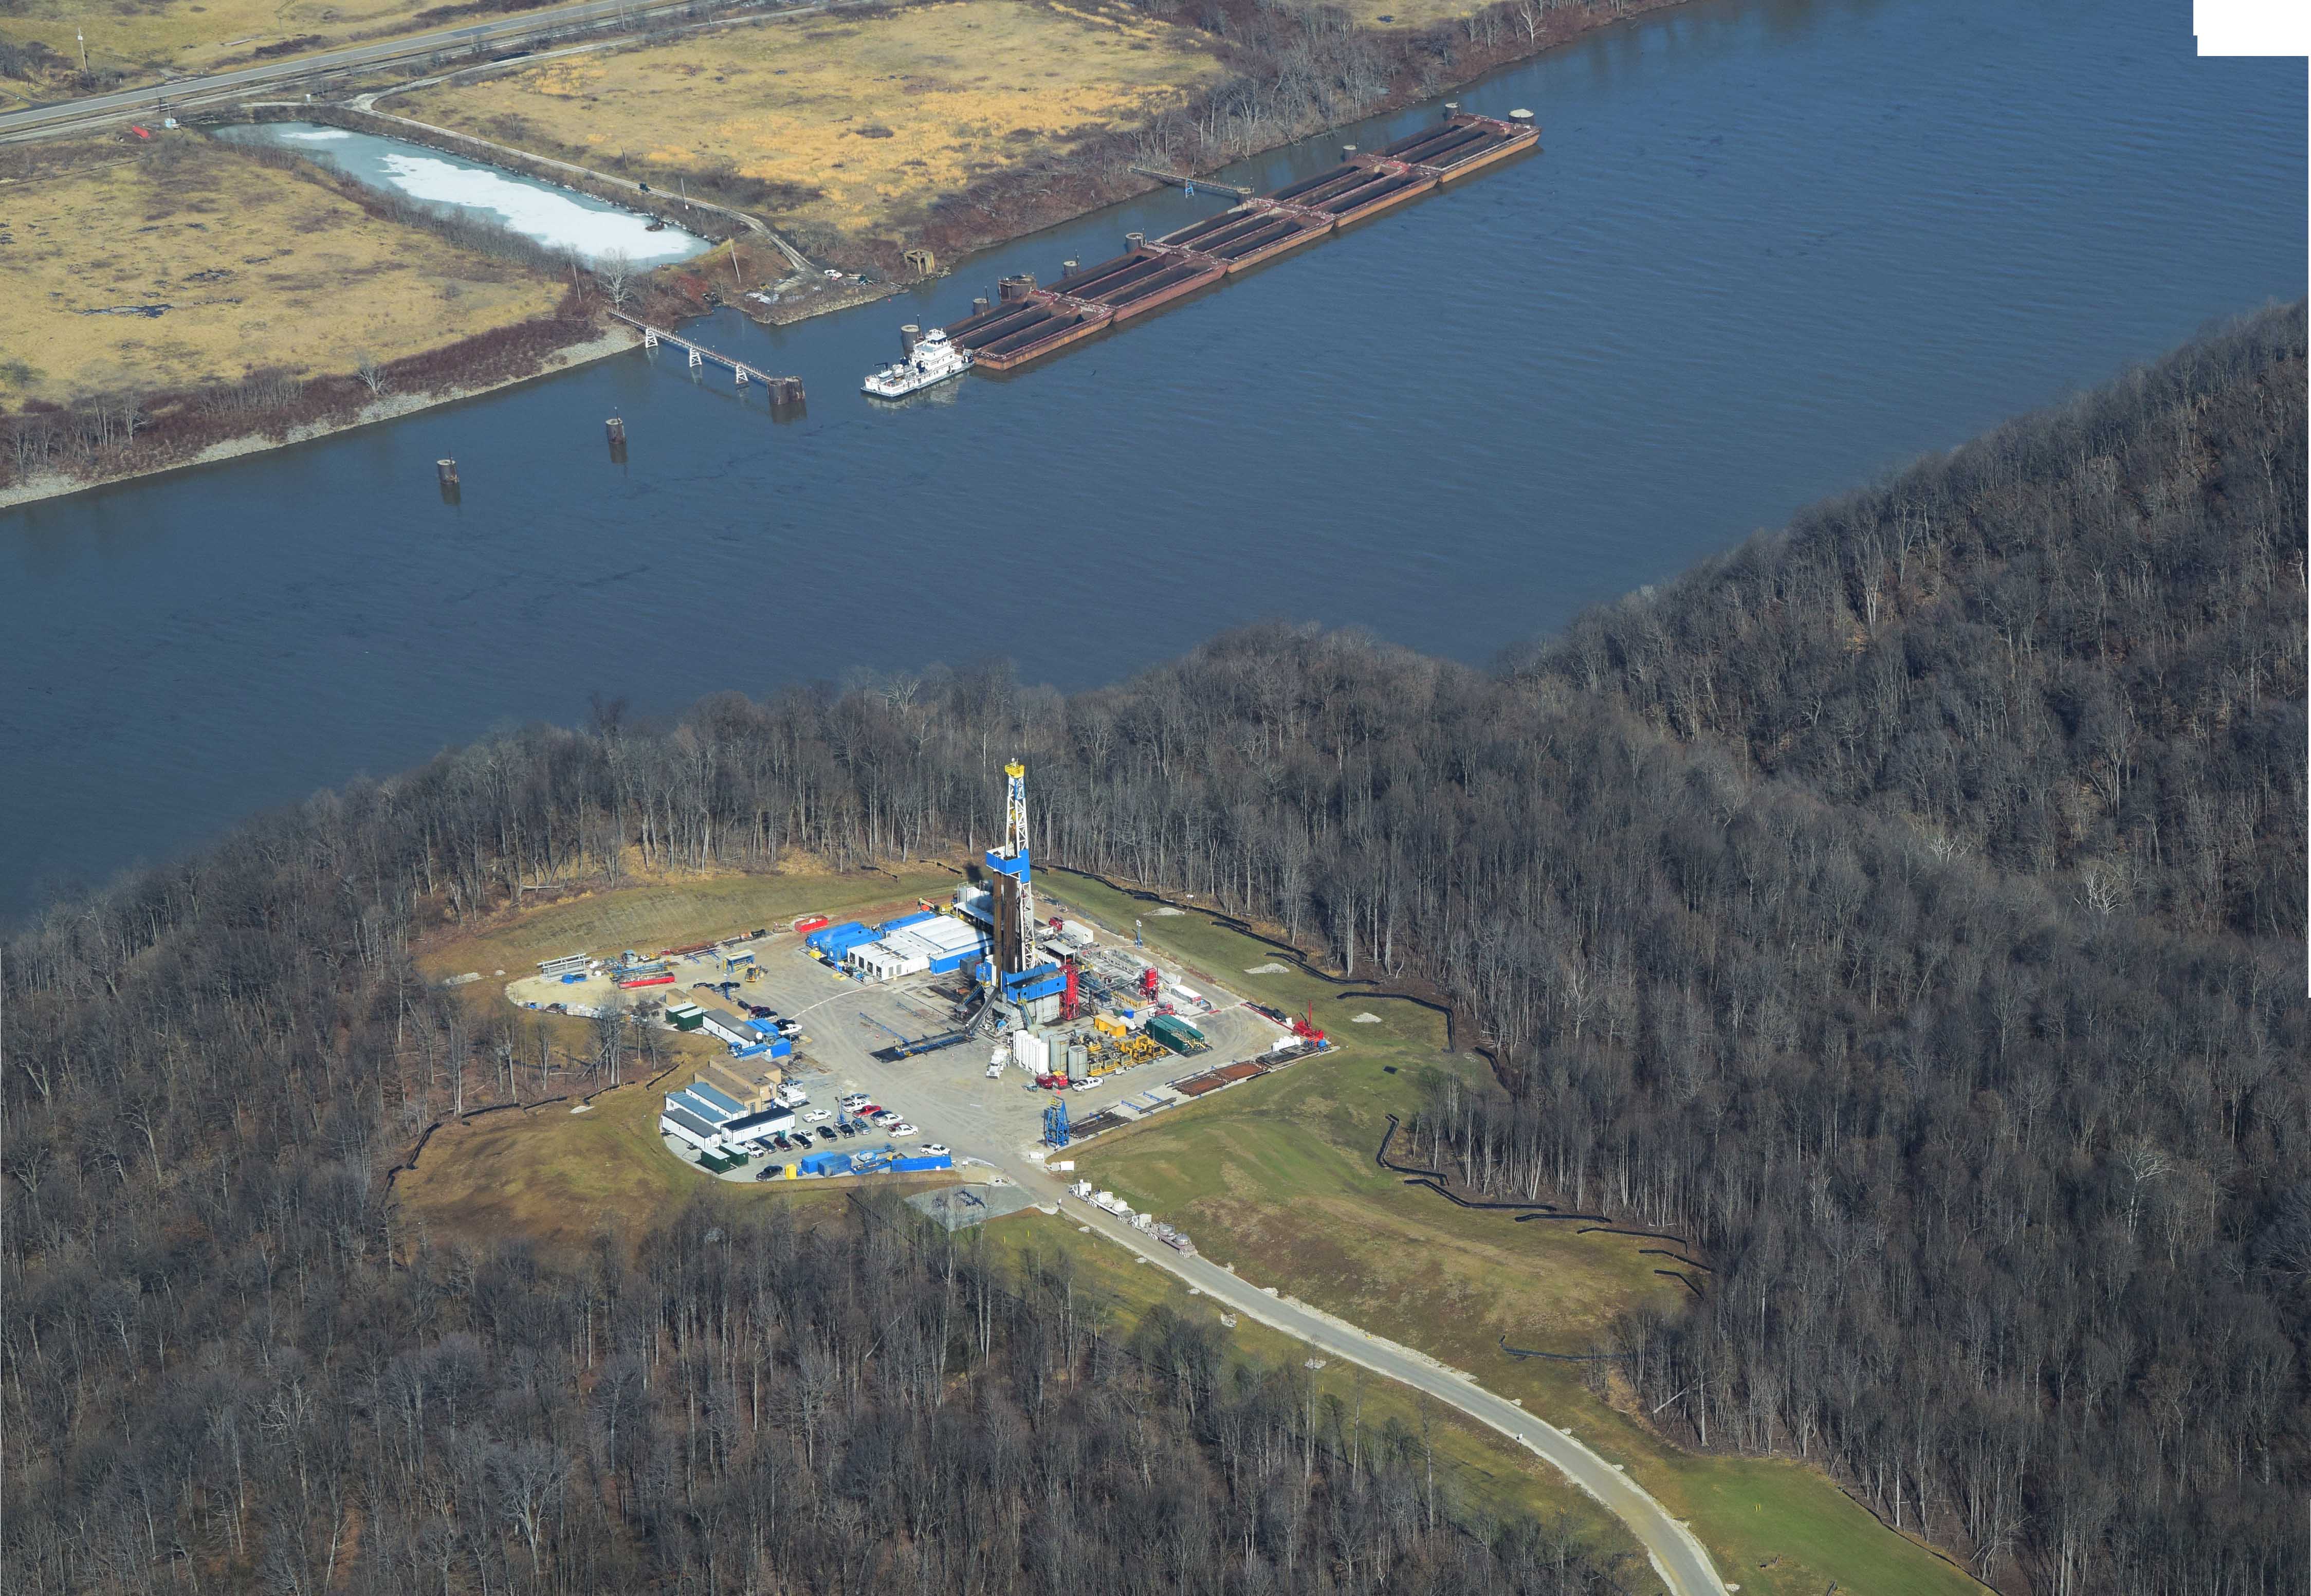


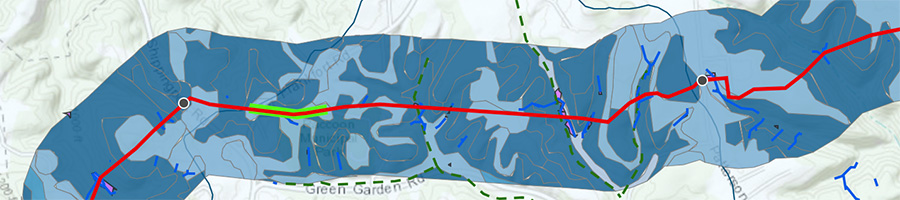


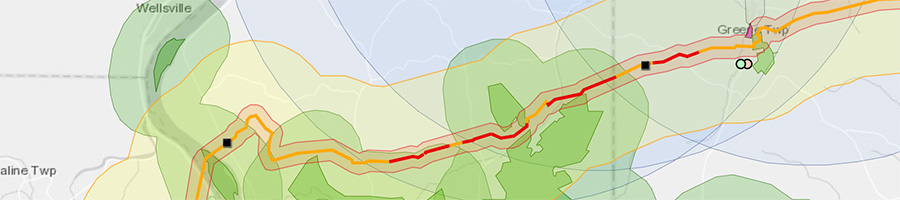


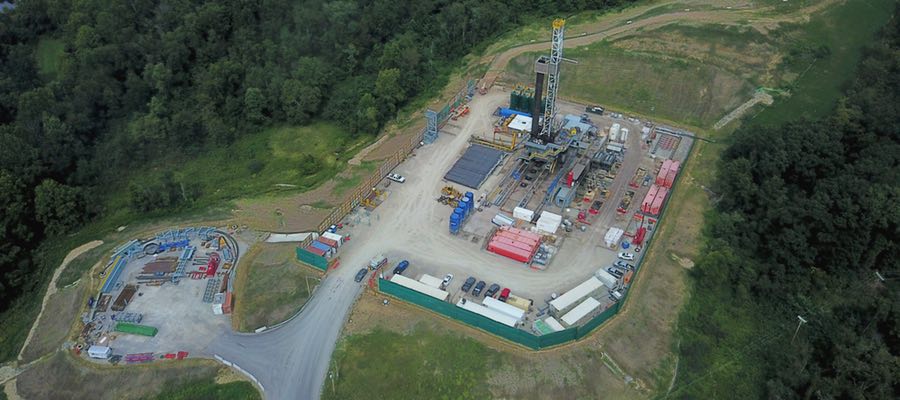
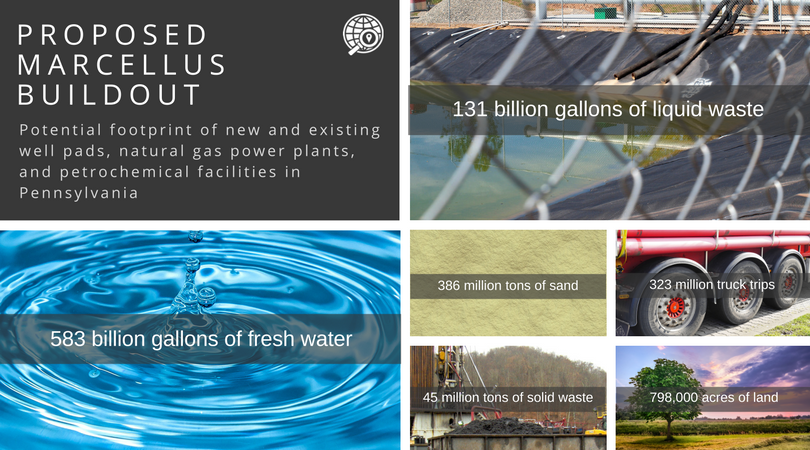
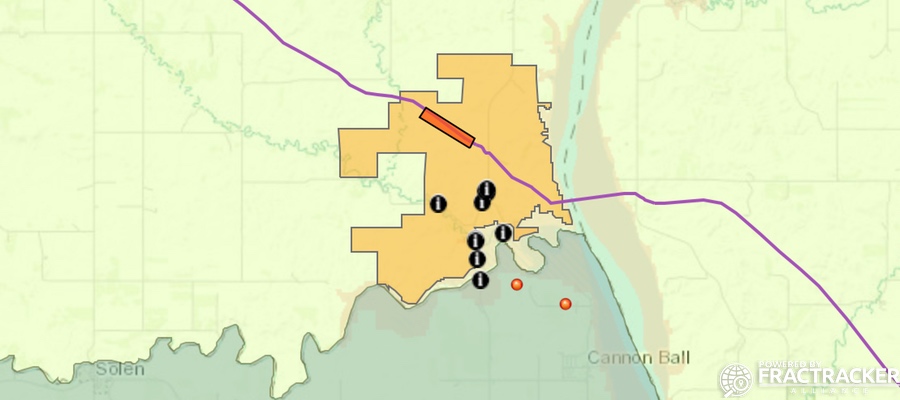


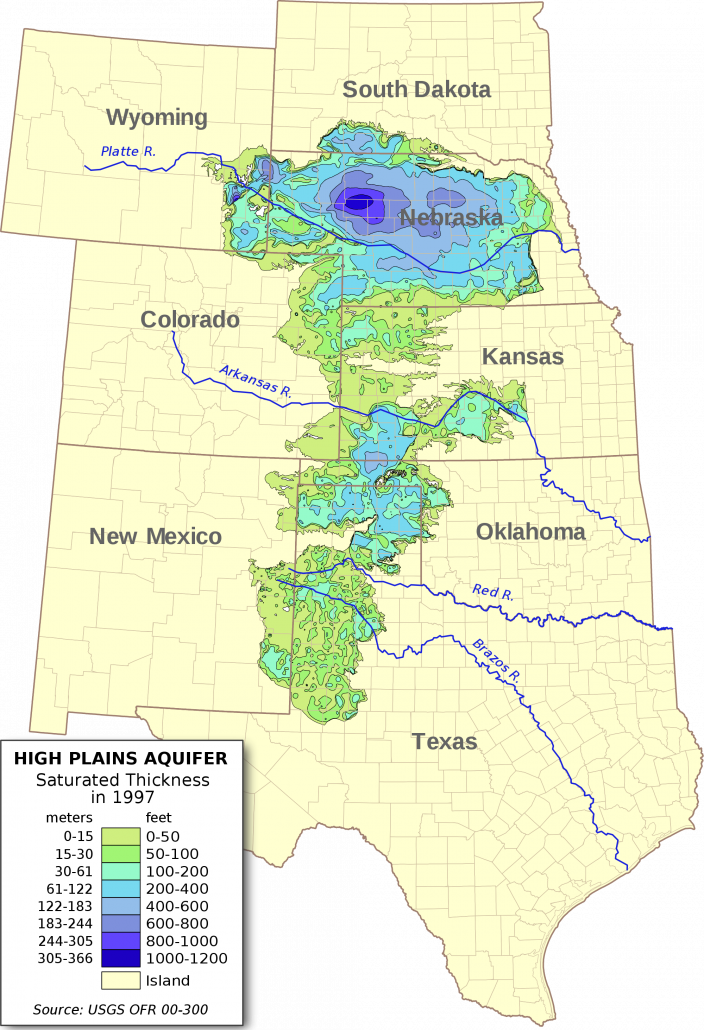

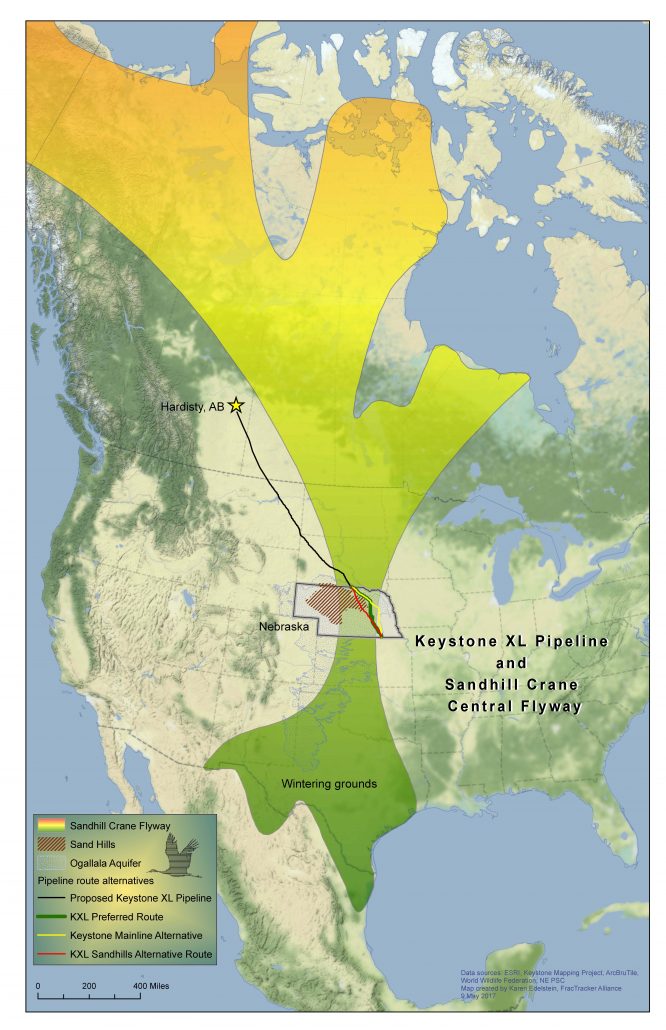
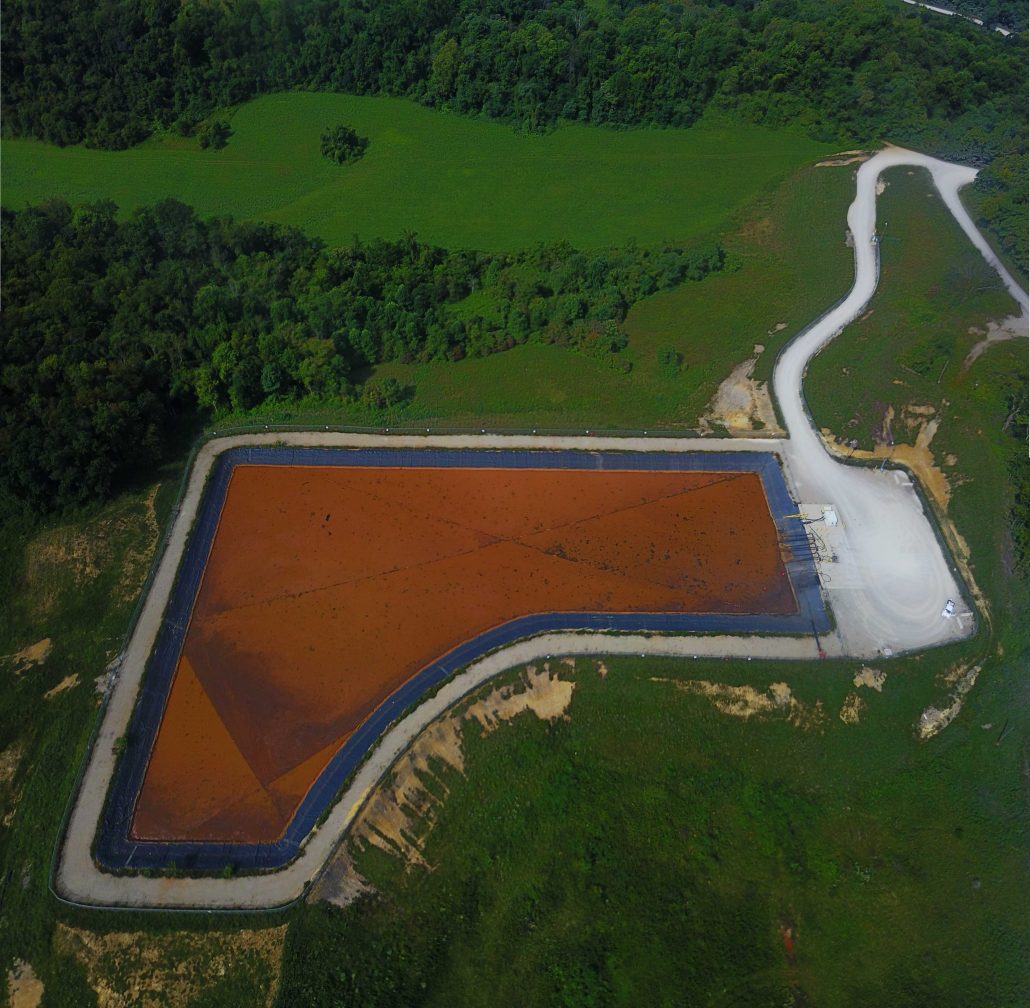
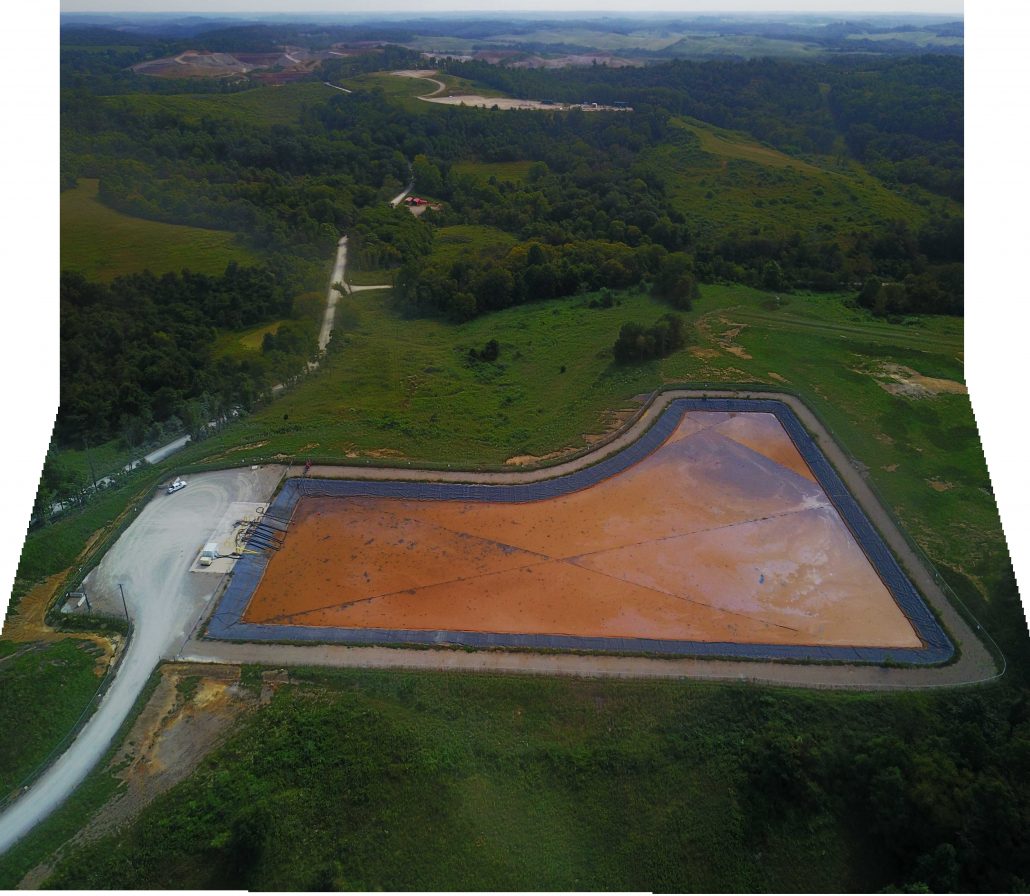
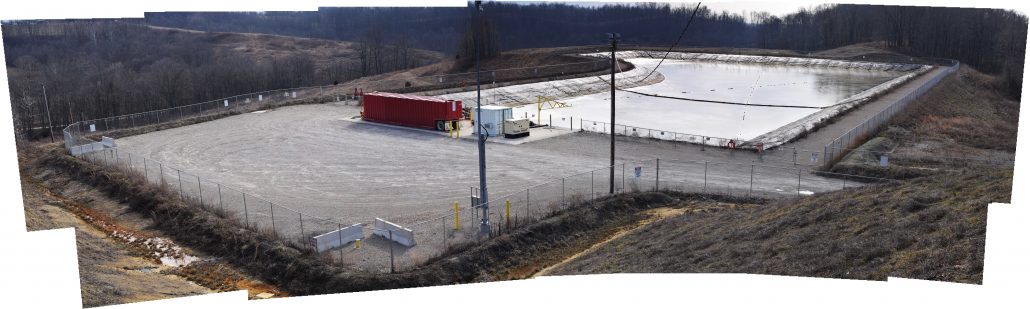
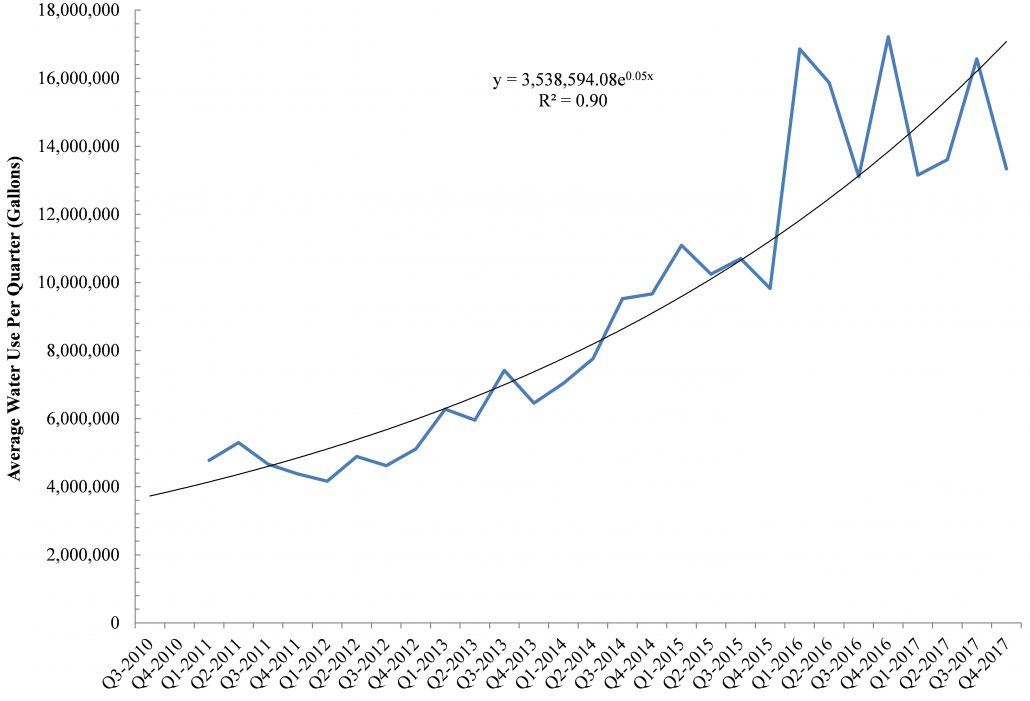
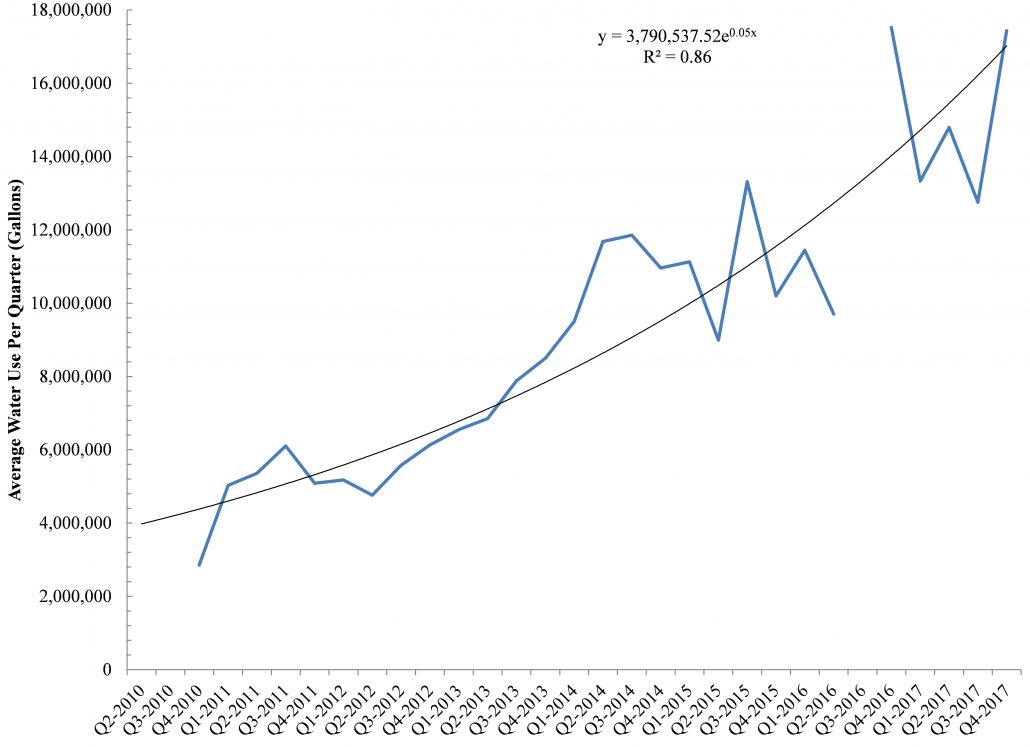
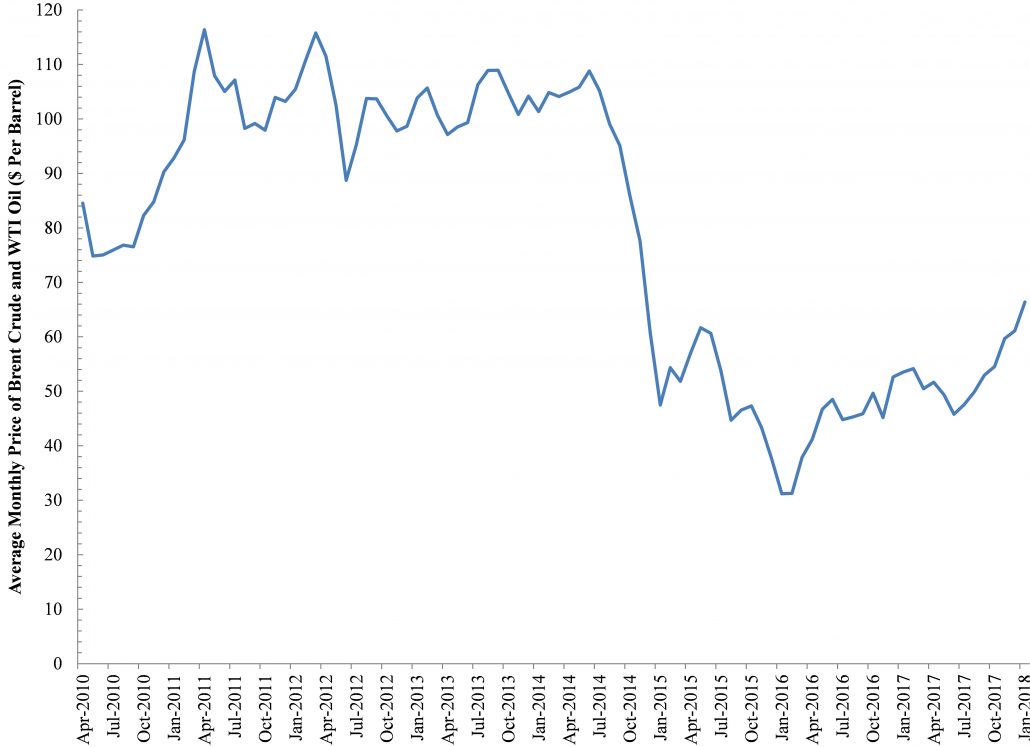