Pennsylvania’s fracking industry is producing record amounts of toxic waste — where does it all go?
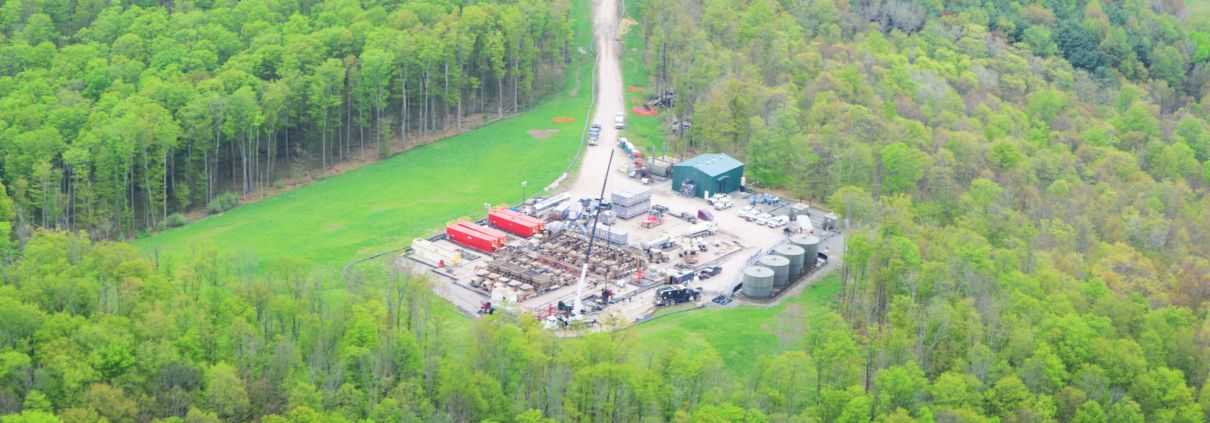
Drilling for methane and other fossil fuels is an energy-intensive process with many associated environmental costs. In addition to the gas that is produced through high volume hydraulic fracturing (“unconventional drilling,” or “fracking”), the process generates a great deal of waste at the drill site. These waste products may include several dozen tons of drill cutting at every well that is directionally drilled, in addition to liner materials, contaminated soil, fracking fluid, and other substances that must be removed from the site.
In 2018, Pennsylvania’s oil and gas industry (including both unconventional and conventional wells) produced over 2.9 billion gallons (nearly 69 million barrels) of liquid waste, and 1,442,465 tons of solid waste. In this article, we take a look at where this waste (and its toxic components) end up and how waste values have changed in recent years. We also explore how New York State, despite its reputation for being anti-fracking, isn’t exempt from the toxic legacy of this industry.
Waste that comes back to haunt us
According to a study by Physicians, Scientists and Engineers, over 80% of all waste from oil and gas drilling stays within the state of Pennsylvania. But once drilling wastes are sent to landfills, is that the end of them? Absolutely not!
Drilling waste also gets into the environment through secondary means. According to a recent report by investigative journalists at Public Herald, on average, 800,000 tons of fracking waste from Pennsylvania is sent to Pennsylvania landfills. When this waste is sent to landfills, radioactivity and other chemicals can percolate through the landfill, and are collected as leachate, which is then shipped to treatment plants.
Public Herald documented how fourteen sewage treatment plants in Pennsylvania have been permitted by Pennsylvania’s Department of Environmental Protection (PA DEP) to process and discharge radioactive wastes into more than a dozen Pennsylvania waterways.
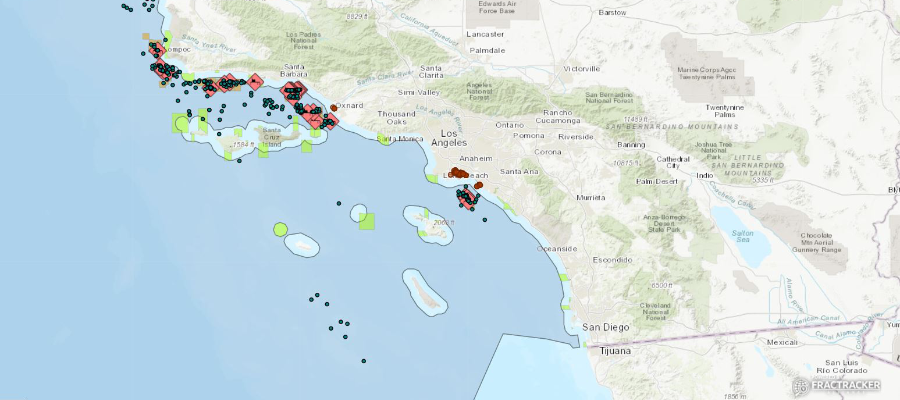
Public Herald’s article includes an in-depth analysis of the issue. Their work is supported by a map of the discharge sites, created by FracTracker.
Trends over time
Pennsylvania Department of Environmental Protection maintains a rich database of oil and gas waste and production records associated with their Oil and Gas Reporting Website. The changes in waste disposal from Pennsylvania’s unconventional drilling reveal a number of interesting stories.
Let’s look first at overall unconventional drilling waste.
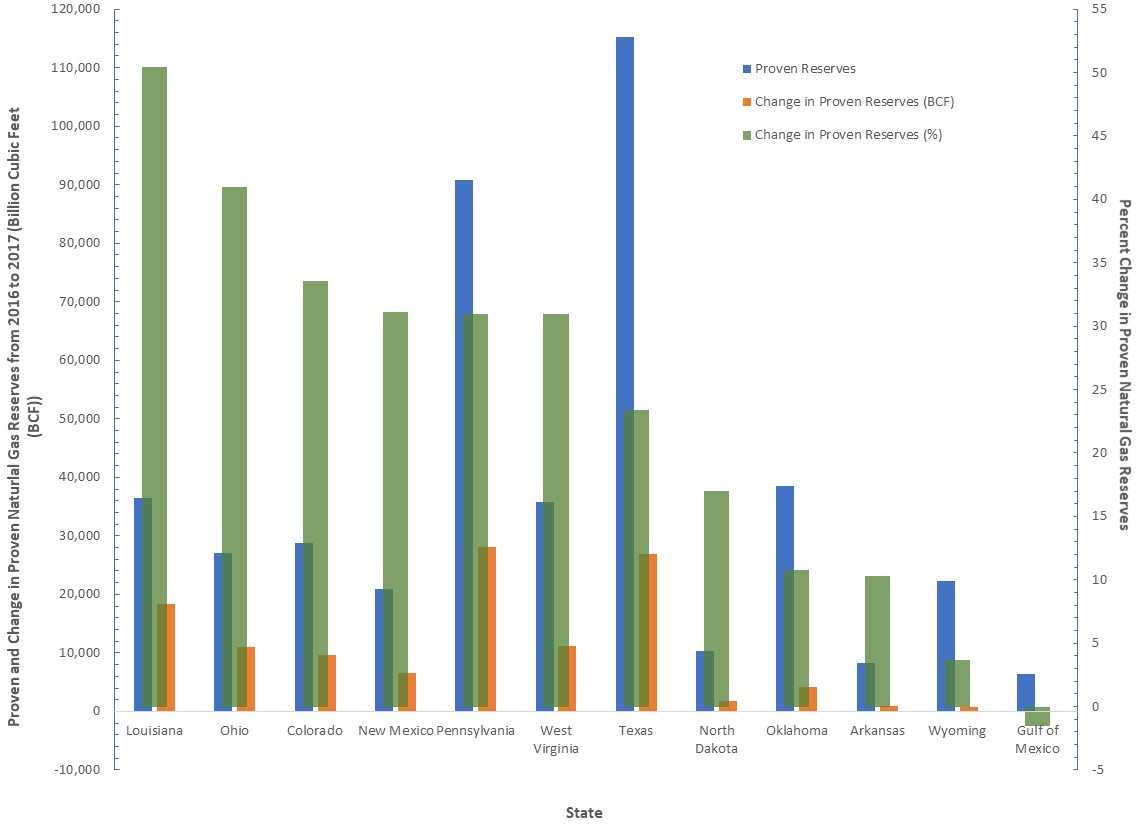
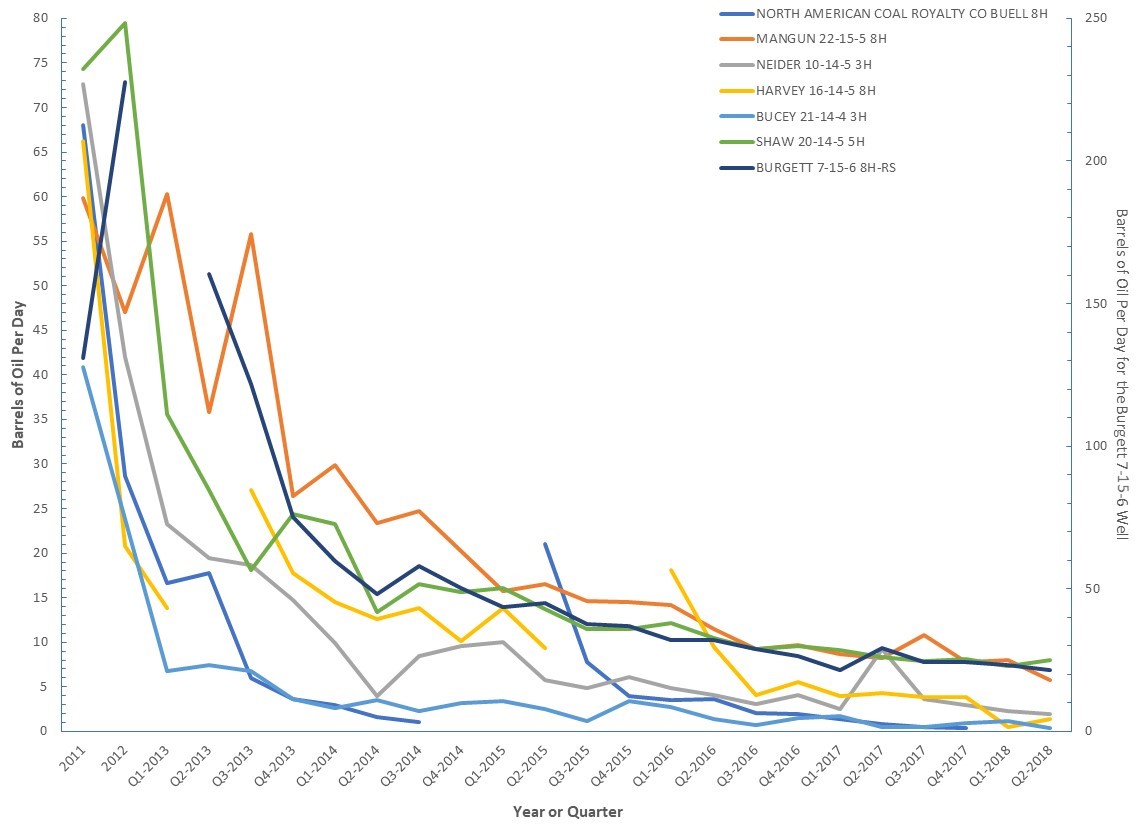
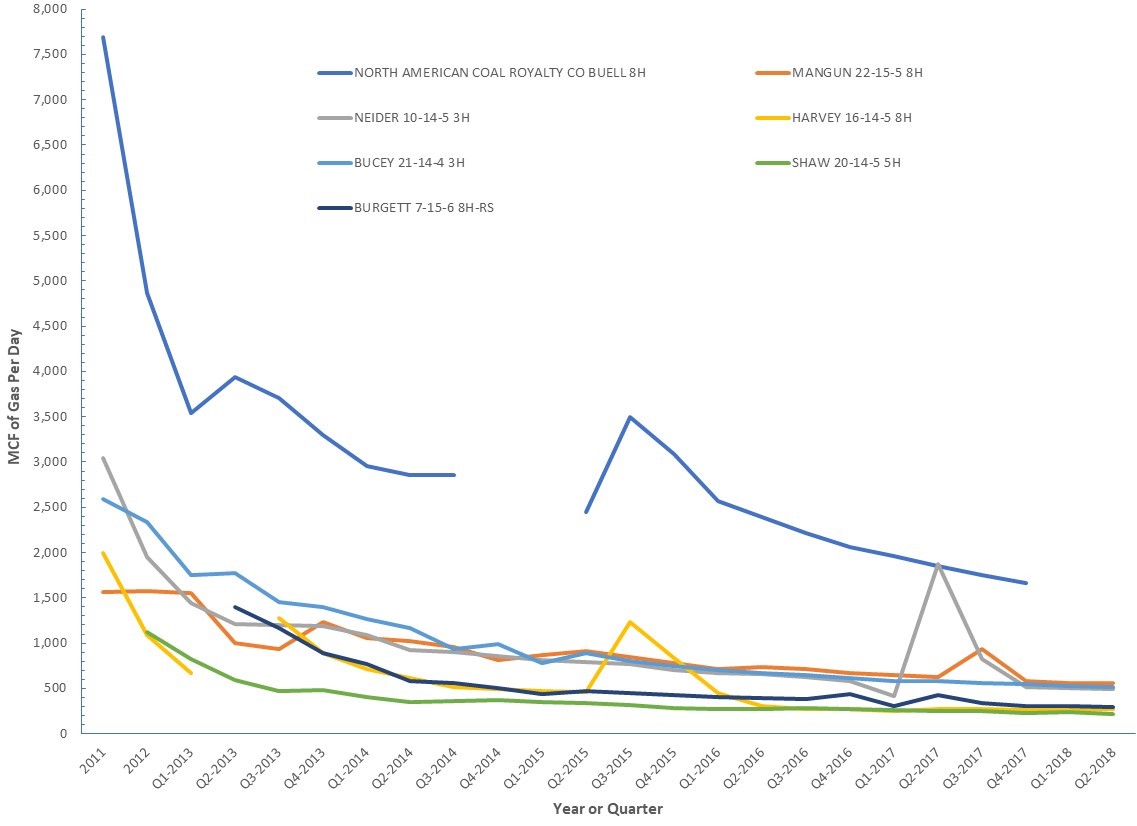
According to data from the federal Energy Information Administration, gas production in Pennsylvania began a steep increase around 2010, with the implementation of high volume hydraulic fracturing in the Marcellus Shale (see Figure 1). The long lateral drilling techniques allowed industry to exploit exponentially more of the tight shale via single well than was ever before possible with conventional, vertical drilling.
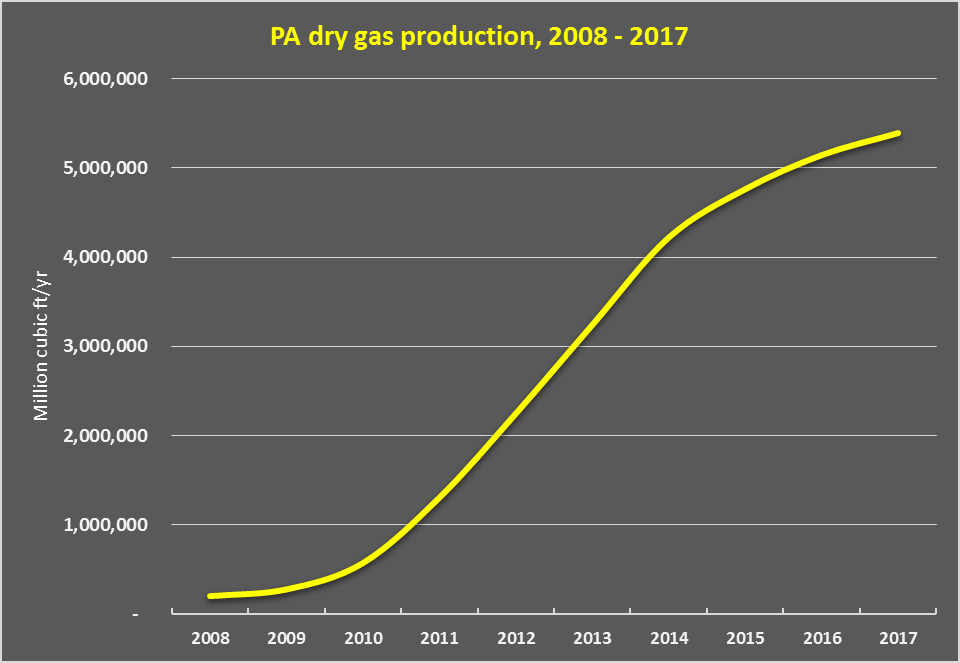
Figure 1. Data summary from FracTracker.org, based on EIA data.
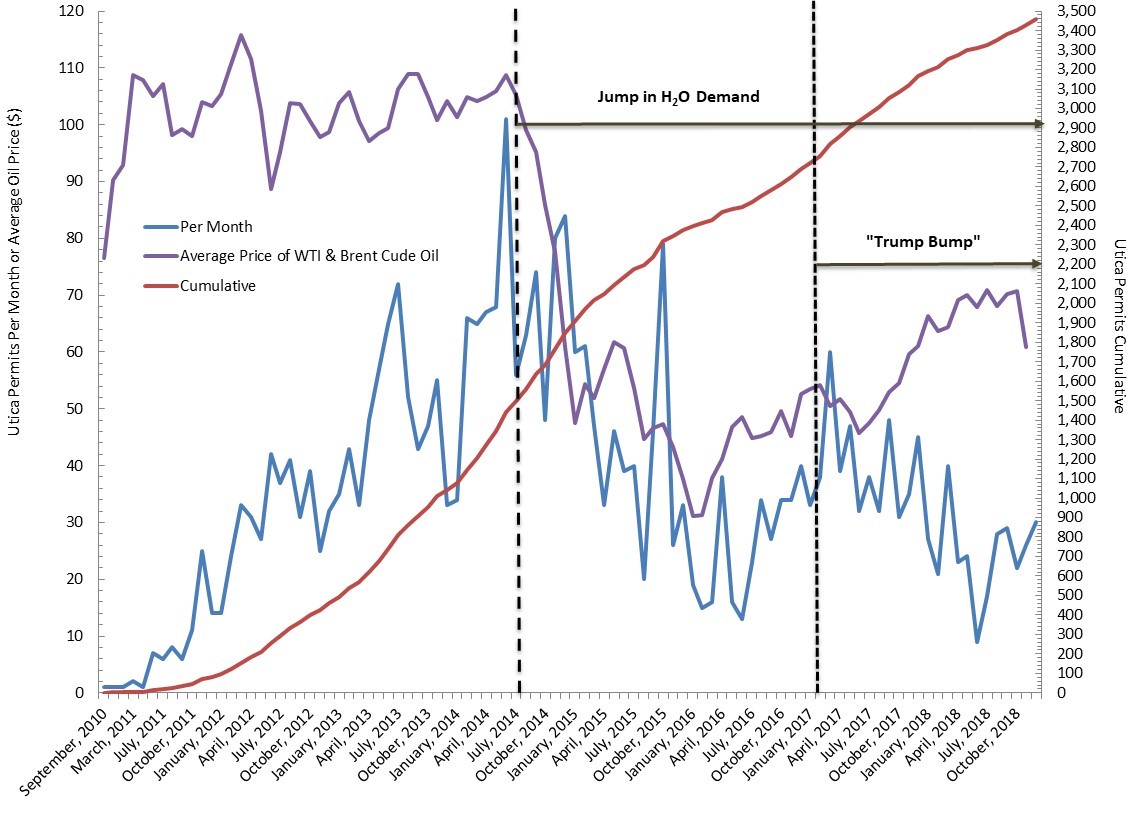
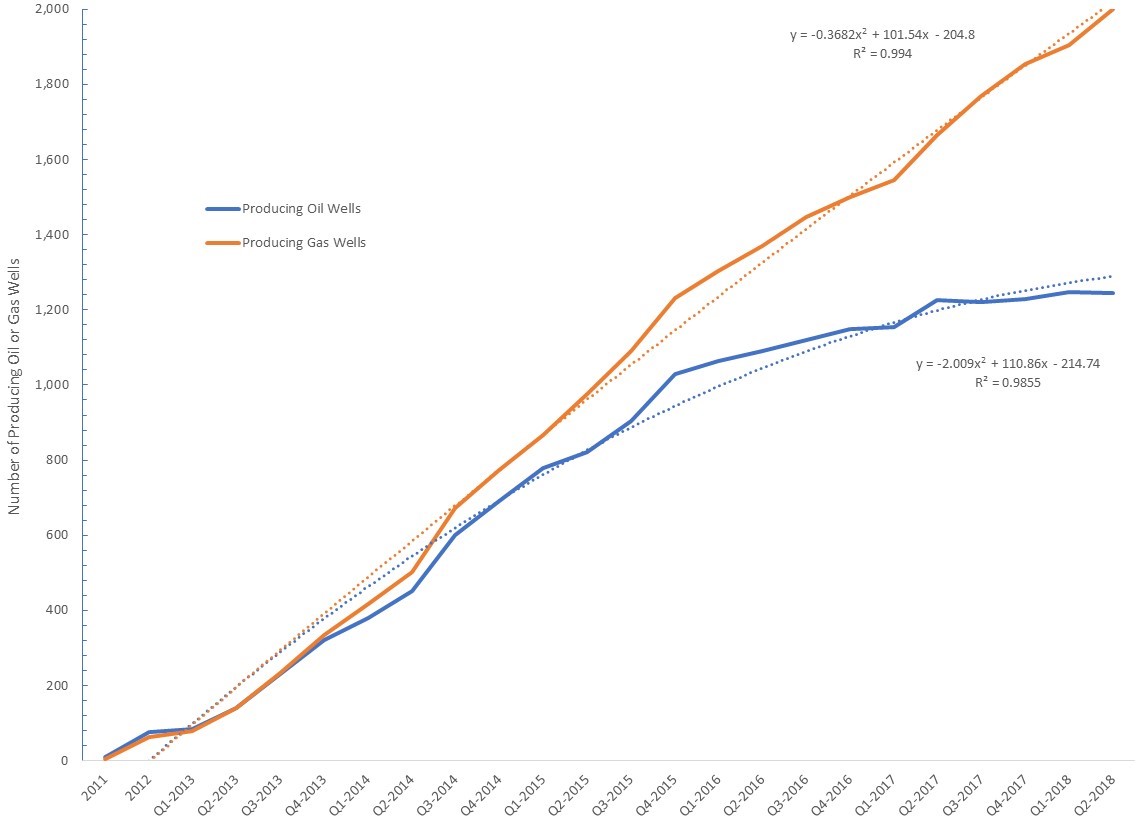
The more recently an individual well is drilled, the more robust the production. We see an overall increase in gas production over time in Pennsylvania over the past decade. Paradoxically, the actual number of new wells drilled each year in the past 4-5 years are less than half of the number drilled in 2011 (see Figure 2).
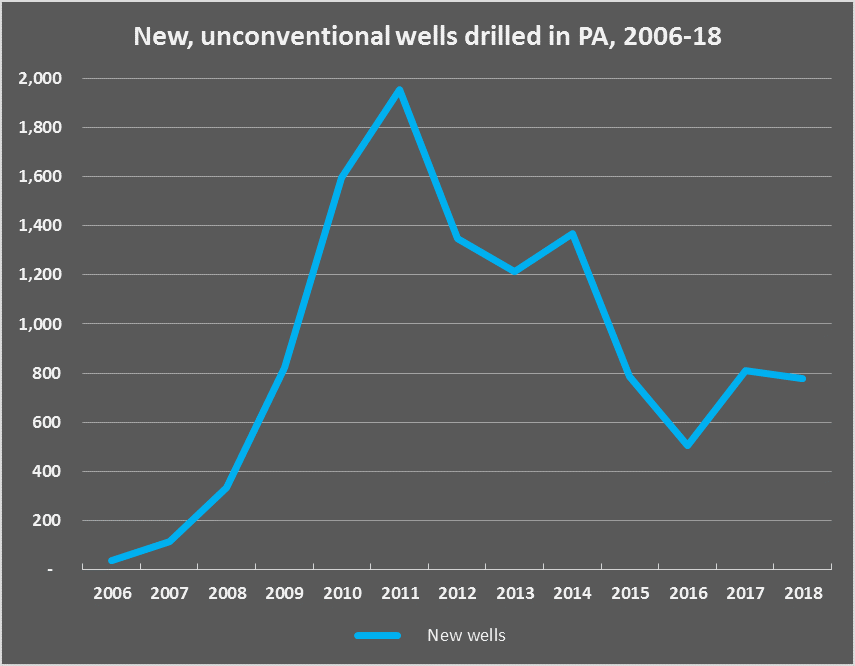
Figure 2: Data summary from FracTracker.org, based on PA DEP data
Why is this? The longer laterals —some approaching 3 miles or more—associated with new wells allow for more gas to be extracted per site.
With this uptick in gas production values from the Marcellus and Utica Formations come more waste products, including copious amounts drilling waste, “produced water,” and other byproducts of intensive industrial operations across PA’s Northern Tier and southwestern counties.
Comparing apples and oranges?
When we look at the available gas production data compared with data on waste products from the extraction process, some trends emerge. First of all, it’s readily apparent that waste production does not track directly with gas production in a way one would expect.
Recall that dry gas production has increased annually since 2006 (see Figure 1). However, the reported waste quantities from industry have not followed that same trend.
In the following charts, we’ve split out waste from unconventional drilling by solid waste in tons (Figure 3) and liquid waste, in barrels (Figure 4).

Figure 3: Annual tonnage of solid waste from the unconventional oil and gas industry, organized by the state it is disposed in. Data source: PA DEP, processed by FracTracker Alliance
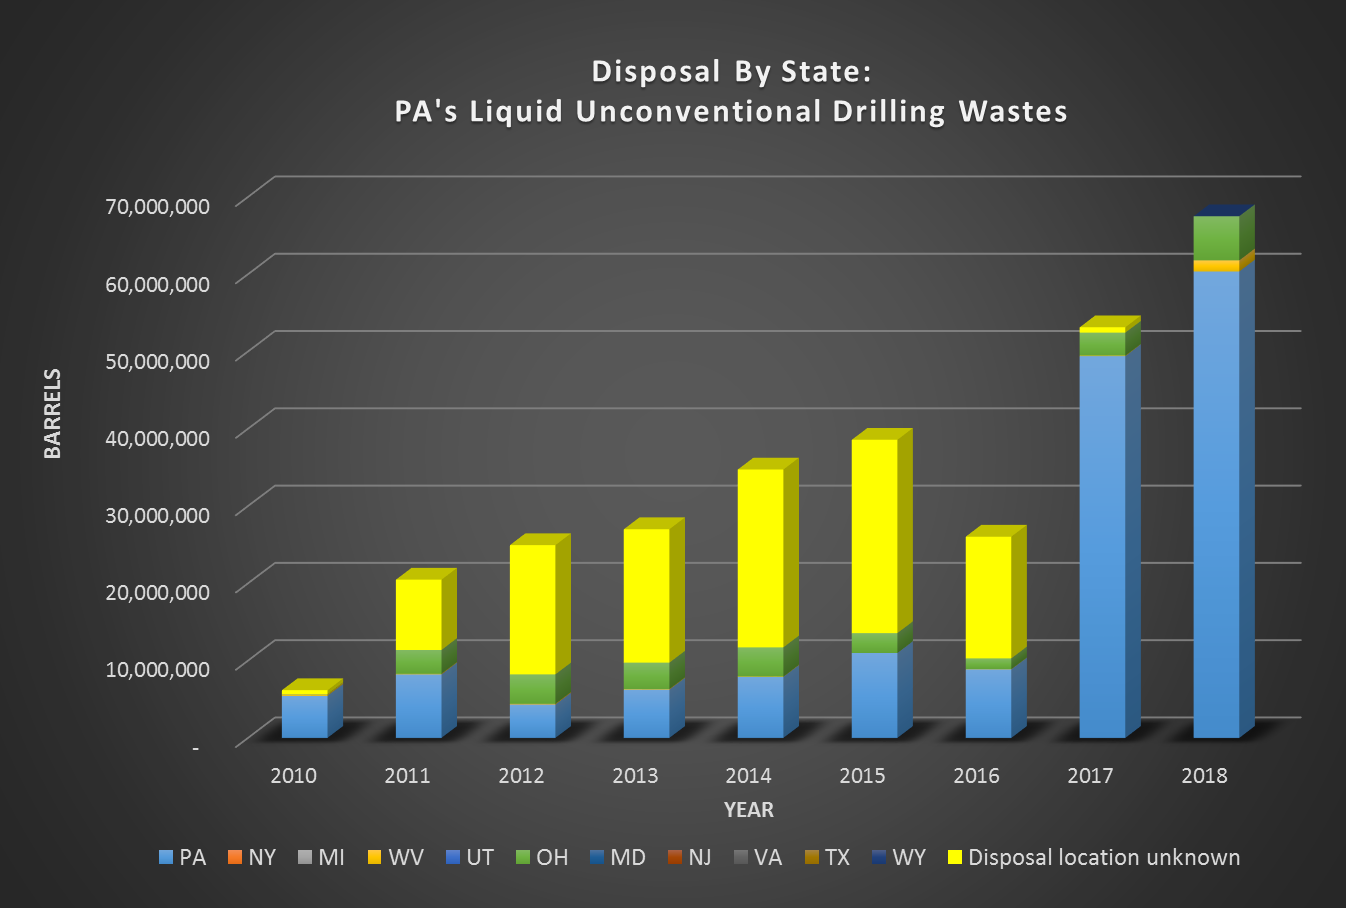
Figure 4: Annual volume of liquid waste from the unconventional oil and gas development, organized by state it is disposed in. One barrel is equivalent to 42 gallons. Data source: PA DEP, processed by FracTracker Alliance
Note the striking difference in disposal information for solid waste, compared with liquid waste, coming from Pennsylvania.
“Disposal Location Unknown”
Until just the last year, often more than 50% of the known liquid waste generated in PA was disposed of at unknown locations. The PA DEP waste report lists waste quantity and method for these unknown sites, depending on the year: “Reuse without processing at a permitted facility,” “Reuse for hydraulic fracturing,” “Reuse for diagnostic purposes,” “Reuse for drilling or recovery,” “Reuse for enhanced recovery,” and exclusively in more recent years (2014-2016), “Reuse other than road-spreading.”
In 2011, of the 20.5 million barrels of liquid waste generated from unconventional drilling, about 56% was allegedly reused on other drilling sites. However, over 9 million barrels—or 44% of all liquid waste—were not identified with a final destination or disposal method. Identified liquid waste disposal locations included “Centralized treatment plant for recycle,” which received about a third of the non-solid waste products.
In 2012, the quantity of the unaccounted-for fracking fluid waste dropped to about 40%. By 2013, the percentage of unaccounted waste coming from fracking fluid dropped to just over 21%, with nearly 75% coming from produced fluid, which is briny, but containing fewer “proprietary”—typically undisclosed—chemicals.
By 2017, accounting had tightened up further. PA DEP data show that 99% of all waste delivered to undisclosed locations was produced fluid shipped to locations outside of Pennsylvania. By 2018, all waste disposal was fully accounted for, according to DEP’s records.
In looking more closely at the data, we see that:
- Prior to 2018, well drillers did not consistently report the locations at which produced water was disposed of or reused. Between 2012 and 2016, a greater volume of unconventional liquid waste went unaccounted for than was listed for disposal in all other locations, combined.
- In Ohio, injection wells, where liquid waste is injected into underground porous rock formations, accounted for the majority of the increase in waste accepted there: 2.9 million barrels in 2017, and 5.7 million barrels in 2018 (a jump of 97%).
- West Virginia’s acceptance of liquid waste increased significantly in 2018 over 2017 levels, a jump of over a million barrels, up from only 55,000. This was almost entirely due to unreported reuse at well pads.
- In 2018, reporting, in general, appears to be more thorough than it was in previous years. For example, in 2017, nearly 692,000 barrels of waste were reused at well pads outside PA, but those locations were not disclosed. Almost 7000 more barrels were also disposed of at unknown locations. In 2018, there were no such ambiguities.
A closer look at Pennsylvania’s fracking waste shipped to New York State
Despite a reputation for being resistant to the fracking industry, for most of this decade, the state of New York has been accepting considerable amounts of fracking waste from Pennsylvania. The greatest percentage shipped to New York State is in the form of drilling waste solids that go to a variety of landfills throughout Central and Western New York.
Looking closely at the bar charts above, it’s easy to notice that the biggest recipients of Pennsylvania’s unconventional liquid drilling waste are Pennsylvania itself, Ohio, as well as a significant quantity of unaccounted-for barrels between 2011 and 2016 (“Disposal location unknown”). The data for disposal of solid waste in New York tells a different story, however. In this case, Pennsylvania, Ohio, and New York State all play a role. We’ll take a look specifically at the story of New York, and illustrate the data in the interactive map that follows.
In this map, source locations in Pennsylvania are symbolized with the same color marker as the facility in New York that received the waste from the originating well pad. In the “Full Screen” view, use the “Layers” drop down menu to turn on and off data from separate years.
View map full screen | How FracTracker maps work
Solid waste transported to New York State
From the early days of unconventional drilling in Pennsylvania, New York State’s landfills provided convenient disposal sites due to their proximity to the unconventional drilling occurring in Pennsylvania’s Northern tier of counties. Pennsylvania and Ohio took the majority of solid wastes from unconventional drilling waste from Pennsylvania. New York State, particularly between 2011-2015, was impacted far more heavily than all other states, combined (Figure 5, below).
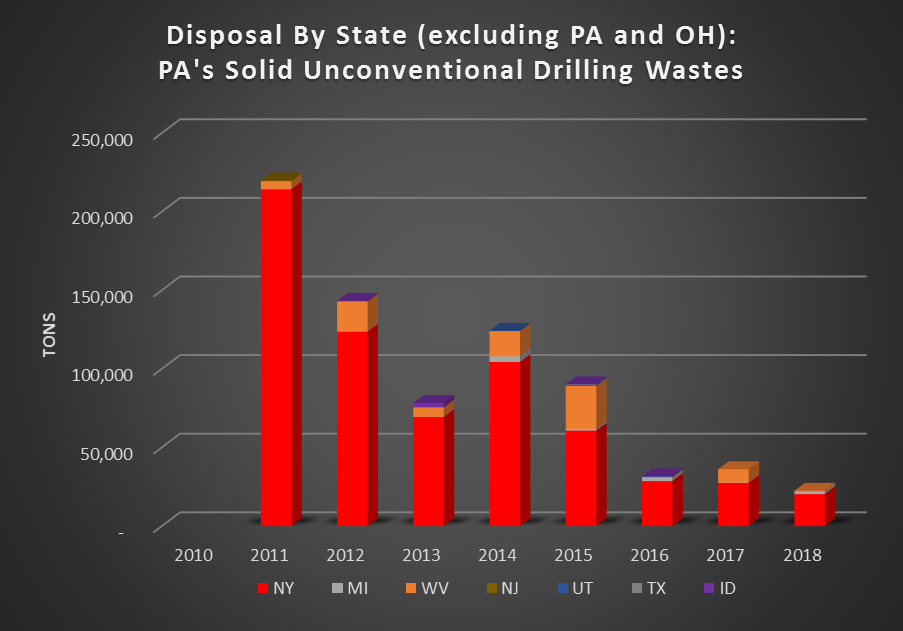
Figure 5: Known disposal locations (excluding PA and OH) of Pennsylvania’s solid waste. Data source: PA DEP, processed by FracTracker Alliance
Here’s the breakdown of locations in New York to where waste was sent. Solid waste disposal into New York’s landfills also dropped by half, following the state’s ban on unconventional drilling in 2014. Most of the waste after 2012 went to the Chemung County Landfill in Lowman, New York, 10 miles southeast of Elmira.
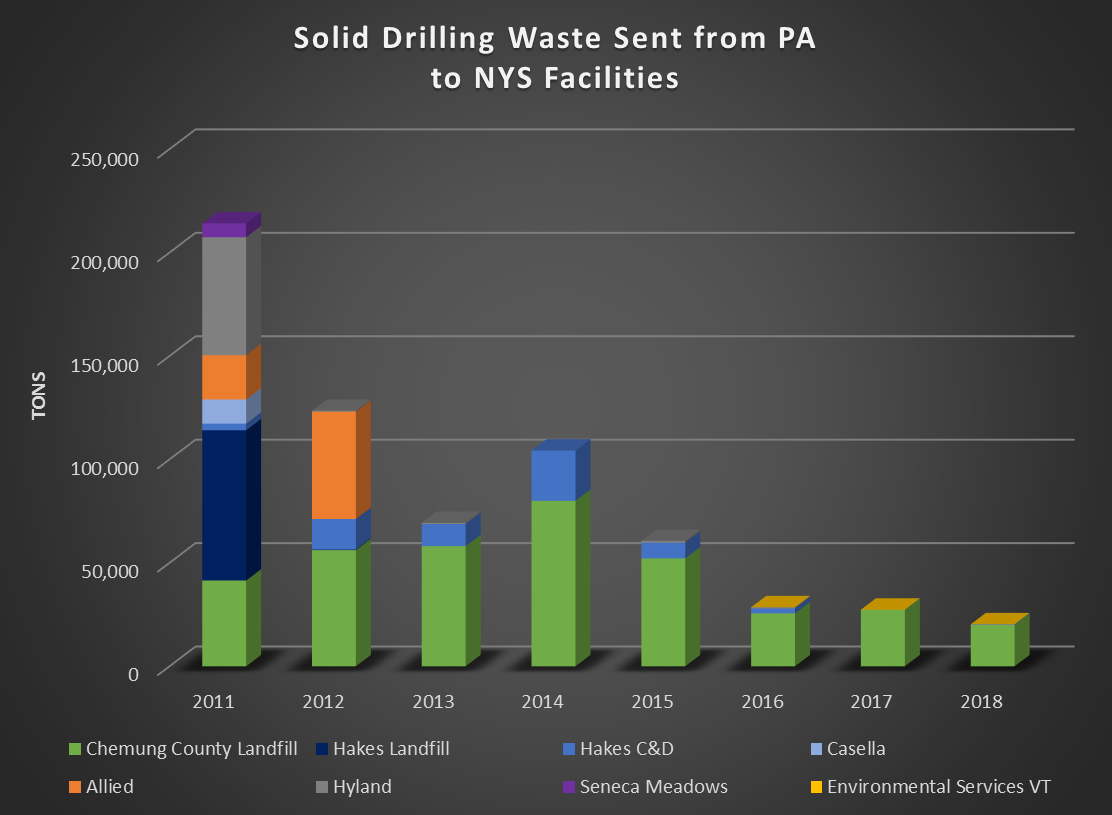
Figure 6: Solid waste from unconventional drilling, sent to facilities in NYS. Data source: PA DEP, processed by FracTracker Alliance
Is waste immobilized once it’s landfilled?
The fate of New York State’s landfill leachate that originates from unconventional drilling waste is a core concern, since landfill waste is not inert. If drilling waste contains radioactivity, fracking chemicals, and heavy metals that percolate through the landfill, and the resulting leachate is sent to municipal wastewater treatment plants, will traditional water treatment methods remove those wastes? If not, what will be the impact on public and environmental health in the water body that receives the “treated” wastewater? In Pennsylvania, for example, a case is currently under investigation relating to pollution discharges into the Monongahela River near Pittsburgh. “That water was contaminated with diesel fuels, it’s alleged, carcinogens and other pollutants,” said Rich Bower, Fayette County District Attorney.
Currently, a controversial expansion of the Hakes Landfill in Painted Post, New York is in the news. Sierra Club and others were concerned about oversight of radium and radon in the landfill’s leachate and air emissions, presumably stemming from years of receiving drill cuttings. The leachate from the landfill is sent to the Bath Wastewater Treatment plant, which is not equipped to remove radioactivity. “Treated” wastewater from the plant is then discharged into the Cohocton River, a tributary of the Chesapeake Bay. In April 2019, these environmental groups filed a law suit against Hakes C&D Landfill and the Town of Campbell, New York, in an effort to block the expansion.
Similar levels of radioactivity in leachate have also been noted in leachate produced at the Chemung County Landfill, according to Gary McCaslin, President of People for a Healthy Environment, Inc.
In recent years, much of the solid unconventional waste arriving in New York State has gone to the Chemung County Landfill (see Figure 6, above). Over the course of several years, this site requested permission to expand significantly from 180,000 tons per year to 417,000 tons per year. However, by 2016, the expansion was deemed unnecessary, and according, the plans were put on hold, in part “…because of a decline in the amount of waste being generated due to a slower economy and more recycling than when the expansion was first planned years ago.” The data in Figure 5 above also parallel this story, with unconventional drilling waste disposed in New York State dropping from over 200,000 tons in 2011 to just over 20,000 tons in 2018.
Liquid waste transported to New York State
The story about liquid unconventional drilling waste exported from Pennsylvania to states other than Ohio is not completely clear (see Figure 7, below). Note that the data indicate more than a 2000% increase in waste liquids going from Pennsylvania to West Virginia after 2017. While it has not been officially documented, FracTracker has been anecdotally informed that a great deal of waste was already going to West Virginia, but that the record-keeping prior to 2018 was simply not strongly enforced.
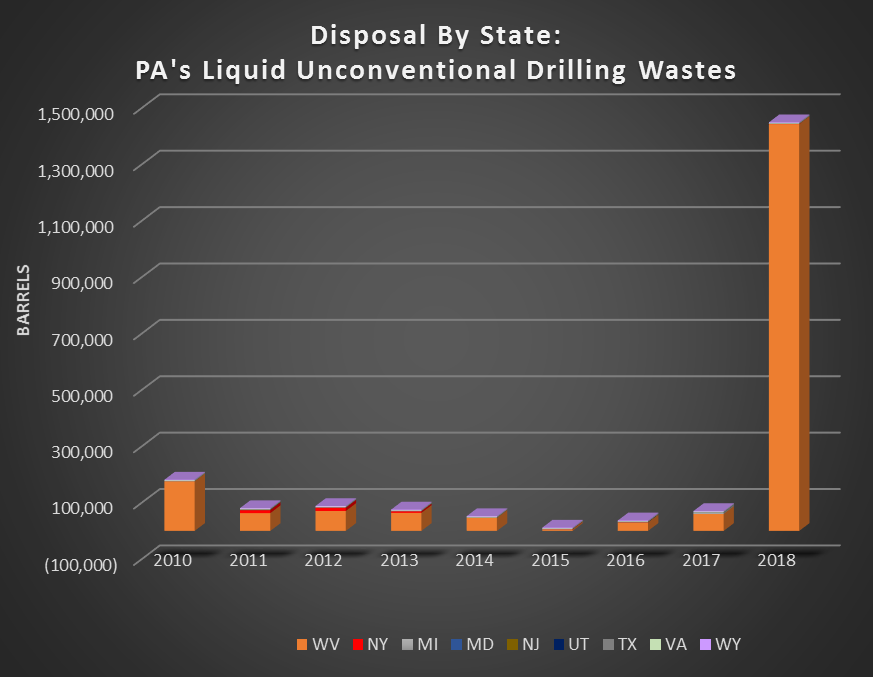
Figure 7: Known disposal locations (excluding Pennsylvania and Ohio) of Pennsylvania’s liquid waste. Data source: PA DEP, processed by FracTracker Alliance
Beginning in the very early years of the Pennsylvania unconventional fracking boom, a variety of landfills in New York State have also accepted liquid wastes originating in Pennsylvania, including produced water and flowback fluids (see Figure 8, below).
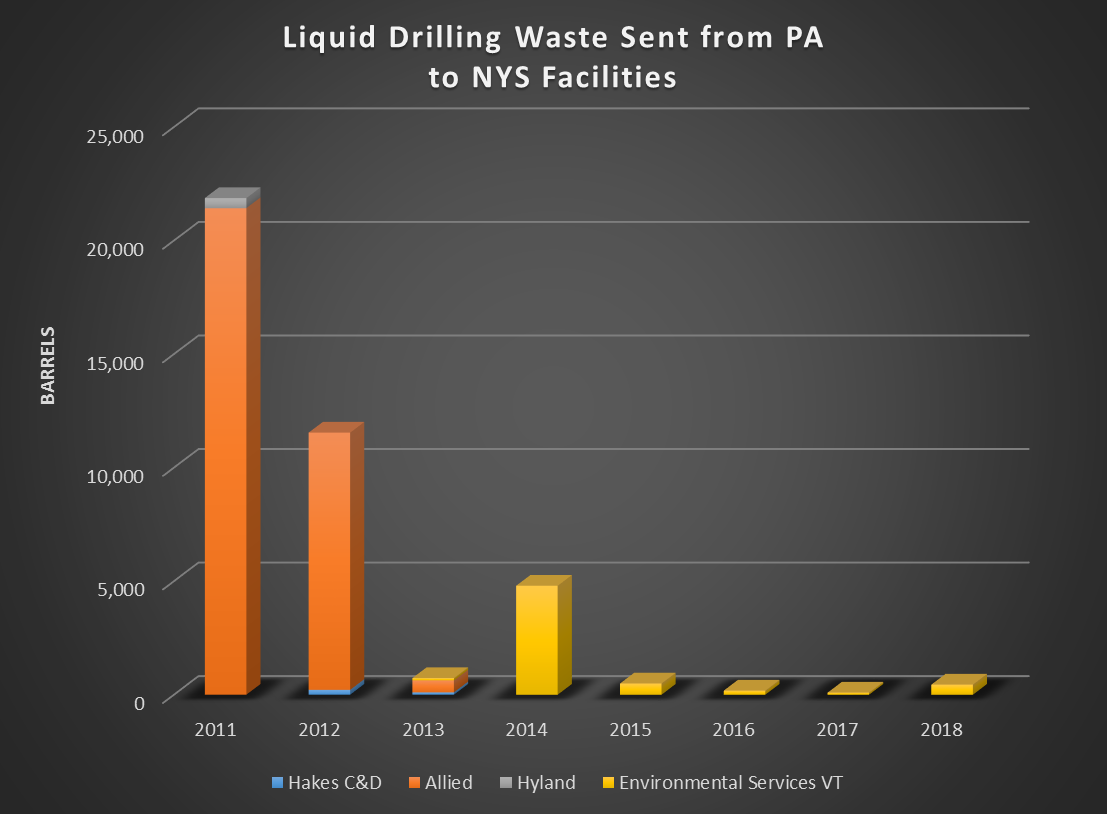
Figure 8: Liquid waste from unconventional drilling, sent to facilities in New York State. Data source: PA DEP, processed by FracTracker Alliance
In addition, while this information doesn’t even appear in the PA DEP records (which are publicly available back to 2010), numerous wastewater treatment plants did accept some quantity, despite being fully unequipped to process the highly saline waste before it was discharged back into the environment.
One such facility was the wastewater treatment plant in Cayuga Heights, Tompkins County, which accepted more than 3 million gallons in 2008. Another was the wastewater treatment plant in Auburn, Cayuga County, where the practice of accepting drilling wastewater was initially banned in July 2011, but the decision was reversed in March 2012 to accept vertical drilling waste, despite strong public dissent. Another wastewater treatment plant in Watertown, Jefferson County, accepted 35,000 gallons in 2009.
Fortunately, most New York State wastewater treatment plant operators were wise enough to not even consider adding a brew of unknown and/or proprietary chemicals to their wastewater treatment stream. Numerous municipalities and several counties banned fracking waste, and once the ban on fracking in New York State was instituted in 2014, nearly all importation of liquid unconventional drilling waste into the state ceased.
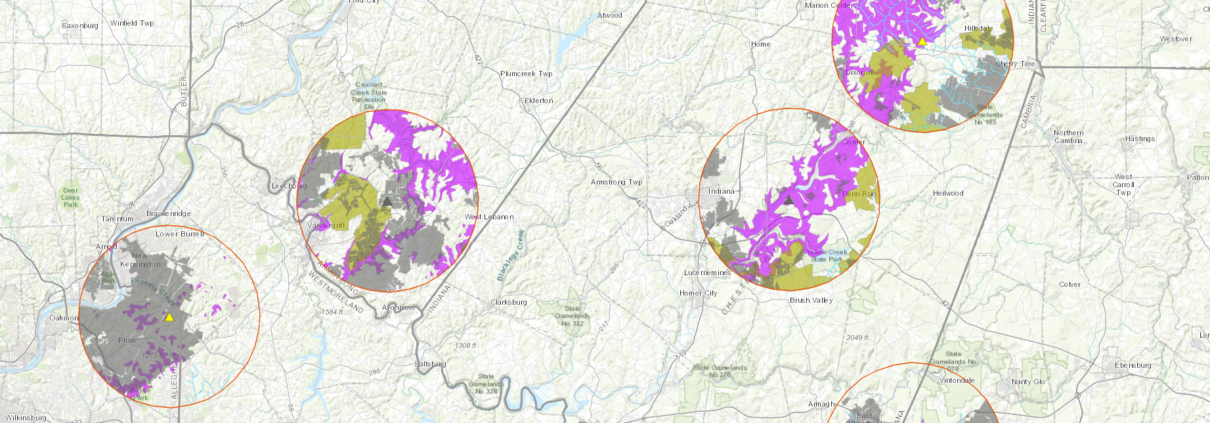
Nevertheless, conventional, or vertical well drilling also generates briny produced water, which the New York State Department of Environmental Conservation (DEC) permits communities in New York to accept for ice and dust control on largely rural roads. These so-called “beneficial use determinations” (BUDs) of liquid drilling waste have changed significantly over the past several years. During the height of the Marcellus drilling in around 2011, all sorts of liquid waste was permitted into New York State (see FracTracker’s map of affected areas) and was spread on roads. As a result, the chemicals—many of them proprietary, of unknown constituents, or radioactive—were indirectly discharged into surface waters via roadspreading.
Overall, in the years after the ban in 2014 on high volume hydraulic fracturing was implemented, restrictions on Marcellus waste coming into New York have strengthened. Very little liquid waste entered New York’s landfills after 2013, and what did come in was sent to a holding facility owned by Environmental Services of Vermont. This facility is located outside Syracuse, New York.
New York State says “no” to this toxic legacy
Fortunately, not long after these issues of fracking fluid disposal at wastewater treatment facilities in New York State came to light, the practice was terminated on a local level. The 2014 ban on fracking in New York State officially prevented the disposal of Marcellus fluids in municipal wastewater treatment facilities and required extra permits if it were to be road-spread.
In New York State, the State Senate—after 8 years of deadlock—in early May 2019, passed key legislation that would close a loophole that had previously allowed dangerous oil and gas waste to bypass hazardous waste regulation. Read the press release from Senator Rachel May’s office here. However, despite strong support from both the Senate, and the Assembly, as well as many key environmental groups, the Legislature adjourned for the 2019 session without bringing the law to a final vote. Said Elizabeth Moran, of the New York Public Interest Research Group (NYPIRG), “I want to believe it was primarily a question of timing… Sadly, a dangerous practice is now going to continue for at least another year.”
See Earthworks’ recent three part in-depth reporting on national, New York, and Pennsylvania oil and gas waste, with mapping support by FracTracker Alliance.
All part of the big picture
As long as hydrocarbon extraction continues, the issues of waste disposal—in addition to carbon increases in the atmosphere from combustion and leakage—will result in impacts on human and environmental health. Communities downstream and downwind will bear the brunt of landfill expansions, water contamination, and air pollution. Impacts of climate chaos will be felt globally, with the greatest impacts at low latitudes and in the Arctic.
Transitioning to net-zero carbon emissions cannot be a gradual endeavor. Science has shown that in order to stay under the 1.5 °C warming targets, it must happen now, and it requires the governmental buy-in to the Paris Climate Agreement by every economic power in the world.
No exceptions. Life on our planet requires it.
We have, at most, 12 years to make a difference for generations to come.
By Karen Edelstein, Eastern Program Coordinator, FracTracker Alliance
 Photo by Ted Auch, FracTracker Alliance
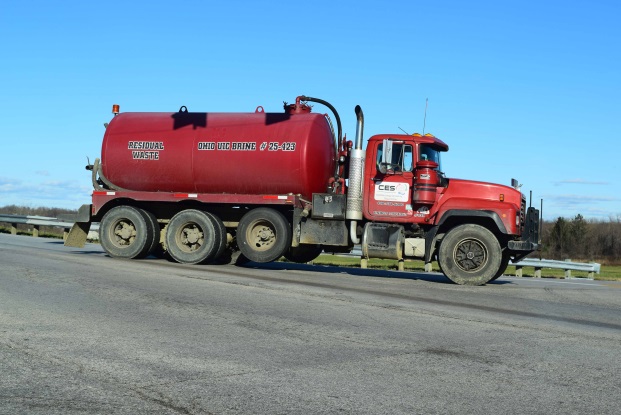


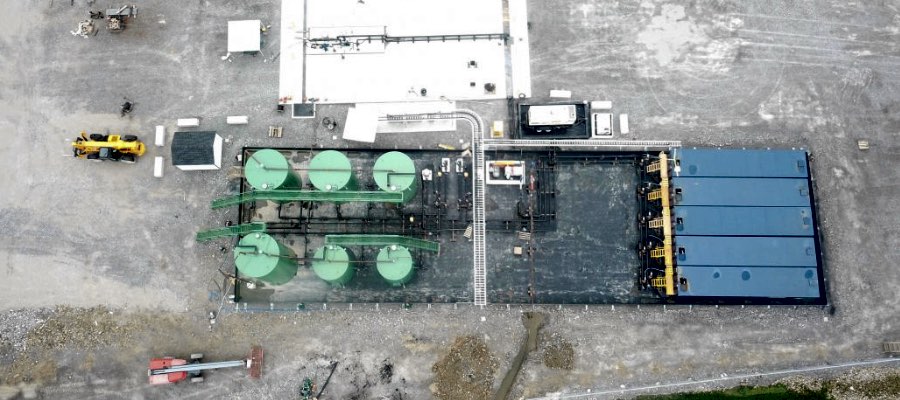


 Injection Well under construction, Brookfield, Ohio")
 Injection Well construction entrance, Brookfield, Ohio")
 Injection Well under construction, Brookfield, Ohio")


 Injection Well under construction, Brookfield, Ohio")
 Injection Well under construction, Brookfield, Ohio")