Organic farms near drilling activity in the U.S. and Ohio
The US Food, Energy, Water Interface Examined
By Ted Auch, Great Lakes Program Coordinator
With the emergence of concerns about the Food, Energy, Water (FEW) intersection as it relates to oil and gas (O&G) expansion, we thought it was time to dig into the numbers and ask some very simple questions about organic farms near drilling. Below is an analysis of the location and quantity of organic farms with heavy drilling activity in Ohio and nationally. Organic farms rely heavily on the inherent/historical quality of their soils and water, so we wanted to understand whether and how these businesses closest to O&G drilling are being affected.
Key Findings:
- Currently 11% of US organic farms are within US O&G Regions of Concern (ROC). However, this number has the potential to balloon to 15-31% if our respective shale plays and basins are exploitated, either partially or in full,
- 68-74% of these farms produce crops in states like California, Ohio, Michigan, Pennsylvania, and Texas,
- Issues such as soil quality, watershed resilience, and water rights are likely to worsen over time with additional drilling.
Methods
To answer this broad question, we divided organic farms in the United States into three categories, depending on whether they were within the:
- Core (O&G Wells < 1 mile from each other),
- Intermediate (1-3 miles between O&G Wells), or
- Periphery (3-5 miles between O&G Wells) of current activity or Regions of Concern (ROC).1
Additionally, from our experience looking at O&G water withdrawal stresses within the largely agrarian Muskingum River Watershed in OH we decided to add to the ROCs. To this end we worked to identify which sub-watersheds (5-10 miles between O&G Wells) and watersheds (10-20 miles between O&G Wells) might be affected by O&G development.
Together, distance from wells and density of development within particular watersheds make up the 5 Regions of Concern (ROCs) (Table 1).
Table 1. Five ROCs under this investigation and what they look like from a mapping perspective
| Label | Distance Between Wells | Mapping Visual |
| Core | < 1 mi |  |
| Intermediate | 1-3 mi | |
| Periphery | 3-5 mi |  |
| Sub-Watershed | 5-10 mi | 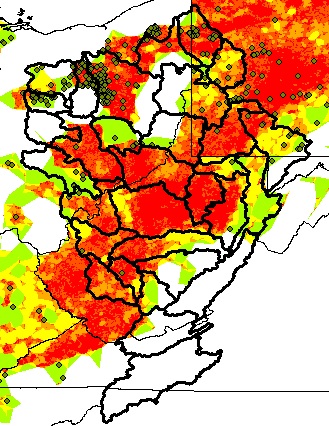 |
| Watershed | 10-20 mi |
We generated a dataset of 19,515 US organic farms from the USDA National Organic Program (NOP) by using the Geocode Address function in ArcGIS 10.2, which resulted in a 100% match for all farms.2
We also extracted soil order polygons within the above 5 ROCs using the NRCS’ STATSGO Derived Soil Order3 dataset made available to us by Sharon Whitmoyer at the USDA-NRCS-NSSC-Geospatial Research Unit and West Virginia University. For those not familiar with soil classification, soil orders are analogous to the kingdom level within the hierarchy of biological classification. Although, in the case of soils there are 12 soil orders compared to the 6 kingdoms of biology.
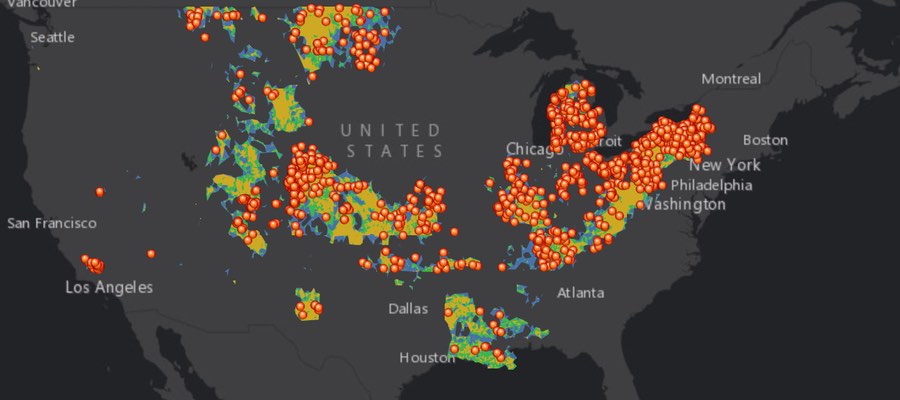
The National Organic Farms Map
This map shows organic farms across the U.S. that are located within the aforementioned ROCs. Data include certifying agent, whether or not the farm produces livestock, crops, or wild crops along with contact information, farm name, physical address, and specific products produced. View map fullscreen
National Numbers
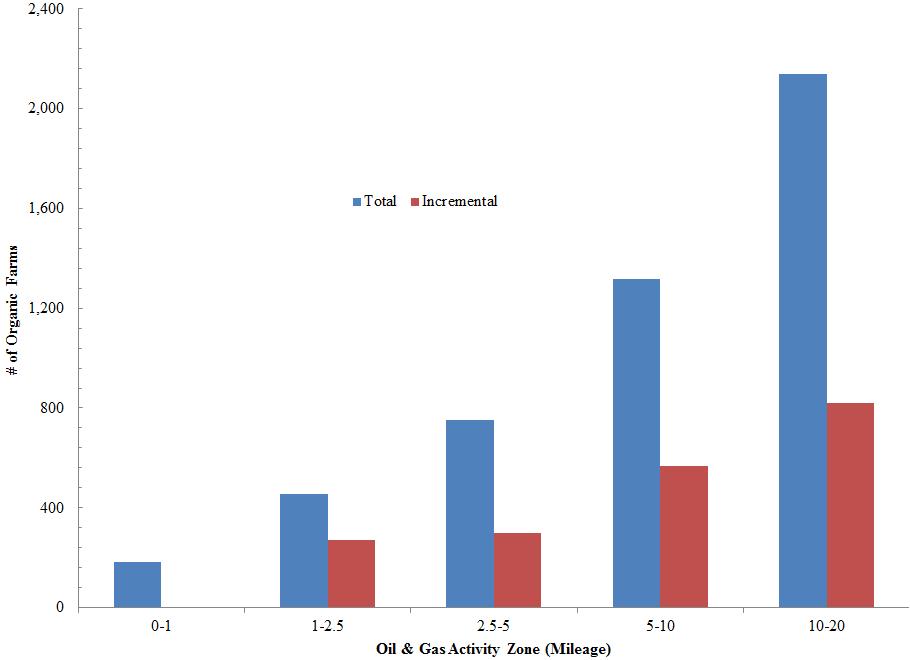
Figure 1. Total and incremental number of US organic farms in the 5 O&G ROCs.
Nationally, the number of organic farms near drilling activity within specific regions of concern are as follows (as shown in Figure 1):
- Watershed O&G ROC – 2,140 organic farms (11% of North American organic farms)
- Sub-Watershed O&G ROC – 1,319
- Periphery O&G ROC – 752
- Intermediate O&G ROC – 455
- Core O&G ROC – 183
Ohio’s Organic Farms Near Drilling
The following key statistics stood out among the analyses for OH’s 703 (3.6% of US total) organic farms. Figures 2 & 3 show how many farms are near drilling activity and injection (disposal) wells in OH. Click the images to view fullsize graphics:
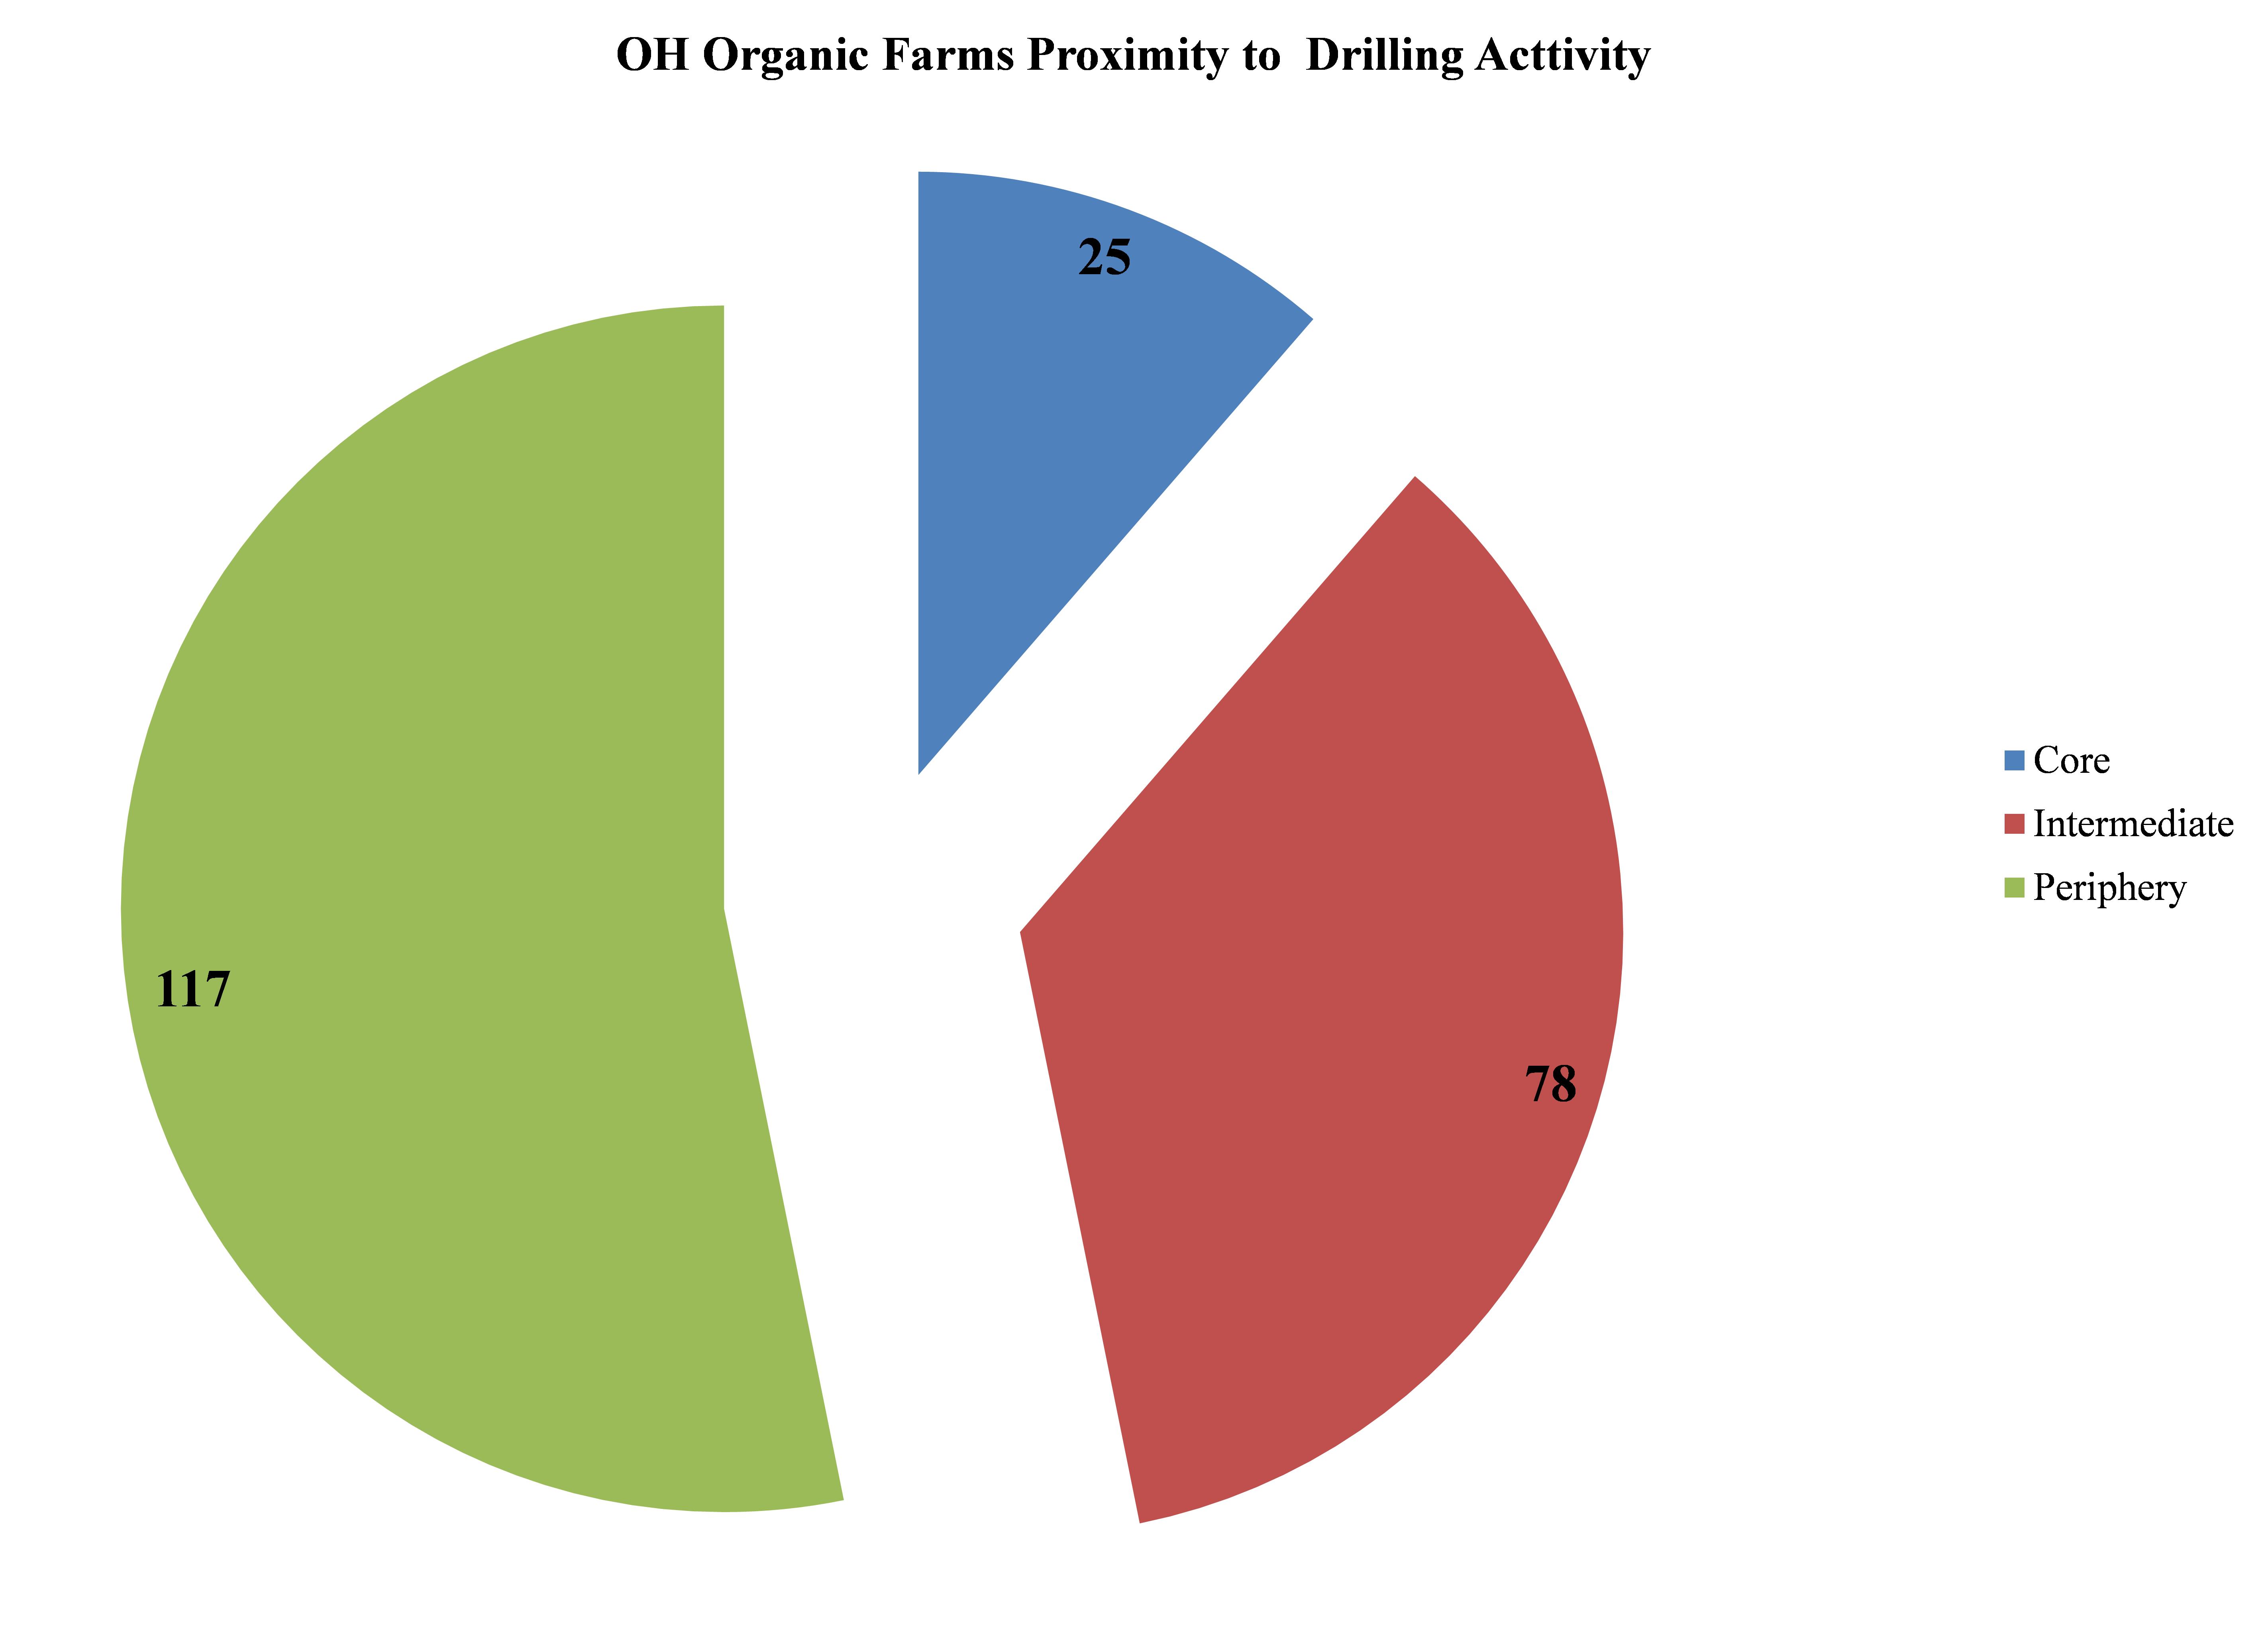 Figure 2. OH Organic Farms Proximity to Drilling Activity |
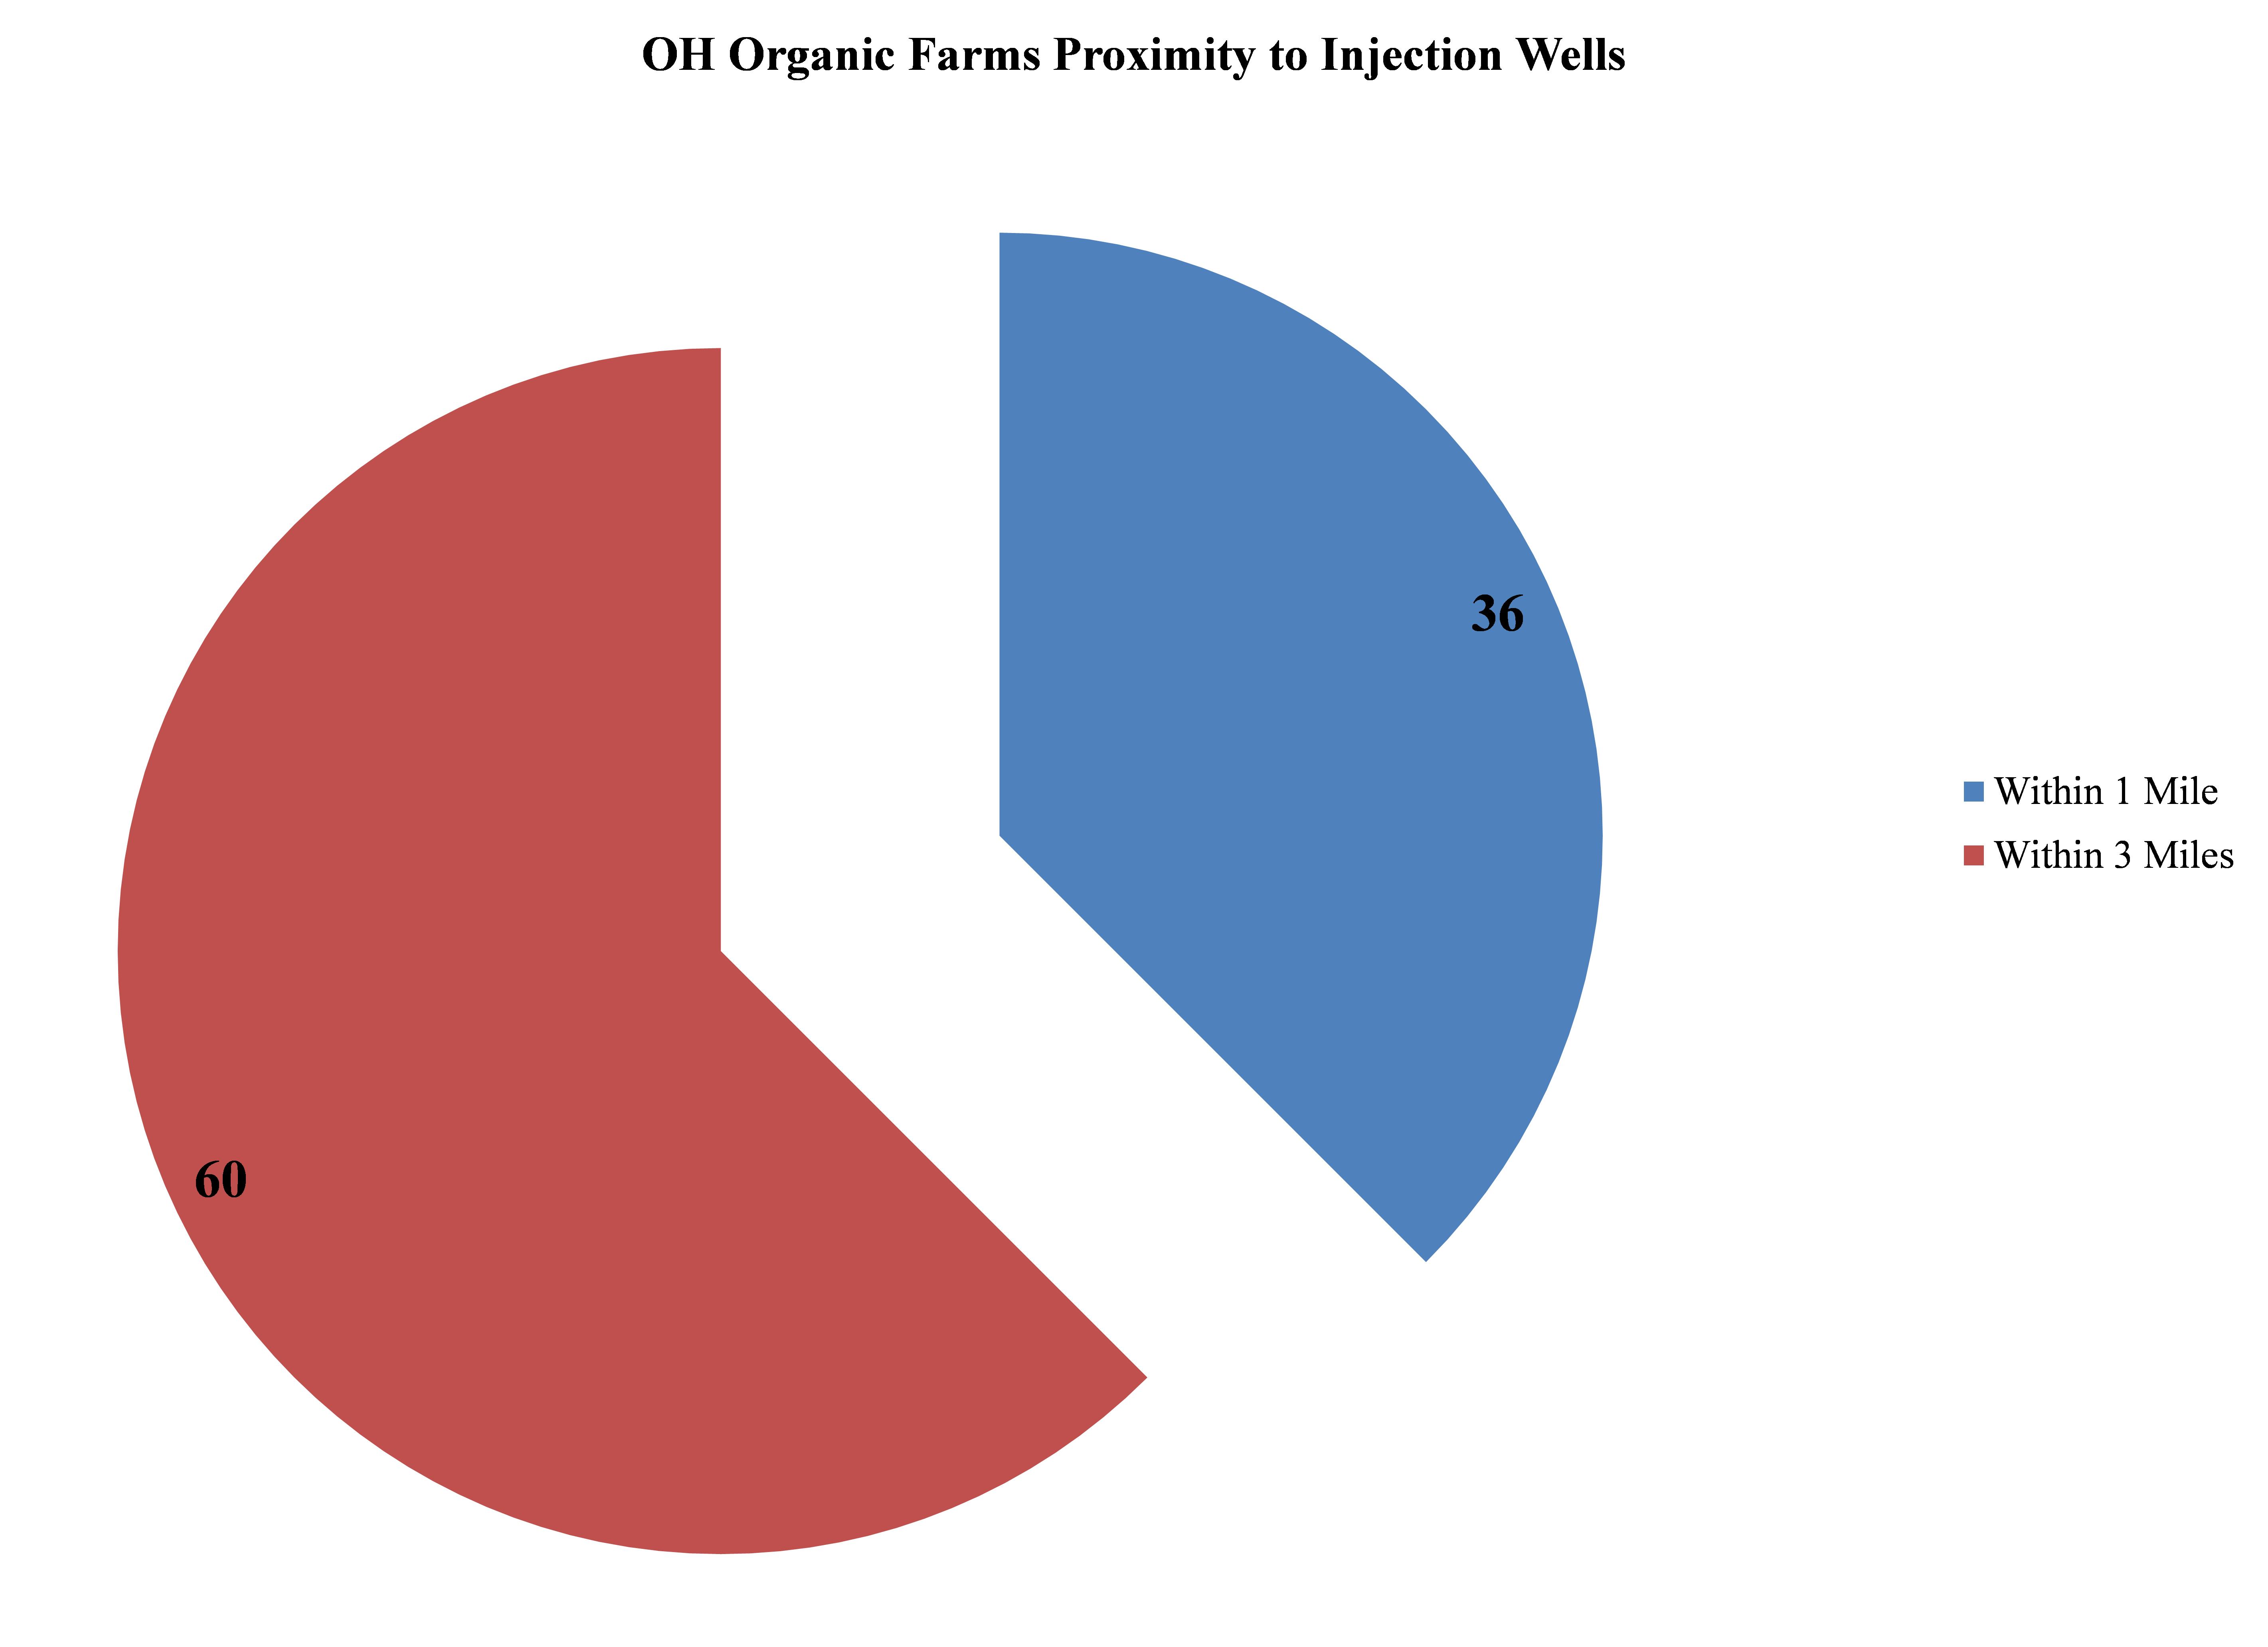 Figure 3. OH Organic Farms Proximity to Injection Wells |
Potential Trends
If oil and gas extraction continues along the same path that we have seen to-date, it is reasonable to expect that we could see an increase in the number of organic farms near this industrial activity. A few figures that we have worked up are shown below:
- 2,912 Organic Farms in the US Shale Plays (15% of total organic farms)
- 2,044 Crop Producers, 918 Livestock operations, 41 Wild Crops
- 6,179 in US Shale Basins (31%)
- California, 1,334; Colorado 297; Illinois 286; Indiana 334; Iowa 239; Michigan 504; Missouri 118; New York 834; Ohio 510; Pennsylvania 449; Texas 394; Wisconsin 271
- 4,100 Crop Producers, 1,386 Livestock operations, 61 Wild Crops
- 1,346 in US Tight Gas Plays (7%)
- 948 Crop Producers, 434 Livestock operations, 22 Wild Crops
- 2,754 in US Tight Gas Basins (14%)
- 2,010 Crop Producers, 875 Livestock operations, 48 Wild Crops
Soils at Risk Due To Shale Activity
Another way to look at these five ROCs when asking how shale gas build-out will interact with and/or influence organic farming is to look at the soils beneath these ROCs. What types of activity do they currently support? The productivity of organic farms, as well as their ability to be labeled “organic,” are reliant upon the health of their soils even more so than conventional farms. Organic farms cannot rely on synthetic fertilizers, pesticides, herbicides, or related soil amendments to increase productivity. Soil manipulation is prohibitive from a cost and options perspective. Thus, knowing what types of soils the shale industry has used and is moving towards is critical to understanding how the FEW dynamic will play out in the long-term. There is no more important variable to the organic farmer sans freshwater than soil quality and diversity.
The soils of most concern under this analysis are the Prairie-Forest Transition soils of the Great Lakes and Plains, commonly referred to as Alfisols, and the Carbon-Rich Grasslands or Mollisols (Figure 4 & 5). The latter is proposed by some as a soil order worthy of protection given our historical reliance on its exceptional soil fertility and support for the once ubiquitous Tall Grass Prairies. Both soils face a second potential wave of O&G development, with a combined 18,660 square miles having come under the influence of the O&G industry within the Core ROC and an additional 58-108,000 square miles in the Intermediate and Periphery ROCs. If the watersheds within these soils and O&G co-habitat were to come under development, total potential Alfisol and Mollisol alteration could reach 273,200 square miles. This collection of soils currently accounts for 43-47% of the Core and Intermediate O&G ROCs and would “stabilize” at 50-51% of O&G development if the watersheds they reside in were to see significant O&G exploration.
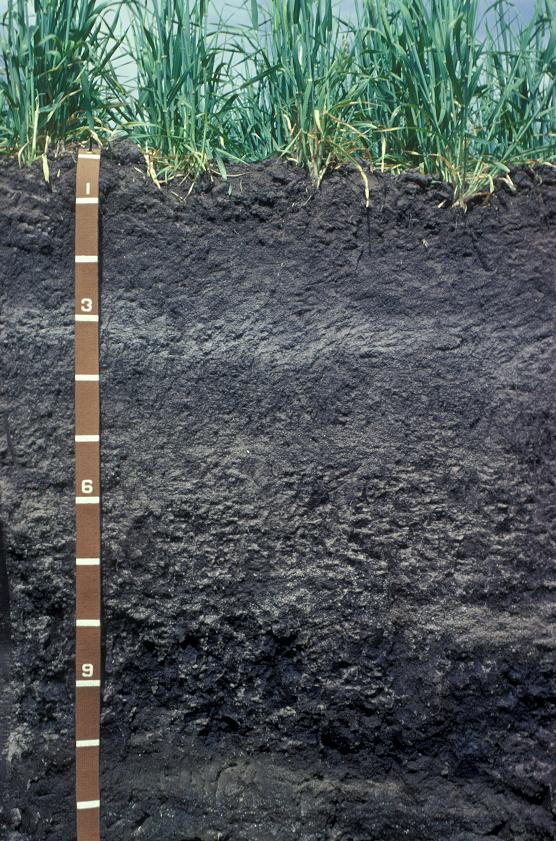 Figure 4. Prairie-Forest Transition soil – Courtesy EarthOnlineMedia |
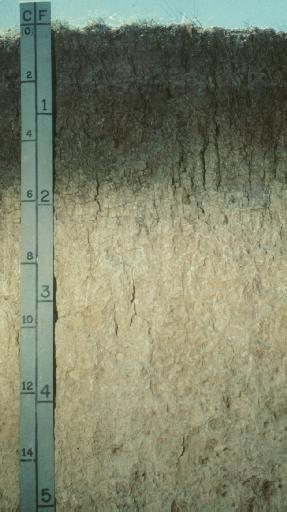 Figure 5. Carbon-Rich Grasslands soil – Courtesy USDA’s NRCS |
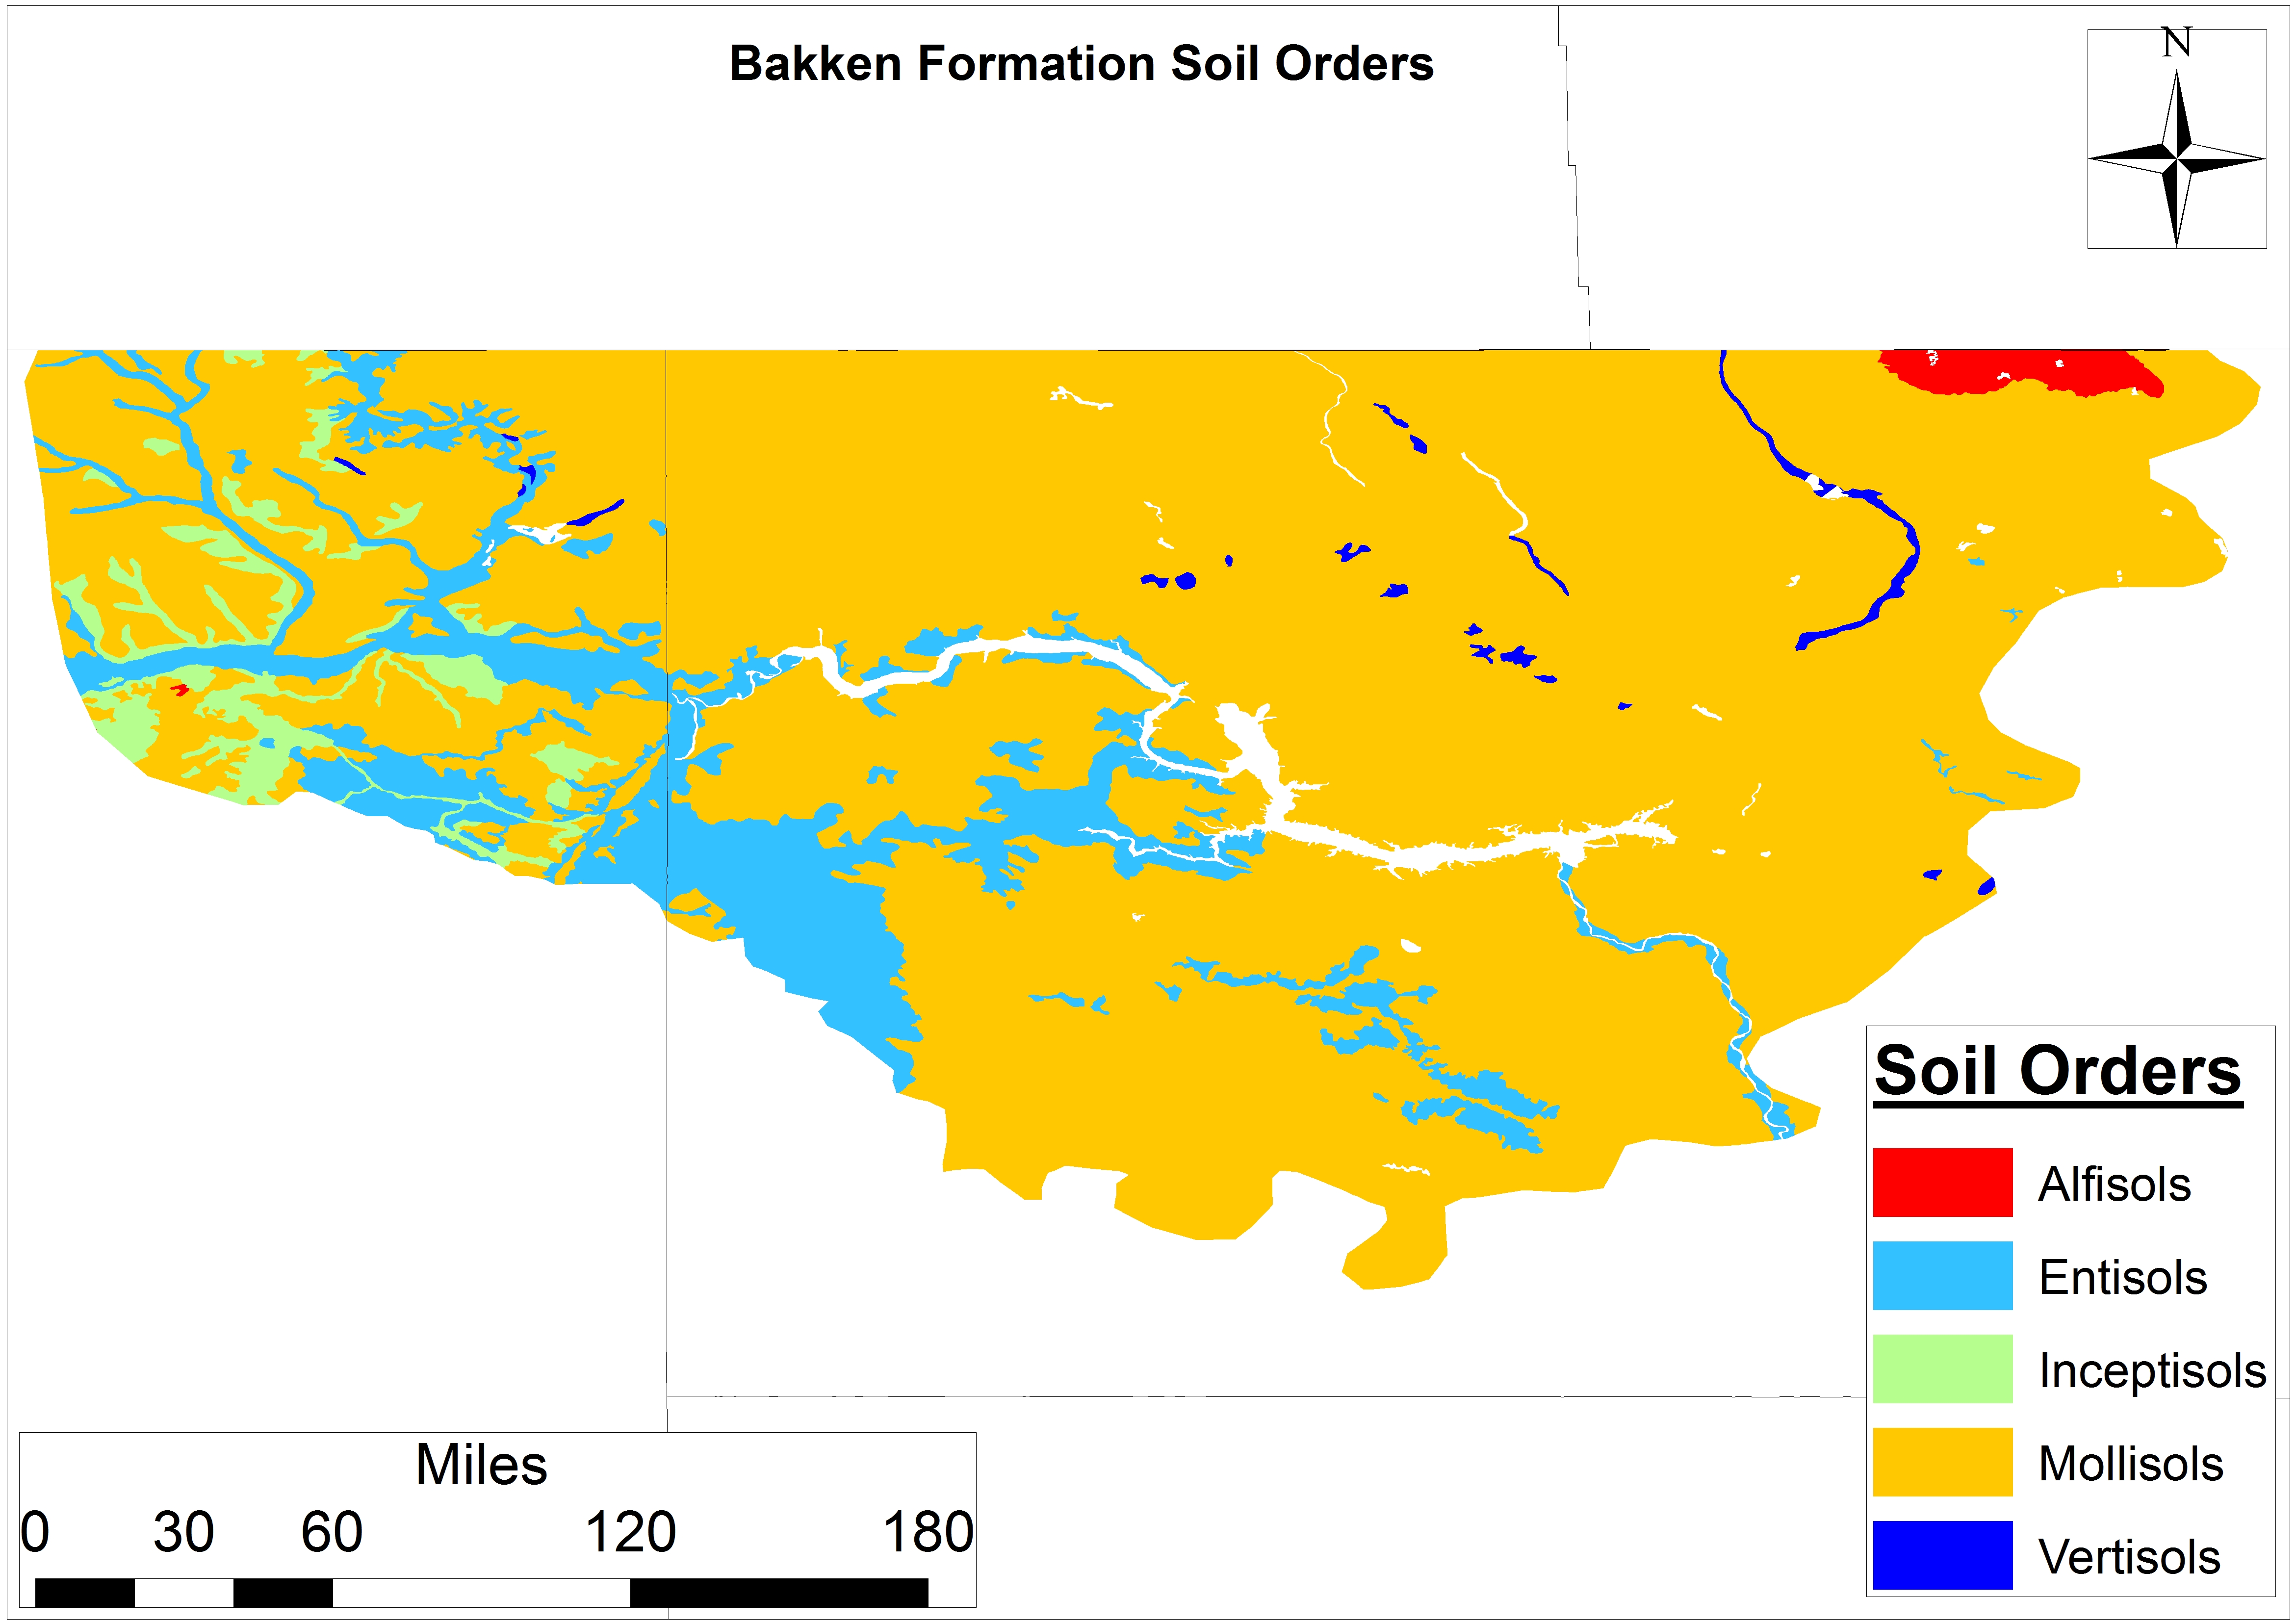 Figure 6. The five soil orders within the Bakken Shale formation in Montana and North Dakota. |
These same soils sit beneath or have been cleared for much of our wheat, corn, and soybean fields – not to mention much of the Bakken Shale exploration to date (Figure 6, above)
The three forest soil orders (i.e., Spodosol, Ultisol, and Andisol shown in Figures 7-9) account for 9,680-20,529 square miles of the Core and Intermediate O&G ROCs, which is 22 and 17% of those ROC’s, respectively. If we assume future exploration into the Periphery and Watershed ROC we see that forest soils will become less of a concern, dropping to 14-15% of these outlying potential plays, with the same being true for the two Miscellaneous soil types. The latter will decline from 28% to 25% of potential O&G ROCs.
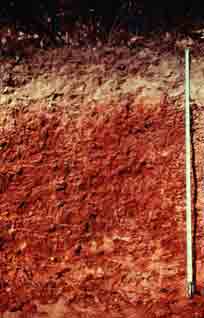 Figure 7. Ultisol – Courtesy of the University of Georgia |
 Figure 8. Spodosol – Courtesy of the Hubbard Brook Experimental Forest |
 Figure 9. Andisol – Courtesy of USDA’s NRCS |
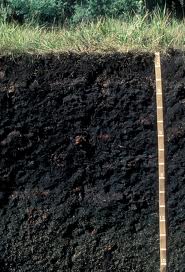
Figure 10. Histosol, – Courtesy of Michigan State University
If peripheral exploration were to be realized, another soil type will have to fill this gap. Our analysis demonstrates this gap would be filled by either Organic Wetlands or Histosols, which currently constitute <200 and 529 square miles of the Core and Intermediate ROCs, respectively (Figure 10). For so many reasons wetland soils are crucial to the maintenance and enhancement of ecosystem services, wildlife migration, agricultural productivity, and the capture and storage of greenhouse gases. However, if O&G exploration does expand to the Periphery ROC and beyond we would see reliance on wetland soils increase nearly 15 fold (i.e., 16% of Lower 48 wetland soil acreage).
The quality of these wetlands is certainly up for debate. However, what is fact is that these wetlands would be altered beyond even the best reclamation techniques. We know from the reclamation literature that the myriad difficulties associated with reassembling prior plant wetland communities. Finally, it is worth noting that a similar uptick in O&G reliance on arid (i.e., extremely unproductive but unstable) soils is may occur with future industry expansion. These soils will, as a percent of all ROCs, increase from 7% to 9% (i.e. 10-11% of all lower 48 arid soil acreage).
What do these changes mean for the agriculture industry in OH?
If these future O&G exploration scenarios were to play out, we estimate 20-22% of Southern Acidic Forest, Prairie-Forest Transition, Miscellaneous Recent Origin, and Carbon-Rich Grassland soils will have been effected or dramatically altered due to O&G land-use/land-cover (LULC) change nationally (Figure 11). This decline in productivity is likely familiar to communities currently grappling with how to manage a dramatically different landscape post-shale introduction in counties like Bradford in PA and Carroll in OH. The effects that such alteration has had and will have on landscape productivity, wildlife habitat fragmentation, and hydrological cycles is unknown but worthy of significant inquiry.
These questions are important enough to have received a session at Ohio Ecological Food and Farming Association’s (OEFFA) 2015 conference in Granville last month and were deemed worthy of a significant grant to The FracTracker Alliance from the Hoover Foundation aimed at quantifying the total LULC footprint of the shale gas industry across three agrarian OH counties. Early results indicate that every acre of well-pad requires 5.3 acres of gathering lines along with nearly 14 miles of buried pipelines – most of which are beneath high quality wetlands. This study speaks to the potential for 20-30% of the state’s Core Utica Region – or 10-15% of the Expanded Utica Region4 – being altered by shale gas activity.
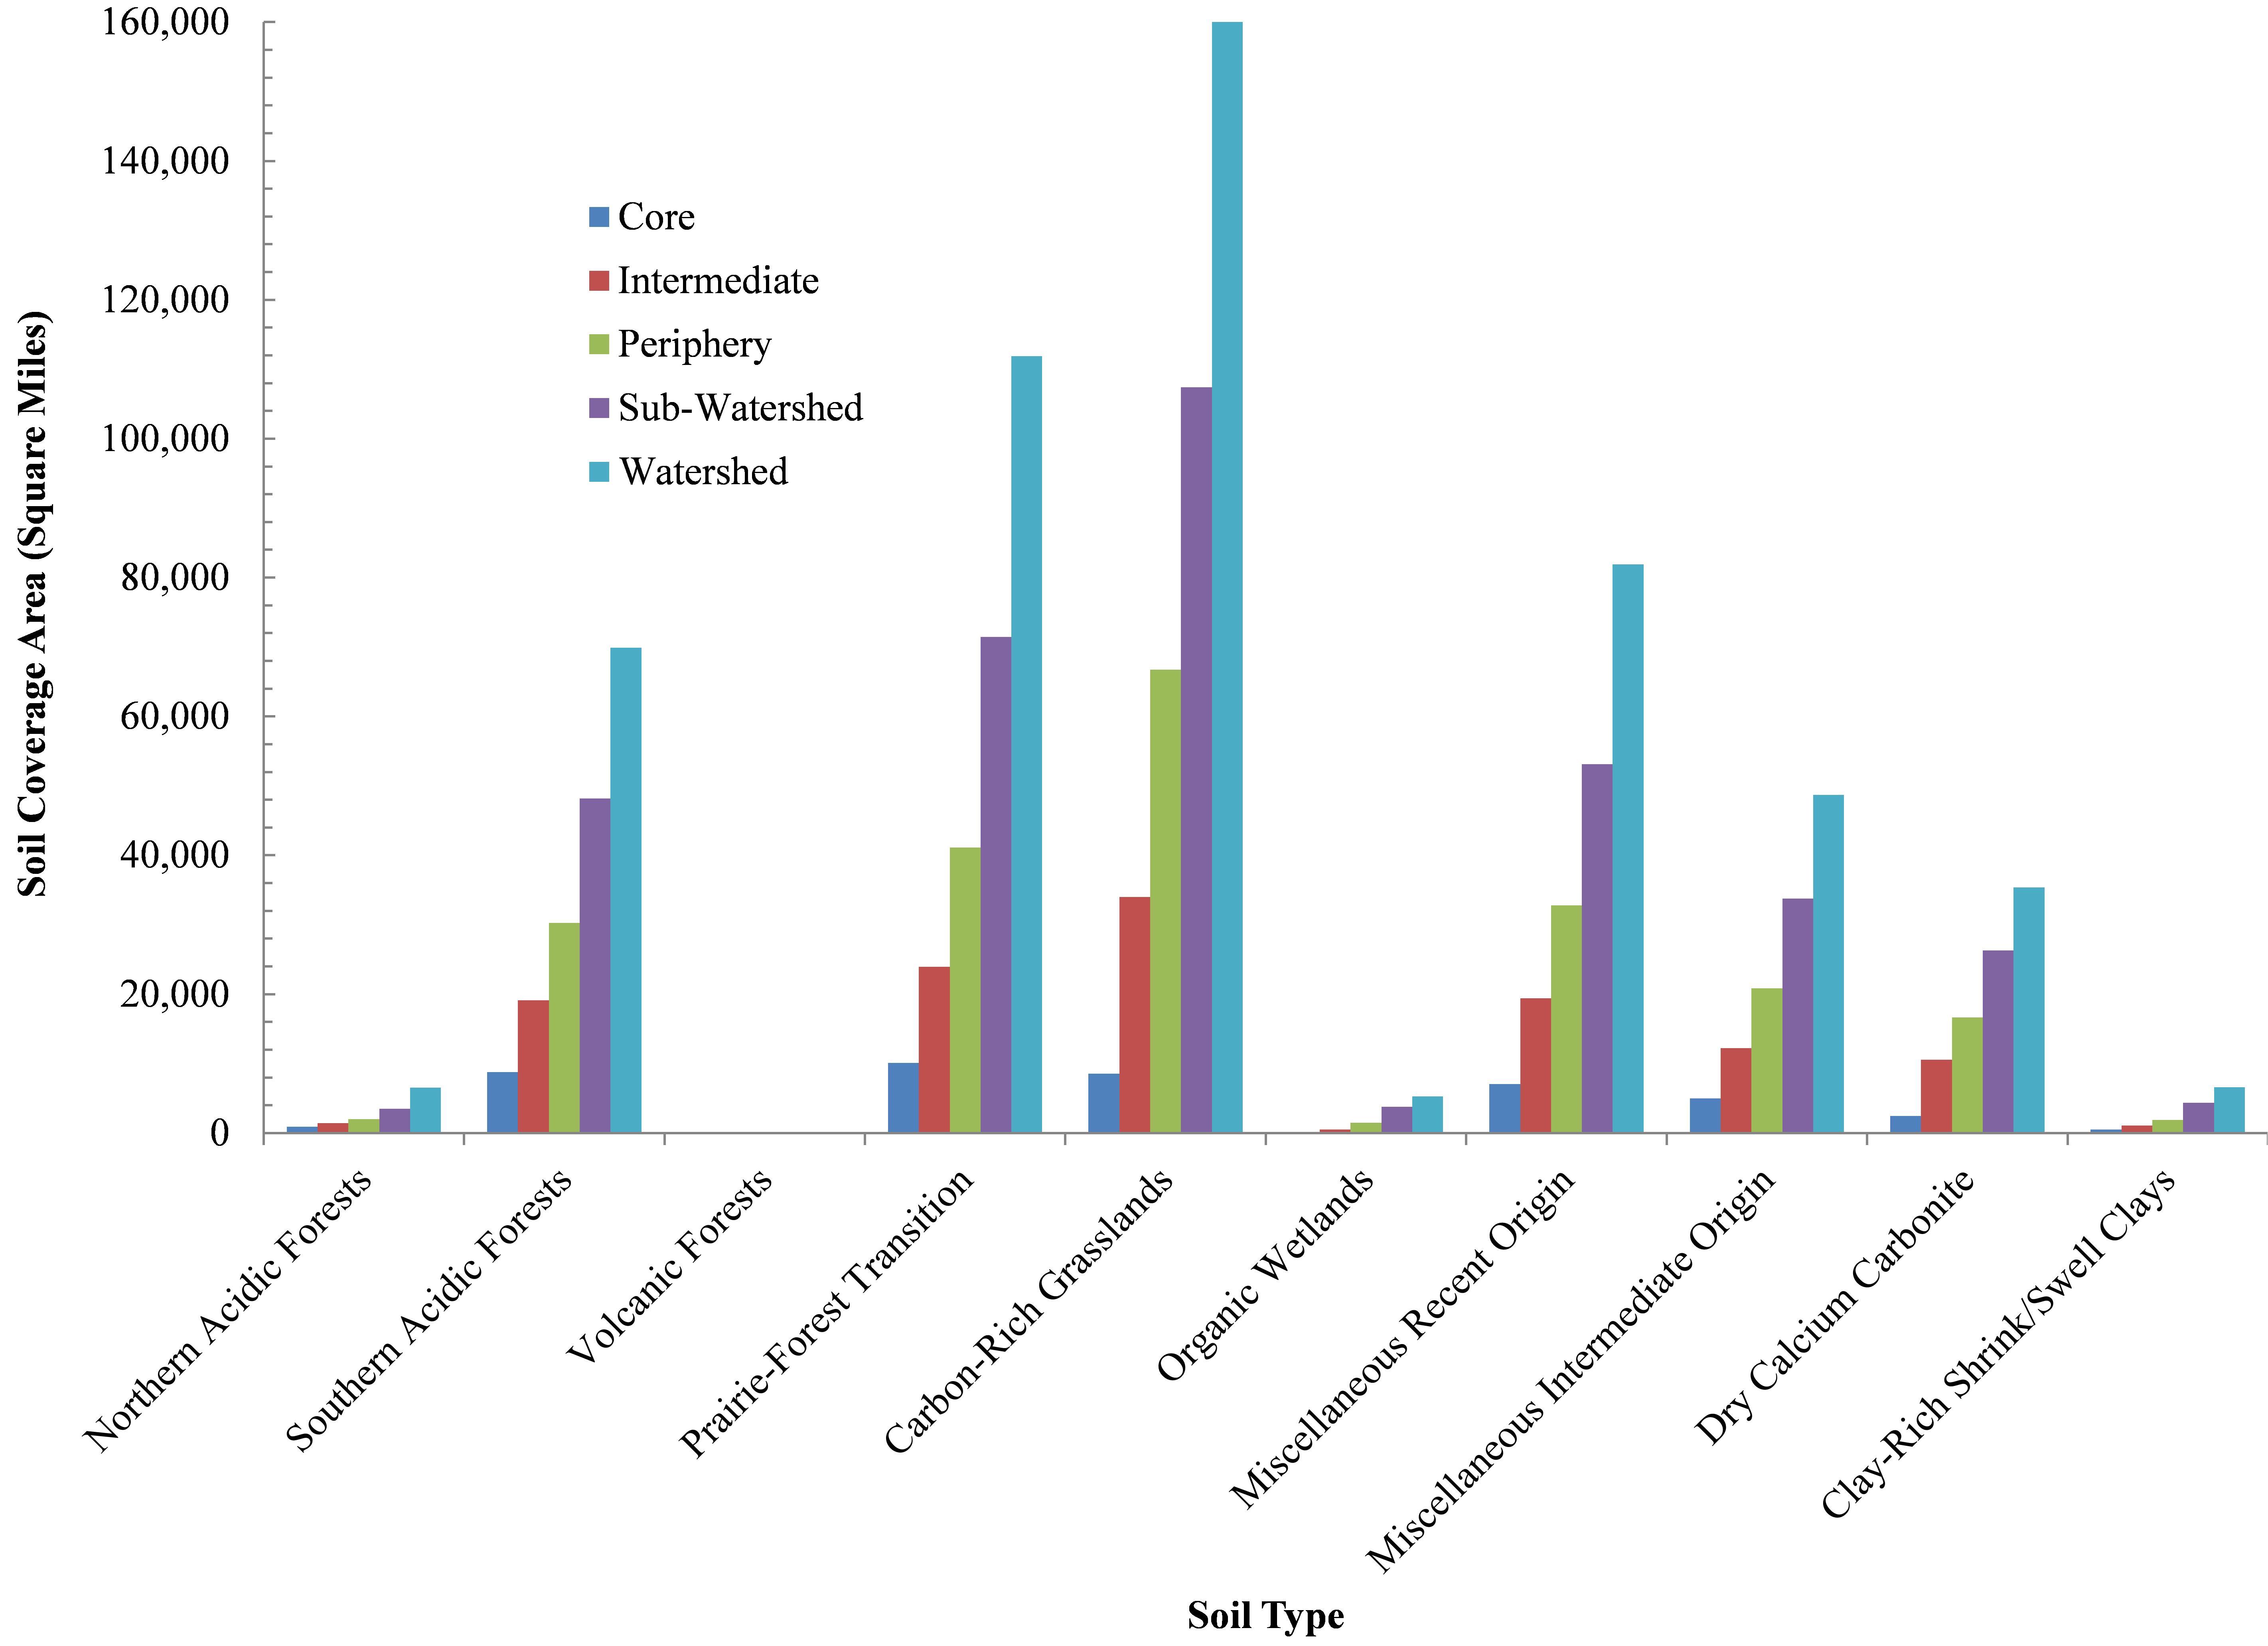
Figure 11. National distribution of soil types within the 5 ROCs under consideration: 1) Forest Soils, 2) Prairie/Agriculture soils, 3) Organic Wetlands, 4) Miscellaneous soils, 5) Dry Soils.
Figure 11 Description:
- Forest Soils – Northern and Southern Acidic Forests, Volcanic Forests,
- Prairie/Agriculture – Prairie-Forest Transition and Carbon-Rich Grasslands,
- Organic Wetlands
- Miscellaneous – Recent and Intermediate Origins,
- Dry Soils – Dry Calcium Carbonite and Clay-Rich Shrink/Swell Clays
Conclusion
The current and potential interaction(s) between the O&G and organic farming industries is nontrivial. Currently 11% of US organic farms are within what we are calling O&G ROCs. However, this number has the potential to balloon to 15-31% if our respective shale plays and basins are exploited, either partially or in full. Most of these (68-74%) are crop producers in states like California, Ohio, Michigan, Pennsylvania, and Texas.
Issues such as soil quality – specifically Prairie-Forest, Carbon Rich Grasslands, and Wetland soils – watershed resilience, and water rights are likely to become of more acute regional concern as the FEW interactions become increasingly coupled. How and when this will play out is anyone’s guess, but its play out is indisputable. Agriculture is going to face many staunch challenges in the coming years, as the National Science Foundation5 wrote:
The security of the global food supply is under ever-increasing stress due to rises in both human population and standards of living world-wide. By the end of this century, the world’s population is expected to exceed 10 billion, about 30% higher than today. Further, as standards of living increase globally, the demand for meat is increasing, which places more demand on agricultural resources than production of vegetables or grains. Growing energy use, which is connected to water availability and climate change, places additional stress on agriculture. It is clear that scientific and technological breakthroughs are needed to produce food more efficiently from “farm to fork” to meet the challenge of ensuring a secure, affordable food supply.
References and Endnotes
- The above regions were determined by generalizing a compilation of Oil & Gas wells generated by FracTracker’s Matt Kelso last March: Over 1.1 Million Active Oil and Gas Wells in the US.
- An additional 69 organic farms were geo-referenced in Canada and 7,524 across the globe for a similar global analysis to come.
- Description of STATSGO2 Database and associated metadata here.
- Core Utica Regions include any county that has ≥10 Utica permits to date and Expanded Utica Region includes any county that has 1 or more Utica permits.
- By the Mathematical and Physical Sciences Advisory Committee – Subcommittee on Food Systems in “Food, Energy and Water: Transformative Research Opportunities in the Mathematical and Physical Sciences”