Eighty years ago, Southeastern Ohio was a wasteland of barren, eroding hills. During the 18th and 19th centuries this once heavily forested area in the Appalachian foothills had been clear cut and mined beyond recognition. When the Great Depression struck, lowering crop prices made farming unprofitable in the area, and 40% of the population moved away.
In 1933, President Franklin Delano Roosevelt established the Civilian Conservation Corps (CCC), a public work relief program that employed men aged 18-25 to do manual labor related to conservation and development of natural resources such as planting trees, constructing trails, roads, and lodges, fighting wildfires, and controlling erosion. The following year, Ohio’s legislature agreed to allow the federal government to purchase land in the state for the purpose of establishing a national forest. The Forest Service was tasked with restoring the land for what is now called Wayne National Forest (WNF). A tree nursery was established near Chillicothe, and with the help of the CCC and volunteers, including members of the Daughters of the American Revolution, garden clubs, and school children, reforestation began.
Photos Credit: US Forest Service
An Area on the Mend
Today, WNF comprises three units that span 12 Ohio counties in the Unglaciated Allegheny Plateau. The hills are covered in biologically diverse mixed mesophytic forest, which includes approximately 120 species of trees and provides habitat for at least 45 species of mammals, 158 species of birds, 28 species of reptiles, 29 species of amphibians, and 87 species of fish. The US Forest Service estimates that 240,000 people visit this ecological wonder annually, according to Forest Recreation Program Manager, Chad Wilberger, in Nelsonville, Ohio. The restoration of barren public land to its current state is a great achievement. If it continues to be protected, Wayne could one day resemble the old growth forest that thrived here before the arrival of European settlers.
The Bureau of Land Management (BLM), however, has recently decided to lease up to 40,000 acres of Wayne to gas and oil companies for horizontal hydraulic fracturing, or fracking. The first auction took place last December resulting in the lease of 700 acres. A second auction this March leased another 1,200 acres. Nearly all of this land lies within the 60,000 acre Marietta Unit of the forest. This brings Oil & Gas Expressions of Interest (EOI) acreage to roughly 7.5% of all WNF owned parcels in this unit.
Wayne National Forest and Adjacent Existing Oil and Gas Infrastructure Below is a map of the Wayne National Forest, along with parcels owned by WNF (shown in gray) and those that might be subject to unconventional oil and gas development (gray parcels outlined with dashes). We also include existing unconventional oil and gas infrastructure near the park. Explore the map below, or click here to view the map fullscreen.
Gas and oil development is not new to the Wayne. Since the passage of The Federal Land Policy and Management Act of 1976, the US Forest Service’s land management plan for WNF has included conventional drilling, and derricks are a common sight on both public and private land in southeastern Ohio.
Fracking (unconventional drilling), however, has a far greater impact, requiring clear cutting of large areas of land for the construction of concrete well pads, and the use of millions of gallons of water that will become contaminated during the process and then transported by truck to injection wells. Accidents can be catastrophic for workers and nearby residents, and fracking and waste water disposal have been linked to earthquakes in Ohio.
In 2012, BLM updated its WNF Land and Resource Management Plan to allow fracking in the forest without conducting new impact studies.
What is at risk?
The Marietta Unit of the WNF is located in Monroe, Perry, and Washington counties in Southeastern Ohio along the Ohio River. Within its boundary are a wealth of trails used for hiking, backpacking, horseback riding, and mountain biking, campgrounds, and waterways ideal for kayaking and fishing. Both the highest and lowest points in the Wayne lie in this unit, as does the Irish Run Natural Bridge. The area is also known for its exceptional wildflowers, as shown in the photos below.
One popular recreation area, Lamping Homestead, lies directly within an oil and gas Expression Of Interest (EOI) parcel #3040602400 (See Map Above), one of the areas under consideration for lease. In the 1800s, it was the site of the Lamping family’s farm, but today all that remains of the settlers is a small cemetery with an iron gate atop a hill overlooking a small lake. Six campsites are situated around the western side of the lake, and two intersecting hiking loops rise into the wooded hills to the east. On the western side of the parking lot is a covered picnic area. A creek flows out of the lake and into Clear Fork, a tributary of the Little Muskingum River, across the road from the parking lot.
Both the lake and stream are popular boating and fishing areas. Lamping is an excellent spot for wildlife viewing. The lake, the creeks that flow in and out of it, and the surrounding wooded hills support an impressive variety of plant and animal species. During the day, visitors might spot ducks, geese, great blue herons, red-winged blackbirds, summer tanagers, red spotted newts, box turtles, northern water snakes, garter snakes, deer, rabbits, and muskrats. At night, they could be greeted by a cacophony of voices from frogs, owls, and coyotes.
Species of trees, plants, and fungus are also numerous. In winter, stands of white pine pop out against the bare branches of oak, hickory, maple, buckeye, and other deciduous trees. In spring, eye-catching splotches of blooming dogwood and redbud contrast against the many shades of green. But hikers who pull their gaze away from the brightly colored canopy and look down are rewarded with an abundance of wildflowers and the butterflies they attract, as well as many varieties of mushrooms and fungus, including such edible varieties as morels, wood ear, and dryad’s saddle.
Estimating Disturbances
It is unclear how much surface disturbance would occur on public land if this parcel were to be fracked, but even if the well pad and pipelines were constructed on private land adjacent to the forest, in order to drill under the forest, the public land and its inhabitants and visitors would certainly be impacted.
There is no question that noise and air pollution from traffic and construction would be disruptive both to wildlife and to human visitors. Explore various photos of the oil and gas industry in the gallery below:
The extraction process requires 2 million to 6 million gallons of fresh water each time a well is fracked. The rate at which hydraulic fracturing’s water demand is increasing on a per-well basis here in Ohio reached an exponential state around Q4-2013 and Q1-2014 and continues to rise at a rate of 3.1 million gallons per well per year (Figure 1).
Ohio Hydraulic Fracturing Total and Per Well Freshwater Demand between Q3-2010 and Q3-2016.
In Ohio, oil and gas companies are allowed to pull this water directly from streams and rivers at no cost. All this is possible, despite the fact that after its use it is so contaminated that it must be disposed of via injection wells and is permanently removed from the water cycle. The industry is already pulling water from streams in the Marietta Unit of the WNF for use in fracking on private land. Fracking public land simply means water withdrawals will occur on a much larger scale.
Ohio and West Virginia Shale Water Demand and Injection Waste Disposal This map shows Utica wells weighted by water demand and disposal (and/or production). It also depicts water, sand, and chemical usage as well as injection waste and oil production. Explore the map below, or click here to view map fullscreen.
Inevitable methane leaks, in addition to contributing to climate change, affect humans and wildlife in their immediate vicinity, causing headaches and nausea and even killing trees and plants.
In addition to the anticipated harm that fracking inflicts upon a natural area, there is also a risk of accidents with potentially devastating consequences. Residents of Monroe County have already seen a few in recent years from fracking on private land. In 2014, a well pad fire in the village of Clarington resulted in a chemical spill that contaminated nearby Opossum Creek, killing 70,000 fish. The same year a large gas leak 15 miles south in the village of Sardis resulted in the evacuation of all homes within half mile radius.
Recent studies have shown that extraction wells, in addition to injection wells, can cause earthquakes. Unsurprisingly, Monroe County has seen a spike in seismic activity with the increase in fracking activity in the area. The most recent incident was a 3.0 magnitude earthquake in the forest less than five miles from Lamping Homestead in April of this year.
Supporters of Wayne National Forest
Many people have repeatedly spoken out against BLM’s plan, submitting a petition with more than 100,000 signatures, and protesting outside Wayne National Forest Headquarters and Athens Ranger Station in Nelsonville. They have even organized voters to call and write letters to Regional Forester Kathleen Atkinson and legislators, including Senators Sherrod Brown and Rob Portman, and Governor John Kasich. BLM has not budged on its decision, unfortunately, insisting that leasing this land for fracking, and associated infrastructure buildout, will have “no significant impact.”
This May, the Center for Biological Diversity, Ohio Environmental Council, Ohio Sierra Club, and Heartwood, a regional organization focused on protecting forests, filed a lawsuit against BLM, aiming to void BLM leases and halt all fracking operations within the national forest.
Concerned citizens continue to organize raise awareness as they await the outcome of the suit.
Becca Pollard is Freelance Journalist and Co-founder of Keep Wayne Wild
Data Downloads
Click on the links below to download the data used to create this article’s maps:
https://fractracker.org/wp-content/uploads/2017/05/Wayne-National-Forest-Feature.jpg400900Guest Authorhttps://fractracker.org/wp-content/uploads/2025/09/2025-Wordmark-Logo.pngGuest Author2017-05-24 11:35:532021-04-15 15:03:02Wayne National Forest Could Be Deforested – Again
Even though it is a biofuel and not a fossil fuel, in this post we discuss the ways in which the corn ethanol production industry is similar to the fracking industry. For those who may not be familiar, biofuel refers to a category of fuels derived directly from living matter. These may include:
Direct combustion of woody biomass and crop residues, which we recently mapped and outlined,
Ethanol1 produced directly from the fermentation of sugarcanes or indirectly by way of the intermediate step of producing sugars from corn or switchgrass cellulose,
Biodiesel from oil crops such as soybeans, oil palm, jatropha, and canola or cooking oil waste,2 and
Anaerobic methane digestion of natural gas from manures or human waste.
To be a viable substitute for a fossil fuel, an alternative fuel should not only have superior environmental benefits over the fossil fuel it displaces, be economically competitive with it, and be producible in sufficient quantities to make a meaningful impact on energy demands, but it should also provide a net energy gain over the energy sources used to produce it.
Out of all available biofuels it is ethanol that accounts for a lion’s share of North American biofuel production (See US Renewables Map Below). This trend is largely because most Americans put the E-10 blends in their tanks (10% ethanol).3 Additionally, the Energy Independence and Security Act of 2007 calls for ethanol production to reach 36 billion gallons by 2022, which would essentially double the current capacity (17.9 billion gallons) and require the equivalent of an additional 260 refineries to come online by then (Table 1, bottom).
US Facilities Generating Energy from Biomass and Waste along with Ethanol Refineries and Wind Farms
But more to the point… the language, tax regimes, and potential costs of both ethanol production and fracking are remarkably similar. (As evidenced by the quotes scattered throughout this piece.) Interestingly, some of the similarities are due to the fact that “Big Ag” and “Big Oil” are coupled, growing more so every year:
The shale revolution has resulted in declining natural gas and oil prices, which benefit farms with the greatest diesel, gasoline, and natural gas shares of total expenses, such as rice, cotton, and wheat farms. However, domestic fertilizer prices have not substantially fallen despite the large decrease in the U.S. natural gas price (natural gas accounts for about 75-85 percent of fertilizer production costs). This is due to the relatively high cost of shipping natural gas, which has resulted in regionalized natural gas markets, as compared with the more globalized fertilizer market. (USDA, 2016)
Ethanol’s Recent History
For background, below is a timeline of important events and publications related to ethanol regulation in the U.S. in the last four decades:
Energy Research Advisory Board (ERAB) 1980, Gasohol
US Department of Energy (DOE), 2002, “Roadmap for biomass technologies in the United States. Biomass Technical Advisory Committee”, Found here and here
The Renewable Fuel Standard (RFS) program is implemented as part of the Energy Policy Act of 2005 and extended in the Energy Independence and Security Act of 2007
USDA, 2007, Growing global demands for soy for edible oil, livestock feed, and biodiesel are also contributing to high soy prices (no file found on USDA site anymore)
2014 Farm Bill authorized the “Biomass Crop Assistance Porgram” (aka, The 2014 Agricultural Act)
Benefits of Biofuels
[Bill] Clinton justified the ethanol mandate by declaring that it would provide “thousands of new jobs for the future” and that “this policy is good for our environment, our public health, and our nation’s farmers—and that’s good for America.” EPA administrator Carol Browner claimed that “it is important to our efforts to diversify energy resources and promote energy independence.” – James Bovard citing Peter Stone’s “The Big Harvest,” National Journal, July 30, 1994.
Of the 270 ethanol refineries we had sufficient data for, we estimate these facilities employ 235,624 people or 873 per facility and payout roughly $6.18-6.80 billion in wages each year, at an average of $22.9-25.2 million per refinery. These employees spend roughly 423,000 hours at the plant or at associated operations earning between $14.63 and $16.10 per hour including benefits. Those figures amount to 74-83% of the average US income. In all fairness, these wages are 13-26% times higher than the farming, fishing, and forestry sectors in states like Minnesota, Nebraska, and Iowa, which alone account for 33% of US ethanol refining.
Additional benefits of ethanol refineries include the nearly 179 million tons of CO2 left in the field as stover each year, which amounts to 654,532 tons per refinery. Put another way – these amounts are equivalent to the annual emissions of 10.7 million and 39,194 Americans, respectively.
Finally, what would a discussion of ethanol refineries be without an estimate of how much gasoline is produced? It turns out that the 280 refineries (for which we have accurate estimates of capacity) produce an average of 71.93 million gallons per year and 20.1 billion gallons in total. That figure represents 14.3% of US gasoline demand.
Costs of Biofuels
Direct Costs
Biofuel expansions such as those listed in the timeline above and those eluded to by the likes of the IPCC have several issues associated with them. One of which is what Pimentel et al. considered an insufficient – and to those of us in the fracking NGO community, familiar sounding – “breadth of relevant expertise and perspectives… to pronounce fairly and roundely on this many-sided issue.”
Figures 1A and 1B. Palm Oil Production in A) Indonesia and B) Malaysia between 1960 and 2016.
There is an increasing amount of connectivity between disparate regions of the world with respect to energy consumption, extraction, and generation. These connections also affect how we define renewable or sustainable:
In a globalized world, the impacts of local decisions about crop preferences can have far reaching implications. As illustrated by an apparent “corn connection” to Amazonian deforestation, the environmental benefits of corn-based biofuel might be considerably reduced when its full and indirect costs are considered. (Science, 2007)
These authors pointed to the fact that biofuel expectations and/or mandates fail to account for costs associated with atmospheric – and leaching – emissions of carbon, nitrogen, phophorus, etc. during the conversion of lands, including diverse rainforests, peatlands, savannas, and grasslands, to monocultures. Also overlooked were:
The ethical concerns associated with growing malnourishment from India to the United States,
The fact that 10-60%5 more fossil fuel derived energy is required to produce a unit of corn ethanol than is actually contained within this very biofuel, and
The tremendous “Global land and water grabbing” occuring in the name of natural resource security, commodification, and biofuel generation.
Sacrificing long-term ecological/food security in the name of short-term energy security has caused individuals and governments to focus on taking land out of food production and putting it into biofuels.
The rationale for ethanol subsidies has continually changed to meet shifting political winds. In the late 1970s ethanol was championed as a way to achieve energy independence. In the early 1980s ethanol was portrayed as salvation for struggling corn farmers. From the mid and late 1980s onward, ethanol has been justified as saving the environment. However, none of those claims can withstand serious examination. (James Bovard, 1995)
This is instead of going the more environmentally friendly route of growing biofuel feedstocks on degraded or abandoned lands. An example of such an endeavor is the voluntary US Conservation Reserve Program (CRP), which has stabilized at roughly 45-57 thousand square miles of enrolled land since 1990, even though the average payout per acre has continued to climb (Figure 2).
Figure 2. The Average Subsidy to Farmers Per Acre of Conservation Reserve Program (CRP) between 1986 and 2015.
The primary goals of the CRP program are to provide an acceptable “floor” for commodity prices, reduce soil erosion, enhance wildlife habitat, ecosystem services, biodiversity, and improve water quality on highly erodible, degraded, or flood proned croplands. Interestingly CRP acreage has declined by 27% since a high of 56 thousand square miles prior to the Energy Independence and Security Act of 2007 being passed. Researchers have pointed to the fact that corn ethanol production on CRP lands would create a carbon debt that would take 48 years to repay vs. a 93 year payback period for ethanol on Central US Grasslands.
Alternative fuel sources are attractive because they can be developed and used without questioning the very workings of the economic system — just substitute a more “sustainable,” “ecologically sound,” and “renewable” energy for the more polluting, expensive, and finite amounts of oil. People are hoping for magic bullets to “solve” the problem so that capitalist societies can continue along their wasteful growth and consumption patterns with the least disruption. Although prices of fuels may come down somewhat — with dips in the business cycle, higher rates of production, or a burst in the speculative bubble in the futures market for oil — they will most likely remain at historically high levels as the reserves of easily recovered fuel relative to annual usage continues to decline.
Indirect Costs: Ethanol, Fertilizers, and the Gulf of Mexico Dead Zone
This is the Midwest vs. the Middle East. It’s corn farmers vs. the oil companies. – Dwaney Andreas in Big Stink on the Farm by David Greising
Sixty-nine percent6 of North America’s ethanol refineries are within the Mississippi River Basin (MRB). These refineries collectively rely on corn that receives 1.9-5.1 million tons of nitrogen each year, with a current value of $1.06-2.91 billion dollars or 9,570-26,161 tons of nitrogen per refinery per year (i.e. $5.42-14.81 million per refinery per year). These figures account for 27-73% of all nitrogen fertilizer used in the MRB each year. More importantly, the corn acreage receiving this nitrogen leaches roughly 0.81-657 thousand tons of it directly into the MRB. Such a process amounts to 5-44% of all nitrogen discharged into the Gulf of Mexico each year and 1.7-13.8 million tons of algae responsible for the Gulf’s growing Dead Zone.
Leaching of this nitrogen is analogous to flushing $45.7-371.6 million dollars worth of precious capital down the drain. Put another way, these dollar figures translate into anywhere between 55% and an astonishing 4.53 times Direct Costs to the Gulf’s seafood and tourism industries of the Dead Zone itself.
These same refineries rely on corn acreage that also receives 0.53-2.61 million tons of phosphorus each year with a current value of 0.34-1.66 billion dollars. Each refinery has a phosphrous footprint in the range of 2,700 to 13,334 tons per year (i.e., $1.72-8.47 million). We estimate that 25,399-185,201 tons of this fertilizer phosphorus is leached into the the MRB, which is equivalent to 19% or as much as 1.42 times all the phosphorous dischared into the Gulf of Mexico per year. Such a process means $16.13-117.60 million is lost per year.
Together, the nitrogen and phosphorus leached from acreage allocated to corn ethanol have a current value that is between 75% and nearly 6 times the value lost every year to the Gulf’s seafood and tourism industries.
Indirect Costs: Fertilizer and Herbicide Costs and Leaching
The 270 ethanol refineries we have quality production data for are relying on corn that receives 367,772 tons of herbicide and insecticide each year, with a current value of $6.67 billion dollars or 1,362 tons of chemical preventitive per refinery per year (i.e. $24.7 million per refinery per year). More importantly the corn acreage receiving these inputs leaches roughly 15.8-128.7 thousand tons of it directly into surrounding watersheds and underlying aquifers. Leaching of these inputs is analogous to flushing $287 million to $2.3 billion dollars down the drain.
What’s Next?
During the recent Trump administration EPA, USDA, DOE administrator hearings, the Renewable Fuel Standard (RFS) was cited as critical to American energy independence by a bipartisan group of 23 senators. Among these were Democratic senator Amy Klobuchar and Republican Chuck Grassley, who co-wrote a letter to new EPA administrator Scott Pruitt demanding that the RFS remains robust and expands when possible. In the words of Democratic Senator Heidi Heitkamp – and long-time ethanol supporter – straight from the heart of the Bakken Shale Revolution in North Dakota:
The RFS has worked well for North Dakota farmers, and I’m fighting to defend it. As we’re doing today in this letter, I’ll keep pushing in the U.S. Senate for the robust RFS [and Renewable Volume Obligations (RVOs)] we need to support a thriving biofuels industry and stand up for biofuels workers. Biofuels create good-paying jobs in North Dakota and help support our state’s farmers, who rely on this important market – particularly when commodity prices are challenging.
Furthermore, the entire Iowa congressional delegation including the aforementioned Sen. Grassley joined newly minted USDA Secretary Sonny Perdue when he told the Iowa Renewable Fuels Association:
You have nothing to worry about. Did you hear what he said during the campaign? Renewable energy, ethanol, is here to stay, and we’re going to work for new technologies to be more efficient.
How this advocacy will play out and how the ethanol industry will respond (i.e., increase productivity per refinery or expand the number of refineries) is anybody’s guess. However, it sounds like the same language, lobbying, and advertising will continue to be used by the Ethanol and Unconventional Oil and Gas industries. Additional parallels are sure to follow with specific respect to water, waste, and land-use.
Furthermore, as both industries continue their ramp up in research and development, we can expect to see productivity per laborer to continue on an exponential path. The response in DC – and statehouses across the upper Midwest and Great Plains – will likely be further deregulation, as well.
From a societal perspective, an increase in ethanol production/grain diversion away from people’s plates has lead to a chicken-and-egg positive feedback loop, whereby our farmers continue to increase total and per-acre corn production with less and less people. In rural areas, mining and agriculture have been the primary employment sectors. A further mechanization of both will likely amplify issues related to education, drug dependence, and flight to urban centers (Figures 4A and B).
We still don’t know exactly how efficient ethanol refineries are relative to Greenhouse Gas Emissions per barrel of oil. By merging the above data with facility-level CO2 emissions from the EPA Facility Level Information on Greenhouse gases Tool (FLIGHT) database we were able to match nearly 200 of the US ethanol refineries with their respective GHG emissions levels back to 2010. These facilities emit roughly:
195,116 tons of CO2 per year, per facility,
A total of 36.97 million tons per year (i.e., 2.11 million Americans worth of emissions), and
22,265 tons of CO2 per barrel of ethanol produced.
Emissions from ethanol will increase to 74.35 million tons in 2022 if the Energy Independence and Security Act of 2007’s prescriptions run their course. Such an upward trend would be equivalent to the GHG emissions of somewhere between that of Seattle and Detroit.
What was once a singles match between Frackers and Sheikhs may turn into an Australian Doubles match with the Ethanol Lobby and Farm Bureau joining the fray. This ‘game’ will only further stress the food, energy, and water (FEW) nexus from California to the Great Lakes and northern Appalachia.
We are on a thinner margin of food security, just as we are on a thinner margin of oil security… The [World] Bank implicitly questions whether it is wise to divert half of the world’s increased output of maize and wheat over the next decade into biofuels to meet government “mandates.” – Ambrose Evans-Pritchard in The Telegraph
Figure 3. US and Global Corn Production and Acreage between 1866 and 2015.
Figures 4A and 4B. A) Number of Laborers in the US Mining, Oil and Gas, Agriculture, Forestry, Fishing, and Hunting sector and B) US Corn Production Metrics Per Farm Laborer between 1947 and 2015.
Ethanol Tables
Table 1. Summary of our Corn Ethanol Production, Land-Use, and Water Demand analysis
Gallons of Corn Ethanol Produced Per Year
17,847,616,000
Bushels of Corn Needed
6,374,148,571
Percent of US Production
44.73%
Land Needed
104,372,023 acres
“”
163,081 square miles
Percent of Contiguous US Land
5.51%
Percent of US Agricultural Land
11.28%
Gallons of Water Needed
49.76 trillion (i.e. 3.55 million swimming pools)
Gallons of Water Per Gallon of Oil
2,788
Average and Total Site/Industry Capacity
Average Corn Ethanol Production Per Existing or Under Construction Facility (n = 257)
69,717,250
Gallons of Corn Ethanol Produced Per Year
17,847,616,000
Difference Between 2022 Energy Independence and Security Act of 2007 36 Billion Gallon Mandate
18,152,384,000
# of New Refineries Necessary to Get to 2022 Levels
260
Percent Increase Over Current Facility Inventory
1.7
IEA 2009 World Energy Outlook 250-620% Increase Predictions for 2030
250%
44,619,040,000
# of New Refineries Necessary
640
Percent Increase Over Current Facility Inventory
150.00
620%
110,655,219,200
# of New Refineries Necessary
1,587
Percent Increase Over Current Facility Inventory
520.00
Table 2. Global Population Growth and Corn and Soybean Productivity Trends.
Percent Change
Metric
+1.13%
Global Population Growth Trend
Corn (Bushels Per Acre)
+1.15% Per Year
United States
+1.20% Per Year
Global
Soybean (Tons Per Acre)
+0.9% Per Year
United States
+1.5% Per Year
Brazil
Palm Oil (Tons)
+5.1% Per Year
Indonesia
+2.7% Per Year
Malaysia
References and Footnotes
Ethanol as defined in the Ohio Revised Code (ORC) Corporation Franchise Tax 5733.46 means “fermentation ethyl alcohol derived from agricultural products, including potatoes, cereal, grains, cheese whey, and sugar beets; forest products; or other renewable resources, including residue and waste generated from the production, processing, and marketing of agricultural products, forest products, and other renewable resources that meet all of the specifications in the American society for testing and materials (ASTM) specification D 4806-88 and is denatured as specified in Parts 20 and 21 of Title 27 of the Code of Federal Regulations.”
According to Fred Magdoff, the ethanol complex is lobbying for “more automobile engines capable of using E-85 (85 percent ethanol, 15 percent gasoline) for which there are currently 2,710 fueling stations across the country although 56% of them are in just nine states: 1) Wisconsin (117), 2) Missouri (107), 3) Minnesota (335), 4) Michigan (174), 5) Indiana (172), 6) Illinois (221), 7) Iowa (193), 8) Texas (99), and 9) Ohio (97). Some states are mandating a mixture greater than 10 percent. Ethanol can’t be shipped together with gasoline in pipelines because it separates from the mixture when moisture is present, so it must be trucked to where it will be mixed with gasoline.” The E-85 blend comes with its own costs including higher emissions of CO, VOC, PM10, SOx, and NOx than gasoline.
McClaugherty, C., Auch, W. Genshock, E. and H. Buzulencia. (2017). Landscape impacts of infrastructure associated with Utica shale oil and gas extraction in eastern Ohio, Ecological Society of America, 100th Annual Meeting, Baltimore, MD, August, 2015.
Hill et al. recently indicated “Ethanol yields 25% more energy than the energy invested in its production, whereas biodiesel yields 93% more.”
An additional 9-10 refineries or 73% of all ethanol refineries are within 25 miles of the Mississippi River Basin.
By Ted Auch, PhD, Great Lakes Program Coordinator, FracTracker Alliance
Cover photo, left: Oil and gas well pad, Ohio. Photo by Ted Auch. Cover photo, right: A typical ethanol plant in West Burlington, Iowa. Photo by Steven Vaughn.
Data Downloads
Click on the links below to download the datasets used to create the maps in this article.
The Susquehanna River is a 444-mile long waterway extending from the area around Cooperstown, New York to the Chesapeake Bay. In Pennsylvania, the basin includes more than 37,000 miles of streams that feed into the river, which capture the precipitation of more than 20,000 square miles of land, and is home to over 3.3 million people.
The region has been heavily impacted by oil and natural gas extraction in recent years; more than 5,500 unconventional wells and roughly 13,500 conventional wells have been drilled in the PA segment of the basin since 2000. Unconventional wells, in particular, have brought industrial-scaled activity, pollution, and waste products to a wide area of the basin, with especially heavy development occurring in three counties along Pennsylvania’s northern tier – Bradford, Susquehanna, and Tioga.
Several governmental agencies are involved with monitoring impacts to this massive watershed. This article focuses on the Pennsylvania portion of the basin, and examines how capable agency-run monitoring efforts are in capturing oil and gas (O&G) related pollution events. The Pennsylvania Department of Environmental Protection (DEP), the US Geological Survey (USGS), and the Susquehanna River Basin Commission (SRBC) maintain a combined network of 274 monthly “grab sample” monitoring sites and 58 continuous data loggers in the Pennsylvania portion of the river basin. Meanwhile, between January 1, 2000 and February 7, 2017, the DEP logged 6,522 on the O&G violations compliance report within the same region. More than three out of every four of these violations have been assessed to unconventional wells, even though only one out of every four active wells in the basin is categorized as such.
Map of O&G Monitoring & Violations in PA’s Susquehanna River Basin
Grab samples obtained from official monitoring locations are the preferred method for regulatory purposes in understanding the long-term health of the river system. Researchers can test for any number of analytes from samples that are collected in-stream, but analyzed in certified laboratories. However, samples from these locations are collected periodically – usually once per month – and therefore are very likely to miss the effects of a significant spill or issue that may impact surface water chemistry for a number of hours or days before being diluted and washing downstream.
Continuous data loggers give regulators a near real-time assessment of what is happening in selected points in the basin, usually at 15-minute intervals. While there are numerous events that contribute to fluctuations in these measurements, these data loggers would be the most likely instruments available to register an event impacting the surface water within the basin. However, there are unique issues with data loggers. For instance, available data from these data loggers are much more limited in scope, as temperature, pH, and conductivity are typically the only available analytes. In addition, because the analysis occurs on site, the results carry less weight than laboratory results would. Finally, even though data loggers collect data at rapid intervals, only some are equipped to send data real-time to agency offices. Some data loggers must be manually collected on a periodic basis by program managers.
Perhaps the greatest challenge for monitoring in the Susquehanna River Basin is that it is simply not practical to monitor in all places likely to be impacted by oil and gas operations. Testing within the jurisdiction of the Susquehanna River Basin is actually fairly extensive when compared to other regions, such as the Ohio River Basin. The Ohio River Valley Water Sanitation Commission – the equivalent of the SRBC for the Ohio River Basin – only monitors basic analytes like total dissolved solids at 29 locations, all at or near the main stem of the river. However, none of the agencies monitoring water quality in the Susquehanna River Basin have capacity to test everywhere. On average, there is one testing location for every 111 miles of rivers and streams within the basin.
Case Studies
If agency-based monitoring is so limited, then the important question is: How well do these efforts capture oil and gas-related impacts? Some violations are more likely to impact surface water quality than others. This article takes a closer look at some of the bigger problem areas within the basin, including the Dimock region in Susquehanna County, Leroy Township in Bradford County, and Bell Township in Clearfield County.
Dimock
O&G violations and water monitoring near Dimock, PA. Note that multiple violations can occur at the same location. Click to expand map.
The highest concentration of oil and gas violations in the Susquehanna Basin is located in the townships of Dimock and Springville, in Susquehanna County, PA, with a total of 591 incidents reported on the compliance report. This makes the region the highest concentration of O&G violations in the entire state. Many of these violations are related to the systemic failure of well integrity, resulting in the contamination of numerous groundwater supplies. In terms of how these might affect surface water, 443 of the violations are in areas that drain into the Thomas Creek-Meshoppen Creek subwatershed by the southern edge of Springville Township, while most of the rest of the violations drain into the parallel West Branch of Meshoppen Creek.
The USGS operates a monthly monitoring location in the middle of the cluster of violations, at the confluence of Burdick and Meshoppen creeks, just north of the Dimock’s southern border. While this location might seem ideal at first, only 180 of the 443 violations in the subwatershed are upstream of the grab sample site. There is another water monitoring location that captures all of these violations in the Meshoppen subwatershed, but it is more than 15 miles downstream. (link to EJ article about Dimock)
Leroy Township
O&G Violations and monitoring near Leroy Township, PA. Click to expand map.
Compared to the huge amount of oil and gas violations throughout the Dimock area, Leroy Township in Bradford County looks relatively quiet. It also appears to be well covered by monitoring locations, including a data logger site near the western edge of the township, a centrally located monthly monitoring location, as well as another monthly grab sample site upstream on Towanda Creek, just beyond the eastern boundary in Franklin Township.
And yet, this area was hit hard in the early part of the decade by two significant spills. On April 19, 2011, Chesapeake Appalachia lost control of the Atlas 2H well, with thousands of gallons of flowback fluid spilling onto the countryside and into the nearby Towanda Creek.
A little over a year later on July 4, 2012, a second major spill in the township saw 4,700 gallons of hydrochloric acid hit the ground. According to the DEP compliance report, this did not make it into the waterways, despite the gas well being located only about 550 feet from Towanda Creek, and less than 300 feet from another unnamed tributary.
Both incidents were within a reasonable distance of downstream monitoring locations. However, as these are grab sample sites that collect data once per month, they can only offer a limited insight into how Towanda Creek and its tributaries were impacted by these notable O&G related spills.
Bell Township
O&G violations and monitoring near Bell Township, PA. Click to expand map.
Bell Township is a small community in Clearfield County along the banks of the West Branch Susquehanna River. The northwestern portion of the township ultimately drains to the Ohio River, but all of the violations in Bell Township are within the Susquehanna River Basin.
Two significant incidents occurred in the township in 2016. On February 18, 2016, Alliance Petroleum Corp lost control of the McGee 11 OG Well, located less than 250 feet from Deer Run. According to the oil and gas compliance report, control of the well was regained five days later, after releasing unspecified quantities of gas, produced fluid, and crude oil. On December 5th of the same year, Exco Resources was cited for allowing 30 barrels (1,260 gallons) of produced fluid to spill at the Clyde Muth M-631 Wellpad in Bell Township.
A United States Geological Survey monthly monitoring location along the West Branch Susquehanna in nearby Greenwood Township is upstream, and could capture the effects of spills throughout much of Bell Township. However, the incident at the Clyde Muth well pad occurred in the Curry Run subwatershed, which meets up with the West Branch Susquehanna downstream of the monitoring location, so any pollution events in that area will not be reflected by monitoring efforts.
Conclusions
In the case of Dimock and Springville townships, we see how official water monitoring efforts capture only a fraction of the notorious cluster of wells that have resulted in hundreds of violations over the past decade. There could scarcely be a better candidate for systematic observation, and yet only a single grab sample site covers the immediate vicinity. Leroy Township does not have the same quantity of impacts as Dimock, but it did see one the worst blowouts in the recent history of O&G operations in Pennsylvania. The area is relatively well covered by grab samples sites, but due to the monthly sampling schedule, these locations would still be unlikely to capture significant changes in water quality. In Bell Township, much of the area is upstream of a monthly grab sample site, but the nearest downstream monitoring location to a major spill of produced fluid that occurred here is more than 17 miles away from the incident as the crow flies.
It should be noted that there are a number of industries and activities that contribute to water pollution in Pennsylvania, and as a result, the monitoring efforts are not specifically designed to capture oil and gas impacts. However, the compliance record shows heavy impacts from oil and gas wells in the basin, particularly from modern unconventional wells.
While the network of government-operated manual monitoring locations and data logger sites are fairly extensive in Susquehanna River Basin, these efforts are not sufficient to capture the full extent of oil and gas impacts in the region. Finding evidence of a small to medium sized spill at a site with monthly testing is unlikely, as contaminated water doesn’t stay in place in a dynamic river system. Data loggers also have a limited capacity, but are a useful tool for identifying substantial changes in water chemistry, and could therefore be employed to identify the presence of substantial spills. As such, it might be beneficial for additional data loggers to be distributed throughout the basin, particularly in areas that are heavily affected by the oil and gas industry. Furthermore, given resource gaps and staff cuts within agencies tasked with protecting the river basin, agencies should strongly consider utilizing networks of volunteers to augment their limited monitoring networks.
By Matt Kelso, Manager of Data and Technology, FracTracker Alliance
https://fractracker.org/wp-content/uploads/2017/05/Susquehanna-2-Feature-WP.jpg400900Matt Kelso, BAhttps://fractracker.org/wp-content/uploads/2025/09/2025-Wordmark-Logo.pngMatt Kelso, BA2017-05-02 13:17:582021-04-15 15:03:08Violations and Monitoring in Pennsylvania’s Susquehanna River Basin
Pipelines are hailed as the “safest” way to transport crude oil and other refinery products, but federal and state data show that pipeline incidents are common and present major environmental and human health hazards. In light of current events that have green-lighted multiple new pipeline projects, including several that had been previously denied because of the environmental risk they pose, FracTracker Alliance is continuing to focus on pipeline issues.
In this article we look at the record of oil spills, particularly those resulting from pipeline incidents that have occurred in North Dakota, in order to determine the risk presented by the soon-to-be completed Dakota Access Pipeline.
Standing Rock & the DAPL Protest
To give readers a little history on this pipeline, demonstrators in North Dakota, as well as across the country, have been protesting a section of the Dakota Access Pipeline (DAPL) near the Standing Rock Sioux Tribe’s lands since April 2016. The tribe’s momentum has shifted the focus from protests at the build site to legal battles and a march on Washington DC. The pipeline section they are protesting has at this point been largely finished, and is slated to begin pumping oil by April 2017. This final section of pipe crosses under Lake Oahe, a large reservoir created on the Missouri River, just 1.5 miles north of the Standing Rock Sioux Tribal Lands. The tribe has condemned the pipeline because it cuts through sacred land and threatens their environmental and economic well-being by putting their only source for drinking water in jeopardy.
Pipelines
… supposedly safest form of transporting fossil fuels, but …
However, what makes one form of land transport safer than the others is dependent on which factor is being taken into account. When considering the costs of human death and property destruction, pipelines are indeed the safest form of land transportation. However, for the amount of oil spilled, pipelines are second-worst, beaten only by trucks. Now, when it comes to environmental impact, pipelines are the worst.
What is not debatable is the fact that pipelines are dangerous, regardless of factor. Between 2010 and October 2016 there was an average of 1.7 pipeline incidents per day across the U.S. according to data from the Pipeline and Hazardous Materials Safety Administration (PHMSA). These incidents have resulted in 100 reported fatalities, 470 injuries, and over $3.4 billion in property damage. More than half of these incidents were caused by equipment failure and corrosion (See Figures 1 and 2).
Figure 1. Impacts of pipeline incidents in the US. Data collected from PHMSA on November 4th, 2016 (data through September 2016). Original Analysis
Figure 2. Cause of pipeline incidents for all reports received from January 1, 2010 through November 4, 2016. Original Analysis
Recent Spills in North Dakota
To dig into the risks posed in North Dakota more specifically, let’s take a look at some spill data in the state.
Map 1. Locations of Spills in North Dakota, with volume represented by size of markers
In North Dakota alone there have been 774 oil spill incidents between 2010 and September 2016, spilling an average of 5,131 gallons of oil per incident. The largest spill in North Dakota in recent history, and one of the largest onshore oil spills in the U.S., took place in September 2013. Over 865,000 gallons of crude oil spilled into a wheat field and contaminated about 13 acres. The spill was discovered several days later by the farmer who owns the field, and was not detected by remote monitors. The state claims that no water sources were contaminated and no wildlife were hurt. However, over three years of constant work later, only about one third of the spill has been recovered.
Below we have analyzed available spill data for North Dakota, including the location and quantity of such incidents.
North Dakota saw an average of 111 crude oil spills per year, or a total of 774 spills from 2010 to October 2016. The greatest number of spills occurred in 2014 with a total of 163. But 2013 had the largest spill with 865,200 gallons and also the highest total volume of oil spilled in one year of 1.3 million gallons. (Table 1)
Table 1. Data on all spills from 2010 through October 2016. Data taken from PHMSA and North Dakota.
2010
2011
2012
2013
2014
2015
Jan-Oct 2016
Number of Spills
55
80
77
126
163
117
156
Total Volume (gallons)
332,443
467,544
424,168
1,316,910
642,521
615,695
171,888
Ave. Volume/Spill (gallons)
6,044
5,844
5,509
10,452
3,942
5,262
1,102
Largest Spill (gallons)
158,928
106,050
58,758
865,200
33,600
105,000
64,863
The total volume of oil spilled from 2010 to October 2016 was nearly 4 million gallons, about 2.4 million of which was not contained. Most spills took place at wellheads, but the largest spills occurred along pipelines. (Table 2)
Table 2. Spills by Source. Data taken from PHMSA and North Dakota.
Wellhead
Vehicle Accident
Storage
Pipeline
Equipment
Uncontained
All Spills
Number of Spills
694
1
12
54
13
364
774
Total Volume (gallons)
2,603,652
84
17,010
1,281,798
68,623
2,394,591
3,971,169
Ave. Volume/Spill (gallons)
3,752
84
1,418
23,737
5,279
6,579
5,131
Largest Spill (gallons)
106,050
84
10,416
865,200
64,863
865,200
865,200
A. Sensitive Areas Impacted
5,875 square miles
Total Affected Areas (408 linear miles)
Spills that were not contained could potentially affect sensitive lands and waterways in North Dakota. Sensitive areas include Native American Reservations, waterways, drinking water aquifers, parks and wildlife habitat, and cities. Uncontained spill areas overlapped, and potentially contaminated, 5,875 square miles of land and water, and 408 miles of streams.
Drinking Water Aquifers – 2,482.3 total square miles:
Non-Community Aquifer – 0.3 square miles
Community Aquifer – 36 square miles of hydrologically connected aquifer
Surficial Aquifer – 2,446 square miles of hydrologically connected aquifer
A large area of potential drinking water (surficial aquifers) are at risk of contamination. Of the aquifers that are in use, aquifers for community use have larger areas that are potentially contaminated than those for non-community use.
Native American Tribal Reservation
Fort Berthold, an area of 1,569 square miles
Cities – 67 total square miles
Berthold
Dickinson
Flaxton
Harwood
Minot
Petersburg
Spring Brook
Stanley
West Fargo
Map 2. Areas where Oil Spills Present Public Health Threats
Floodplains – 73 square miles of interconnected floodplains
Streams – 408 miles of interconnected streams
Of the 364 oil spills that have occurred since 2010, 229 (63%) were within 1/4 mile of a waterway
Of the 61 Uncontained Brine Spills that have occurred since 2001, 38 (63%) were within 1/4 mile of a waterway.
If a spill occurs in a floodplain during or before a flood and is uncontained, the flood waters could disperse the oil over a much larger area. Similarly, contaminated streams can carry oil into larger rivers and lakes. Explore Map 3 for more detail.
Using ArcGIS software, uncontained spill locations were overlaid on spatial datasets of floodplains, stream beds, groundwater regions, sensitive habitats, and other sensitive regions.
The average extent (distance) spilled oil traveled from uncontained spill sites was calculated to 400 meters. This distance was used as a buffer to approximate contact of waterways, floodplains, drinking water resources, habitat, etc. with uncontained oil spills.
https://fractracker.org/wp-content/uploads/2017/04/OilSpill_12.16_crop.jpg400900Kyle Ferrar, MPHhttps://fractracker.org/wp-content/uploads/2025/09/2025-Wordmark-Logo.pngKyle Ferrar, MPH2017-04-11 16:15:232021-04-15 15:03:11Oil Spills in North Dakota: What does DAPL mean for North Dakota’s future?
By Dave Dister, Consulting Ecologist, Ludington, MI
One of the prime reasons I moved to the Ludington, Michigan area in 2008 was the aesthetic and biological diversity evident at Ludington State Park (LSP). As a field biologist nearing the end of his formal career, I was eager to conduct a study of the vascular plants within the 5,300-acre park. That study consumed six years of exploring all habitats and ecosystems, and documenting (by vouchers) the flora I encountered. Although the unfortunate presence of the Sargent Sand Company operation was obvious as it cut through the south end of the park, it was not until the fracking boom a few years ago that I took special notice as a residential neighbor.
Above is a dynamic map of silica sands and frac sand mines, drying facilities, and other related facilities. Zoom and click on the map to explore various aspects of frac sand mining infrastructure. Click here to view the map full screen along with its legend.
Expanding Sand Mining
That “sleepy” sand mining operation suddenly turned into a 24-hour, seven-days-a-week operation, with associated noise that irritated a very light-sleeping biologist. Hamlin Township officials were only partially effective in addressing residential impacts “after hours,” and had no interest in developing reasonable ordinances upon a commercial operation. Although increased noise and truck traffic were a tangible nuisance, only when a renewal of the company’s sand mining permit was announced did it become clear that biological resources within the 372-acre private in-holding were afforded virtually no protection at all. And the more research I did into the regulatory permitting process, the more incredulous the situation appeared.
Above – Photos of Sargent Sands frac sand mining operations taken by Ted Auch, FracTracker Alliance
1979 Environmental Impact Report
My expertise as a wetlands biologist and botanist were well suited to scrutinizing the 1979 Environmental Impact Report (EIR), which was a hastily-compiled poorly-researched 24-page document.
From my perspective, there was a poor level of protection afforded to the Federal and State Threatened Pitcher’s Thistle (Cirsium pitcheri). As far as is known, Sargent Sand has no records of relocating this plant in proposed or active mining cells in its 100-year history of mining, although the Michigan Department of Natural Resources (MDNR) has known about plants on the property for more than 20 years. The MDNR and US Fish and Wildlife Service (USFWS) have been complicit in not adequately protecting this species, which has had minimal research into the success (or not) of transplanting individual plants. Young plants appear to transplant well, but long-term studies are not available. Older plants are much less likely to survive transplanting, as they depend on numerous minute root hairs to absorb moisture in a xeric habitat, and removal from a dune would strip-off most such root hairs. It requires about seven years for these plants to mature, so reproductive rates are slow.
Yep, it’s a fact of life – plants simply are not nearly as charismatic as animals, and consequently are treated as “second-class organisms” in the world of environmental protection. Sadly, the Michigan Department of Environmental Quality (MDEQ) just renewed the sand mining permit that allows Sargent Sand to “self-monitor” for this threatened species, and to “move plants” encountered in areas proposed for development. Does anyone really think a mining company will give two hoots about a thistle plant?!
Great Lakes Barrens Ecosystem
The rarity and value of Great Lakes Barrens (GLB) was not addressed when the 1979 EIR was written, though such ecosystems are clearly visible on aerial photographs of Sargent Sand Company property and surrounding LSP. These natural communities are known to be imperiled ecosystems at both the state and global levels. The Michigan Natural Features Inventory classifies “Great Lakes Barrens” – that include jack pine stands with associated xeric-loving shrubs and forbs – as S2 natural communities:
Imperiled in the state because of rarity due to very restricted range, very few occurrences, steep declines, or other factors making it very vulnerable to extirpation from the state. – Michigan Natural Features Inventory
Globally, Great Lakes Barrens have a similar designation. Consequently, mitigation measures must be strengthened and avoidance of impacts considered. Any Restoration Plan of such habitats must include high quality GLB plants such as buffaloberry (Shepherdia canadensis), bearberry (Arctostaphylos uva-ursi), ground juniper (Juniperus communis), sand cherry (Prunus pumila), sand-dune willow (Salix cordata), blueleaf willow (Salix myricoides), beach-heath (Hudsonia tomentosa), harebell (Campanula rotundifolia), white camas (Anticlea elegans), and wild wormwood (Artemisia campestris), among others.
Again, unfortunately the MDNR has not enforced strong protections against the destruction of Great Lakes Barrens. The “reclamation” of destroyed dunes and jack pine barrens for a mere “one-year period at 80 percent vegetative cover” comes nowhere close to a viable mitigation plan, as trees and shrubs impacted in such areas take decades to recover.
Furthermore, other state-listed plants, such as ram’s head lady-slipper orchid (Cypripedium arietinum) are known to be adjacent to Sargent Sand property but are not legally protected as they are only “Special Concern” species. Lastly, the Lake Huron locust (Trimerotropsis huroniana) is a state Threatened insect known to occur within Ludington State Park, and suitable “sparsely vegetated dune” habitat is common within Sargent Sand’s property. If you thought rare plants get little respect, try to protect a threatened grasshopper!
Great Lakes Barrens often include seasonal wetlands that are protected under Section 404 of the Clean Water Act of 1972, but which often lack surface waters much of the year. Not surprisingly, the 1979 EIR does not mention “wetlands” at all. At best, there is a comment that “There are three or four very small swamp areas on the property…” However, a review of recent aerial photography indicates many Interdunal Wetlands remain within the northern half of Sargent Sand property. The largest of these appears to be at least 0.5 acre in size, and it is likely that several acres of such wetlands exist on the property.
Consequently, a formal Wetland Delineation is needed to determine the exact location and amount of Jurisdictional Wetlands on Sargent Sand property. Any impact to such wetlands requires mitigation measures that include avoidance, minimization, and/or wetland creation elsewhere within the watershed. Additionally, Interdunal Wetlands are ranked S2 Natural Communities by the State of Michigan, and have a rank of G2 globally. Both of these designations indicate these areas are “Imperiled,” so mitigation ratios should be high (e.g., 10:1 or 20:1).
Current Political Climate in Ludington
The current political leadership in Michigan, as well as the nation, has presented a formidable challenge for environmentalists and scientists. Additionally, the system certainly appears rigged when the agency – the MDEQ – that issues permits and permit renewals is also a lobbyist for the oil, gas, and minerals industry. Nevertheless, the battle to protect this natural heritage is a noble and vital one that will persist. As with every other sensitive and rare environmental resource, if no one scrutinizes the lax protection of our natural heritage, before you know it, it will be gone.
https://fractracker.org/wp-content/uploads/2017/02/Ludington-Sand-Mantis-Feature.jpg400900Guest Authorhttps://fractracker.org/wp-content/uploads/2025/09/2025-Wordmark-Logo.pngGuest Author2017-02-20 10:57:312021-04-15 15:03:43World Class Dunes and Great Lakes Barrens at Risk at Ludington
By Karen Edelstein, Eastern Program Coordinator, FracTracker Alliance
In an apparent move to step around compliance with comprehensive regulations outlined in the Endangered Species Act (ESA), a coalition of nine oil and gas corporations has filed a draft plan entitled the Oil & Gas Coalition Multi-State Habitat Conservation Plan (O&G HCP). The proposed plan, which would relax regulations on five species of bats, is unprecedented in scope in the eastern United States, both temporally and spatially. If approved, it would be in effect for 50 years, and cover oil and gas operations throughout the states of Ohio, Pennsylvania, and West Virginia—covering over 110,000 square miles. The oil and gas companies see the plan as a means of “streamlining” the permit processes associated with oil and gas exploration, production, and maintenance activities. Others outside of industry may wonder whether the requested permit is a broad over-reach of an existing loophole in the ESA.
Habitat fragmentation, air, and noise pollution that comes with oil and gas extraction and fossil fuel delivery activities have the potential to incidentally injure or kill bat species in the three-State plan area that are currently protected by the Endangered Species Act (ESA) of 1973. In essence, the requested “incidental take permit”, or ITP, would acknowledge that these companies would not be held to the same comprehensive regulations that are designed to safeguard the environment, particularly the flora and fauna at most risk to extirpation. Rather, they would simply be asked to insure that their impacts are “minimized and mitigated to the maximum extent practicable.”
Section 10(a)(2)(B) of the ESA contains provisions for issuing an ITP to a non-Federal entity for the take of endangered and threatened species, provided the following criteria are met:
The taking will be incidental
The applicant will, to the maximum extent practicable, minimize and mitigate the impact of such taking
The applicant will develop an HCP and ensure that adequate funding for the plan will be provided
The taking will not appreciably reduce the likelihood of survival and recovery of the species in the wild
The applicant will carry out any other measures that the Secretary may require as being necessary or appropriate for the purposes of the HCP
What activities would be involved?
The Northern Long-eared Bat is a federally-listed threatened species, also included in the ITP
The proposed plan, which would seek to exempt both upstream development activities (oil & gas wells) and midstream development activities (pipelines). Upstream activities include the creation of access roads, staging areas, seismic operations, land clearing, explosives; the development and construction of well fields, including drilling, well pad construction, disposal wells, water impoundments, communication towers; and other operations, including gas flaring and soil disturbance; and decommissioning and reclamation activities, including more land moving and excavation.
Midstream activities include the construction of gathering, transmission, and distribution pipeline, including land grading and stream construction, construction of compressor stations, meter stations, electric substations, storage facilities, and processing plants, and installation of roads, culverts, and ditches, to name just a few.
Companies involved in the proposed “Conservation Plan” represent the major players in fossil fuel extraction, refinement, and delivery in the region, and include:
Antero Resources Corporation
Ascent Resources, LLC
Chesapeake Energy Corporation
EnLink Midstream L.P.
EQT Corporation
MarkWest Energy Partners, L.P., MPLX L.P., and Marathon Petroleum Corporation (all part of same corporate enterprise)
Rice Energy, Inc.
Southwestern Energy Company
The Williams Companies, Inc.
Focal species of the request
Populations of federally-endangered Indiana Bats could be impacted by the proposed Incidental Take Permit (ITP)
The five species listed in the ITP include the Indiana Bat (a federally-listed endangered species) and Northern Long-eared Bat (a federally-listed threatened species), the Eastern Small-footed Bat (a threatened species protected under Pennsylvania’s Game and Wildlife Code), as well as the Little Brown Bat and Tri-colored Bat. Populations of all five species are already under dire threats due to white-nose syndrome, a devastating disease that, since 2008, has killed an estimated 5.7 million bats in North America. In some cases, entire local populations have succumbed to this deadly disease. Because bats already have a naturally low birthrate, bat populations that do survive this epidemic will be slow to rebound. Only recently, wildlife biologists have begun to see hope for a treatment in a beneficial bacterium that may save affected bats. However, production and deployment details of this treatment are still under development. Best summarized in a recent article in the Pittsburgh Post-Gazette:
This [ITP] would be a huge deal because we are dealing with species in a precipitous decline,” said Jared Margolis, an attorney with the Center for Biological Diversity, a national nonprofit conservation organization headquartered in Tucson, Ariz. “I don’t see how it could be biologically defensible. Even without the drilling and energy development we don’t know if these species will survive.
In 2012, Bat Conservation International produced a report for Delaware Riverkeeper, entitled Impacts of Shale Gas Development on Bat Populations in the Northeastern United States. The report focuses on landscape scale impacts that range from water quality threats, to disruption of winter hibernacula, the locations where bats hibernate during the winter, en masse. In addition, because bats have strong site fidelity to roosting trees or groups of trees, forest clearing for pipelines, well pads or other facilities may disproportionately impact local populations.
The below map, developed by FracTracker Alliance, shows the population ranges of all five bat species, as well as the current areas impacted by existing development by the oil and gas industry through well sites, pipelines, and other facilities.
To learn more details about the extensive oil and gas development in each of the impacted states, follow these links:
Oil and gas threat map for Pennsylvania. Currently, there are ~104,000 oil and gas wells, compressors, and other related facilities here.
Oil and gas threat map for Ohio. Currently, there are ~90,000 oil and gas wells, compressors, and other related facilities here.
Oil and gas threat map for West Virginia. Currently, there are ~16,000 oil and gas wells, compressors, and other related facilities here.
Public input options
The U.S. Fish and Wildlife Service (USFWS) announced in the Federal Register in late November 2016 its intent to prepare an environmental impact statement (EIS) and hold five public scoping sessions about the permit, as well as an informational webinar. In keeping with the parameters of an environmental impact statement, USFWS is particularly interested in input and information about:
Aspects of the human environment that warrant examination such as baseline information that could inform the analyses.
Information concerning the range, distribution, population size, and population trends concerning the covered species in the plan area.
Additional biological information concerning the covered species or other federally listed species that occur in the plan area.
Direct, indirect, and/or cumulative impacts that implementation of the proposed action (i.e., covered activities) will have on the covered species or other federally listed species.
Information about measures that can be implemented to avoid, minimize, and mitigate impacts to the covered species.
Other possible alternatives to the proposed action that the Service should consider.
Whether there are connected, similar, or reasonably foreseeable cumulative actions (i.e., current or planned activities) and their potential impacts on covered species or other federally listed species in the plan area.
The presence of archaeological sites, buildings and structures, historic events, sacred and traditional areas, and other historic preservation concerns within the plan area that are required to be considered in project planning by the National Historic Preservation Act.
Any other environmental issues that should be considered with regard to the proposed HCP and potential permit issuance.
The public comment period ends on December 27, 2016. Links to more information about locations of the public hearings, as well as instructions about how to sign up for the December 20, 2016 informational webinar can be found at this website. In addition, you can electronically submit comments about the “conservation plan” by following this link.
https://fractracker.org/wp-content/uploads/2016/12/Eastern-small-footed-bat-header.jpg4301500Karen Edelsteinhttps://fractracker.org/wp-content/uploads/2025/09/2025-Wordmark-Logo.pngKaren Edelstein2016-12-12 14:22:072021-04-15 15:04:19“Taking” Wildlife in PA, OH, WV
By Wendy Park, senior attorney with the Center for Biological Diversity
If the Bureau of Land Management (BLM) gets its way, large areas of Mississippi’s Bienville and Homochitto national forests will be opened up to destructive fracking. This would harm one of the last strongholds for the rare and beautiful red-cockaded woodpecker, create a new source of climate pollution, and fragment our public forests with roads, drilling pads and industrial equipment. That’s why we’re fighting back.
My colleagues and I at the Center for Biological Diversity believe that all species, great and small, must be preserved to ensure a healthy and diverse planet. Through science, law and media, we defend endangered animals and plants, and the land air, water, and climate they need. As an attorney with the Center’s Public Lands Program, I am helping to grow the “Keep It in the Ground” movement, calling on President Obama to halt new leases on federal lands for fracking, mining, and drilling that only benefit private corporations.
That step, which the president can take without congressional approval, would align U.S. energy policies with its climate goals and keep up to 450 billion tons of greenhouse gas pollution from entering the atmosphere. Already leased federal fossil fuels will last far beyond the point when the world will exceed the carbon pollution limits set out in the Paris Agreement, which seeks to limit warming to 1.5 °C above pre-industrial levels. That limit is expected to be exceeded in a little over four years. We simply cannot afford any more new leases.
Fracking Will Threaten Prime Woodpecker Habitat
In Mississippi, our concerns over the impact of fracking on the rare red-cockaded woodpecker and other species led us to administratively protest the proposed BLM auction of more than 4,200 acres of public land for oil and gas leases the Homochitto and Bienville national forests. The red-cockaded woodpecker is already in trouble. Loss of habitat and other pressures have shrunk its population to about 1% of its historic levels, or roughly 12,000 birds. In approving the auction of leases to oil and gas companies, BLM failed to meet its obligation to protect these and other species by relying on outdated forest plans, ignoring the impact of habitat fragmentation, not considering the effects of fracking on the woodpecker, and ignoring the potential greenhouse gas emissions from oil and gas taken from these public lands. The public was also not adequately notified of BLM’s plans.
Mississippi National Forests, Potential BLM Oil & Gas Leasing Parcels, and Red Cockaded Woodpecker Sightings
According to the National Forest Service’s 2014 Forest Plan Environmental Impact Statement, core populations of the red-cockaded woodpecker live in both the Bienville and Homochitto national forests, which provide some of the most important habitat for the species in the state. The Bienville district contains the state’s largest population of these birds and is largely untouched by oil and gas development. The current woodpecker population is far below the target set by the U.S. Fish and Wildlife Service’s recovery plan. A healthy and fully recovered population will require large areas of mature forest. But the destruction of habitat caused by clearing land for drilling pads, roads, and pipelines will fragment the forest, undermining the species’ survival and recovery.
New leasing will likely result in hydraulic fracturing and horizontal drilling. In their environmental reviews, BLM and the Forest Service entirely ignore the potential for hydraulic fracturing and horizontal drilling to be used in the Bienville and Homochitto national forests and their effects on the red-cockaded woodpecker. Fracking would have far worse environmental consequences than conventional drilling. Effects include increased pollution from larger rigs; risks of spills and contamination from transporting fracking chemicals and storing at the well pad; concentrated air pollution from housing multiple wells on a single well pad; greater waste generation; increased risks of endocrine disruption, birth defects, and cardiology hospitalization; and the risk of earthquakes caused by wastewater injection and the hydraulic fracturing process (as is evident in recent earthquakes in Oklahoma and other heavily fracked areas).
Greenhouse Gas Emissions and Climate Change
Oil and gas development also results in significant greenhouse gas emissions from construction, operating fossil-fuel powered equipment during production, reclamation, transportation, processing and refining, and combustion of the extracted product. But BLM and the Forest Service have refused to analyze potential emissions or climate change effects from new leasing. Climate change is expected to worsen conditions for the woodpecker, compounding the harms of destructive drilling practices. Extreme weather events will become more frequent in the Southeast U.S. as temperatures rise. Hurricane Katrina resulted in significant losses of woodpecker habitat and birds in the Mississippi national forests. The Forest Service should be redoubling its efforts to restore and preserve habitat, but instead it is turning a blind eye to climate change threats.
At a time when world leaders are meeting in Morocco to discuss the climate crisis and scientists tell us we already have enough oil and gas fields operating to push us past dangerous warming thresholds, it’s deeply disturbing that the Obama administration continues to push for even more oil and gas leases on America’s public lands. The BLM’s refusal to acknowledge and analyze the effects of fracking on the climate, at-risk species, and their habitat, is not only inexcusable it is illegal. The science is clear: The best way to address catastrophic warming — and protect wildlife — is to keep fossil fuels in the ground.
PA DCNR recently released a draft State Forest Resource Management Plan. The draft plan, last revised in 2007, is an important tool that the Bureau of Forestry (BOF) uses to help manage Pennsylvania’s approximately 2.2 million acre state forest system. Approximately 1.5 million acres of state forest lands lie within the shale gas fairway and gas extraction – along with related issues like water resources – is among the numerous subjects addressed in the document.
In total, approximately 673,000 acres are available for oil and gas development in PA state forests, either because private interests own the mineral rights below the land or because DCNR has opened up state-lands for drilling where it controls the mineral rights.
Approximately 386,000 acres have been leased by DCNR to allow drilling. DCNR’s shale gas monitoring report in 2014 said that only 16% of available state forest lands have been developed, which means that 84% (or 328,700 acres) could still be accessed for oil and gas through DCNR leases. Another 287,000 acres of state forest land sits atop private mineral rights. Mineral rights supersede – or overrule – those of the surface rights.
By some estimates, the projected “drillout” of state forest lands may include an additional 2,000 to 3,000 unconventional natural gas wells. There are concerns that the draft plan also does not adequately address the full scale and scope of such drilling and the serious impacts associated with it.
Derived from available data, FracTracker has prepared the following portrait of the projected impact to Pennsylvania’s state forest estate with emphasis on the resource-intensive nature of hydraulic fracturing and its extensive footprint on this sensitive landscape.
Table 1. Projected land use needed to add 2,000 to 3,000 more wells on PA state forestlands
Facility Type
Unit
Projected Drilled Wells
2,000
3,000
Well Pads
#
606
909
Acres
2,477
3,716
Limit Of Disturbance (LOD)*
Acres
7,130
10,695
Gathering Lines
Acres
20,189
30,284
Addtl. Mid/Down-stream Facilities
Acres
2,847
4,271
Compressor Stations**
#
126-210
189-316
Acres
2,978-4,976
4,466-7,464
ESTIMATED TOTAL
Acres
36,621
54,931
*Limit of Disturbance includes infrastructure, mounded earth, etc. needed to access and service the well pads. **1 compressor station is needed for every 25-30 miles of gathering lines, at 15-30 acres per station.
In Ohio, well pads average 4-5 acres, 3.4 laterals per well pad, and 8.5 acres of gathering line per acre of well pad. However, each pad has what we are calling a “Limit of Disturbance,” which includes infrastructure, mounded earth, etc. LOD likely represents a conservative estimate of miscellaneous land disturbance as it does not include the access roads; it was not possible with our current datasets to discern which roads were specifically added to access the well pads. LODs are averaging 10-14 acres.
Using the 2,000-3,000 wells proposed, the total acreage that could be disturbed by new well pads, well pad LODs, gathering lines, compressor stations, and related mid/downstream facilities in PA’s state forests would be between and 36,621 and 54,931 acres depending on the number and size of compressor stations (i.e., averaging 24 acres) (Table 1).
Water Use
Table 2. Projected resource use and waste produced per well based on OH, WV, and PA historical figures.
Variable
Unit
Avg
Increase / Quarter
Water Needed
Gallons
3.5 MGs
–
PA Stats
Gallons
4.4 MGs
–
OH Stats*
Gallons
6.2-7.0 MGs
405-410 K
WV Stats
Gallons
7.9 MGs
450 K
Drill Cuttings**
Tons
1,050
4.96
OH Stats
Tons
700+ (estimate)
4.7-5.2
PA Stats
Tons
1,400
–
Landfill Waste (Drilling Muds)
Tons / Facility
28,098
15,319
Silica Sand
Tons
4,303
86
Injection Waste
Gallons / Quarter
117 MGs
5.4 MGs
* 7-9% of injected fluids returns to the surface as fracking waste ** significantly dependent upon lateral length
https://fractracker.org/wp-content/uploads/2015/10/Forest-PA-Feature.jpg400900FracTracker Alliancehttps://fractracker.org/wp-content/uploads/2025/09/2025-Wordmark-Logo.pngFracTracker Alliance2015-11-04 10:40:372020-03-12 13:44:21The Ultimate Price of PA State Forest Drilling
Each silica sand mine displaces 871 acres of wetlands and more than 12 square miles of forests and agriculture land in Wisconsin to provide the shale gas industry with fracking proppant.
By Juliana Henao, Communications Intern
Silica sand is used by the oil and gas industry as a way to prop open the fractures made during fracking – and is also referred to as a proppant. The industry’s demand for silica sand is steadily increasing (i.e., 4-5K tons per shale lateral, +86 tons per lateral per quarter), directly affecting the Great Lakes, their ecosystems, and land use. Silica sand is often found in Wisconsin and Michigan, which have felt the effects of increased sand mining demands through altered landscapes, impacted ecosystem productivity, and altering watershed resilience; these impacts will only continue to increase as the demand for silica sand increases.
To better understand frack sand mining’s current and potential effects, FracTracker’s Ted Auch and intern Elliott Kurtz, with generous support from the Save The Hills Alliance, explored mining and land use changes data in West Central Wisconsin (WCW). In their research paper, Auch and Kurtz show the current and future environmental impacts of increased sand mining in WCW in order to supply the oil and gas industry with sand. Not only does this research illustrate what is at risk in the WCW landscape, it also showcases what sand mining has already done to the region.
Sixteen percent, or 2,396 square miles, of the West Central Wisconsin (WCW) is made up of wetlands or open waters. These and the other existing WCW landscapes are unquestionably profitable. The forests buffer climate change impacts – to date accumulating between 4.8-9.8 billion tons of CO2 assuming they are 65-85 years old – and have a current stumpage value of $253-936 million.
The 25 producing silica mines in this region occupy 12 square miles of WCW and have already displaced:
3 mi2 of forests
7 mi2 of agricultural land-cover
1.36 mi2 of wetlands (equal to 11% of all mined lands)
Formerly, these wetlands were one of three types:
18% (158 acres) forested wetlands
41% (353 acres) lowland shrub wetlands, and
41% (361 acres) emergent/wet meadows
Breakdown of the current landscape types near these expanding mines, based on an analysis of satellite imagery
Why Wisconsin?
There are more than 125 silica sand mines throughout WCW, a stretch of ~16,000 square miles. Previously, the mining industry focused their efforts in Oklahoma and Texas’s Riley, Hickory/Brady, and Old Creek formations, where the land is not as agriculturally or ecologically productive as WCW. Now, more and more mines are being proposed and built in the WCW region. We wanted to determine what this change would mean for such an ecosystem diverse area of Wisconsin – many of which are considered “globally imperiled” or “globally rare” including oak savanna, dry prairies, southern dry-mesic forests, pine barrens, moist cliffs and oak openings.
The St. Peter Sandstone – along with the early Devonian and much smaller Sylvania Sandstone in Southeastern Michigan – is the primary target of the silica sand industry. Carbon-rich grassland soils cover 36% of the St. Peter, where they aid the ecosystem by capturing and sorting 20.9 tons of CO2 per year, as well as purifying precipitation inputs. This ecosystem, amongst many others around sand mining activities, will be dramatically altered if silica sand mining continues at its increasing rate. We will see CO2 capturing levels drop from 20.9 tons to 10.6 tons per acre per year if the highly productive temperate forests are not reassembled and reclaimed to their original acreage, as well as a significant loss (75%) in agricultural productivity on sites that are not reclaimed properly.
Out-of-state mining companies are settling into Wisconsin and displacing the land at a very high rate. As the president of Iowa’s Allamakee County Protectors Ric Zarwell told us by email “Frac sand mining companies do not come from the area where I live. So efforts to destroy landscapes for frac sand are going to involve Neighbors Opposing Invaders.”
A high demand in silica sand from the shale gas industry will continue to drive this influx of mining companies into WI, providing a potentially collapsed ecosystem in the future. Factors at play include additional – and often much larger – mines under consideration, the average shale gas lateral grows by > 50 feet per quarter, and silica sand usage will grow from 5,500 tons to > 8,000 tons per lateral (i.e., 85 tons per quarter per lateral). Auch and Kurtz’s research paper describes in detail where how much silica sand might be needed in the future, as well as a detailed set of maps depicting land cover and usage in WI.
Sea otters, an endangered keystone species, are at risk due to offshore oil and gas drilling spills. Along the west coast of the U.S., this marine mammal’s habitat is commonly near offshore drilling sites, specifically in California and Alaska.
Sea Otters – a Keystone Species
Sea otter numbers used to range from several hundred thousand to more than a million. Today, there are estimated to be just over 106,000 in existence worldwide, with fewer than 3,000 living in California. Their habitats range from Canada, Russia, Japan, California and Washington, but the majority of all wild sea otters are found in Alaskan waters.
Sea otters play a significant role in their local environments, and a much greater ecosystem role than any other species in their habitat area. Sea otters are predators, critical to maintaining the balance of the near-shore kelp ecosystems, and are referred to as keystone species. Without this balancing act, coastal kelp forests in California would be devoured by other aquatic life. Sea otter predation helps to ensure that the kelp community continues to provide cover and food for many of the marine animals. Additionally, kelp plays a tremendous role in capturing carbon in the coastal ecosystems. In that sense, sea otters also inadvertently help to reduce levels of atmospheric carbon dioxide.
Oil Spills and their Health Implications
Recently, Alaska and California, home to a wide variety of marine life, have been popular areas for offshore oil and gas drilling, which may include the use of fracking to extract hydrocarbons. Oil spills are a great concern for the sea otter; unlike other marine animals that may be able to eventually rid themselves of the oil, contact with the oil causes the sea otters fur to mat, preventing insulation, which can lead to hypothermia. Additionally, the ingestion of toxic oil chemicals while cleansing their fur can cause liver and kidney failure, as well as severe damage to their lungs and eyes.
Because their numbers are low and their geographic location area is rather small compared to other sea otter populations, the California sea otter is especially vulnerable, and could be devastated by oil contamination.
Prince William Sound, Alaska
Exxon Valdez cleanup. Photograph by Natalie Fobes, National Geographic
On March 24, 1989, the tanker vessel Exxon Valdez ran aground on Bligh Reef in Prince William Sound, Alaska, spilling an estimated 42 million liters of Prudhoe Bay crude oil. This incident affected marine life throughout western Prince William Sound, the Gulf of Alaska, and lower Cook Inlet. An estimated 3500–5500 otters from a total population of about 30,000 may have died as a direct result of the oil spill. Oiling and ingestion of oil-contaminated shellfish may have affected reproduction and caused a variety of long-term sublethal effects. Necropsies of sea otter carcasses indicated that most deaths of sea otters were attributed to the oil, and pathologic and histologic changes were associated with oil exposure in the lung, liver, and kidney. Studies of long-term effects indicate that the sea otter population in the Prince William Sound area suffered from chronic effects of oil exposure at least through 1991. While some populations may recover after a spill, it would seem that the threat of oil pollution impacts is intensified for populations in deteriorating habitats and to those that are in decline.
Santa Barbara Coast, California
LA Santa Barbara Oil Spill Cleanup – Photo by: Brian van der Brug / Los Angeles Times
On Tuesday, May 19, 2015, a pipeline was found to be leaking into the Santa Barbara Coast in California. This broken pipeline, owned by Plains All American, spilled approximately 105,000 gallons of crude oil into the ocean, according to various news reports, stretching out into a 4-mile radius along the central California coastline.
These waters are home to an array of shore birds, seals, sea lions, otters and whales. Numerous amounts of marine life have been found washed up on the shore, including crabs, octopuses, fish, birds, and dolphins. Elephant seals, sea lions, and other marine wildlife have been taken to Seaworld in San Diego for treatment and recovery.
The Santa Barbara accident occurred on the same stretch of coastline as spill in 1969 that – at the time – was the largest ever incident in U.S. waters and contributed to the rise of the American environmental movement. Several hundred-thousand gallons spilled from a blowout on an oil platform, and thousands of seabirds were killed and numerous ocean wildlife, including sea lions, elephant seals, and fish perished.
Conclusion
Overall, the ocean is home to a great diversity of marine wildlife, all of which are vulnerable to oil contamination. Offshore gas drilling is a significant threat to the survival of sea otters and other marine life, wherein spills and accidents could cause health problems, toxicity, and even death. Oil spills are exceptionally problematic for sea otters, due to the vulnerable state of this animal and its endangered species state. Keeping keystone species healthy is instrumental to maintaining a well flourished ecosystem, while protecting habitats for a large array of marine and wildlife. The potential impacts on CA sea otters and other marine life due to events such as the 2015 oil spill in California should not be taken lightly.
https://fractracker.org/wp-content/uploads/2015/06/Otter-Feature.jpg400900FracTracker Alliancehttps://fractracker.org/wp-content/uploads/2025/09/2025-Wordmark-Logo.pngFracTracker Alliance2015-06-30 13:00:062025-05-02 14:45:36Offshore Oil and Gas Drilling: Risks to the Sea Otter
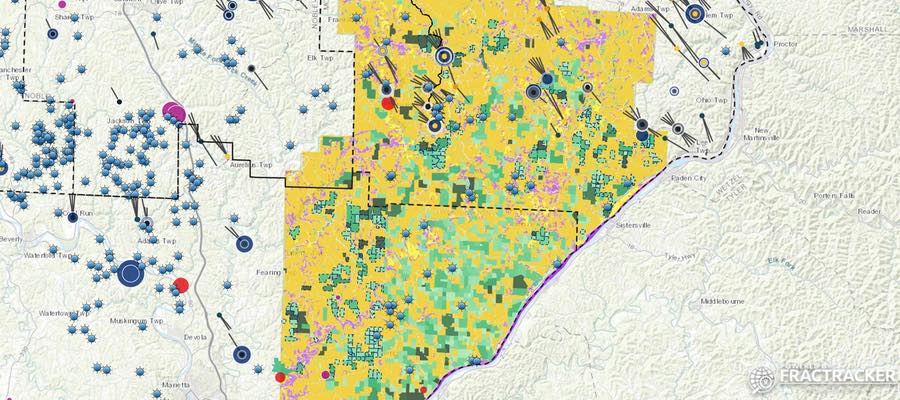


")
")
")
")
")
")

")

")


")
")


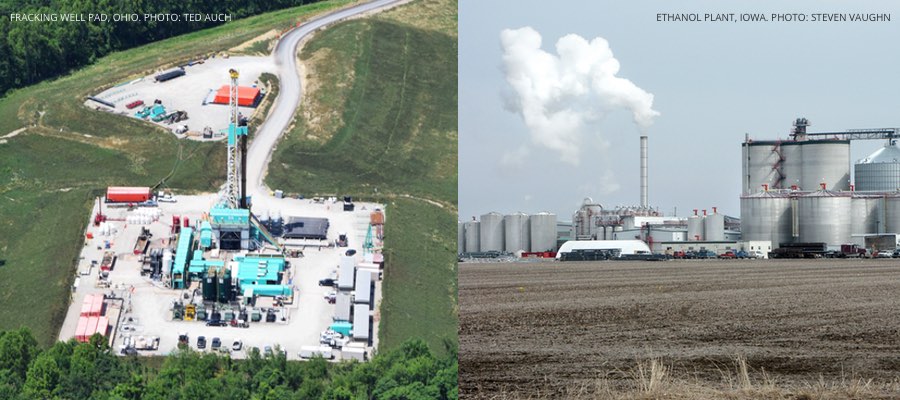
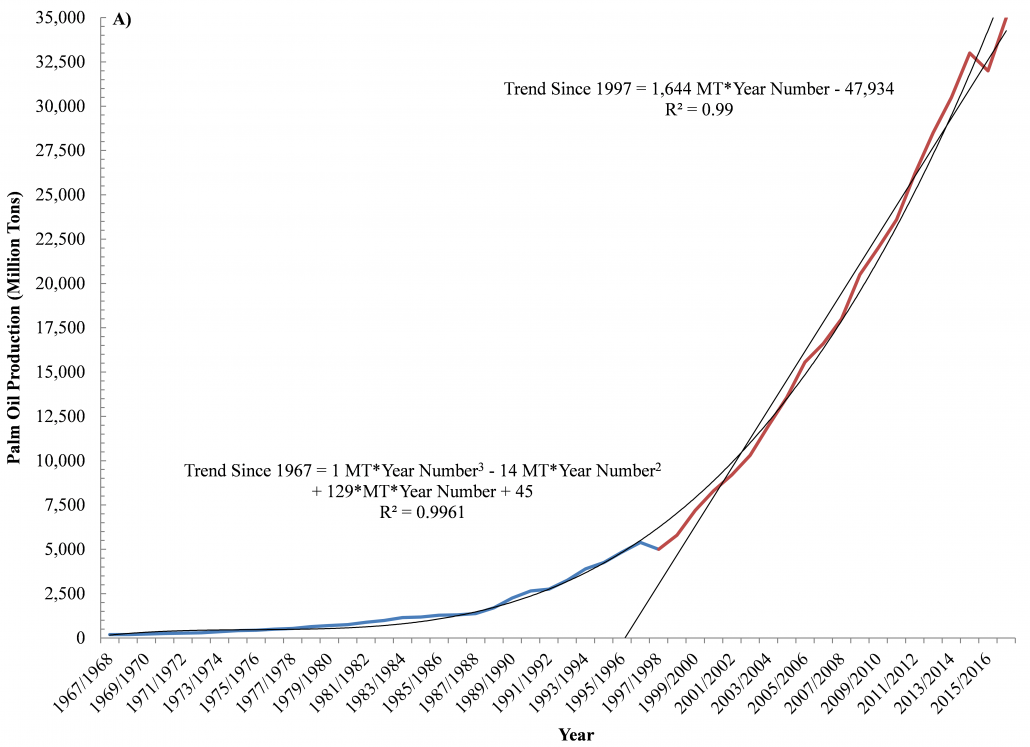
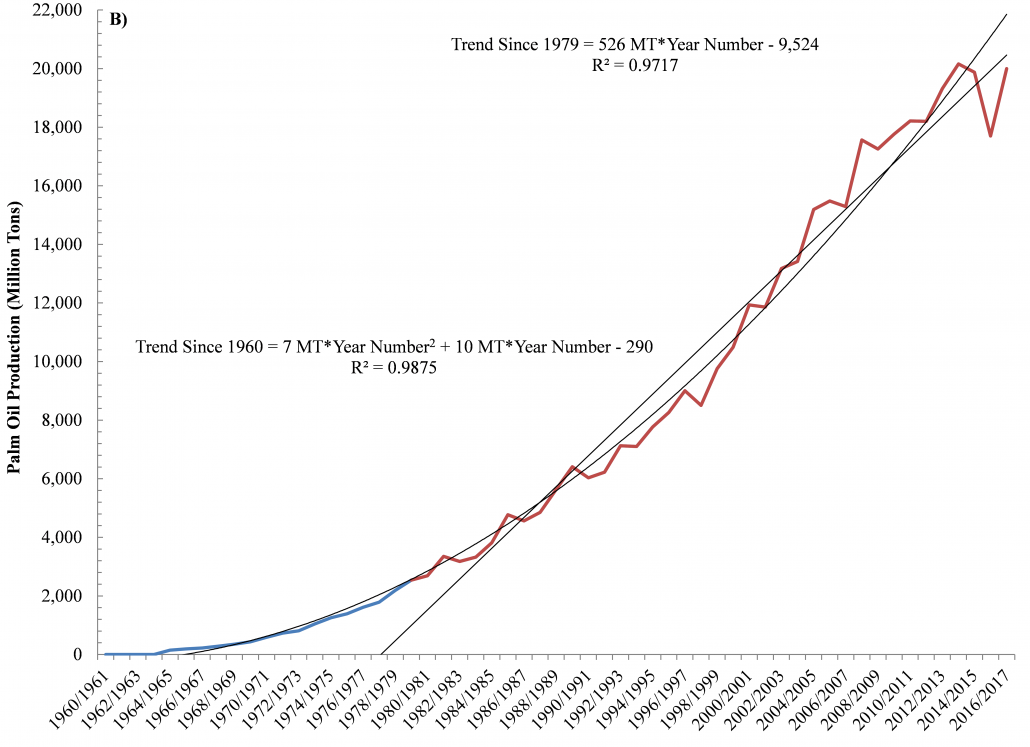
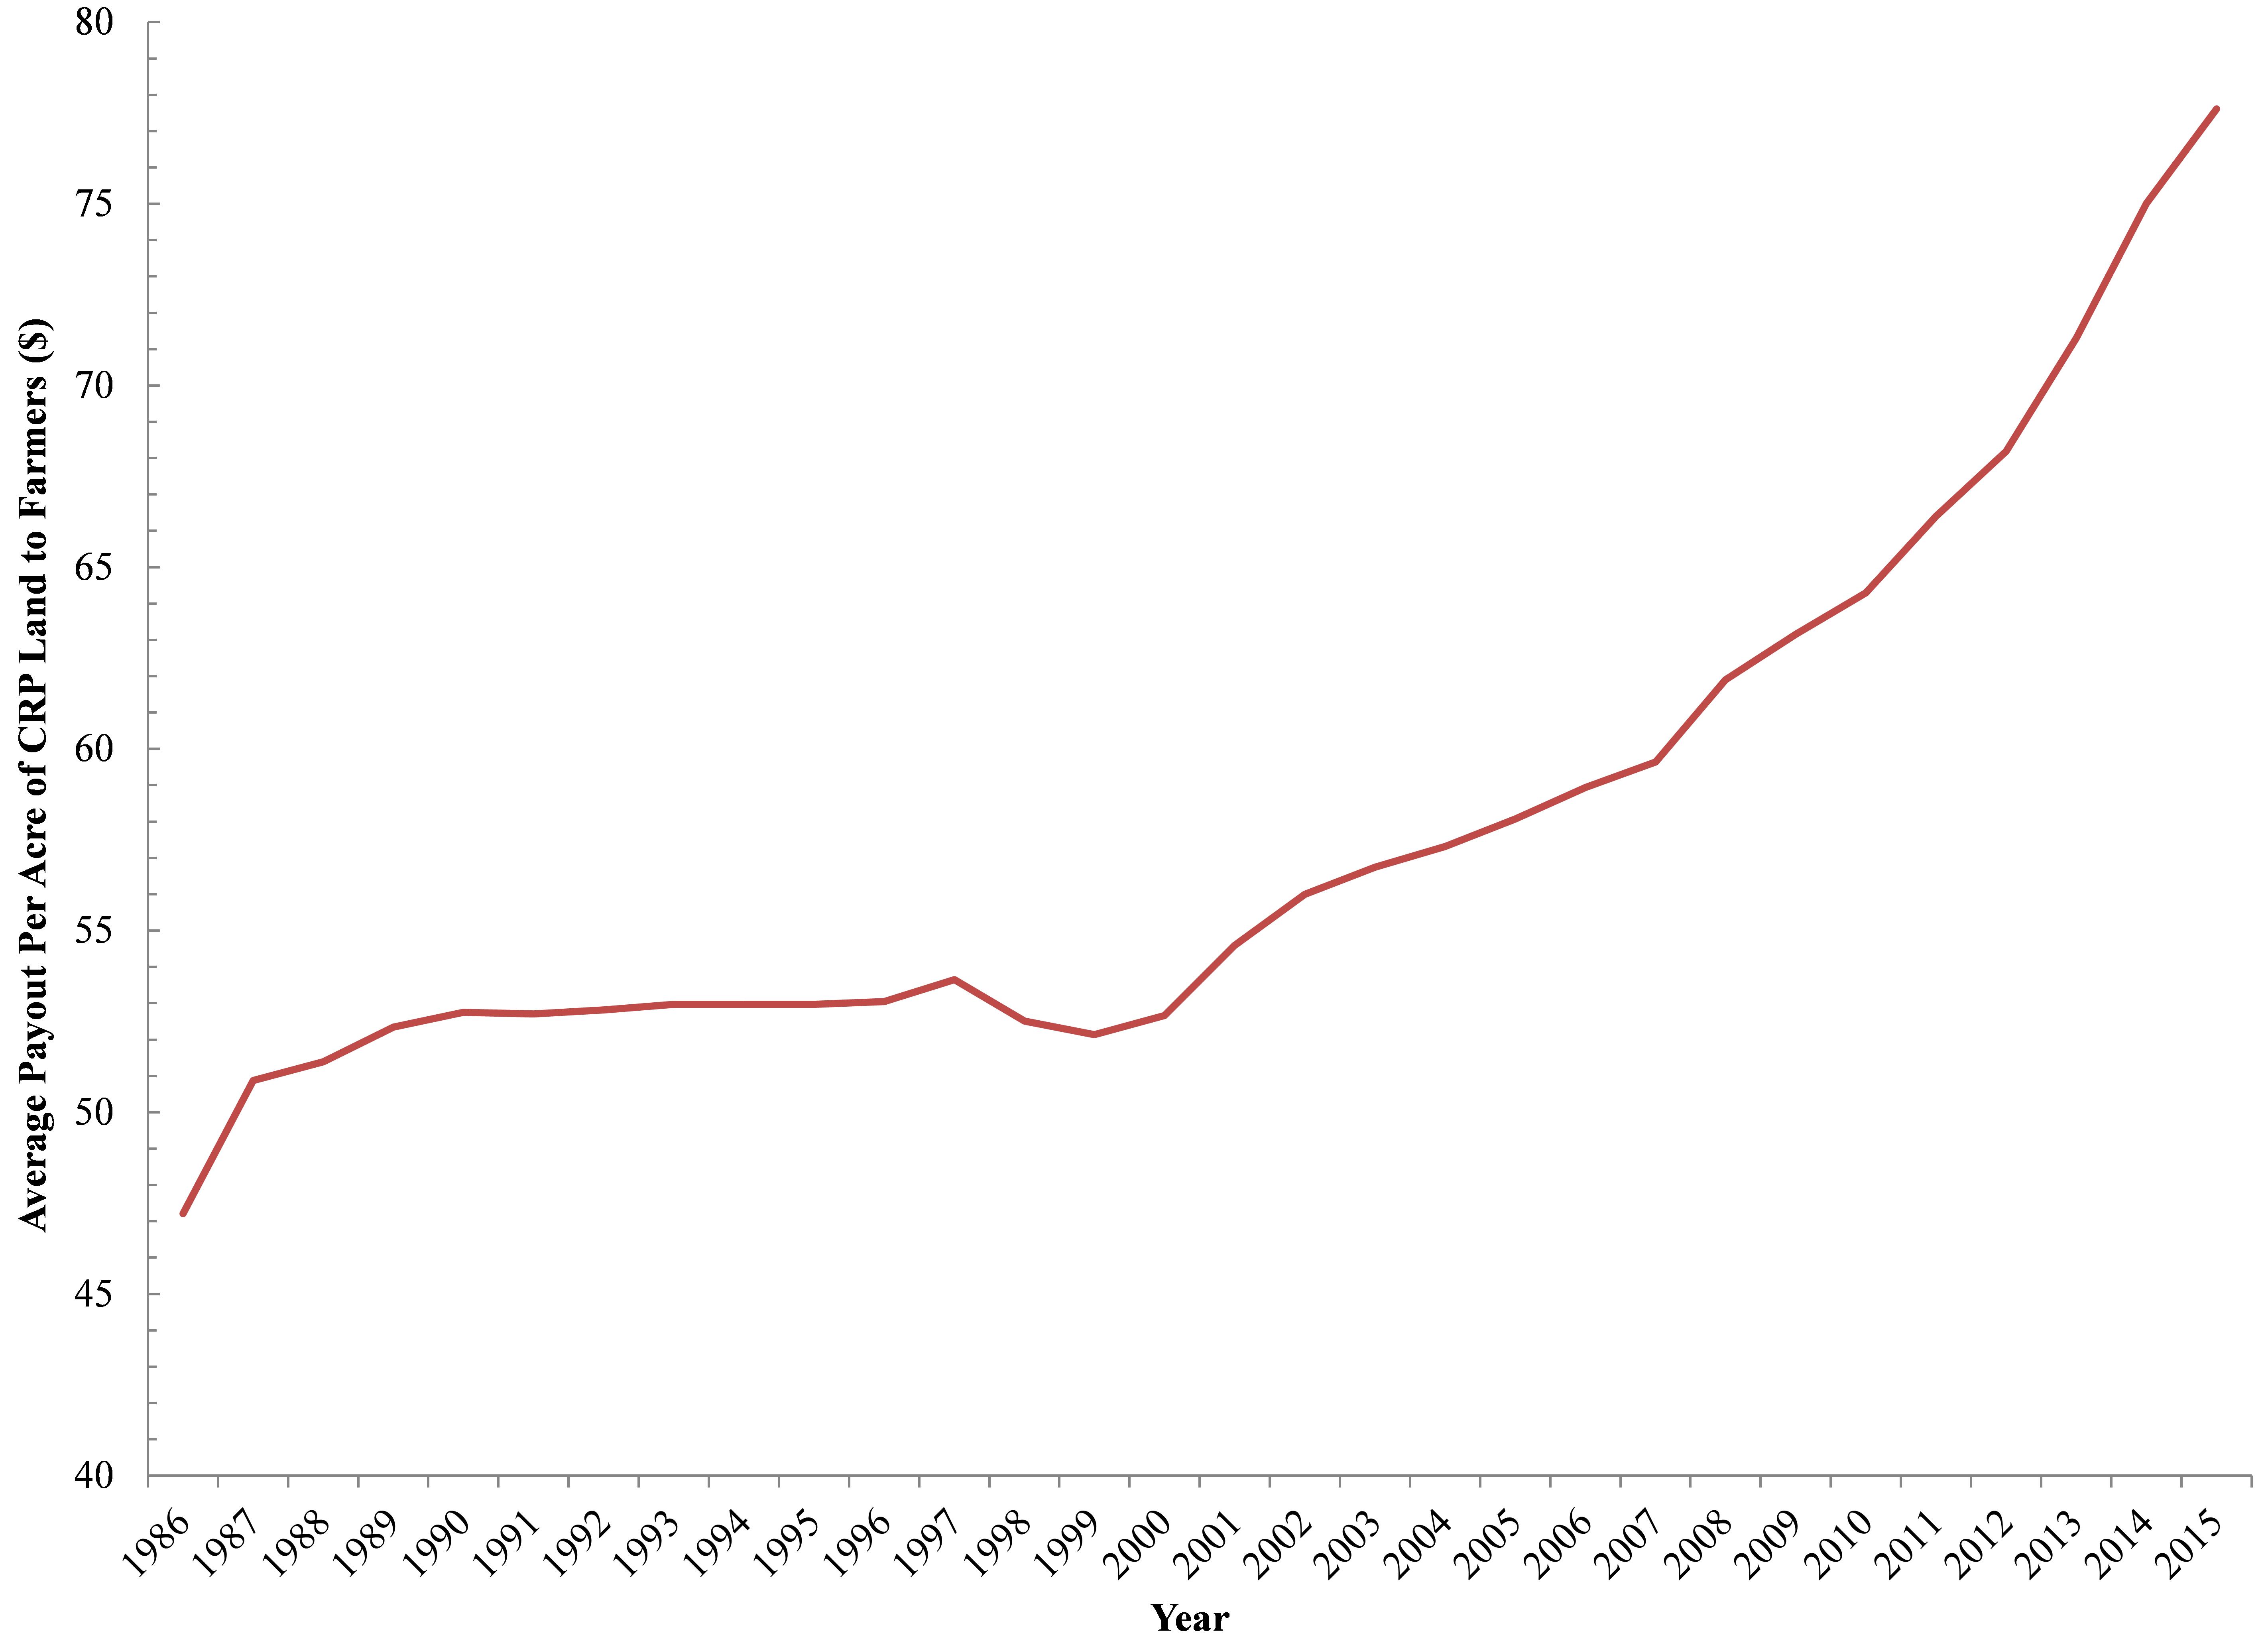

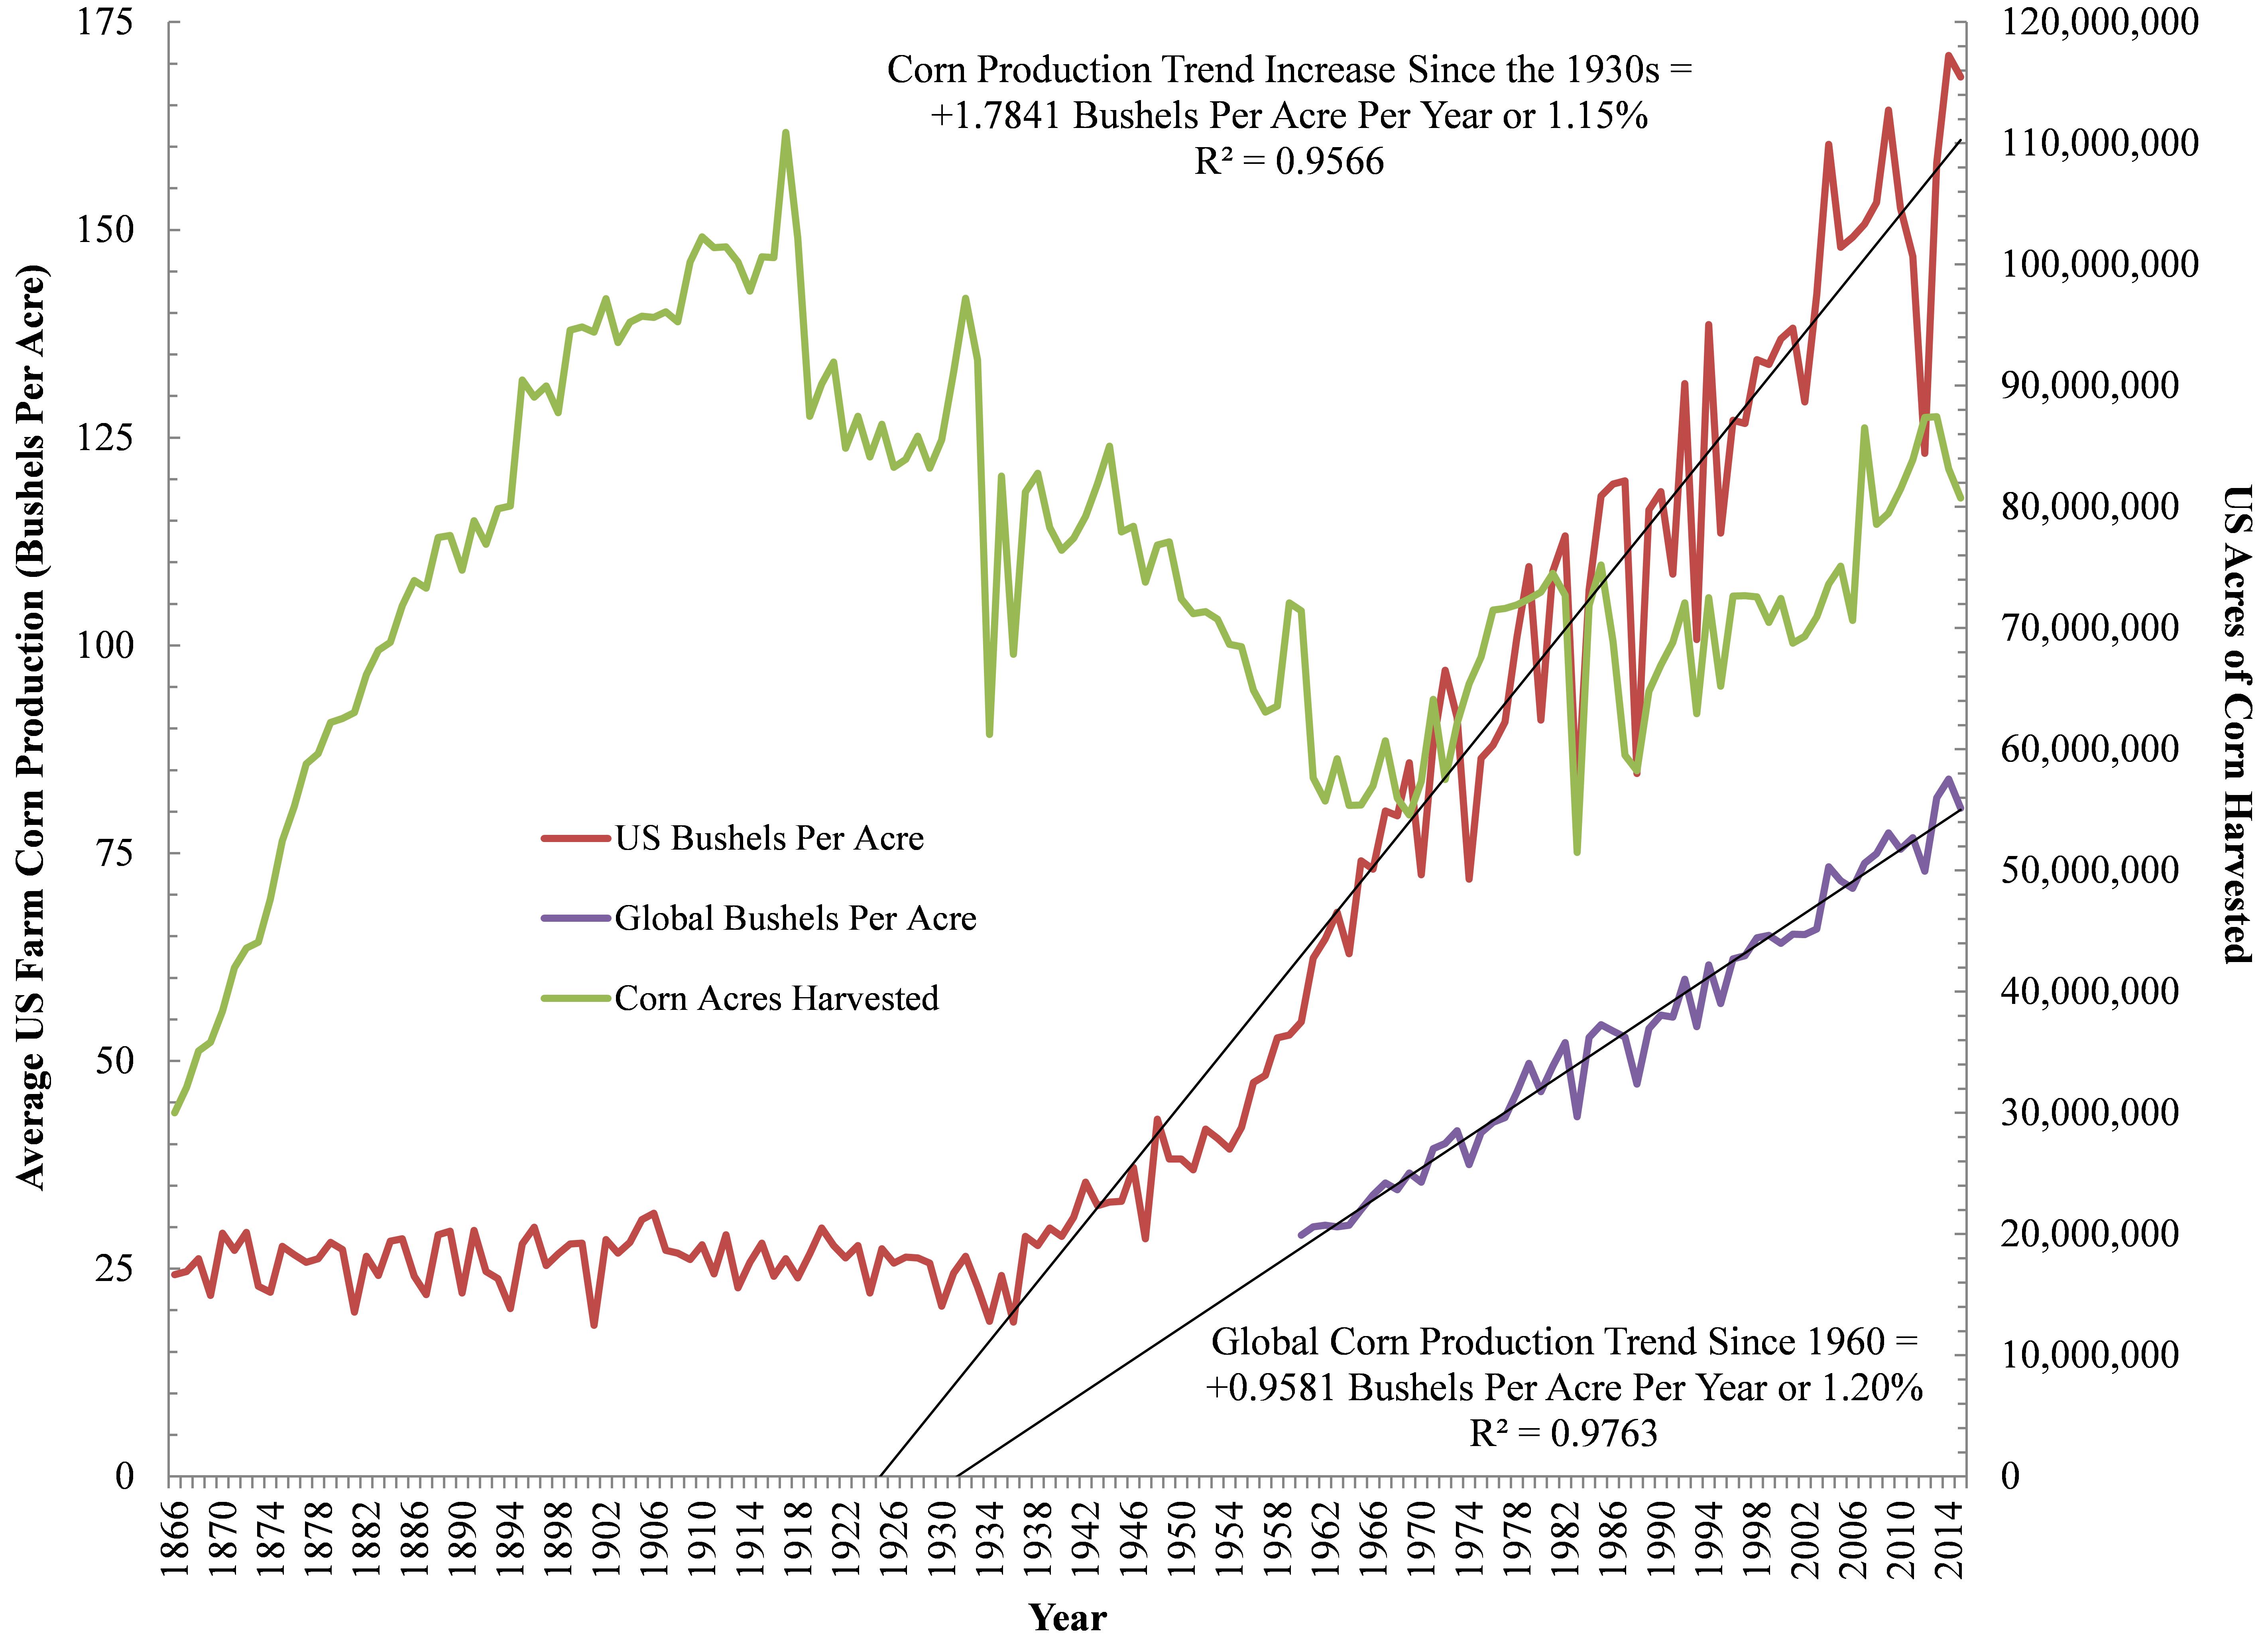
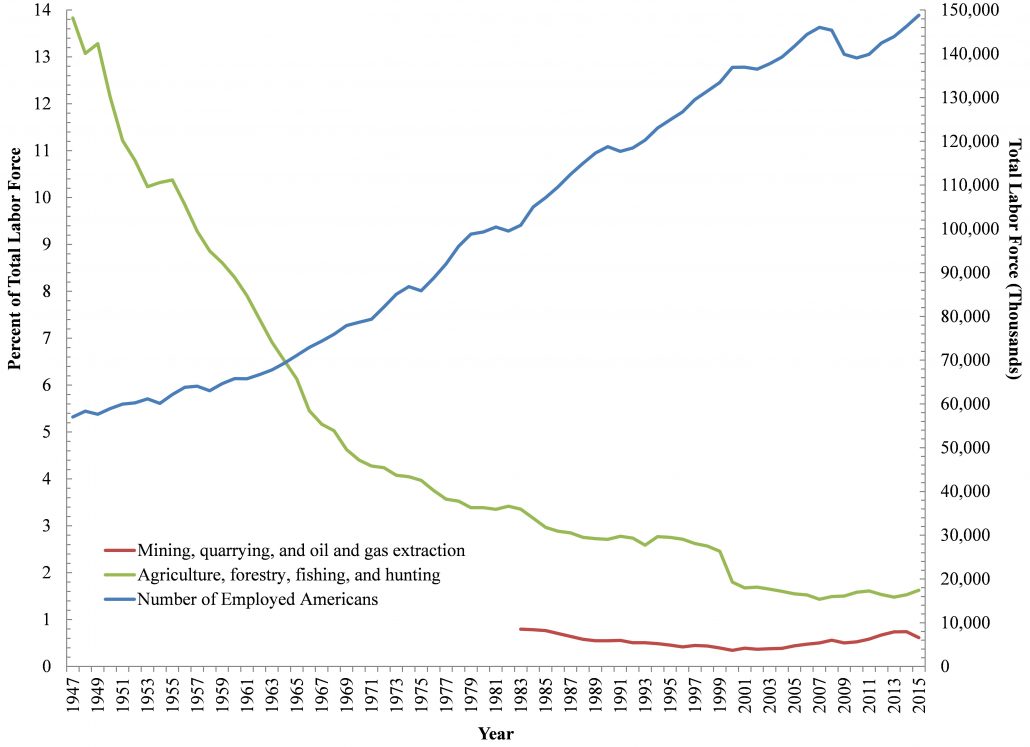
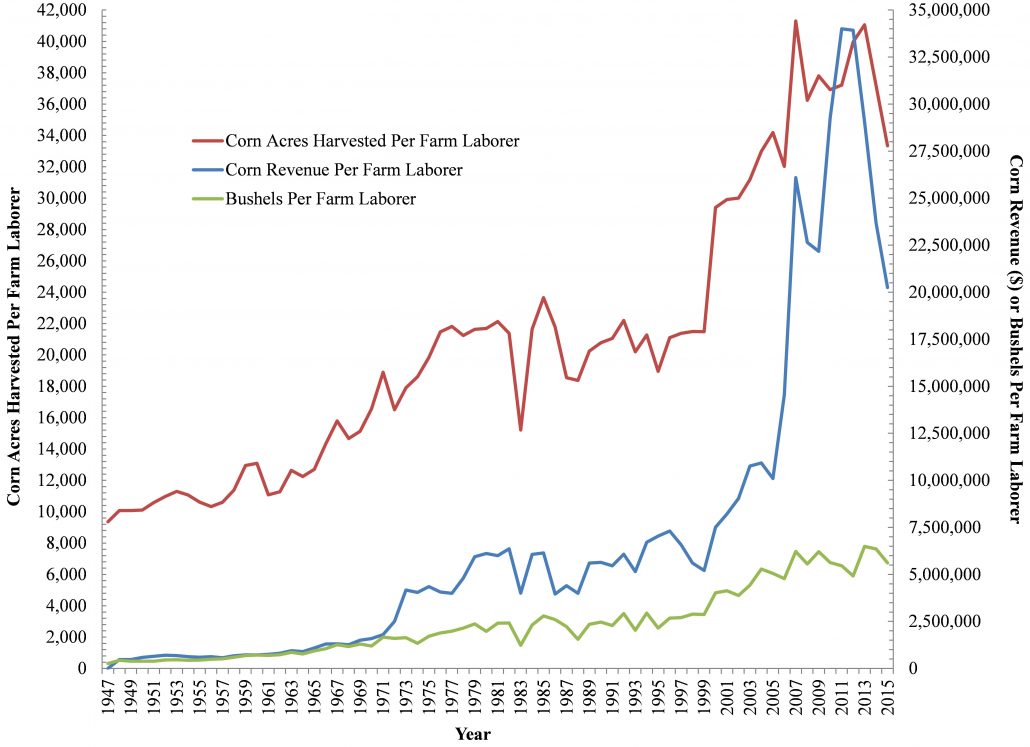
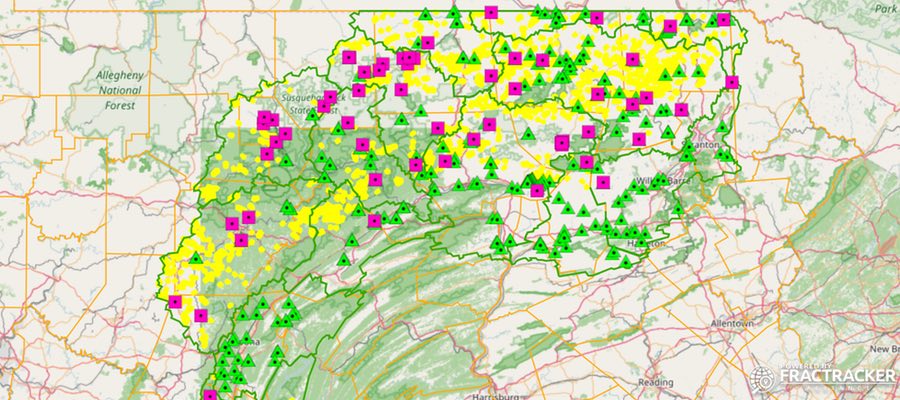
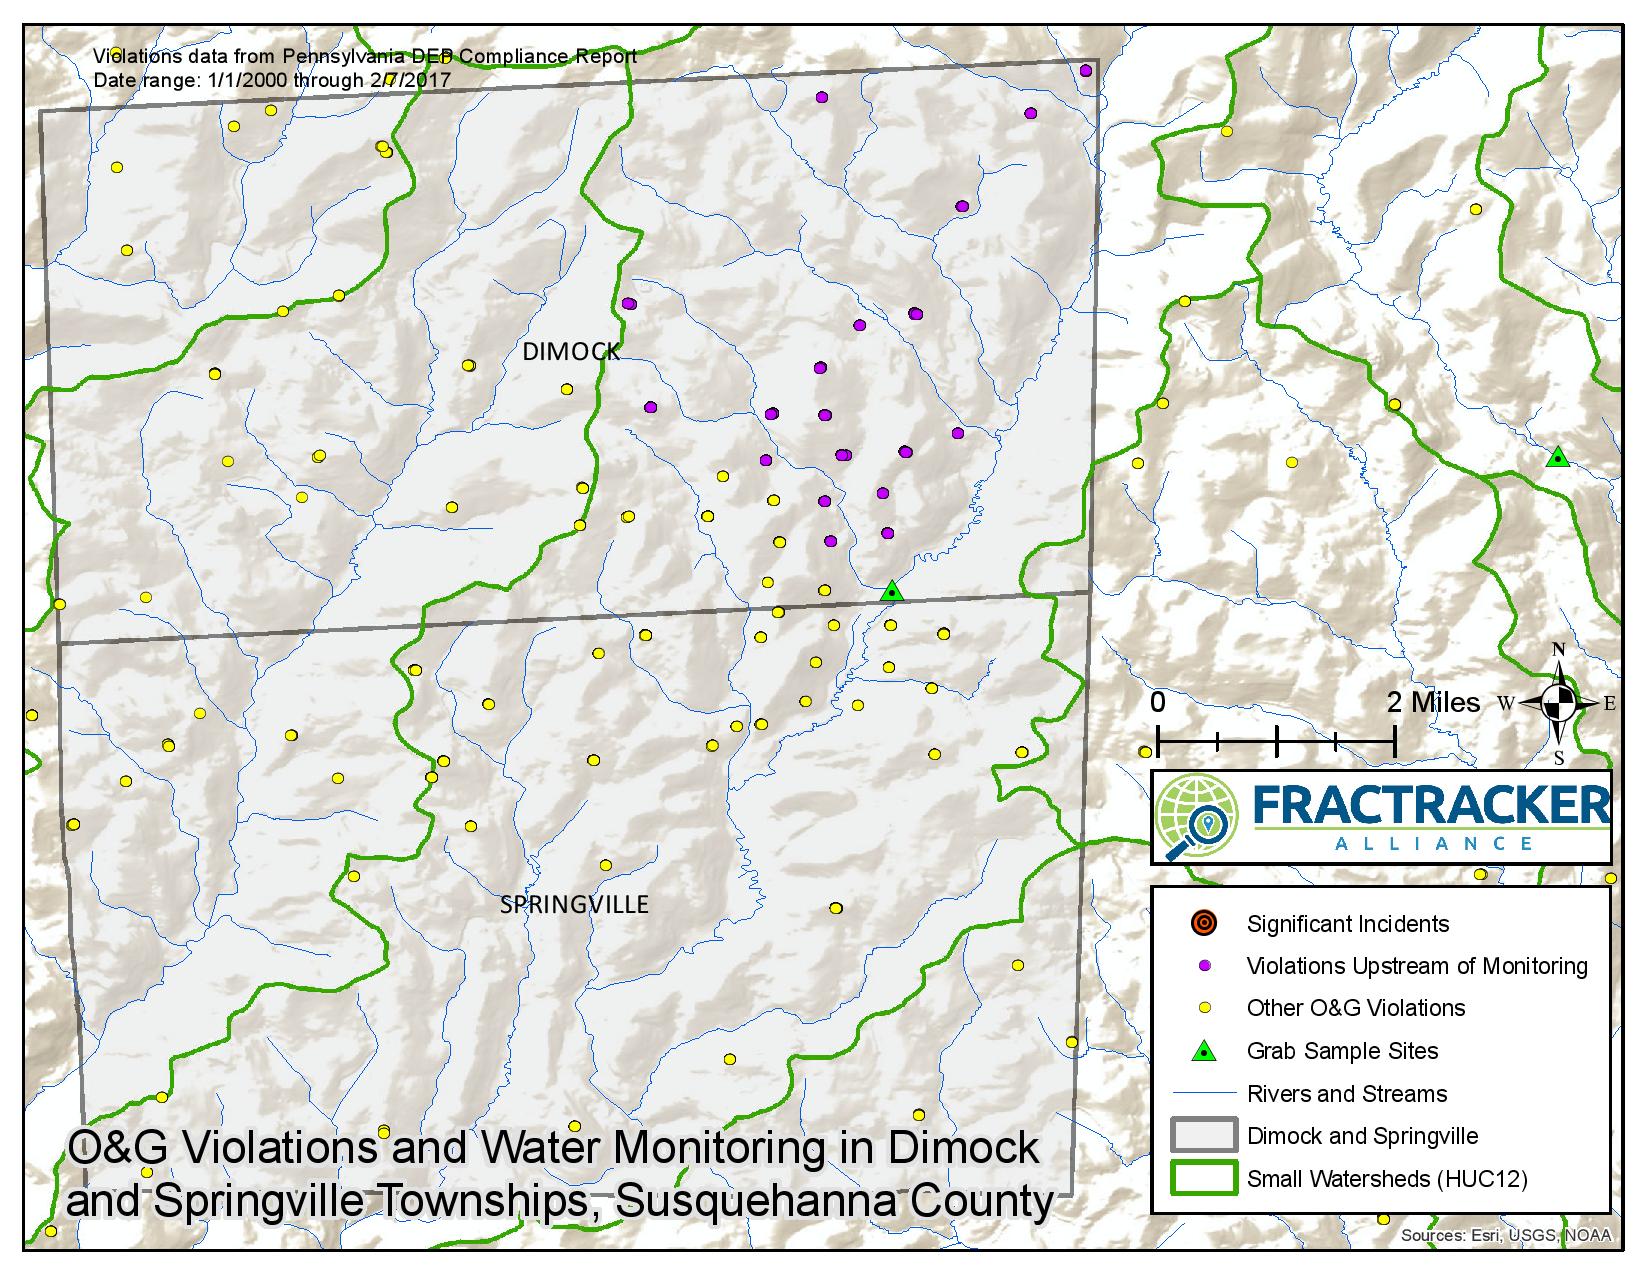
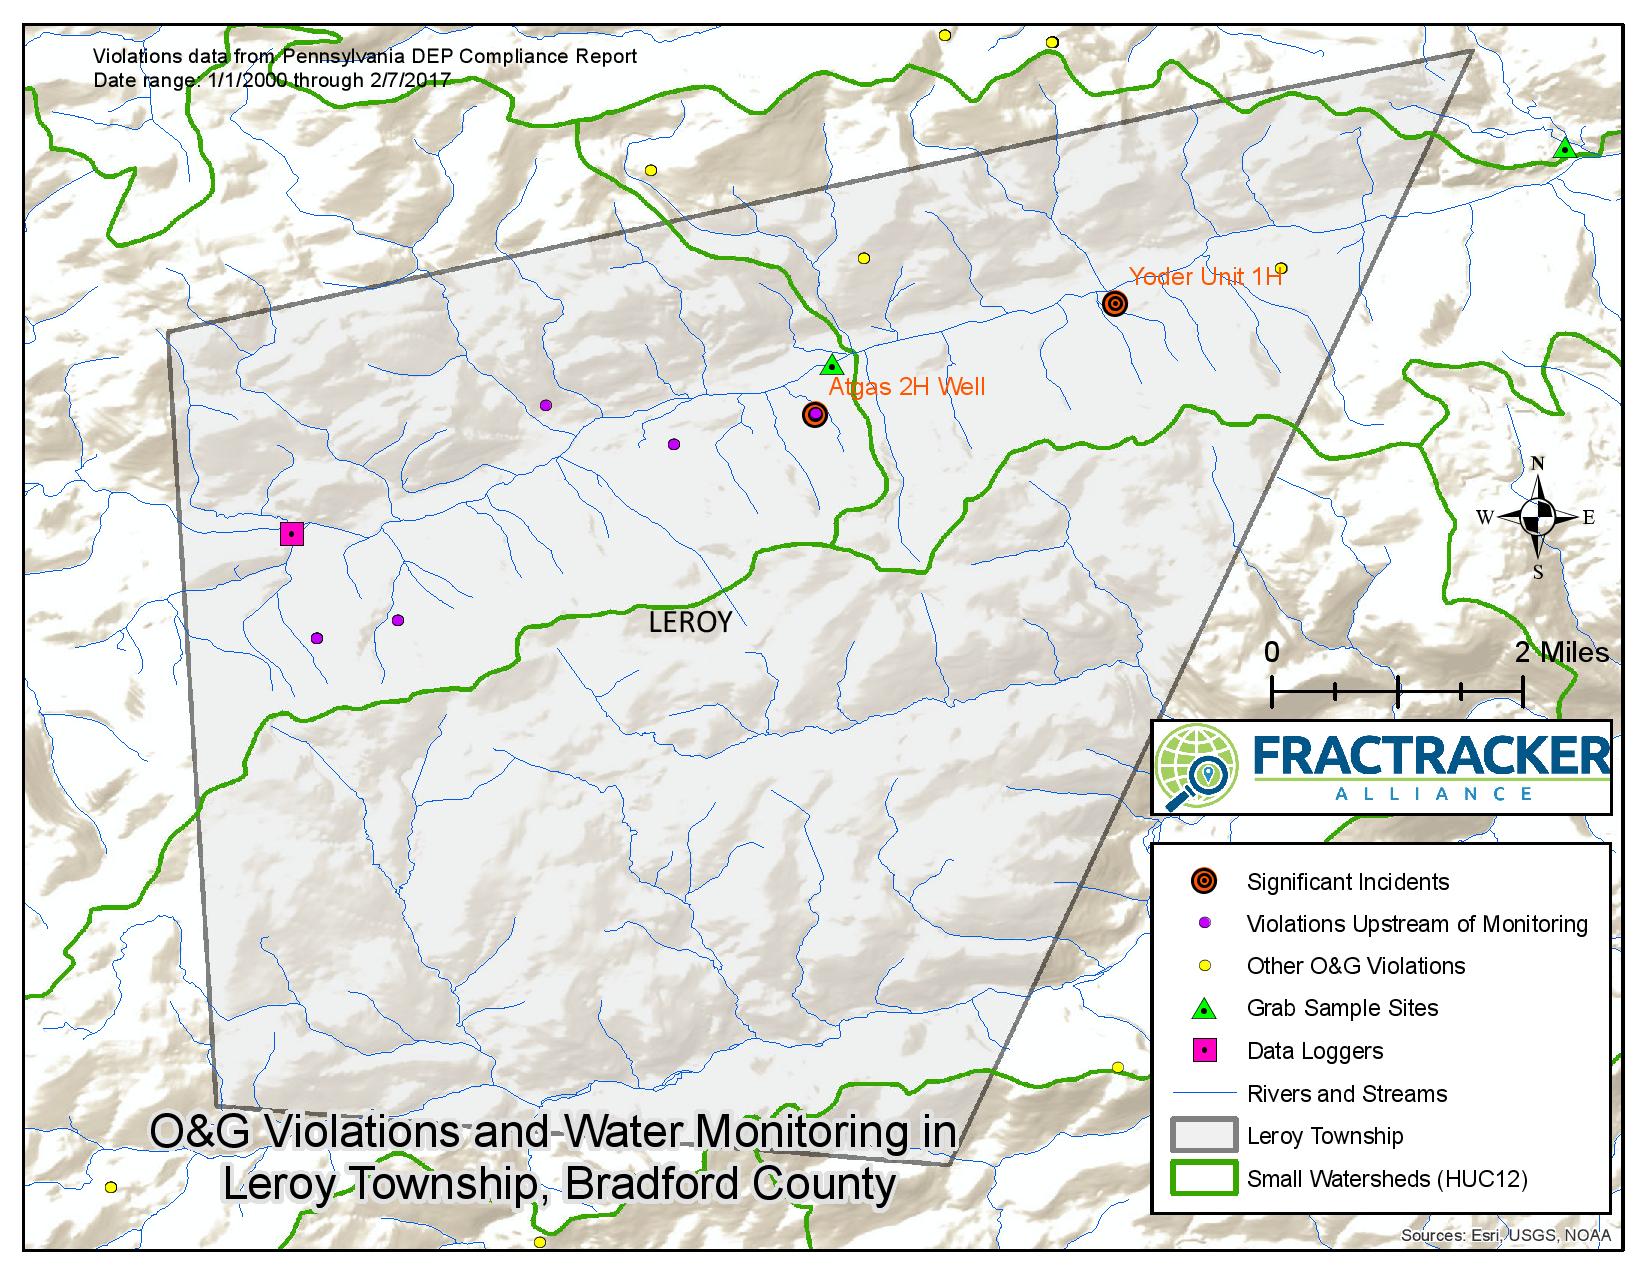
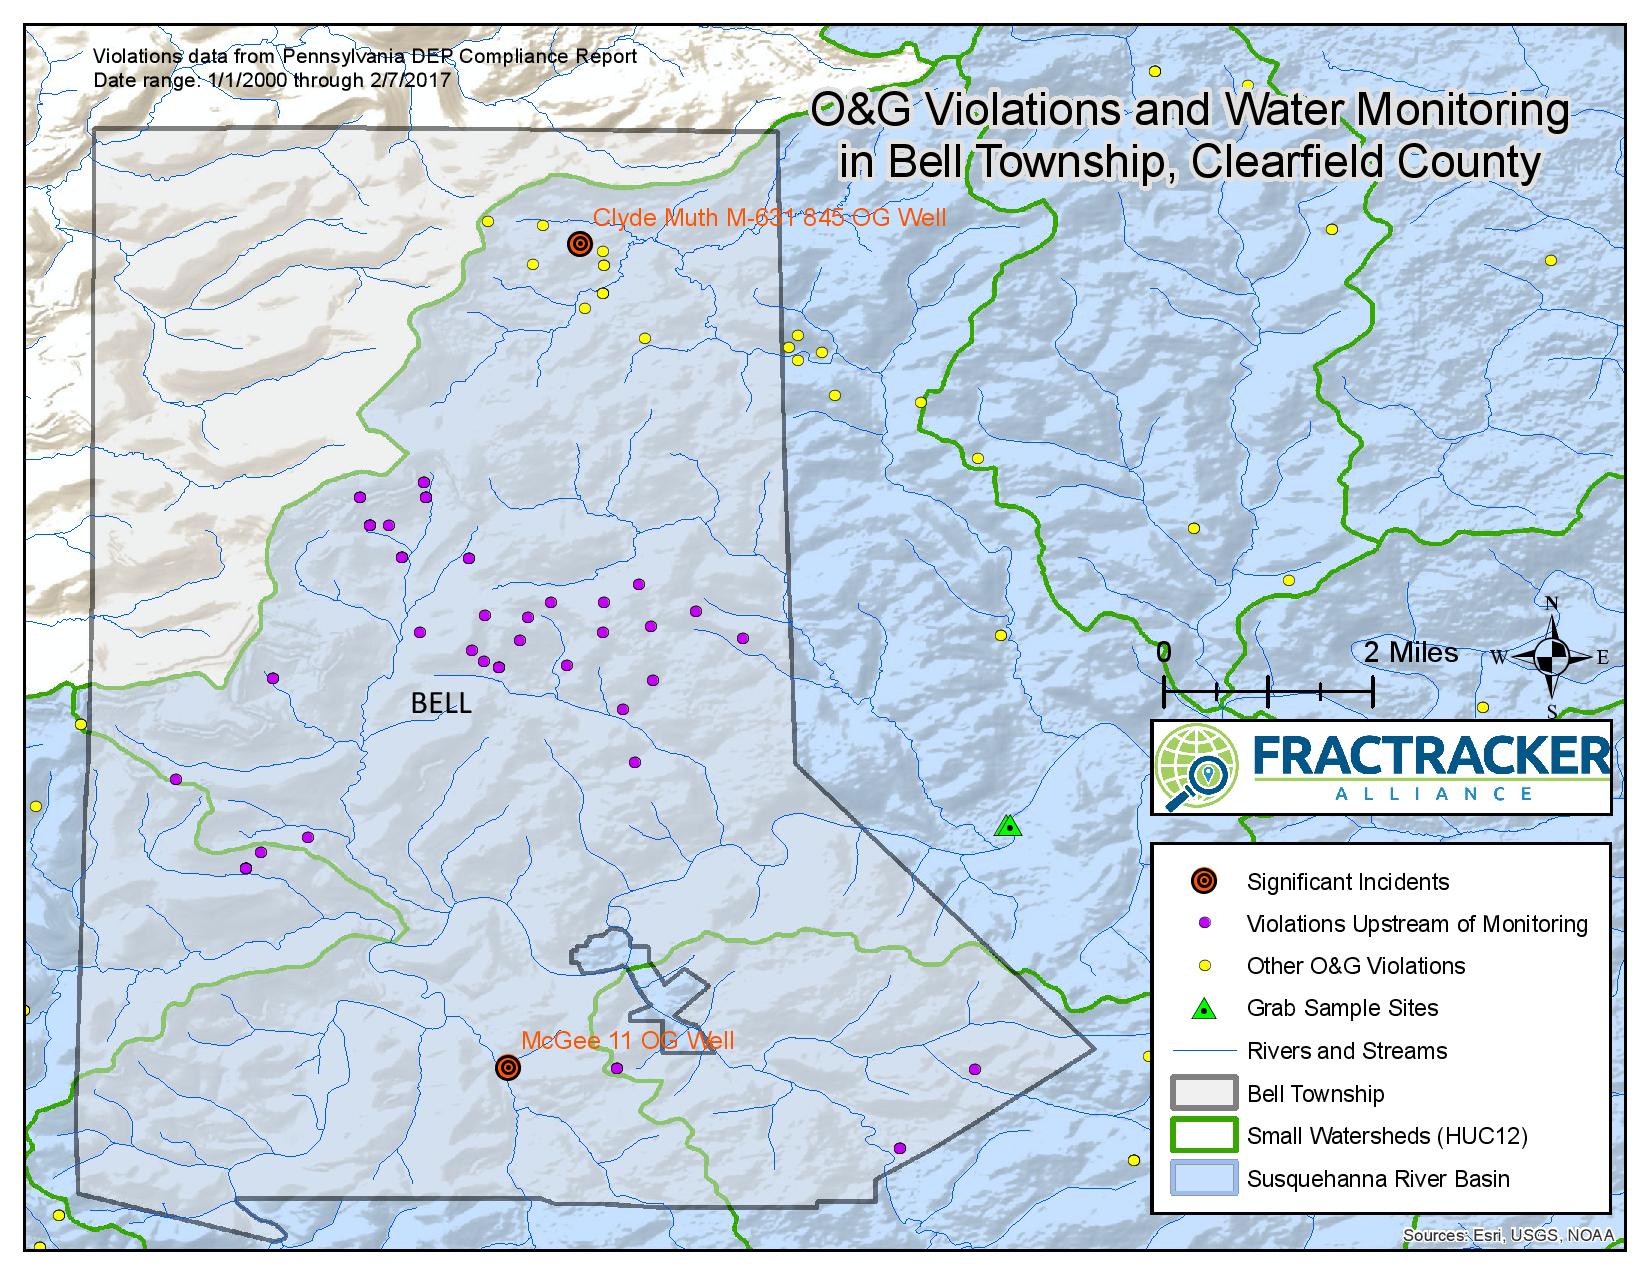
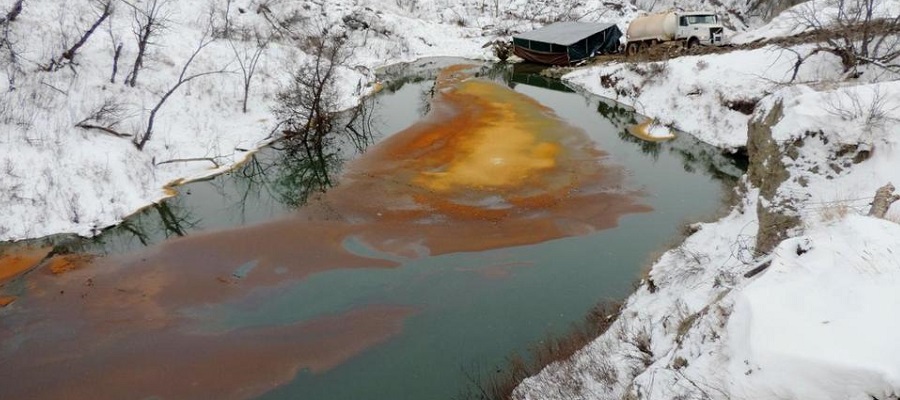

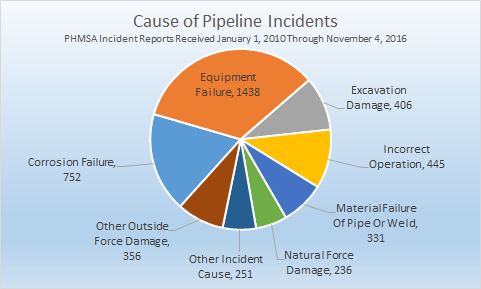
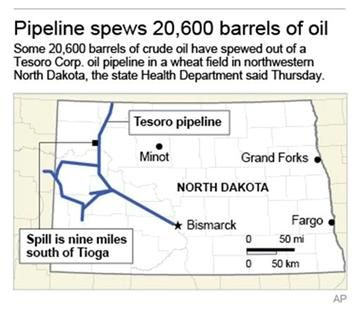


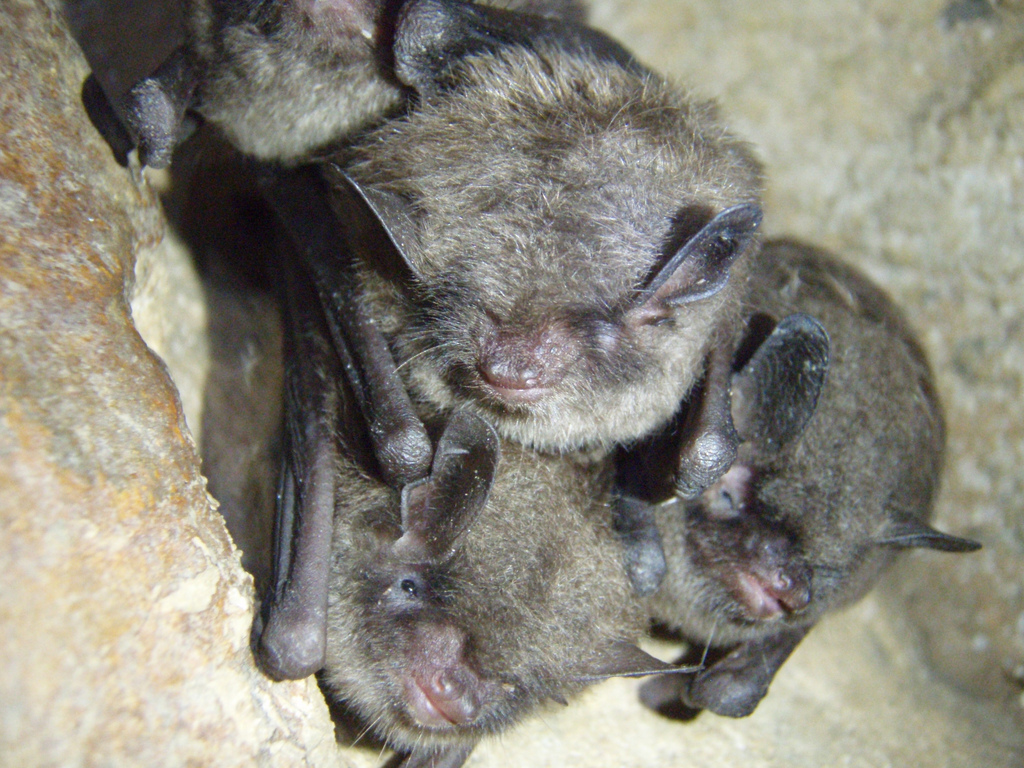


