This page has been archived. It is provided for historical reference only.
Did you know that there have been sixty horizontal oil and gas wells drilled in Pennsylvania since 2008 that are not Marcellus Shale wells? Since they are bunched together, I have split them into two separate maps, one for Southwestern Pennsylvania, and another for the northern portions of the state.
Click on the gray compass rose and double carat (^) to hide those menus. For more information on any well, click the “i” button in the blue circle, then any map feature.
[maps removed]
https://www.fractracker.org/a5ej20sjfwe/wp-content/uploads/2025/09/2025-Wordmark-Logo.png00Matt Kelso, BAhttps://www.fractracker.org/a5ej20sjfwe/wp-content/uploads/2025/09/2025-Wordmark-Logo.pngMatt Kelso, BA2012-01-23 17:28:512020-07-21 10:38:53Non Marcellus Shale Horizontal Wells in PA
Last year, Shell Chemicals announced its intentions to build a multi-billion dollar ethylene cracker “in Appalachia”, effectively setting the stage for a bidding war between Ohio, West Virginia, and Pennsylvania. There have been numerous other plans for such plants in the area, including a recent partnership trying to get Aither Chemicals catalytic cracking process up in running, once again, “in Appalachia.” The interest in the region is mostly due to the Marcellus and Utica shale gas produced in the region, which contains mostly methane (so-called natural gas used for heating, cooking, etc.), as well as other hydrocarbons that must be removed from the methane before the gas is put into pipelines. These other hydrocarbons are mostly ethane, propane, and butane, which are converted into ethylene, propylene, and butadiene, respectively, through a process called cracking, and are then used for the creation of plastics, synthetic rubber, and other petrochemicals.
Whichever state lands these massive facilities stands to gain several thousand temporary construction jobs and several hundred permanent positions at the facility. It seems reasonable to take a look at other similar facilities in the country, not only to get a reasonable idea of the economic contribution, but also to gain insight on the facility’s contribution to air pollution in the region.
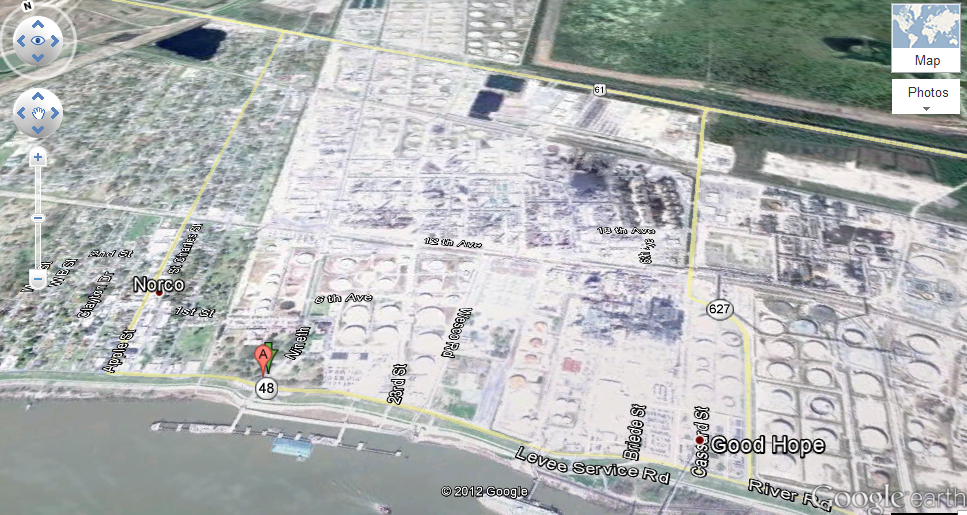
I have chosen to look at the cracker in Norco, Loisiana, also run by Shell Chemicals. Norco is the ultimate company town, named for the now defunct New Orleans Refining Company, it contains not only the Shell plant, but also major petrochemical facilities owned by Dow, Hexion, and Valero. There is also a presence by Motiva, but all indications are that this is functionally part of the Shell plant that is simply owned by a different company.
Norco, LA as seen from Google Earth
According to the Shell page linked above, the facility employs 600 full time workers and 160 contractors for an annual payroll of $50 million. It also contributes $22 million in state, local, and property taxes to the community. That’s all very significant, albeit a far cry from the 17,000 jobs, $1 billion in wages, and $169 million in tax revenues that the good people of Ohio are being promised–perhaps those figures are over the estimated life of the facility, who knows? I’m guessing the proposed facility in Appalachia won’t be 22 times larger than the one in Norco, Louisiana though.
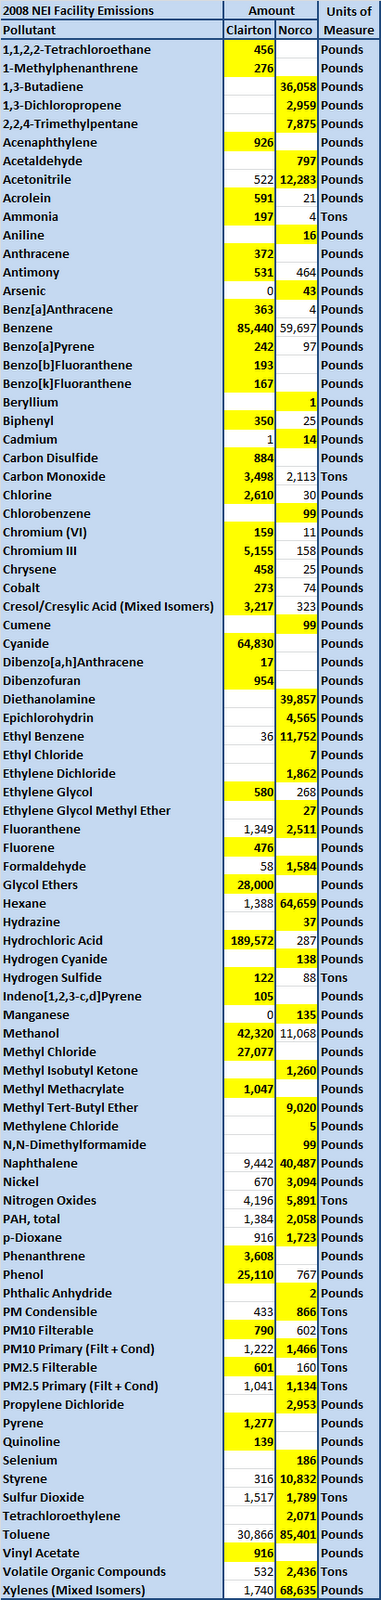
In terms of air emissions, it is hard to know what to expect. Emissions may wind up being quite different from Norco’s due to a different chemical composition of the feedstock, for example. However, to get the conversation started, I have compiled the EPA’s 2008 National Emissions Inventory (NEI) estimated emissions for Norco, as well as a well known polluter that’s already in the area, Clairton Coke Works. I should mention that based on my experience, I don’t have a lot of faith of the validity of NEI data, especially for data in Pennsylvania (see this discussion about Clairton, for example), but it is what’s available. Also, I need to mention that the data for Shell is aggregated between the Norco East, Norco West, and Motiva facilities, because from looking at the the websites for Shell and Motiva, the whole operation seems to be focused around cracking. Let’s take a look:
2008 USEPA National Emissions Inventory for the Coke Works in Clairton, PA and the Shell ethylene cracker in Norco, LA
Now before you go to the EPA site to research these 84 pollutants, I didn’t put these up for direct comparison, since the facilities are obviously quite different. The point is that in an area that still largely in nonattainment for fine particulate matter and just recently re-entering attainment for ozone, the prospect of adding another major emitter of particulates and ozone and particulate precursors (as well as a whole host of other junk) isn’t going to help.
https://www.fractracker.org/a5ej20sjfwe/wp-content/uploads/2025/09/2025-Wordmark-Logo.png00Matt Kelso, BAhttps://www.fractracker.org/a5ej20sjfwe/wp-content/uploads/2025/09/2025-Wordmark-Logo.pngMatt Kelso, BA2012-01-20 14:19:182020-07-21 10:38:53Ethylene Cracker Would Contribute Jobs, Air Pollution
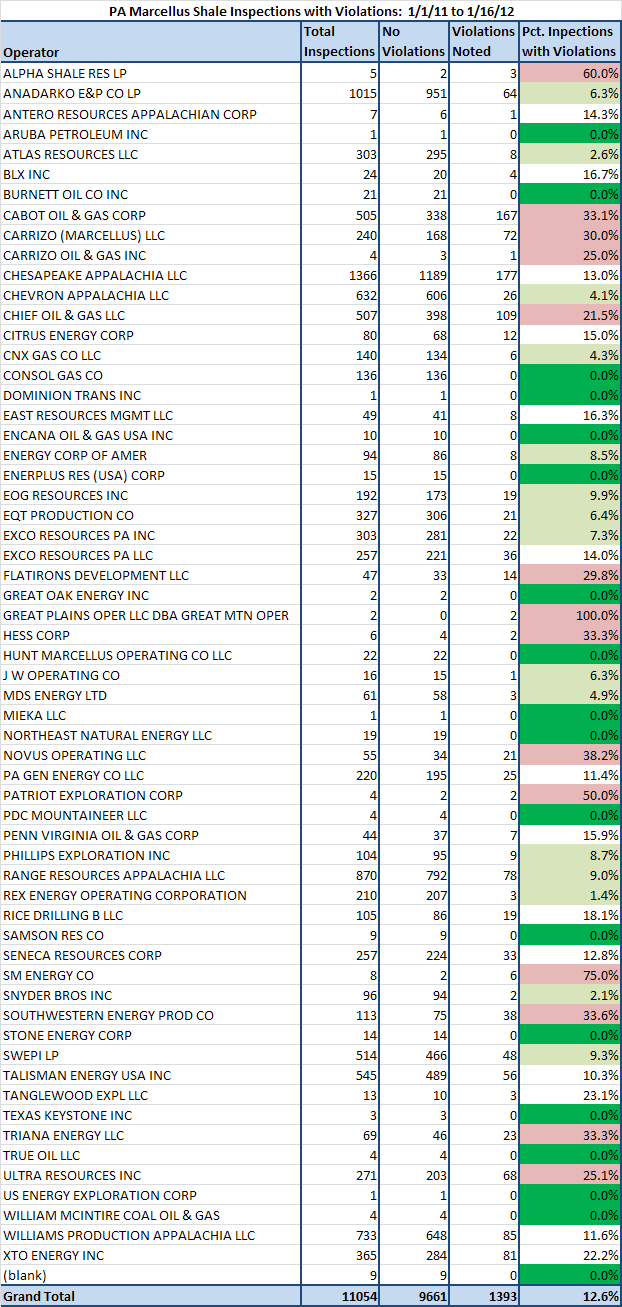
The Pennsylvania Department of Environmental Protection has updated their delivery mechanism of violation data, and it is now possible to search all inspections, including those that do not result in violations. To test it out, I downloaded all oil and gas inspection data from January 1, 2011 to January 16, 2012. Here is a summary of the results from that query:
While the vast majority of instances where no violations were issued were recorded in Column F, it seemed likely to me that no violations would have been issued for any category in rows D through I, so I aggregated those columns and divided by the total number of inspections.
According to the report instructions, the report was intended to include only those violations that resulted in a violation, but the final compliance report does allow for seeing all results. This is a very good thing, a it provides us with another way to evaluate the various operators within industry.
Before I present that data for the Marcellus Shale operators, I should point out a source of skew: When an inspection yields more than one violation, there are multiple entries for the actual inspection. For example, if one inspection yielded ten violations, this analysis would look at it as ten inspections, each of which yielded one violation. Clearly, that would distort the actual number of inspections with violations downward, resulting in more favorable scores for any operator with multiple violations on any one inspection. That in mind, let’s consider the following results to be preliminary. Still, it is useful in combination with the violations per well and violations per million cubic feet of production metrics to triangulate in on the operators’ culture of compliance.
https://www.fractracker.org/a5ej20sjfwe/wp-content/uploads/2025/09/2025-Wordmark-Logo.png00Matt Kelso, BAhttps://www.fractracker.org/a5ej20sjfwe/wp-content/uploads/2025/09/2025-Wordmark-Logo.pngMatt Kelso, BA2012-01-17 15:57:302020-07-21 10:38:52PA Oil and Gas Inspection Data Available
Permits throughout the Marcellus Shale Region. Please click the gray compass rose and double carat (^) to hide those menus.
In addition to the above updates, I have verified that there are currently no Marcellus Shale permits in Maryland and Virginia, although there is interest for such activity in each state. Also, while the Marcellus Shale is not typically thought to extend into Kentucky, the West Virginia wells extended sufficiently close to the border to make searching in neighboring counties worthwhile. While there are wells drilled into other Devonian shales, the Marcellus Shale is not represented in Boyd, Greenup, Lawrence, Martin, or Pike Counties in Kentucky.
https://www.fractracker.org/a5ej20sjfwe/wp-content/uploads/2025/09/2025-Wordmark-Logo.png00Matt Kelso, BAhttps://www.fractracker.org/a5ej20sjfwe/wp-content/uploads/2025/09/2025-Wordmark-Logo.pngMatt Kelso, BA2012-01-10 12:57:182020-07-21 10:38:52DataTool MS Permit Updates Throughout the Marcellus Shale Region
Youngstown, Ohio rang out the old year in style, with a magnitude 4.0 earthquake that apparently felt as far away as Buffalo, but received attention nationally (See the LA Times blog titled 4.0 quake hits Youngstown Ohio. Yes, Ohio.) There is a widespread notion that the temblor was related to Class II injection wells in the area–see for example this Akron Beacon Journal article where Ohio state geologist Michael Hansen is quoted as saying there is “little doubt” that this latest in a series of 11 quakes is the result of activities at injection wells in the immediate area. The article goes on to say that his boss, Ohio Department of Natural Resources director James Zehringer, closed several injection wells in the area as the issue is being examined.
But wait a second…if you go to this NPR link, you see an AP story titled “Earthquake Strikes Near Ohio Fracking Site”, where the same James Zehringer is quoted as saying, “The seismic events are not a direct result of fracking.”
What gives? Actually, there is no discrepancy at all, except that the AP writer lumped injection wells together with hydraulic fracturing, which have some similarities in that they highly pressurized oil injections of oil and gas related fluids, but the two are in fact different. Therefore, saying that the seismic events are not a direct result of fracking is completely true.
But it does make one wonder…most of Pennsylvania has been deemed unsuitable for brine injection wells, which is why much of our waste water has gone to Ohio in the first place. But if these supposedly safe activities can result in a disturbance equivalent to 15 metrics tons of TNT, maybe we don’t really understand what we’re doing down there.
Here are maps showing earthquakes near the Ohio river basin since 1973. For more information on any event, hit the blue “i” button, followed by any map feature. Clicking the gray compass rose and double carat (^) will hide those menus.
https://www.fractracker.org/a5ej20sjfwe/wp-content/uploads/2025/09/2025-Wordmark-Logo.png00Matt Kelso, BAhttps://www.fractracker.org/a5ej20sjfwe/wp-content/uploads/2025/09/2025-Wordmark-Logo.pngMatt Kelso, BA2012-01-01 16:29:092020-07-21 10:38:52Youngstown Earthquake Related to Gas Extraction Industry?
At Rhiza, we love to experiment with new ways of visualizing data that help tell better data stories. In most of our work environments, using data is kind of difficult and visualizing is usually left to data experts. We’d love to see a future where sharing data visualizations (maps, charts, explanations, etc) is as easy as recording and sharing a video on YouTube. Not everything produced will be stellar in quality, but at least we’ll all be a lot further down the road towards breaking down the traditional data silos and moving data aggregation and visualization solely out of the hands of database admins and graphic designers. We’ll still need those folks, their jobs will just get a lot more fun!
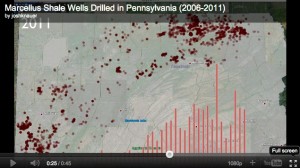
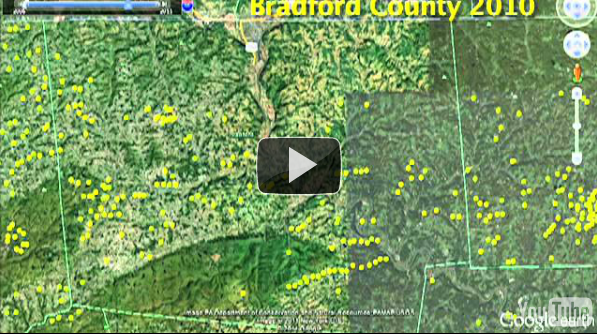
To this end, when I saw a data animation created by John Detwiler that showed the spread of drilled Marcellus shale gas wells in Bradford County, I wanted to create my own data animation telling the same story, but for the entire state of Pennsylvania… Read more»
https://www.fractracker.org/a5ej20sjfwe/wp-content/uploads/2011/12/youtube-snap-300x168.jpg168300FracTracker Alliancehttps://www.fractracker.org/a5ej20sjfwe/wp-content/uploads/2025/09/2025-Wordmark-Logo.pngFracTracker Alliance2011-12-27 10:18:562020-07-21 10:38:52Animating Data: A Different Way to Look at Marcellus Shale Drilling
The last of the three datasets is the most unique, with data spatially joined to municipalities. The following two maps exhibit the Marcellus Shale related data that they contain:
Number of Marcellus Shale wells per PA municipalities as of December 16, 2011. Click the gray compass rose and double carat (^) to hide those menus. Then click the information tool (the blue “i”) then any map feature for more information.
Number of Marcellus Shale wells in PA municipalities per square mile, as of December 16, 2011. Area calculation performed in PA State Plane South.
https://www.fractracker.org/a5ej20sjfwe/wp-content/uploads/2025/09/2025-Wordmark-Logo.png00Matt Kelso, BAhttps://www.fractracker.org/a5ej20sjfwe/wp-content/uploads/2025/09/2025-Wordmark-Logo.pngMatt Kelso, BA2011-12-16 14:23:142020-07-21 10:38:51Updated Drilled Wells Data for PA
One of the regular users, John Detwiler, recently took the mapping application that is part of the platform to an even greater level. He exported wells drilled data by year into Google Earth to create an animation of the shale gas wells drilled from 2007-11 in Bradford County, PA. Check it out:
https://www.fractracker.org/a5ej20sjfwe/wp-content/uploads/2011/12/Screen-Shot-2011-12-14-at-11.29.12-PM.png334597FracTracker Alliancehttps://www.fractracker.org/a5ej20sjfwe/wp-content/uploads/2025/09/2025-Wordmark-Logo.pngFracTracker Alliance2011-12-15 00:31:442020-07-21 10:38:51Bradford County Wells Drilled Animation
Recently, I conducted an analysis of the legacy of each Marcellus Shale operator’s violations over time, normalized by the number of wells each company has drilled, in a metric that I call Violations per Well, or VpW. While that analysis was cumulative, I’ve had FracTracker readers ask if the VpW from one year predicts the VpW for the following year, particularly among the bad actors. To help answer that question, I’ve taken the same raw data from the previous post, and recompiled it to help address that.
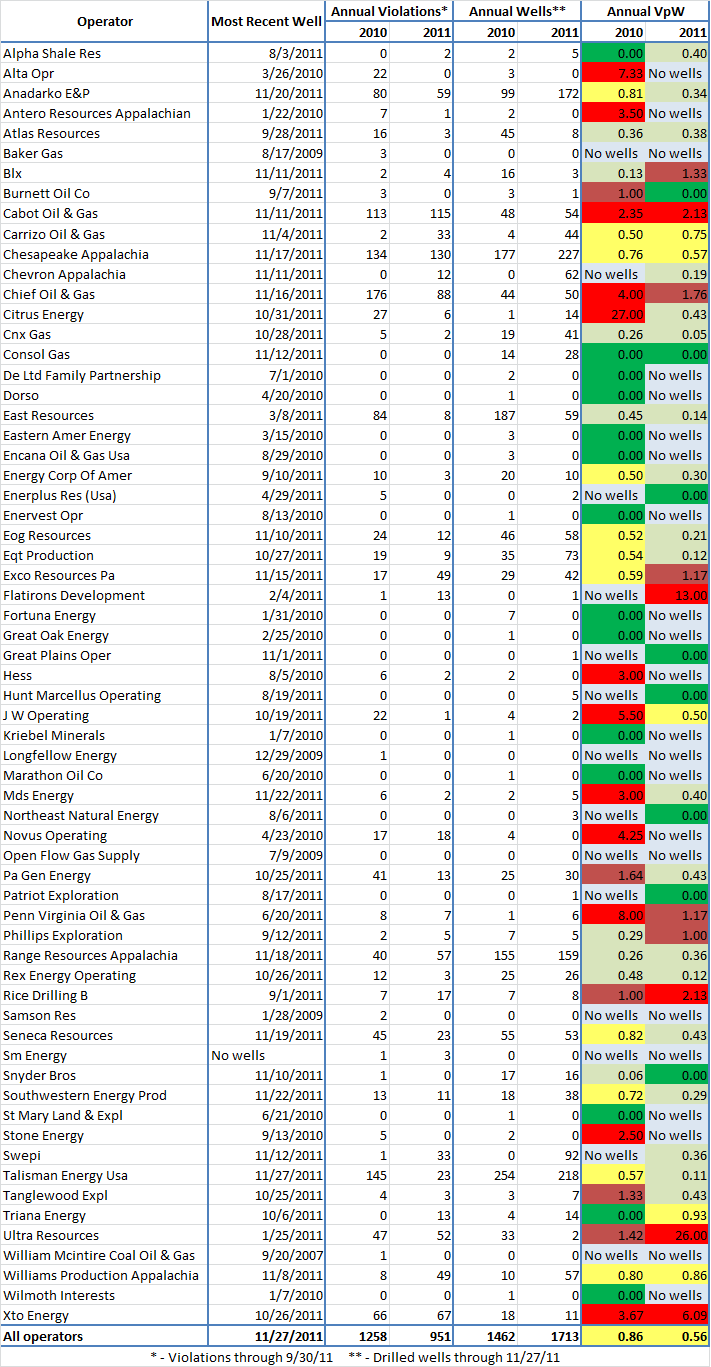
I’ve been looking at violations per well for some time, on the theory that it can be used to help score a company’s compliance history with regards to the Pennsylvania Department of Environmental Protection, which issues them. All of these wells and violations are Marcellus Shale specific, and come from sources posted on the DEP website.
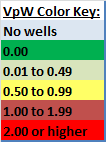
For ease of use, I’ve color coded the results, with bright green being the best scores, and bright red being the worst. Companies without wells for a given year are indicated in pale blue. They may either indicate drilling operators that were inactive in a given year, or midstream companies that haven’t drilled any well. Here’s the color coded key:
And here are the results:
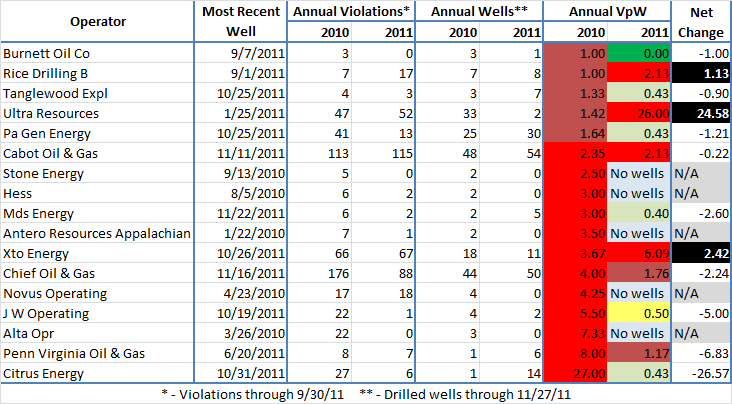
To look at the bad actors from 2010, I selected all of the entries that were colored burgundy or bright red for that year’s VpW score. How have they fared so far in 2011?
To be fair, I should point out that operators with very few wells can get obnoxious VpW scores in a hurry. On the other hand, there were 14 Marcellus Shale operators with at least one well drilled in 2010 that didn’t get any violations that year. Therefore, in this instance, I’ve included all operators with a VpW of 1.00 or greater, and will leave questions about sample size up to the reader.
Five of the operators with VpW scores of 1.00 or higher haven’t drilled any wells at all in 2011 so far. In fact, all of them had VpW scores of at least 2.50. There may be a variety of reason for their absence in 2011, but honestly, their lack of compliance isn’t missed.
Nine operators improved from 2010 to 2011, four of which improved all the way into green categories. This is the result that we want to see, where companies appear to be responsive to violations issued by the DEP. Notable among this group is Citrus Energy, which had a huge amount of violations compared to one drilled well in 2010, to a VpW score under 0.50 so far in 2011. Also, PA Gen Energy is an operator with a significant number of wells that went from a red to a green category, which is encouraging to see. Cabot, on the other hand, barely budged, and remains over 2.00 violations per well.
There are also three operators from 2010 with VpW scores of 1.00 or greater that actually got worse in 2011. And keep in mind, the data used includes almost two more months of drilled wells than violations, so inclusion in this group is especially dubious. They include Rice Drilling B, whose VpW more than duobled to 2.13; XTO, which went from awful to horrific since becoming a subsidiary of ExxonMobil; and Ultra Resources, whose performance has been nothing short of ghastly in 2011. Luckily, Ultra has been leaving the Keystone State alone since January–let’s hope it stays that way.
I maintain that since so many operators–big and small–are able to keep their violations to wells ratio at less than 1:2, all of the operators that operate in Pennsylvania’s Marcellus Shale should try to reach that standard. Those that show a continued disregard for our laws protecting our environment should face stiff fines for their complacency, while those operators that average more than two violations per well drilled over a prolonged period of time need to be banned.
https://www.fractracker.org/a5ej20sjfwe/wp-content/uploads/2025/09/2025-Wordmark-Logo.png00Matt Kelso, BAhttps://www.fractracker.org/a5ej20sjfwe/wp-content/uploads/2025/09/2025-Wordmark-Logo.pngMatt Kelso, BA2011-12-12 15:40:172020-07-21 10:38:40Violations per Well by Operator, Part 2: Bad Actors
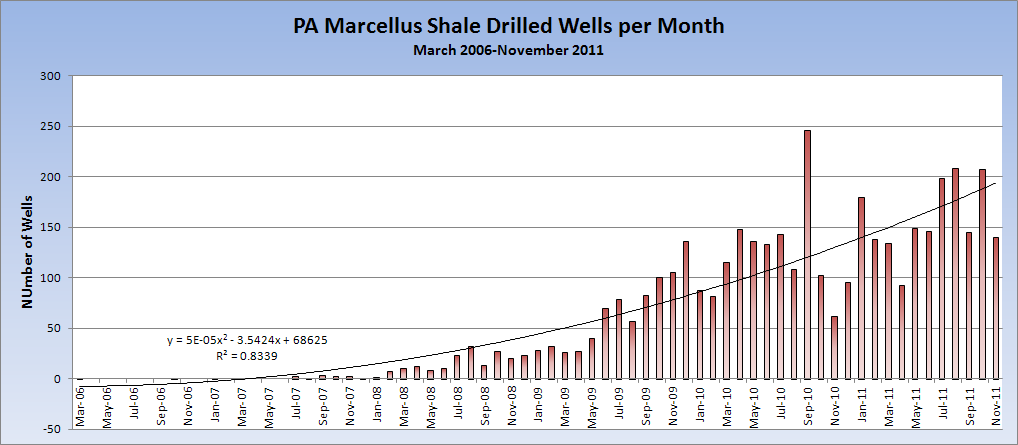
The following chart takes a look at the number of drilled Marcellus Shale wells in Pennsylvania, from 2006 through November, 2011. The accompanying trend line is included, not so much to predict December’s total, but to show the relatively decent R2 value. That is to say, despite the occasional peaks (e.g., September 2010) and troughs (e.g., November 2010), the number of Marcellus Shale wells drilled per month has been increasing in a fairly orderly manner over the past 4 years and 8 months.
Actually, the best Excel trendline was a sixth order polynomial, with an R2 value of .087, but that’s getting fairly silly relative to my purposes here.
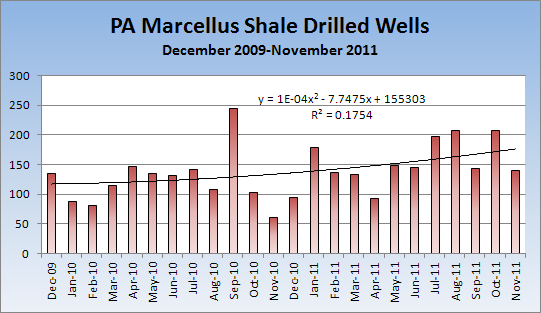
However, when you use the same data but only look at the last 24 months, the results are far more erratic. Once again, the highest R2 value was from a polynomial trendline. But that value wasn’t very high at all:
Once again, I don’t think the equation itself is that important, but the 0.18 R2 value is pretty low. Even the sixth order polynomial, with three peaks and three troughs, has an R2 value of only 0.34.
While the first chart shows an industry that is steadily accelerating, the second one shows…I don’t know. I’m hesitant to offer interpretations. My sense is that even though the R2 value is surprisingly low compared to the first chart, it doesn’t actually mean that much. Visually assessing the chart, it doesn’t seem to be a seasonal fluctuation, but there are mini-clusters of months with higher amounts of drilling activity, and those with lower amounts as well. Certainly, the trendline is higher this month that it was two years ago, but not dramatically so.


