Last year, Shell Chemicals announced its intentions to build a multi-billion dollar ethylene cracker “in Appalachia”, effectively setting the stage for a bidding war between Ohio, West Virginia, and Pennsylvania. There have been numerous other plans for such plants in the area, including a recent partnership trying to get Aither Chemicals catalytic cracking process up in running, once again, “in Appalachia.” The interest in the region is mostly due to the Marcellus and Utica shale gas produced in the region, which contains mostly methane (so-called natural gas used for heating, cooking, etc.), as well as other hydrocarbons that must be removed from the methane before the gas is put into pipelines. These other hydrocarbons are mostly ethane, propane, and butane, which are converted into ethylene, propylene, and butadiene, respectively, through a process called cracking, and are then used for the creation of plastics, synthetic rubber, and other petrochemicals.
Whichever state lands these massive facilities stands to gain several thousand temporary construction jobs and several hundred permanent positions at the facility. It seems reasonable to take a look at other similar facilities in the country, not only to get a reasonable idea of the economic contribution, but also to gain insight on the facility’s contribution to air pollution in the region.
I have chosen to look at the cracker in Norco, Loisiana, also run by Shell Chemicals. Norco is the ultimate company town, named for the now defunct New Orleans Refining Company, it contains not only the Shell plant, but also major petrochemical facilities owned by Dow, Hexion, and Valero. There is also a presence by Motiva, but all indications are that this is functionally part of the Shell plant that is simply owned by a different company.
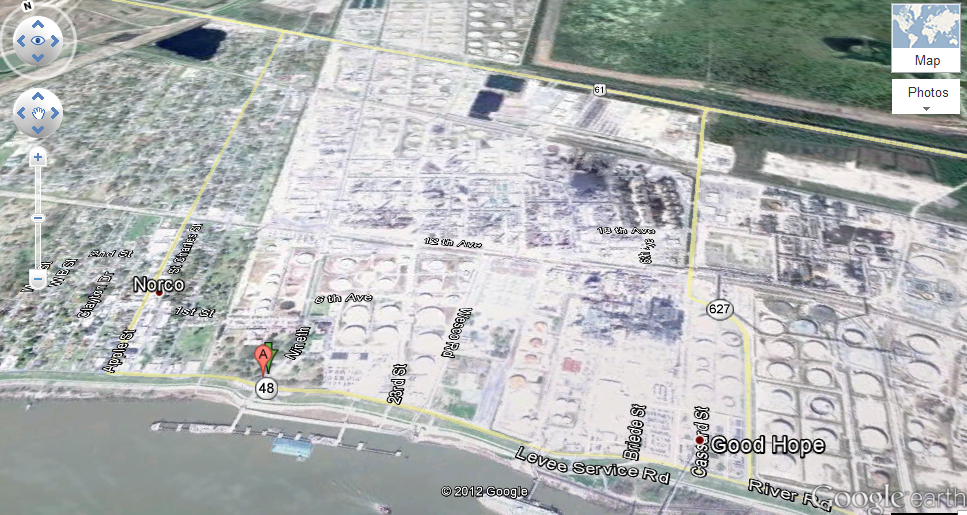
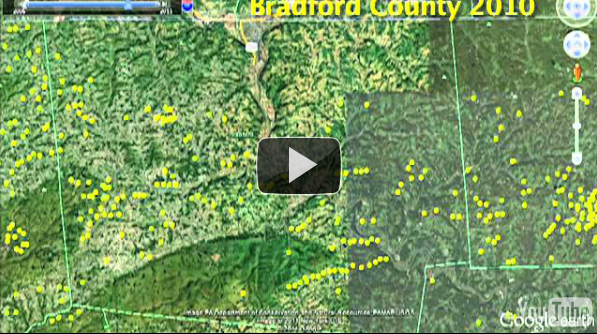
Norco, LA as seen from Google Earth
According to the Shell page linked above, the facility employs 600 full time workers and 160 contractors for an annual payroll of $50 million. It also contributes $22 million in state, local, and property taxes to the community. That’s all very significant, albeit a far cry from the 17,000 jobs, $1 billion in wages, and $169 million in tax revenues that the good people of Ohio are being promised–perhaps those figures are over the estimated life of the facility, who knows? I’m guessing the proposed facility in Appalachia won’t be 22 times larger than the one in Norco, Louisiana though.
In terms of air emissions, it is hard to know what to expect. Emissions may wind up being quite different from Norco’s due to a different chemical composition of the feedstock, for example. However, to get the conversation started, I have compiled the EPA’s 2008 National Emissions Inventory (NEI) estimated emissions for Norco, as well as a well known polluter that’s already in the area, Clairton Coke Works. I should mention that based on my experience, I don’t have a lot of faith of the validity of NEI data, especially for data in Pennsylvania (see this discussion about Clairton, for example), but it is what’s available. Also, I need to mention that the data for Shell is aggregated between the Norco East, Norco West, and Motiva facilities, because from looking at the the websites for Shell and Motiva, the whole operation seems to be focused around cracking. Let’s take a look:
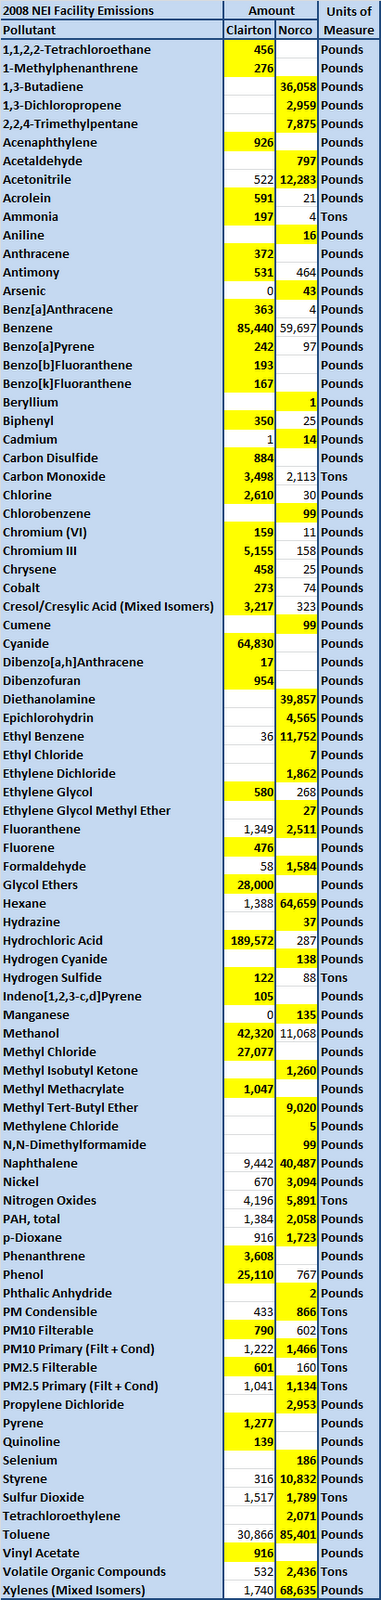
2008 USEPA National Emissions Inventory for the Coke Works in Clairton, PA and the Shell ethylene cracker in Norco, LA
Now before you go to the EPA site to research these 84 pollutants, I didn’t put these up for direct comparison, since the facilities are obviously quite different. The point is that in an area that still largely in nonattainment for fine particulate matter and just recently re-entering attainment for ozone, the prospect of adding another major emitter of particulates and ozone and particulate precursors (as well as a whole host of other junk) isn’t going to help.


