FracTracker Alliance recently created a set of maps showing population variation along the route of the Mariner East 2 Pipeline, which I refer to as the “Dragonpipe.” FracTracker’s maps dramatically reveal a route that runs through many centers of dense population, and seems to avoid relatively nearby areas with far lower population density. The maps are based on US Census 2010 block-level data.
The take-away lesson from these maps is this: Sunoco has put the Dragonpipe in a very bad location.
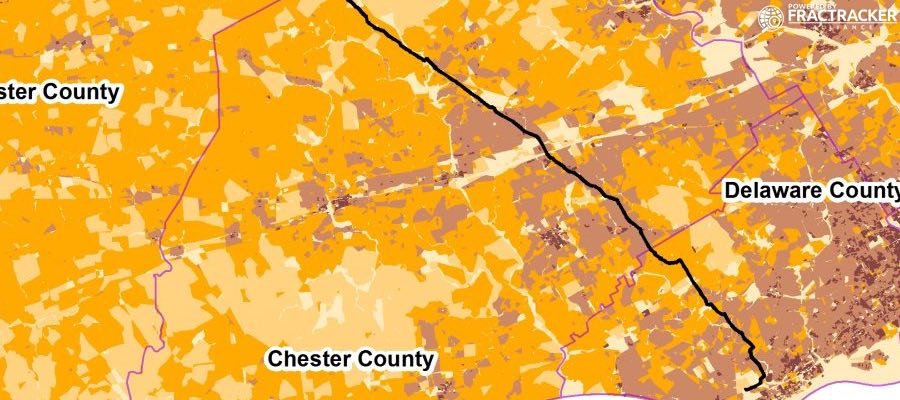
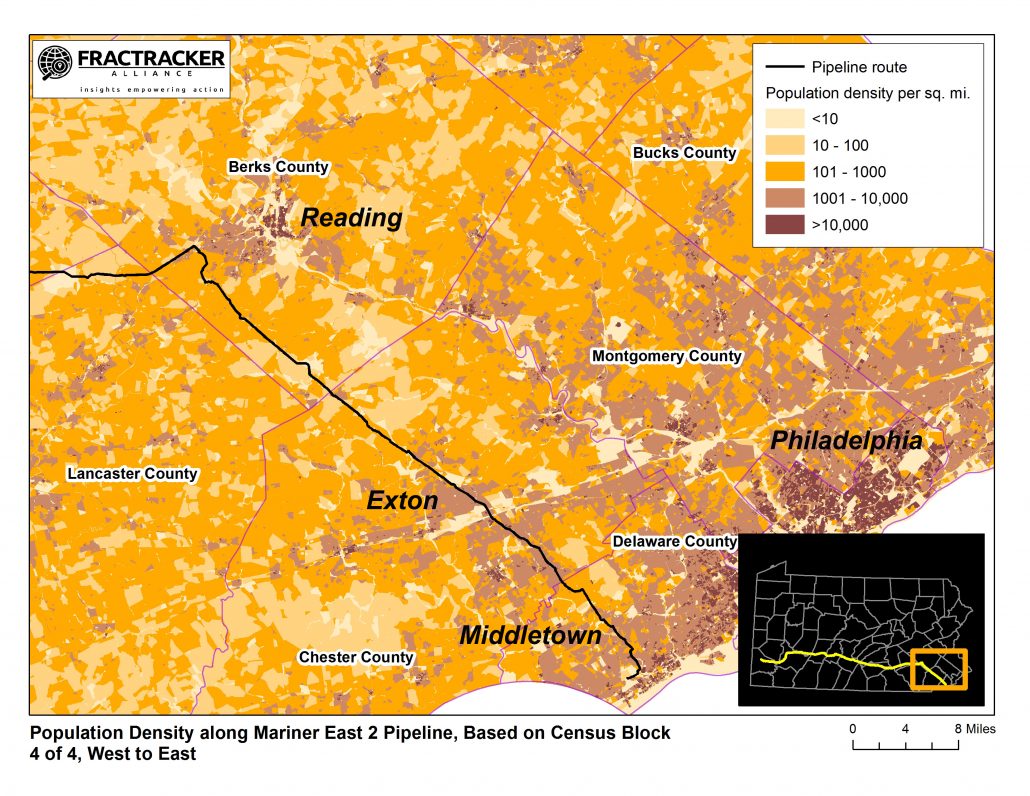
As an example, here is a map of the pipeline route as it passes through Berks, Chester, and Delaware counties in Pennsylvania:
Figure 1. Population density in southeastern Pennsylvania. Map courtesy of FracTracker Alliance. Location annotations added by G. Alexander.
The dark brown areas in the map above denote the most densely populated locations, displayed as the number of people per square mile. The lighter the color, the lower the population density. The black line is the pipeline route.
In the upper left-hand part of the map, note that the route passes through the suburbs of Reading, in Berks County. Further south in the same map, notice how it passes directly through population centers in Chester and Delaware counties.
Let’s examine this pattern more closely.
Why was this route chosen in the first place?
For Sunoco’s convenience
In many areas, from a standpoint of impacts on local communities, the pipeline route is actually the worst possible track that Sunoco could have chosen; it puts more people at risk than any other path, given the same starting- and endpoints. Why in the world did they choose this route?
The answer is this: for Sunoco’s corporate convenience. The Dragonpipe, for most of its length, runs side-by-side Mariner East 1 (ME1), an existing 80+ year-old pipeline designed to carry gasoline and heating oil to customers in the central and western parts of Pennsylvania. From this standpoint, the location of the old pipeline makes sense; it had to be sited near populated areas. That’s where the customers for gasoline and heating oil were located back in the 1930s.
However, the flip-side of Sunoco’s corporate convenience may also mean unnecessary risks to tens of thousands of Pennsylvania residents.
The old pipeline connected the centers of population in the 1930s, areas that are now much more populous when they were nearly ninety years ago. In the southeastern part of Pennsylvania, the character of the area has also changed dramatically. When the original pipeline was built, the landscape along ME1’s route through Delaware and Chester counties was predominantly farmland. Today, that area has changed to densely-settled suburbs, with homes, schools, businesses, hospitals, and shopping centers directly adjacent to the pipeline’s right-of-way.
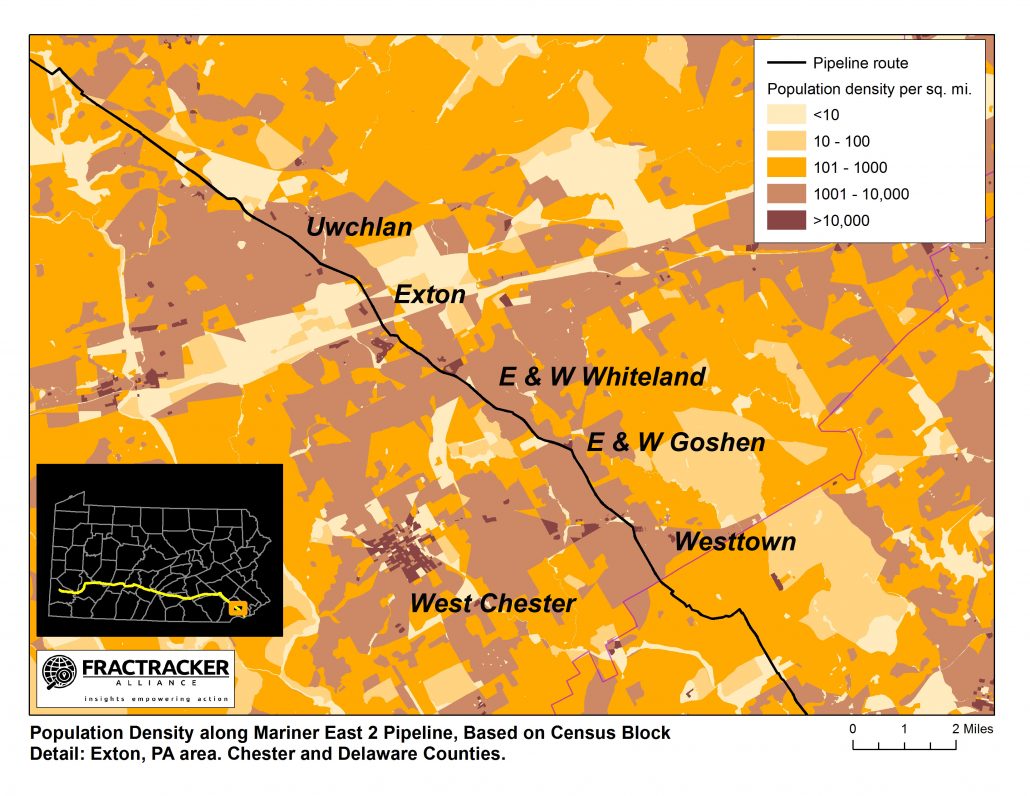
The Exton area provides a prime example of how this transition to suburbia has set the stage for potential disaster along the pipeline route. The following image shows a detailed view of the population density near Exton. As you can see, the pipeline route sticks to high-density areas (shown in dark brown) the entire way, even though lower-density options (shown in orange and yellow) exist nearby.
Figure 2. Population density in Exton area. Map courtesy of FracTracker Alliance. Location annotations added by G. Alexander.
Sunoco — like any corporation — has a moral obligation to conduct its business in a safe manner. This includes choosing a safe route for a pipeline that has inherent dangers and risks. However, Sunoco apparently did not choose to do so. Moreover, by law, Sunoco has an obligation to make human safety paramount. In the settlement Sunoco reached last August with Clean Air Council, Delaware Riverkeeper Network, and Mountain Watershed Association, Sunoco agreed to consider alternative routing for the pipeline in this area. Then, despite their promises, Sunoco simply bypassed that part of the agreement. Rather than explore alternatives to the proposed route, Sunoco dismissed the alternatives as “not practicable” because they did not involve the right-of-way that was already in use for Mariner East 1.
Sunoco seemed to have made their sole priority in considering a pipeline route whether the company has an existing pipeline there already. A better route would reduce by hundreds the number of people who could be killed or injured if there were a leak and explosion.
Pipelines leak
Pipelines can and do leak. Mariner East 1, in its short career as a pipeline carrying NGLs, has already leaked several times. It is just good luck that the leaks were stopped before any product ignited. (See most recent report of ME1 and ME2 issues.) The Atex pipeline, a pipeline of similar size and content that runs down to the Gulf Coast, ruptured and exploded near Follansbee, WV, in just its second year of operation. And there’s no reason to believe such an incident would never happen with the Dragonpipe.
Sunoco has an obligation to do what it can to minimize the injuries, death, and destruction caused by an event like the Follansbee explosion. The Follansbee incident occurred in a forested area. The explosion destroyed several acres of trees, but no-one was killed. The result would have been far different if had the explosion been in a densely populated area.
Just as the maps above show how the Philadelphia suburbs and those of Reading are threatened, other FracTracker maps show the threats to suburbs of Pittsburgh and Harrisburg, below. Click to expand.
A call for change
Indeed, across the state, the Dragonpipe route gets dangerously and notably close to population centers. Such a path may be a convenient and financially beneficial option for Sunoco, but it is an unacceptable risk for Pennsylvania’s citizens to bear.
About the Author: George Alexander publishes the Dragonpipe Diary (www.dragonpipediary.com), covering all aspects the Mariner East pipeline project, including technology, risks, legal issues, economics, and the people and groups involved. He recently retired from a career in journalism and marketing.
An earlier version of this essay was published in Mr. Alexander’s blog, Dragonpipe Diary, on June 29, 2018.
https://www.fractracker.org/a5ej20sjfwe/wp-content/uploads/2018/07/ME2-Dragonpipe-Map-Feature.jpg400900Guest Authorhttps://www.fractracker.org/a5ej20sjfwe/wp-content/uploads/2025/09/2025-Wordmark-Logo.pngGuest Author2018-07-20 13:32:312021-04-15 15:01:14Population density maps: Lessons on where NOT to put a pipeline
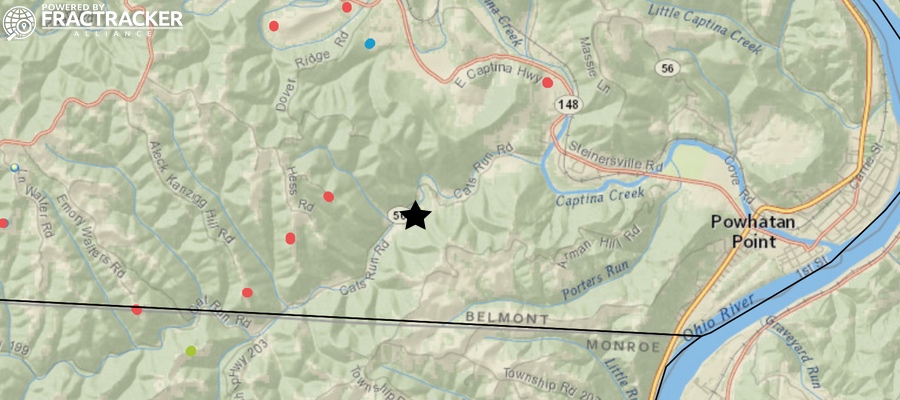
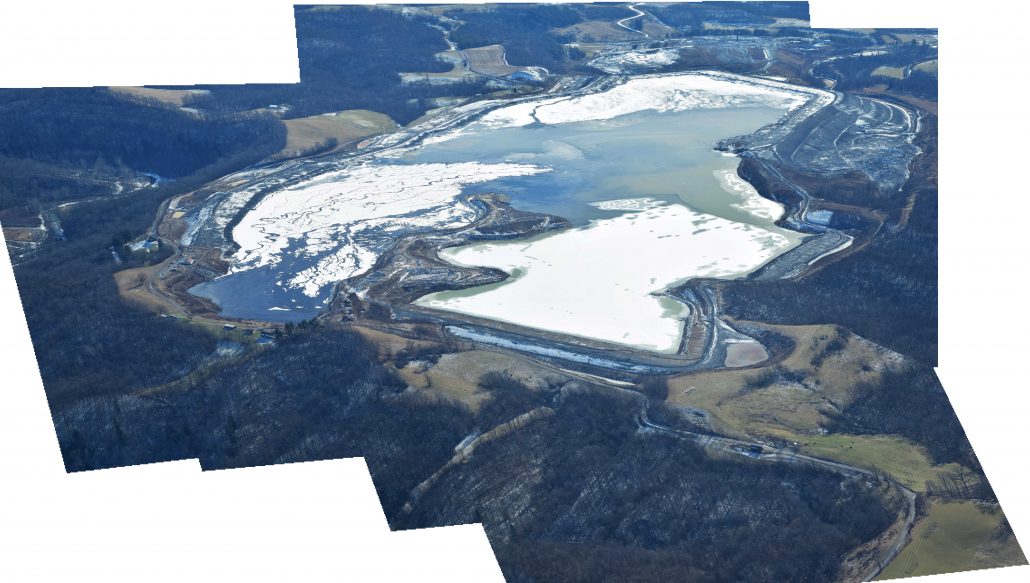
On February 15, 2018, officials evacuated residents after XTO Energy’s Schnegg gas well near Captina Creek exploded in the Powhatan Point area of Belmont County, Ohio. More than two weeks later, the well’s subsequent blowout has yet to be capped, and people want to know why. Here is what we know based on various reports, our Ohio oil and gas map, and our own fly-by on March 5th.
March 19th Update: This is footage of the Powhatan Point XTO Well Pad Explosion Footage from Ohio State Highway Patrol’s helicopter camera the day after the incident:
Powhatan Point XTO well pad explosion footage from Ohio State Highway Patrol
Cause of the Explosion
The well pad hosts three wells, one large Utica formation well, and two smaller ones. XTO’s representative stated that the large Utica well was being brought into production when the explosion occurred. The shut-off valves for the other two wells were immediately triggered, but the explosion caused a crane to fall on one of those wells. The representative claims that no gas escaped that well or the unaffected well.
Observers reported hearing a natural gas hiss and rumbling, as well as seeing smoke. The Powhatan Point Fire Chief reported that originally there was no fire, but that one later developed on the well pad. To make matters worse, reports later indicated that responders are/were dealing with emergency flooding on site, as well.
As of today, the Utica well that initially exploded is still releasing raw gas.
Map of drilling operations in southeast Ohio, with the Feb 15, 2018 explosion on XTO Energy’s Schnegg gas well pad marked with a star. View dynamic map
Public Health and Safety
No injuries were reported after the incident. First responders from all over the country are said to have been called in, though the mitigation team is not allowed to work at night for safety reasons.
The evacuation zone is for any non-responders within a 1-mile radius of the site, which is located on Cat’s Run Road near State Route 148. Thirty (30) homes were originally evacuated within the 1-mile zone according to news reports, but recently residents within the outer half-mile of the zone were cleared to return – though some have elected to stay away until the issue is resolved completely. As of March 1, four homes within ½ mile of the well pad remain off limits.
The EPA conducted a number of site assessments right after the incident, including air and water monitoring. See here and here for their initial reports from February 17th and 20th, respectively. (Many thanks to the Ohio Environmental Council for sharing those documents.)
Much of the site’s damaged equipment has been removed. Access roads to the pad have been reinforced. A bridge was recently delivered to be installed over Cats Run Creek, so as to create an additional entrance and exit from the site, speaking to the challenges faced in drilling in rural areas. A portion of the crane that fell on the adjacent wellhead has been removed, and workers are continuing their efforts in removing the rest of the crane.
The above video by Earthworks is optical gas imaging that makes visible what is normally invisible pollution from XTO’s Powhatan Point well disaster. The video was taken on March 3, 2018, almost 3 weeks after the accident that started the uncontrolled release. Learn more about Earthworks’ video and what FLIR videos show.
An early estimate for the rate of raw gas being released from this well is 100 million cubic feet/day – more than the daily rate of the infamous Aliso Canyon natural gas leak in 2015/16. Unfortunately, little public information has been provided about why the well has yet to be capped or how much gas has been released to date.
Bird’s Eye View
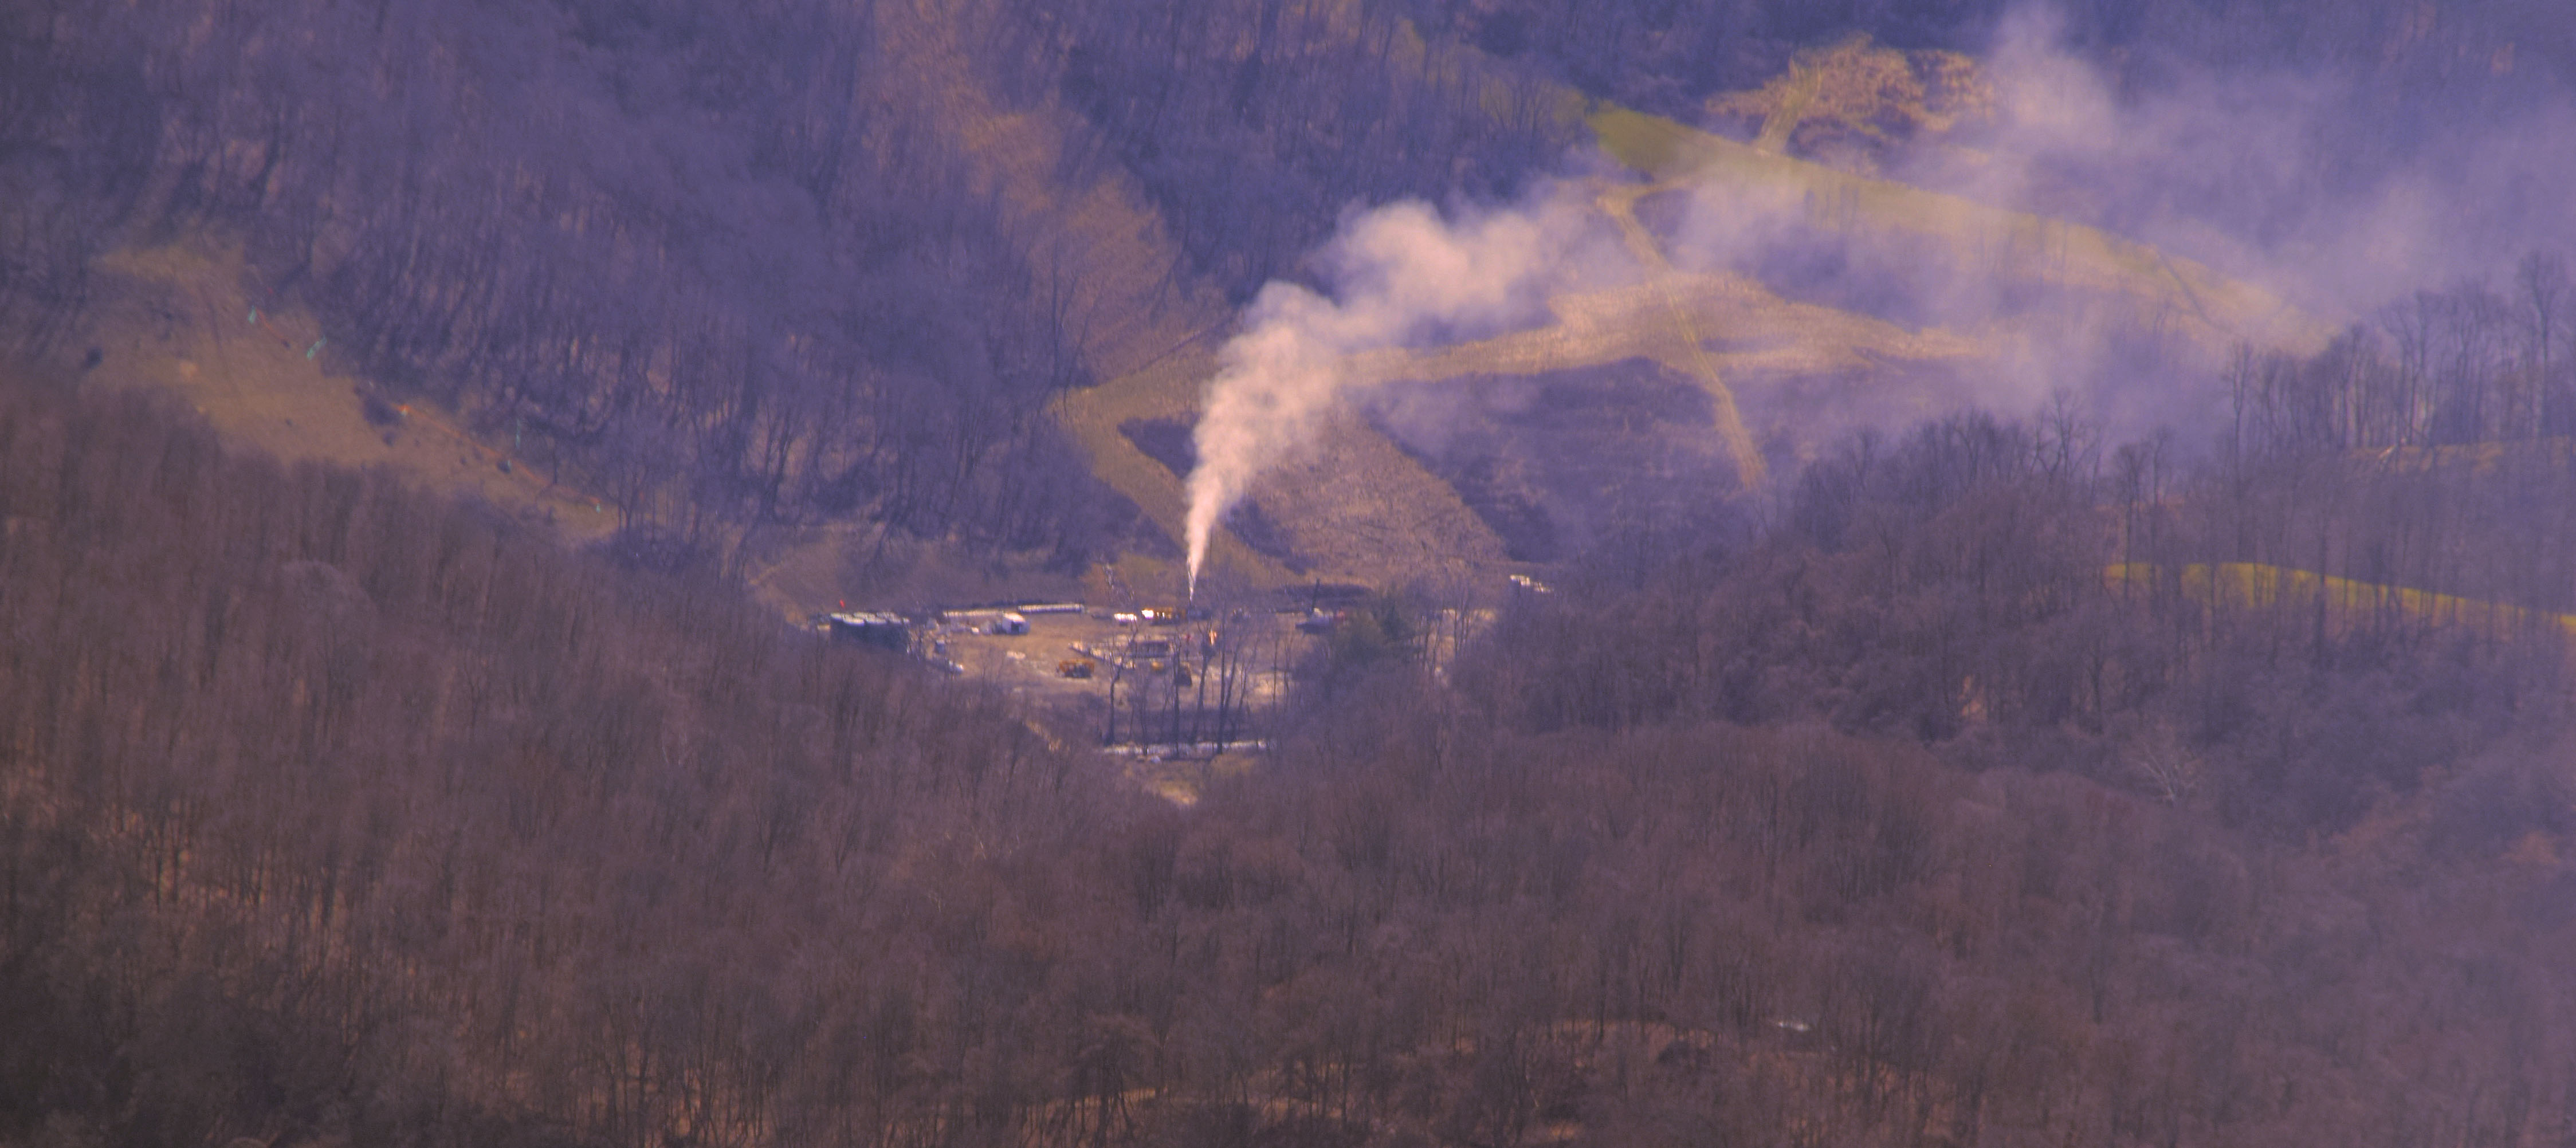
On February 26, a two-mile Temporary Flight Restriction (TFR) was enacted around the incident’s location. The TFR was supposed to lapse during the afternoon of March 5, however, due to complications at the site the TFR was extended to the evening of March 8. On March 5, we did a flyover outside of the temporary flight restriction zone, where we managed to capture a photo of the ongoing release through a valley cut. Many thanks to LightHawk and pilot Dave Warner for the lift.
XTO Energy well site and ongoing emissions after the explosion over two weeks ago. Many are still waiting on answers as to why the well has yet to be capped. Photo by Ted Auch, FracTracker Alliance, March 5, 2018. Aerial support provided by LightHawk
Additional resources
Per the Wheeling Intelligencer – Any local residents who may have been impacted by this incident are encouraged to call XTO’s claims phone number at 855-351-6573 or visit XTO’s community response command center at the Powhatan Point Volunteer Fire Department, located at 104 Mellott St. or call the fire department at 740-312-5058.
https://www.fractracker.org/a5ej20sjfwe/wp-content/uploads/2018/03/XTO-Incident-Feature.jpg400900FracTracker Alliancehttps://www.fractracker.org/a5ej20sjfwe/wp-content/uploads/2025/09/2025-Wordmark-Logo.pngFracTracker Alliance2018-03-06 15:53:362021-04-15 15:01:25Waiting on Answers Weeks after a Well Explosion in Belmont County Ohio
The head of Murray Energy Corporation, Robert Murray, is very close to the highest office in the land. Such an association demands a close look at the landscape from which this corporation and its founder arouse.
Belmont County, Ohio’s most famous tycoon Robert Murray has established a close relationship with the Trump administration. This connection dates back to his $300,000 contribution to Trump’s inauguration. The intimacy of this relationship has been given new weight recently when it was revealed that a hug between Mr. Murray and the Department of Energy’s Secretary Rick Perry preceded a meeting where Mr. Murray presented the administration with a memo outlining a 16-point plan for removing some of the burdensome regulations put in place by Mr. Murray’s least favorite person former President Barack Obama.
Among the few consistent themes from this most inconsistent of presidents has been a fondness for coal and steel, where brawny men do essential work and are threatened not by shifting economics, but by greenies and weenies who want to shut them down. Mr Trump and Mr Murray both want environmental rules rolled back—Mr Murray because it would be good for his bottom line, and Mr Trump because a second consistent aim of his presidency is to reverse anything done by Barack Obama. It is doubtful whether policy shifts alone could revive coal mining, but the attempt to do so says much about how vested interests operate in this administration… Mr Trump played a hard-nosed businessman on TV, but Mr Murray is the real thing. – The Economist, 2018
Not only has Mr. Murray succeeded in capturing the hearts and minds of the Trump administration, he has demanded that his $300,000 contribution get his longtime Oklahoman lawyer, and former aide to the senate’s chief climate skeptic James M. Inhofe of Oklahoma, the #2 spot behind Scott Pruitt at the EPA. Mr. Murray is so powerful that he managed to get Perry & Co. to fire the photographer that took the photo of the tender moment between Messrs. Perry and Murray.
Awkwardness aside, these situations could reasonably lead one to conclude that Perry and Pruitt are competing for Murray’s favor in the event they choose to run for higher office and need a patron with deep pockets. Mr. Murray would be in a real pickle if they both chose to run for the highest office in the land, with two fawning candidates potentially offering to one-up the other in terms of incentives and/or regulatory carve outs for Mr. Murray’s beloved King Coal.
Once the heart of Ohio Coal Country, Belmont Co. is now a major player on the hydraulic fracturing landscape, as well.
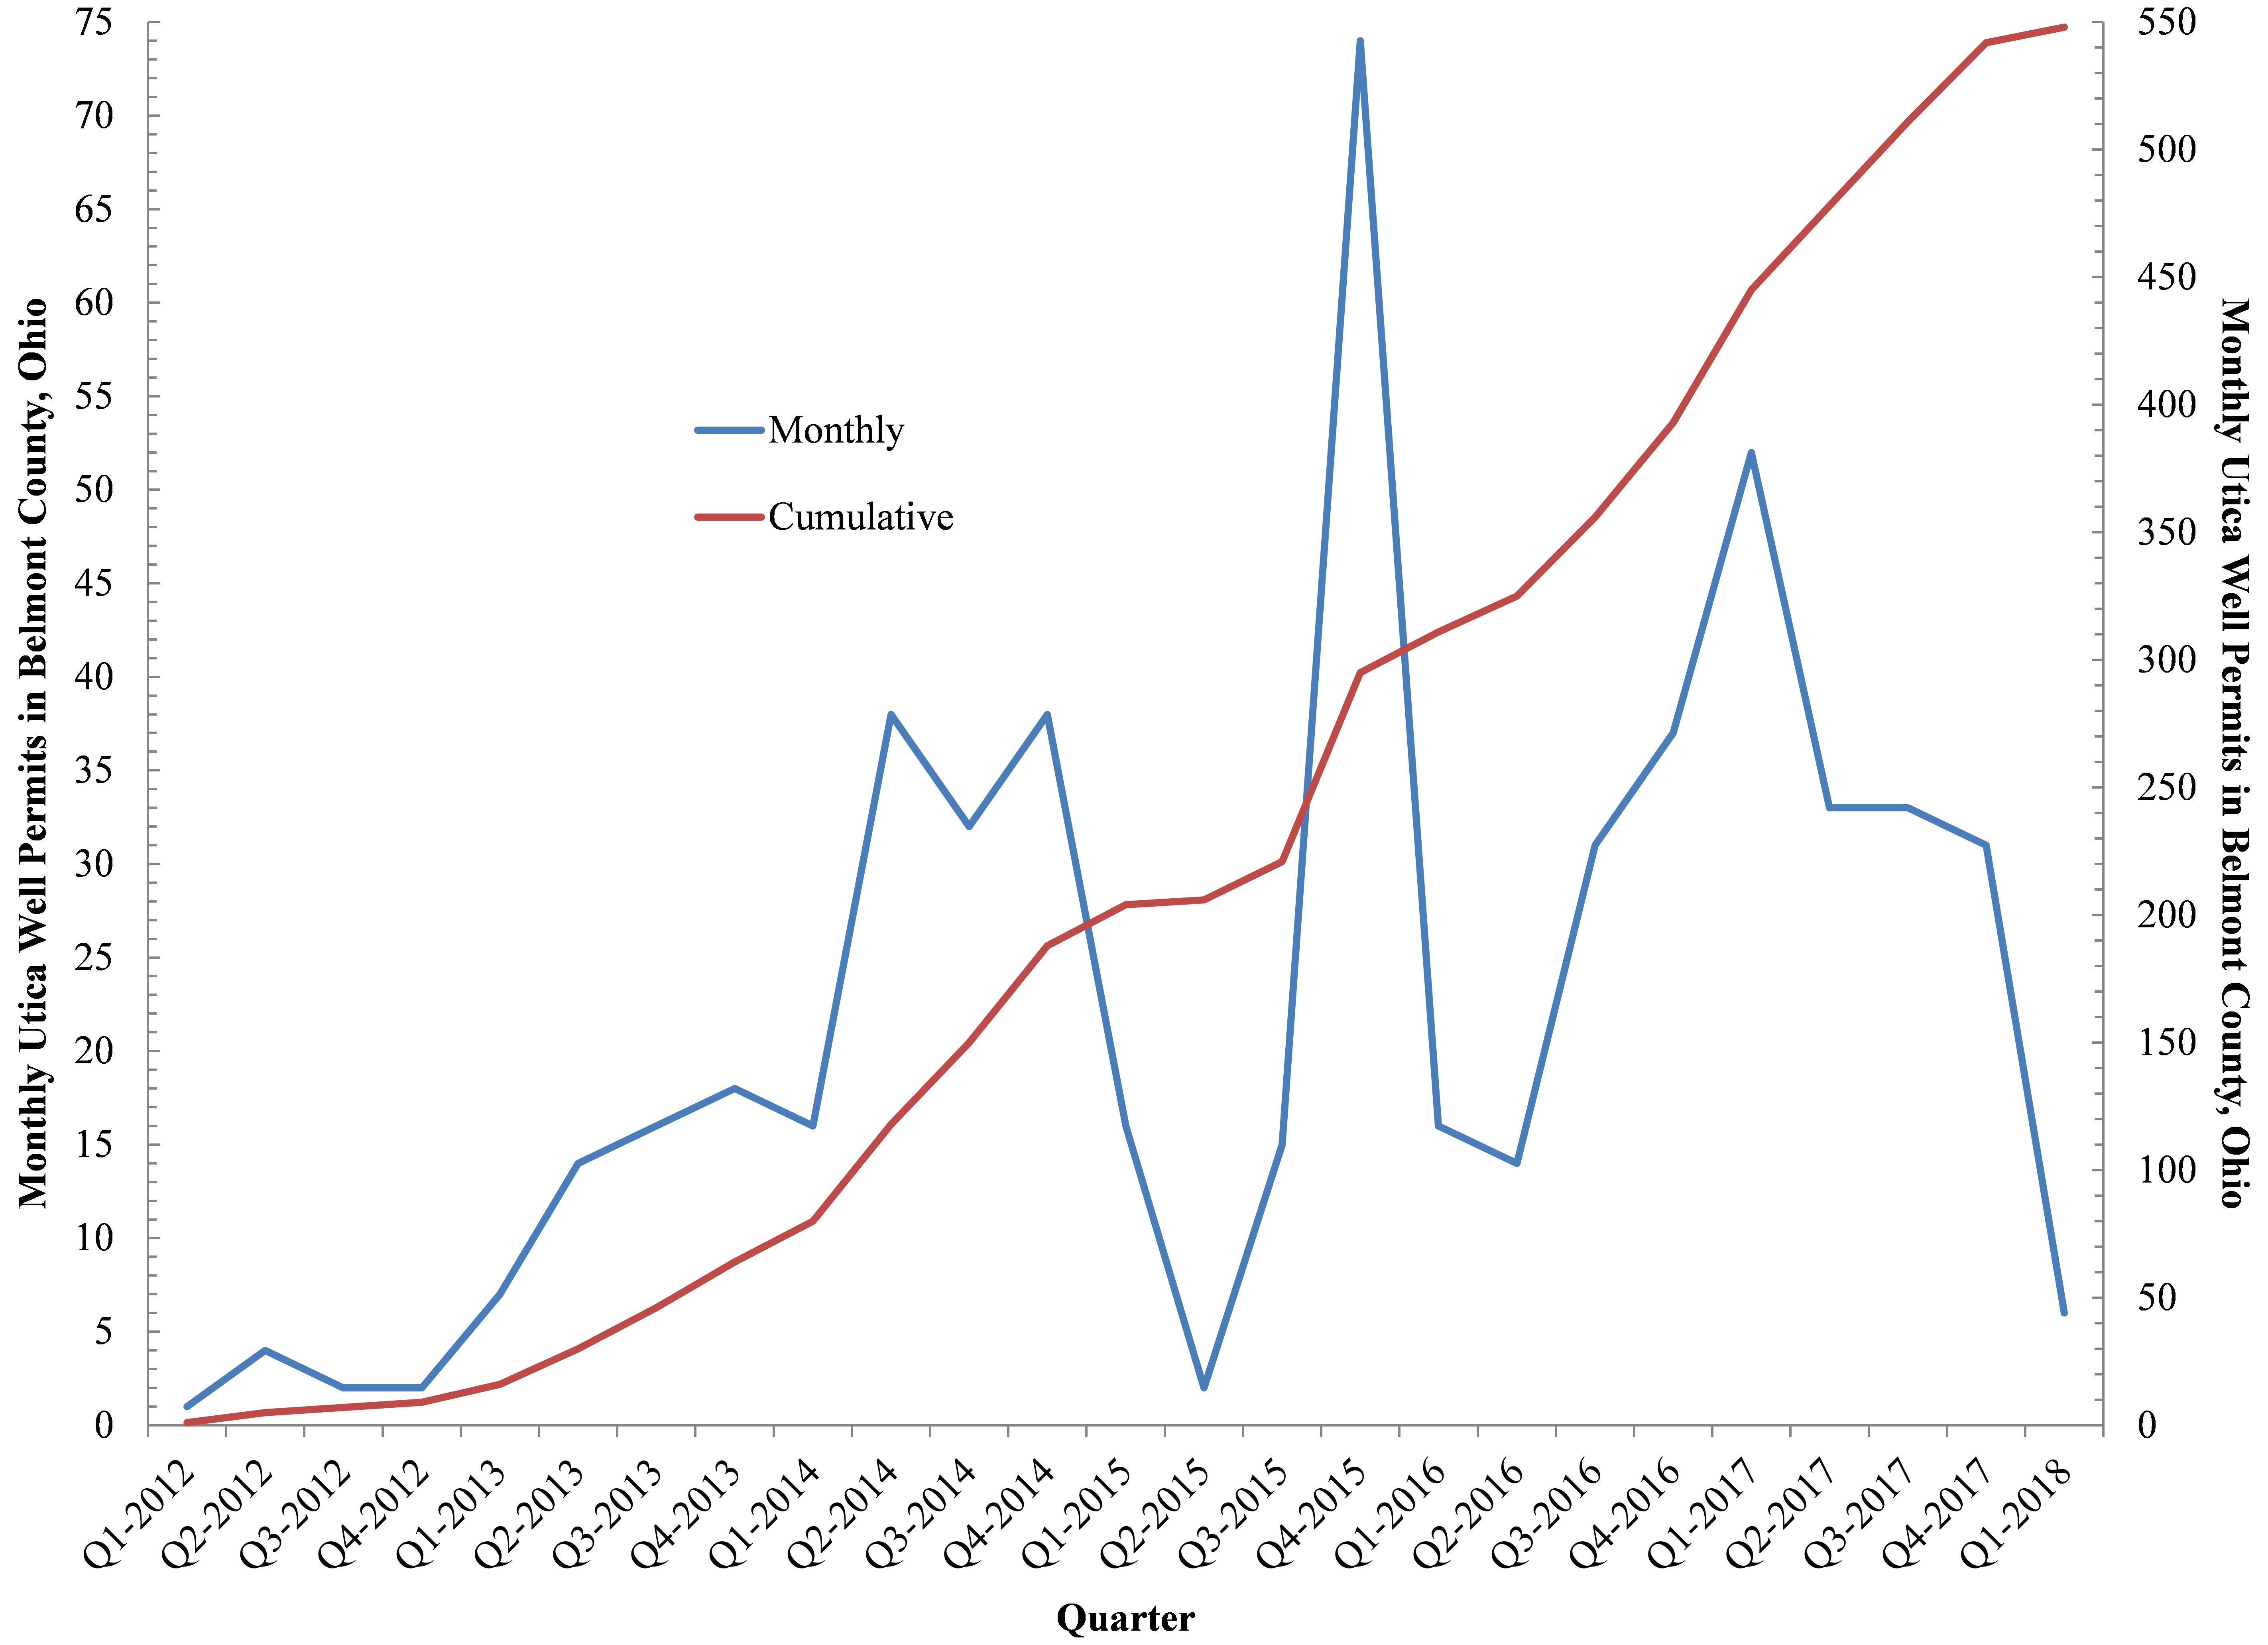
Given the growing influence of Mr. Murray and the coal industry writ large we thought it was time to do a deep dive into how Mr. Murray’s Appalachian Ohio home county of Belmont and surrounding counties have been altered by coal mining. We were also interested in how the coal industry has come to interact with the hydraulic fracturing industry, which has drilled 542 Utica wells in Belmont County alone since March 2012. These wells amount to 20% of all fracked wells in Ohio as of January 2018. The rate at which Utica wells are being permitted in Belmont County is actually increasing by about 1.5 to 2 permits per month or 5.5 to 7.8 times the statewide average (Figure 1).
Belmont County also happens to be the “all-time leader in coal production in Ohio” having produced 825 million tons since 1816 (ODNR, 2005). All of this means that the Ohio county that produces the most coal is also now The Buckeye State’s most actively drilled county.
Figure 1. Monthly and cumulative hydraulically fractured wells in Belmont County, Ohio between Q1-2012 and Q1-2018
However, the days of coal’s dominance – and easily mineable coal – in Ohio appear to be coming to an end.
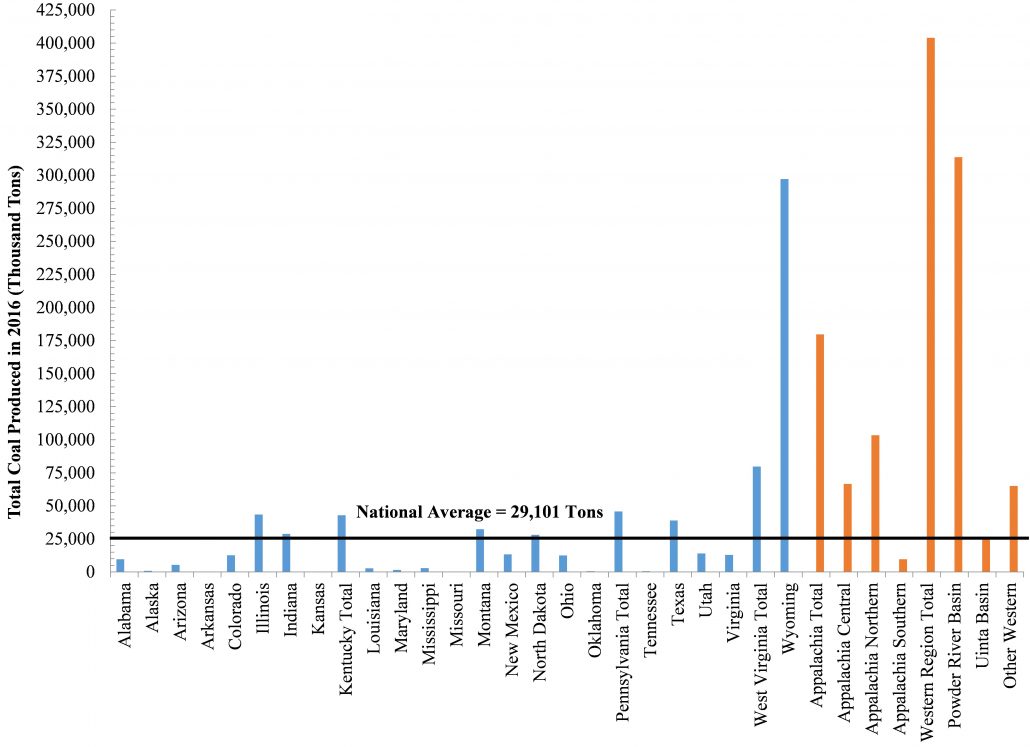
Per mine, Ohio’s mines produce about 30% of the national average and 43% of the state averages (Figure 2). Ohio’s mines only produce about 10% of what the mega Western mines produce on a per-mine basis, and much less than states like New Mexico and Texas, as well.
Even with automation, the barriers to a return of coal in Appalachia are formidable given that most of the easily recoverable coal has already been mined. Additionally, the landscape is more formidable and not as conducive to the large strip-mine and dragline operations of the Powder River Basin, which produce roughly 8.5 million tons of coal per mine, compared to an average of 330,000 tons per mine in Appalachia. (Figure 2).
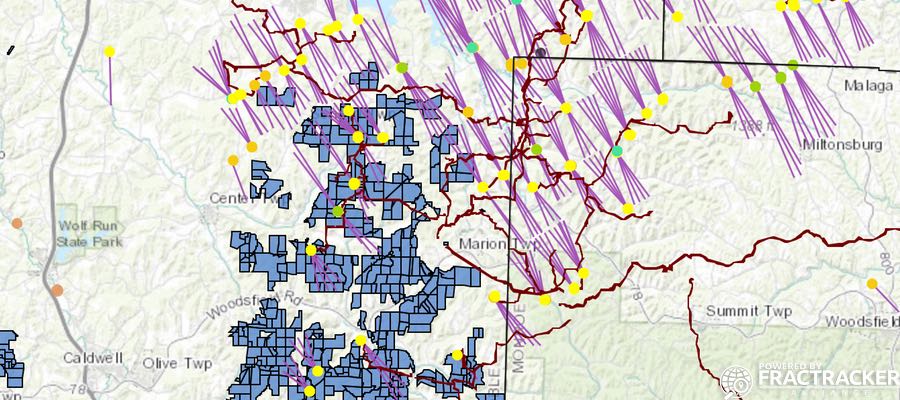
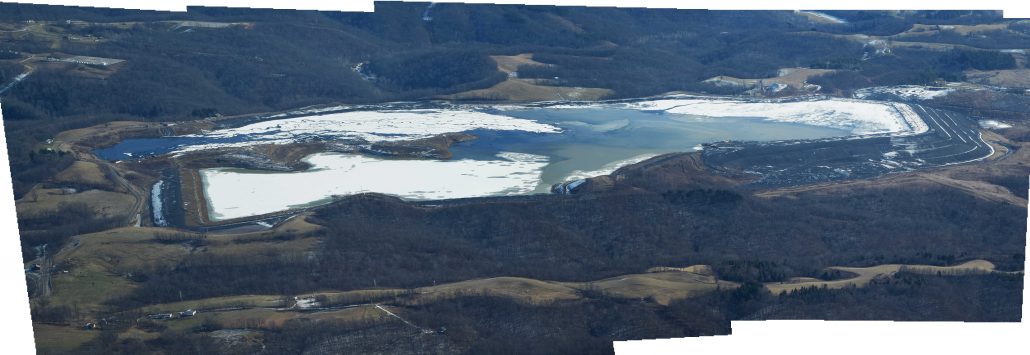
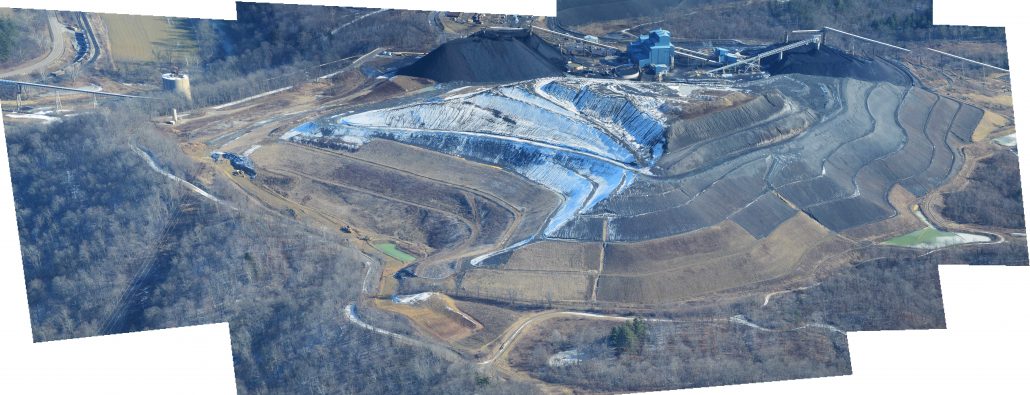
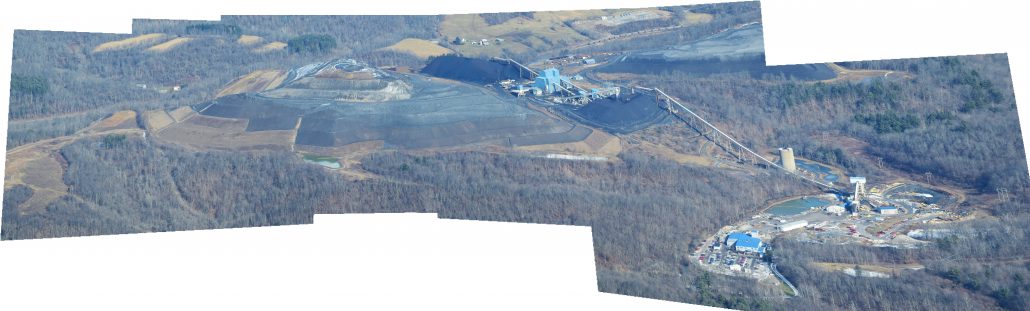
The below map depicts parcels owned by coal mining companies in the Ohio counties of Belmont, Noble, Guernsey, and Muskingum, as well as previously mined and/or potential parcels based on owner and proximity to existing mines.
We also incorporated production data (2001 to 2016) for 116 surface and strip coal mines in these and surrounding counties, natural gas pipelines, hydraulically fractured laterals, and Class II Salt Water Disposal (SWD) injection wells as of January 2018.
There are few areas in the United States where underground coal mining and fracking are taking place simultaneously and on top of each other. What could possibly go wrong when injecting massive amounts of fracking waste at high pressures into the geology below, while simultaneously pumping billions of gallons of water into hydraulically fractured laterals and mining coal at similar depths?
In the coming months and years we will be monitoring Belmont County, Ohio as an unfortunate case-study in determining the answer to such a unique question.
At the present time:
Murray Energy, its subsidiaries, and other coal companies own approximately 15% of Belmont County.
Coal companies and their associated real-estate firms and subsidiaries have mined or own approximately 5,615 square miles across the Noble, Belmont, Guernsey, and Muskingum counties.
The 116 mines in this map have mined an average of 3.22 million tons of coal since 2001 and more than 373 million tons in total. Mr. Murray’s mines account for 50% of this amount, producing nearly 15 times more coal per mine than the other 112 mines.
Collectively, these mines have contributed 1.09 billion tons of CO2 and CH4+N2O in CO2 equivalents to atmospheric climate change, or 68 million tons per year (MTPY). This volume is equivalent to the annual emissions of nearly 60 million Americans or 19% of the population.
Murray’s mines alone have contributed enough greenhouse gases (CO2+CH4+N2O) to account for the emissions of 9.2% of the US population since 2001. Each Murray mine is belching out 8.41 million tons of greenhouse gases per year or roughly equivalent to the emissions of 463,489 Americans.
Relevant data for this map can be found at the end of this article.
Broader Implications
Robert Murray’s influence and mining impacts extend well beyond Appalachian Ohio.
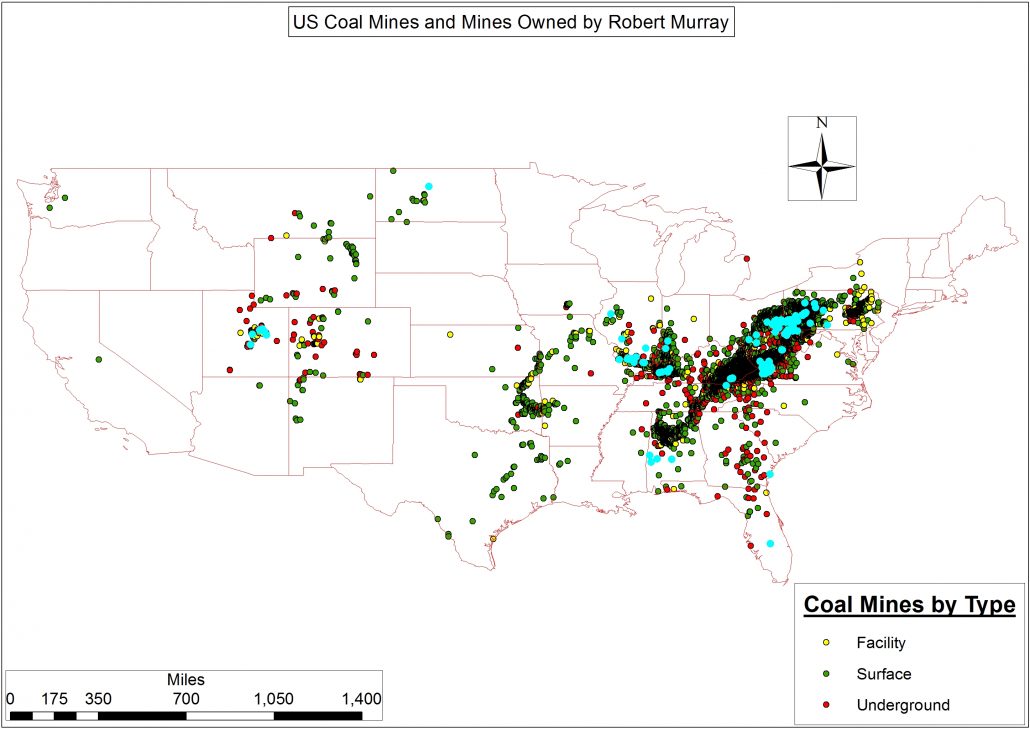
Mr. Murray’s is the primary owner of 157 mines and associated facilities1 across eleven states – and five of the six major Lower 48 coal provinces – from Utah and North Dakota to Alabama, Georgia, and Florida (Figure 3). Mr. Murray likes to highlight his sage purchases of prime medium and high volatility bituminous coal real-estate over the years on his company’s website. However, nowhere in his corporate overview does he mention his most notorious mine: the abandoned and sealed underground Crandal Canyon Mine, Emery County, Utah. It was at this mine on August 6, 2007 that a collapse trapped six miners and resulted in their deaths, along with the deaths of three rescue workers. Mr. Murray told the BBC that he had had an emotional breakdown and hadn’t deserted anyone living in a little trailer adjacent to the mine’s entrance every day following the collapse. Furthermore, Mr. Murray blames such events on subsidiaries like Grenwal Resources Inc., which happens to be the owner of record for the Crandal Canyon Mine and is one of thirty-three unique subsidiaries owned by Mr. Murray (data download).
Figure 3. US Coal Mines by type and Mines Owned by Robert Murray highlighted in turquoise
Table 1. Robert Murray coal mine ownership by mine status
Status
Number of Mines
Abandoned
68
Abandoned and Sealed
62
Active
12
Non-Producing
10
Temporarily Idled
5
Total
157
The Politics of Energy
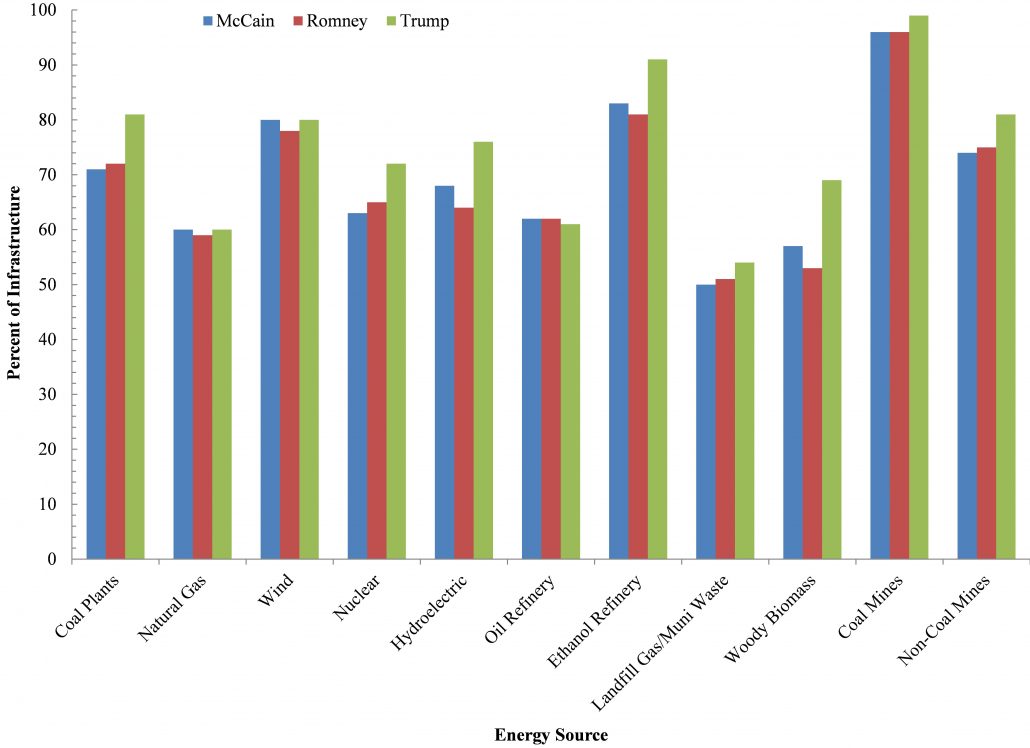
Robert Murray and his fellow fossil fuel energy brethren’s bet on Trump paid off, with Trump winning 99% of the vote in congressional districts where coal mines exist (Figure 4). Such a performance bested the previous GOP candidates of McCain and Romney even though they had achieved an impressive 96% of the vote. Interestingly, Trump did nearly as well in congressional districts dominated by wind farms and ethanol refineries where more than 87% of the electorate was white.
Figure 4. Presidential election results for GOP candidates in voting districts where various forms of energy are produced and/or processed, 2016, 2012, and 2008
Trump & Co. promised these districts that his administration would breathe life into the fossil fuel industry. True, Trump, Pruitt, Perry, and Interior Secretary Ryan Zinke are greasing the skids for the industry’s revival. In terms of annual production, however, it is far from certain that such moves will translate into the types of boost in employment promised by Trump during the 2016 campaign. Even if production does return, executives like Murray admit that the advent of efficiencies and extraction technologies means that the industry is mining more coal per miner than ever before:
“Trump has consistently pledged to restore mining jobs, but many of those jobs were lost to technology rather than regulation and to competition from natural gas and renewables, which makes it unlikely that he can do much to significantly grow the number of jobs in the industry,” said Murray. “I suggested that he temper his expectations. Those are my exact words,” said Murray. “He can’t bring them back.” – The Guardian, March 27, 2017
Conclusions and Next Steps
It remains to be seen how the coal mining and fracking industry’s battle for supremacy will play out from a socioeconomic, health, environmental, and regulatory perspective. While many people understand that coal jobs aren’t coming back, we shouldn’t doubt the will of the Trump administration and friends like Robert Murray to make sure that profits can still be extracted from Appalachia.
Will the fracking industry and coal barons agree to get along, or will they wage a war on multiple fronts to marginalize the other side? Will this be another natural resource conflagration? If so, how will the people – and species like the “near-threatened” Hellbender Salamander (Cryptobranchus alleganiensis) or the region’s recovering Bald Eagle (Haliaeetus leucocephalus) population that live in the disputed Appalachian communities respond? How will their already stressed day-to-day existence be affected? To this point, the fossil fuel industry has managed to blame everyone but itself for the tepid to non-existent job growth in their sectors.
The Appalachian landscape has been deeply scarred and fragmented by coal mining, and now it is experiencing a new colonizing force in the form of the hydraulic fracturing industry. When Appalachia realizes that automation, globalization, and natural gas, are the key drivers to the downfall of coal, will they bring fire, brimstone, and pitchforks to the doorstep of Murray Energy of the fracking companies? Or is Appalachia’s future merely that of an extraction colony?
The City of Arvin, with a population of about 20,000, is located in Kern County, California just 15 miles southeast of Bakersfield. Nicknamed ‘The Garden in the Sun,’ Arvin is moving forward with establishing new regulations that would limit oil and gas development within the city limits.
Setback Map
The new ordinance proposes setback distances for sensitive sites including hospitals and schools, as well as residentially and commercially zoned parcels. The proposal establishes a 300-foot buffer for new development and 600’ for new operations.
In the map below, FracTracker Alliance has mapped out the zoning districts in Arvin and mapped the reach of the buffers around those districts. The areas where oil and gas well permits will be blocked by the ordinance are shown in green, labeled “Buffered Protected Zones.” The “Unprotected Zones” will still allow oil and gas permits for new development.
There are currently 13 producing oil and gas wells within the city limits of Arvin, 11 of them are located in the protected zones. Those within the protected zones are operated by Sun Mountain Oil and Gas and Petro Capital Resources. They were all drilled prior to 1980, and are shown in the map below.
Information on the public hearings and proposals can be found in the Arvin city website, where the city posts public notices. As of January 24, 2018, these are the current documents related to the proposed ordinance that you will find on the webpage:
In December of 2016, Committee for a Better Arvin, Committee for a Better Shafter, and Greenfield Walking Group, represented by Center for Race, Poverty and the Environment, sued Kern County. The lawsuit was filed in coordination with EarthJustice, Sierra Club, Natural Resources Defense Council, and the Center for Biological Diversity.
The Importance of Local Rule
Self-determination by local rule is fundamental of United States democracy, but is often derailed by corporate industry interests by the way of state pre-emption. There is a general understanding that local governments are able to institute policies that protect the interests of their constituents, as long as they do not conflict with the laws of the state or federal government. Typically, local municipalities are able to pass laws that are more constrictive than regional, state, and the federal government.
Unfortunately, when it comes to environmental health regulations, states commonly institute policies that preserve the rights of extractive industries to access mineral resources. In such cases, the state law “pre-empts” the ability of local municipalities to regulate. Local laws can be considered the mandate of the people, rather than the influence of outside interest on representatives. Therefore, when it comes to land use and issues of environmental health, local self-determination must be preserved so that communities are empowered in their decision making to best protect the health of their citizens.
https://www.fractracker.org/a5ej20sjfwe/wp-content/uploads/2018/01/Arvin_bakersfield_re.jpg400900Kyle Ferrar, MPHhttps://www.fractracker.org/a5ej20sjfwe/wp-content/uploads/2025/09/2025-Wordmark-Logo.pngKyle Ferrar, MPH2018-01-30 11:59:072021-04-15 15:01:28Arvin, CA – a City in the Most Drilled County in the Country – files for a Setback Ordinance
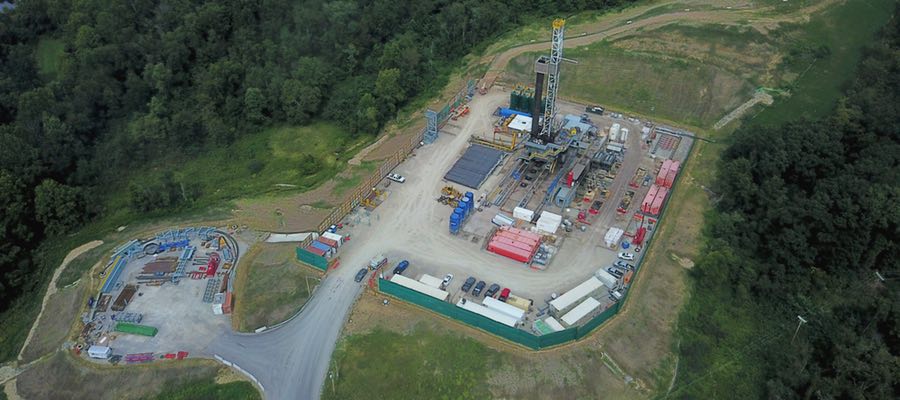
Report Calculates Impacts from PA’s Planned Natural Gas Infrastructure
FracTracker Alliance released the report: A Hazy Future: Pennsylvania’s Energy Landscape in 2045 today, which details the potential future impacts of a massive buildout of Marcellus Shale wells and associated natural gas infrastructure.
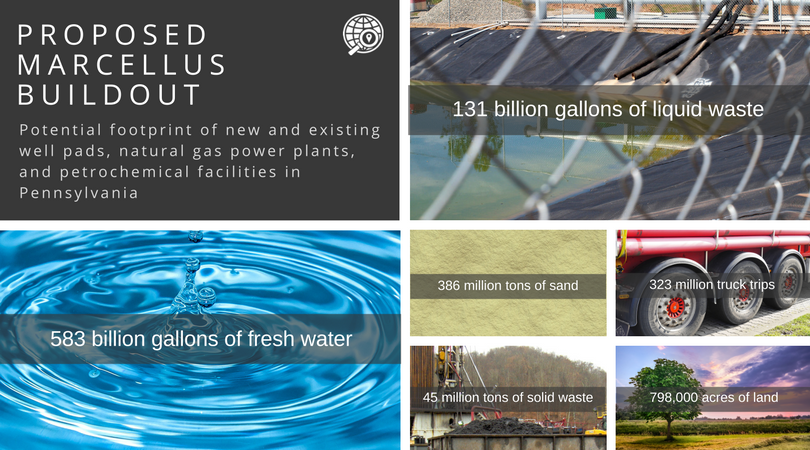
Industry analysts forecast 47,600 new unconventional oil and gas wells may be drilled in Pennsylvania by 2045, fueling new natural gas power plants and petrochemical facilities in PA and beyond. Based on industry projections and current rates of consumption, FracTracker – a national data-driven non-profit – estimates the buildout would require 583 billion gallons of fresh water, 386 million tons of sand, 798,000 acres of land, 131 billion gallons of liquid waste, 45 million tons of solid waste, and more than 323 million truck trips to drilling sites.
“Only 1,801 of the 10,851 unconventional wells already drilled count as a part of this projection, meaning we could see an additional 45,799 such wells in the coming decades,” commented Matt Kelso, Manager of Data and Technology for FracTracker and lead author on the report.
Why the push for so much more drilling? Out of state – and out of country – transport is the outlet for surplus production.
“The oil and gas industry overstates the need for more hydrocarbons,” asserted FracTracker Alliance’s Executive Director, Brook Lenker. “While other countries and states are focusing more on renewables, PA seems resolute to increase its fossil fuel portfolio.”
The report determined that the projected cleared land for well pads and pipelines into the year 2045 could support solar power generation for 285 million homes, more than double the number that exist in the U.S.
“A Hazy Future shows that a fossil fuel-based future for Pennsylvania would come at the expense of its communities’ health, clean air, water and land. It makes clear that a dirty energy future is unnecessary,” said Earthworks’ Pennsylvania Field Advocate, Leann Leiter. Earthworks endorsed FracTracker’s report. She continued, “I hope Governor Wolf reads this and makes the right choices for all Pennsylvanians present and future.”
A Hazy Future reviews the current state of energy demand and use in Pennsylvania, calculates the footprint of industry projections of the proposed buildout, and assesses what that would look like for residents of the Commonwealth.
Started in 2010 as a southwestern Pennsylvania area website, FracTracker Alliance is a national organization with regional offices across the United States in Pennsylvania, the District of Columbia, New York, Ohio, and California. The organization’s mission is to study, map, and communicate the risks of oil and gas development to protect our planet and support the renewable energy transformation. Its goal is to support advocacy groups at the local, regional, and national level, informing their actions to positively shape our nation’s energy future.
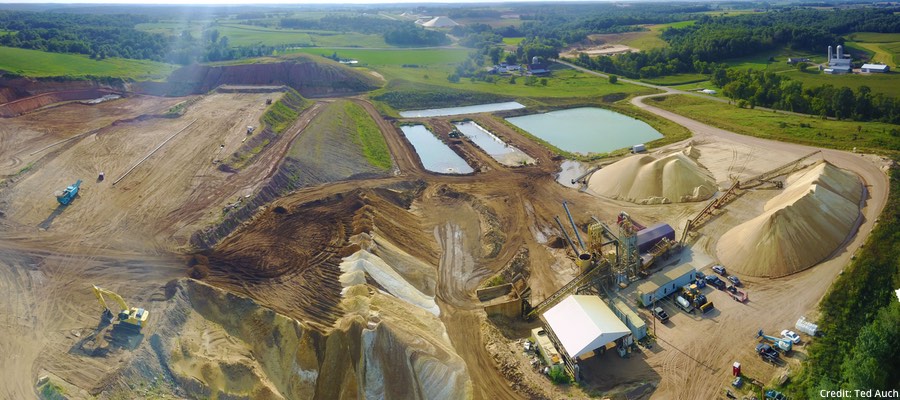
Surface mining to obtain sand that is perfectly sized for use in the hydraulic fracturing process has been increasing in recent years. Over the summer, FracTracker had the opportunity to document a number of sand mining activities occurring in Michigan, Minnesota, and Wisconsin that supply frac sand to the oil and gas industry. Explore a selection of this imagery below:
Explore these and other frac sand mining photos and videos in our online album. The most recent imagery can be found at the bottom of the album. Additional videos are also available on this YouTube channel.
View All Albums
All of these frac sand photos, and more, can also be found on our Energy Imagery page, organized by topic and also location.
If you have photos or videos that you would like to contribute to this growing collection of publicly available information, just email us at info@fractracker.org, along with where and when the imagery was taken, and by whom.
https://www.fractracker.org/a5ej20sjfwe/wp-content/uploads/2017/09/Frac-sand-mining-Aug2017-Feature.jpg400900FracTracker Alliancehttps://www.fractracker.org/a5ej20sjfwe/wp-content/uploads/2025/09/2025-Wordmark-Logo.pngFracTracker Alliance2017-09-12 20:48:512021-04-15 15:02:34New frac sand mining photos and videos are now available via FracTracker
Imagine that tonight you head home to cook dinner. But, standing at your kitchen sink, you find that your tap water is suddenly running a funny color or gives off a bad smell. So instead of cooking, you order a pizza and decide to work outside in your garden. Just as you’re getting your hands dirty, however, you hear the roar of the compressor station that you see from your yard as its “blows off” some substance. Going back inside, and closing your windows to keep out the foul air, you think of the tap water and decide a shower is out of the question. Imagine that you resign yourself to just going to bed early – only to be kept awake by the bright and unnatural glow of gas being flared at the nearby wellhead.
Scenarios just like these can and do happen when hydraulic fracturing, or fracking, encroaches upon residential areas.
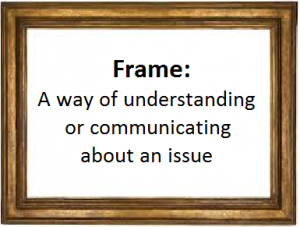
In Part 1 of this two-part series, we described how the many aspects of fracking can destroy a healthy home environment and argued for a frame that focuses on those impacts. A frame is a way of contextualizing, communicating about, and understanding an issue.
This article brings in the idea of rights, and lists several declared rights that fracking violates. Returning to the topic of framing, we then challenge the fracking-friendly frame, by calling into question three common ways of talking about fracking that ignore the rights of those impacted.
In short, the push to support fracking often ignores the rights of people living near it.
Healthy Homes for Human Flourishing
First, let’s explore why a having healthy home matters.
Everyone has a basic need for a safe, healthy place to live. The World Health Organization identifies the social determinants of health (SDH) as the “conditions in which people are born, grow, work, live, and age, and the wider set of forces and systems shaping the conditions of daily life.” Applied to healthy homes, these SDH include access to clean air and safe drinking water, and protection from intrusion and disaster. Health is not merely the absence of disease. Health can mean the ability to function, to live one’s life,[1] to flourish.
Human flourishing demands a healthy home environment. Picture again the scenario at the beginning of this article. Would you be able to care for yourself and your family members, to meet your basic needs, or to lead a satisfying life if your home didn’t seem like a safe place to live?
Using Rights to Make the Case
Many people who live near drilling often ask themselves that very question. These include people like Pam Judy, with a compressor station less than 800 feet from her house, who questions the long term effects of breathing in the 16 chemicals detected in air test conducted by the PA Department of Environmental Protection.
Simply reading or watching the stories of those directly impacted by gas development makes a moving argument for the right to a healthy home environment – and that argument also has a lot of backing. Researchers[2] have made a powerful case that fracking can and has violated human rights, by impacting the health for those downwind or downstream and by denying civil liberties to those pushed aside or silenced during the debate. These same researchers showed specifically that fracking has violated the rights to privacy, family, home, and protection of property.
Various governments and non-governmental organizations around the world have likewise called out human rights violations due to fracking. Other human rights declarations are relevant here, too. Fracking’s impacts are incompatible with the rights to health and to housing. Here’s a sampling:
This sampling of precedents includes statements and declarations by the United Nations and the Organization of American States. It shows that when it comes to human rights and fracking, a strong case has already been made by respected international organizations.
Challenging the fracking-friendly frame
A rights-based perspective, informed by precedents like those above, gives us a strong platform from which to examine and counter arguments that support or promote fracking. We can call those pro-fracking arguments a “fracking-friendly” frame.
A fracking-friendly frame denies or minimizes the human impacts. We can hear elements of the fracking-friendly frame underlying industry promises and political talking points, and witness how they leach into common dialogue between citizens.
Element #1: “Economic impacts”- but only the positives
An “economic impacts ” emphasis tends to focus on narrowly-defined economic benefits , while excluding other real, negative economic drawbacks , like the latter half of boom & bust cycles. Consider this infographic of the “economic impacts” of an Appalachian petrochemical hub scenario–an industry reliant upon the cheap and abundant fracked natural gas of the region. The document offers projected estimates for industry profits and employment levels potentially generated by the five ethane crackers planned for the region. But this document – and its focus on economics – says nothing about the negative consequences to the community. Due to air emissions from these facilities, health costs from fine particulate matter (PM 2.5) could amount to between $120 and $270 million each year, without even factoring in the additional impacts of ozone or toxics. A focus on economic impacts also says nothing about the incalculable value of lives – and quality of life – lost, which could amount to between 14 and 32 additional deaths annually, plus increased asthma, heart attacks, and bronchitis.[3]
Element #2: “Choice”
A false assumption of choice is built into the fracking-friendly frame. This element assumes that people have a choice–if they don’t like the drilling next door, they can just move. Yet, as well water becomes degraded and countryside views become dominated by unprecedented industrial development, selling a home can be a difficult proposition. As one researcher summed it up,
the various forms of land damage from fracking often result in decreased property values, making resale and farming difficult , and also making it harder to acquire mortgages and insurance. Properties adjoining drilling sites are often simply unsellable, as no one wants to live with the noise, the bad air, and the possibility of water pollution.[4]
Others confirm this fallout to home values. A recent report assessing 16 other studies on how UOGD affects home prices points to significant potential decreases in housing values for those on well water (up to -$33,000) and those without ownership of their mineral rights (up to -$60,000). These unfortunate realities belie the idea of choice.
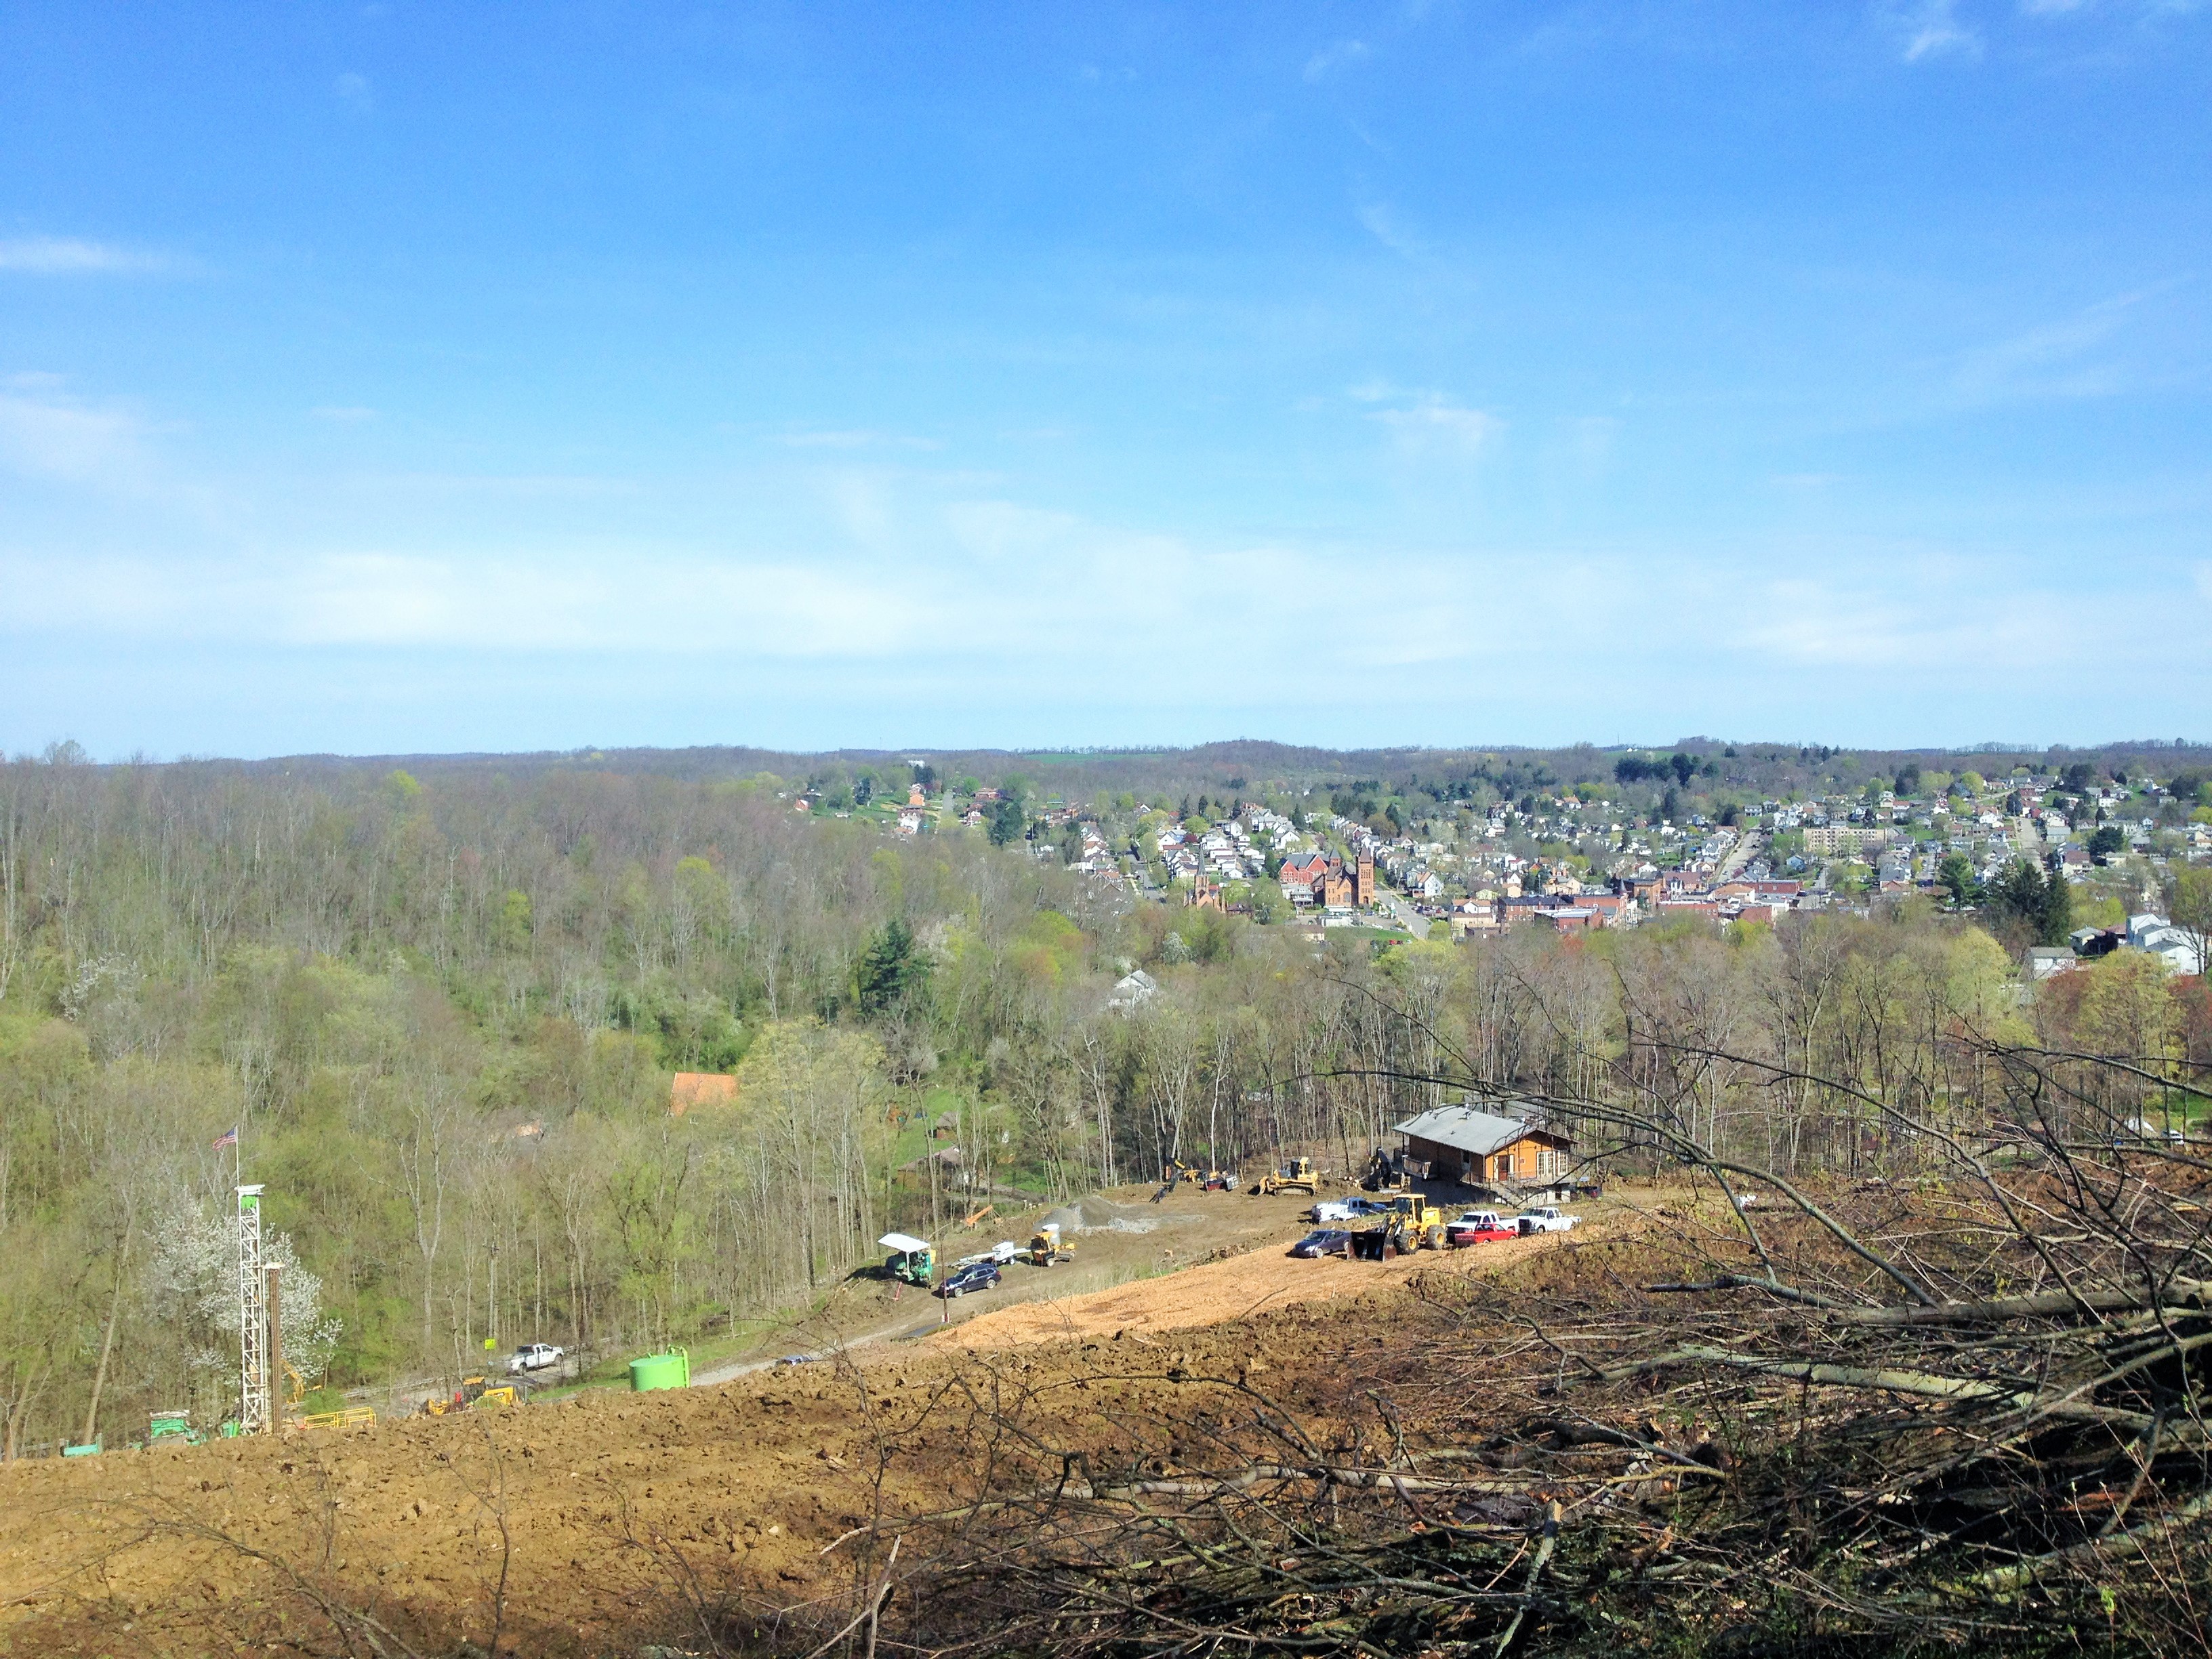
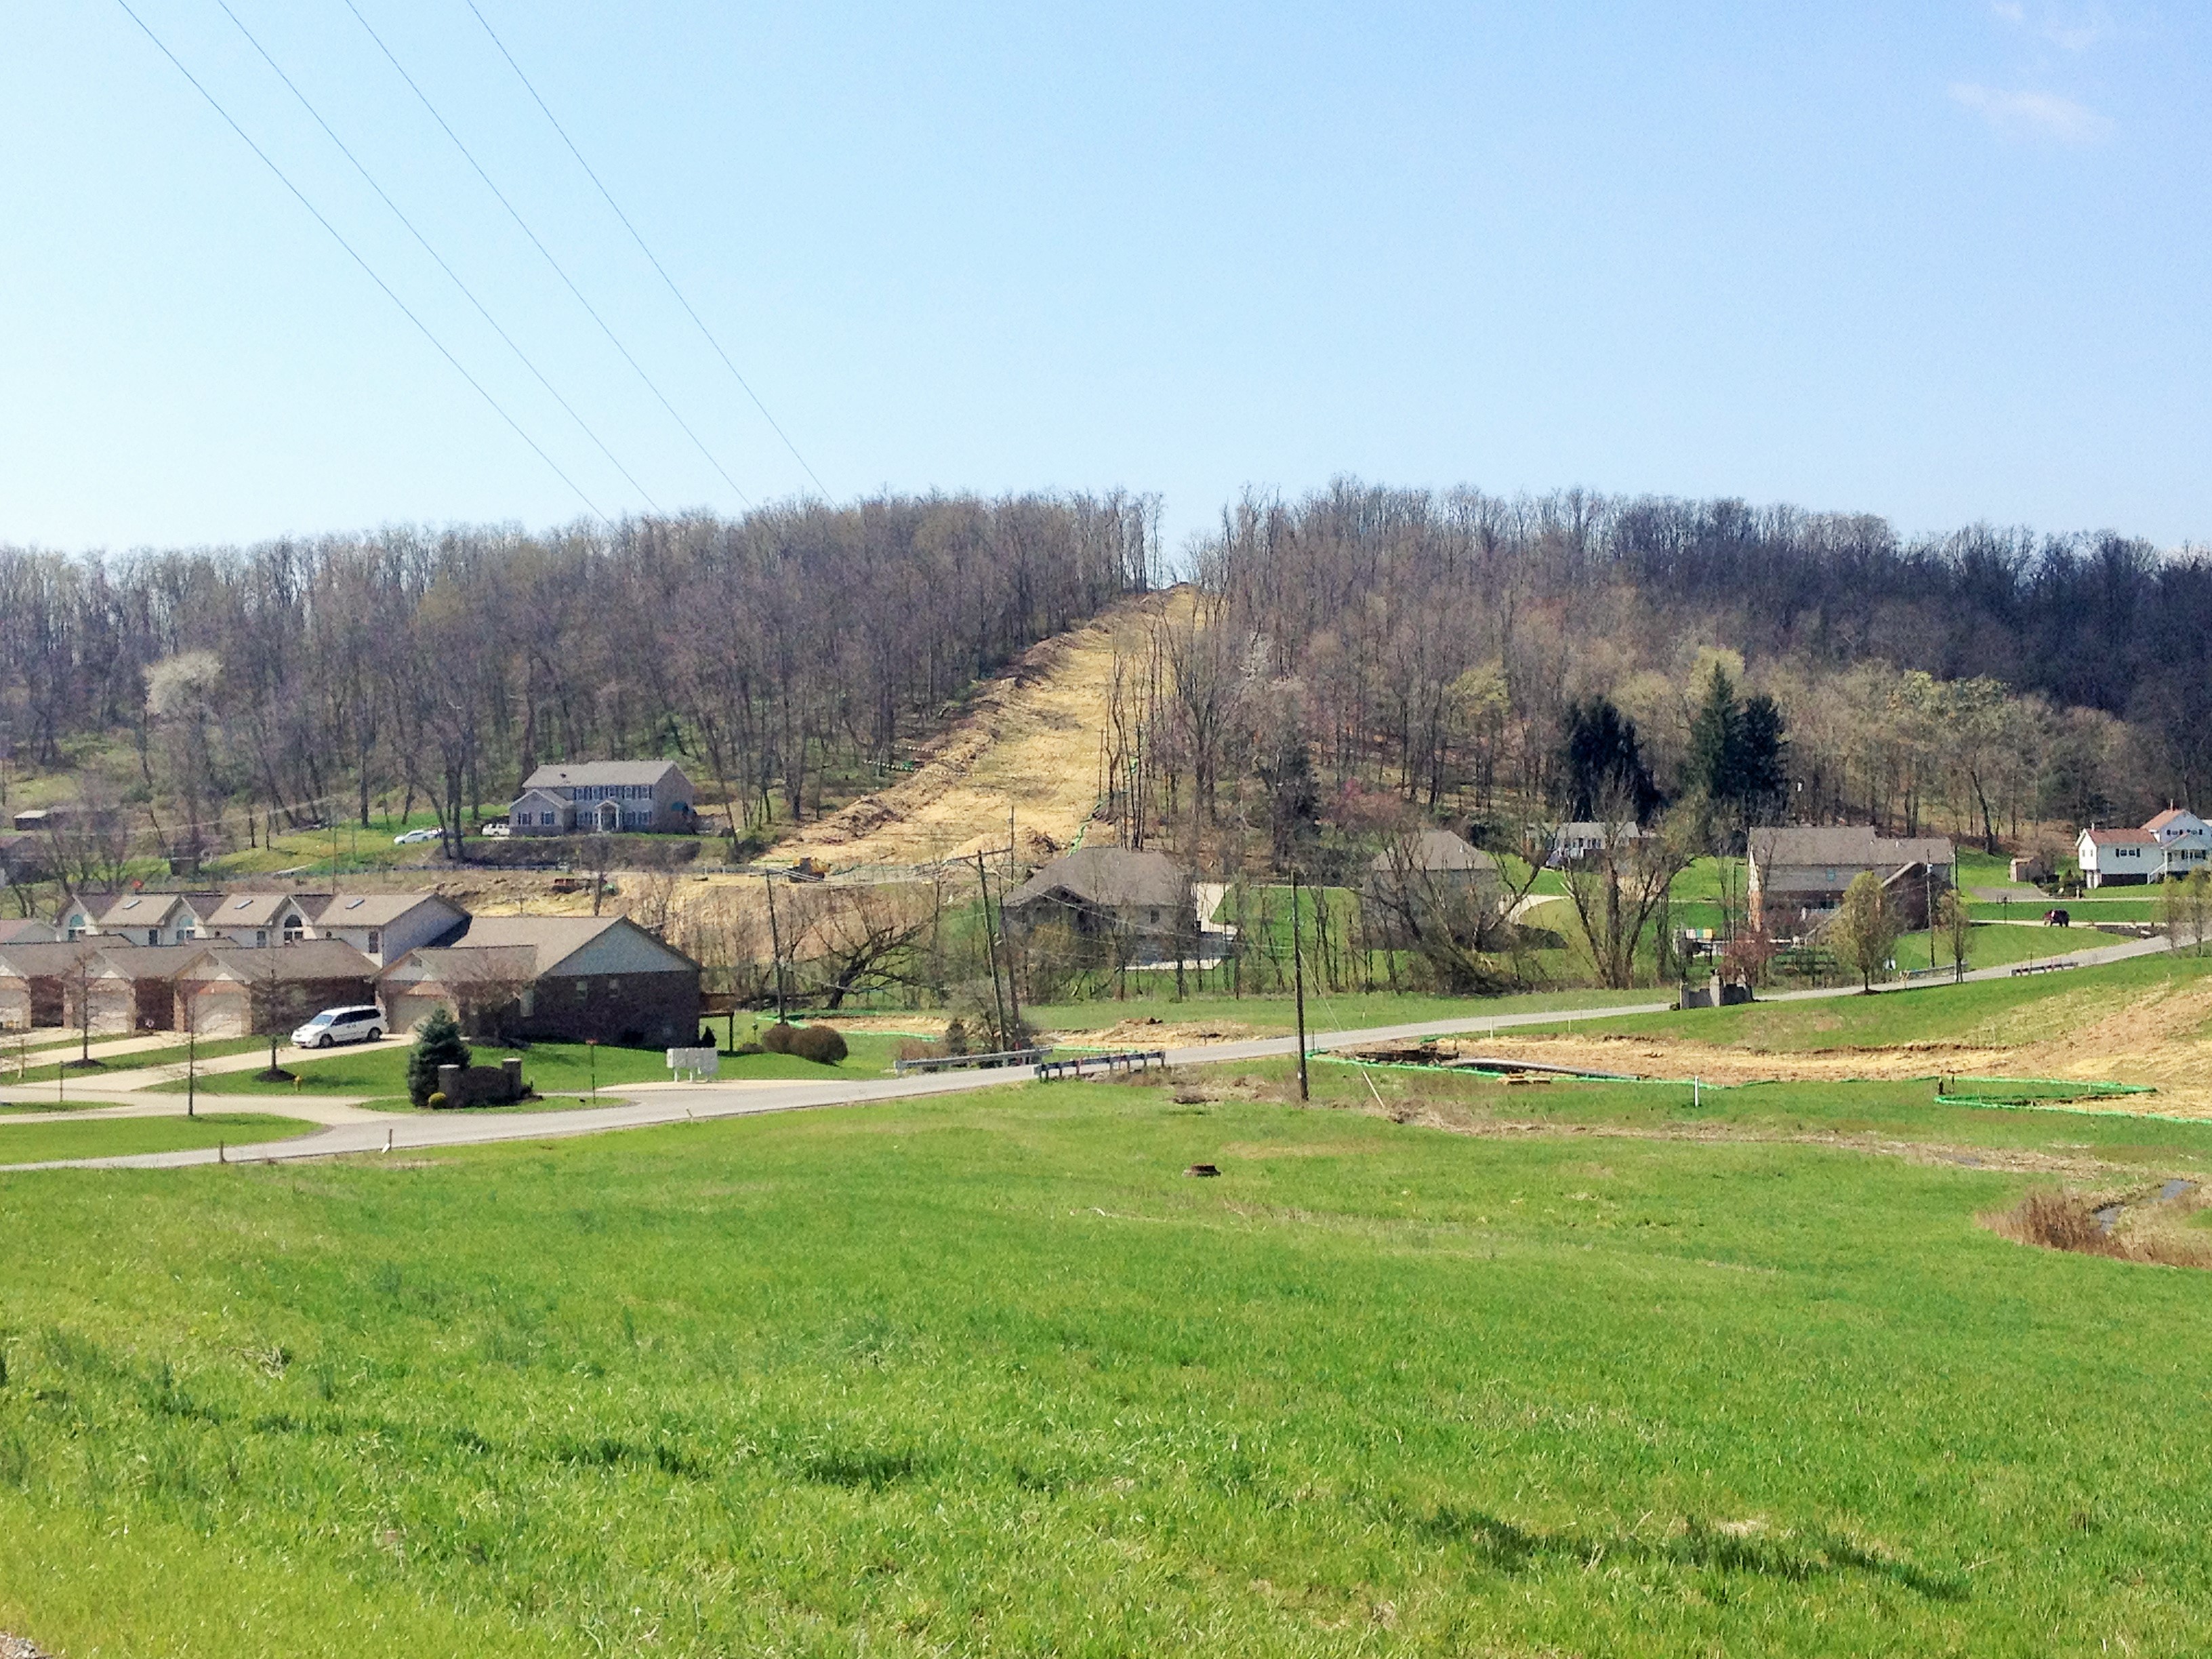
On left, a white fracking rig at the far left of the image sits near a cabin overlooking the town of McDonald, PA. On right, a pipeline cut descends a hillside and into a residential development outside of Houston, PA. Photo credit: Leann Leiter.
In interviews conducted with women living in close quarters to drilling activity, three health care professionals[5] discovered the sense of powerlessness experienced they felt. One woman contemplated moving away from the region in spite of opposition from her husband and her own attachment to her home. In my own interaction with affected families, many express powerful feelings about relocation like sadness about leaving land owned for generations, or an eagerness to escape a home that no longer feels safe. Many express a sense of injustice for being forced to make such painful choices.
Element #3: “Sacrifice of the few for the good of the many”
Another underlying assumption of a fracking-friendly frame is that of “sacrifice of the few for the good of the many.” It declares that a “few” people will have to live near fracking and bear the unfortunate consequences, so many others can have cheap oil and gas. The belief bubbles up among the public, such as in this comment collected during a survey[6] of people living in the Marcellus shale gas region:
Energy has to come from somewhere. The needs of the many may outweigh the inconvenience of the few who live near the exploration efforts. This is not an ideal situation for all residents, but it is the reality.
This person’s statement shows acceptance of the assumption that energy for all requires unevenly shared sacrifice, and indicates a drastic underestimation of the populations impacted. It also indicates a misperception of the impacts, which unfortunately go far beyond mere “inconvenience” for many residents.
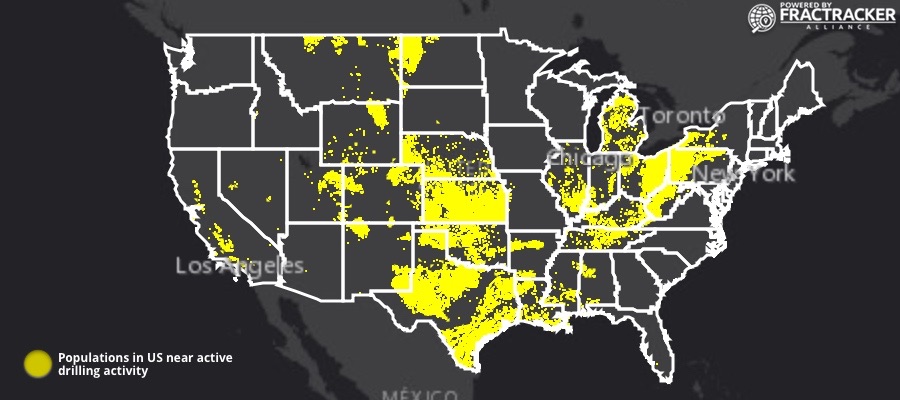
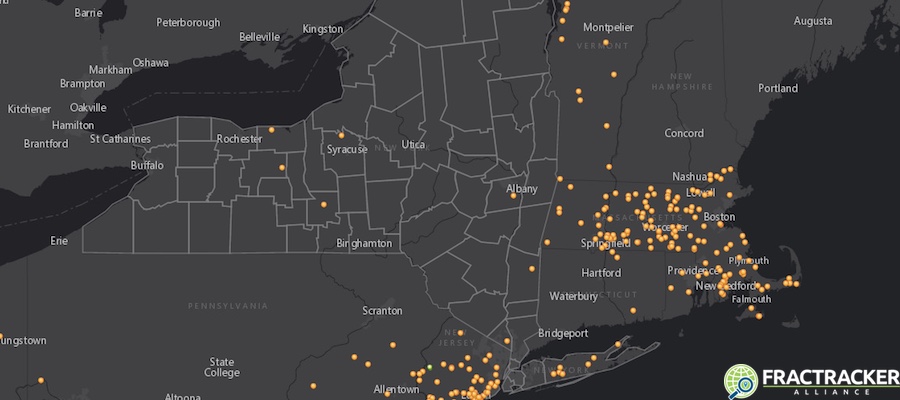
We can break down these assumptions by questioning how many people make sacrifices in the name of gas extraction. An interactive map by FracTracker shows that over 12 million Americans live within a risky ½ mile of oil and gas facilities (including both fracking wells and other types). Mounting research indicates health threats for distances of ½ mile or greater. That meaning this ever-growing number of Americans have increased rates of asthma and prenatal harms, with the most vulnerable – the young, the elderly, and those with pre-existing conditions – at the highest risk. The 12 million figure, already a conservative estimate, would be significantly higher if factoring in other oil and gas infrastructure like pipelines or frac sand mining operations, each of which carry their own risks.
Populations in US near activity oil and gas drilling activity in 2016. Click to explore the interactive map.
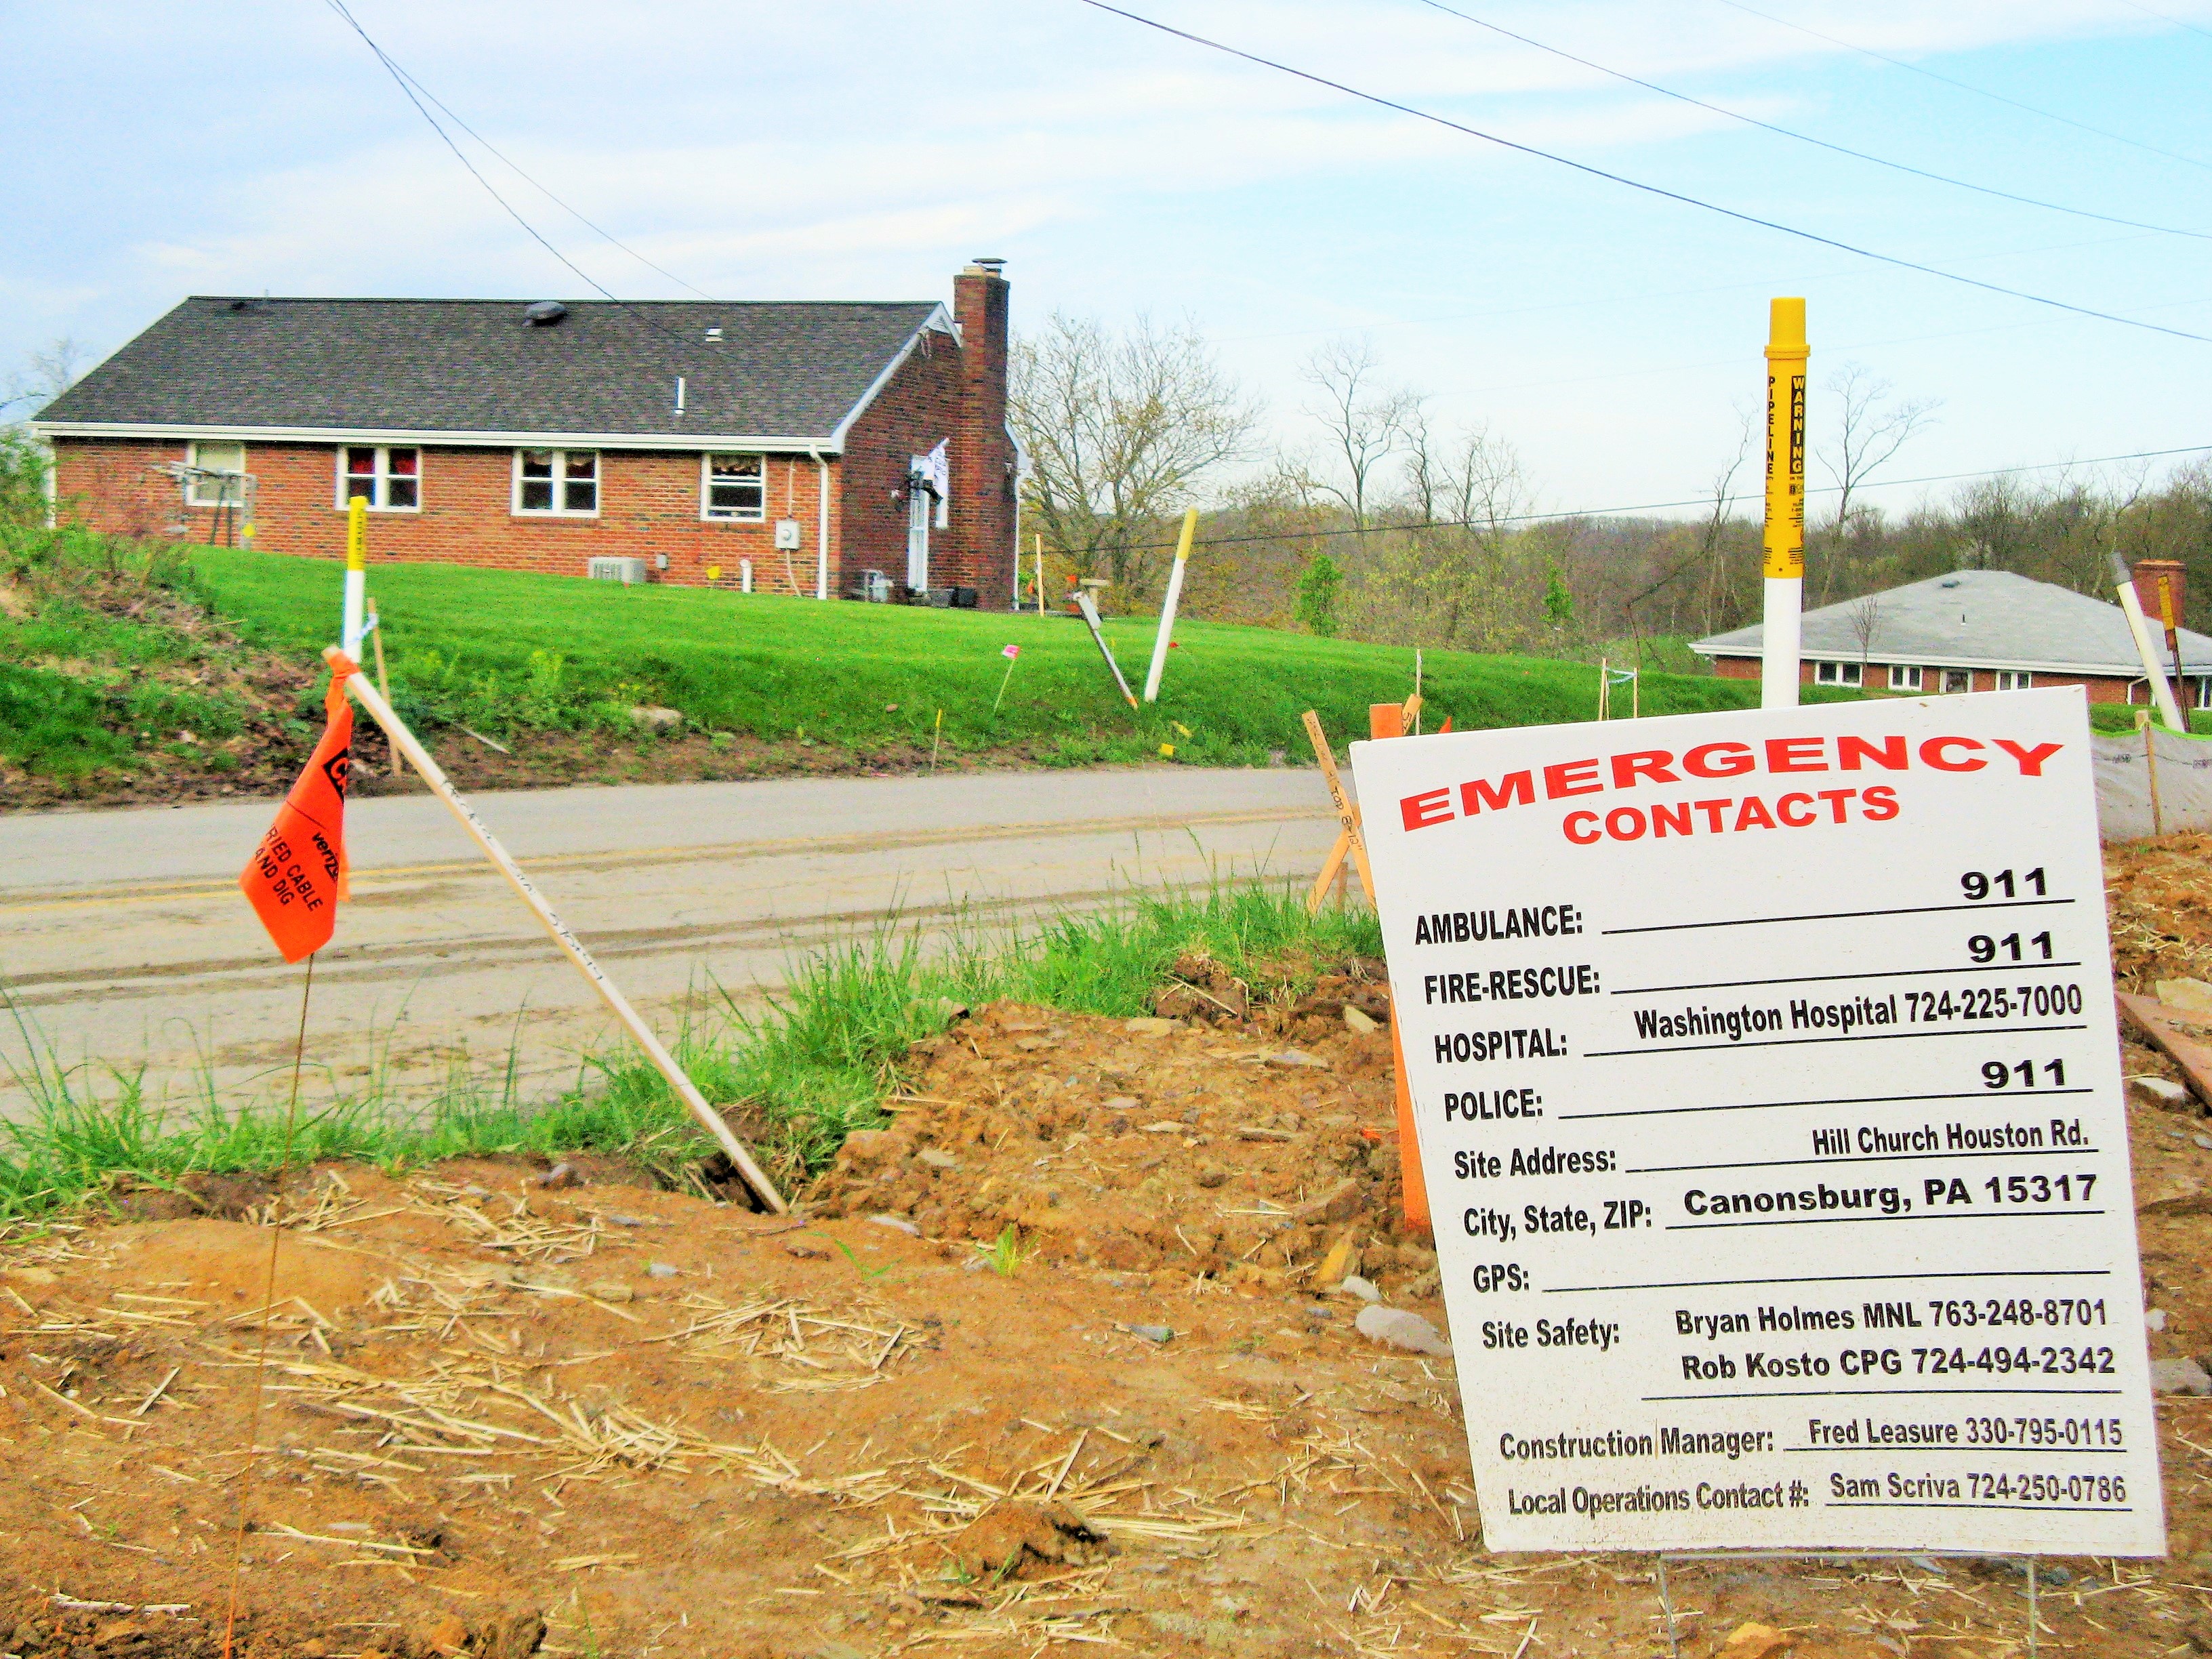
The view of nearby homes from a pipeline right-of-way, along with list of emergency contacts in case of incident. Safety precautions like these remind us of the potentially injurious nature of gas infrastructure. They also highlight the level of sacrifice being demanded of households near the hazard. Photo credit: Leann Leiter.
Building social support
These elements of a fracking-friendly frame function to isolate those who are experiencing negative effects in their own homes by minimizing, even denying, the impacts they are experiencing. Researchers in extractive regions have observed the power of this isolation. In some rural areas, isolation may be supported in part by cultural norms, such as an Appalachian appreciation for “minding one’s own business.” In at least one fracking-affected community, this widely-accepted norm hampers sharing among neighbors, prompting one resident’s complaint that “we’re all fighting like individuals.”[7] In a study of a community being driven from their homes by coal mining and power generation, another set of extractive, industrial activities, one participant lamented:
I think one of the problems of the mining and the industry is, they play on the basic everyday person’s lack of resources. There’s no social support for displacement, none whatsoever.[8]
A healthy homes frame, focused on universally shared human rights, powerfully counters the isolation. It reminds those who are suffering or have concerns about the changes to their home environment that they are not alone; others around the world are experiencing similar impacts to their households. Adopting this frame for understanding fracking is a show of support, one that acknowledges their plight.
Nearly everyone values and desires a healthy home, regardless of whether that home is an apartment, a nursing home, a cabin, or a mobile home. This frame extends beyond geographical, economical, and cultural barriers. It encourages social support from those currently removed from shale plays and the hydraulic fracturing used in extracting their resources. It empowers action, with the home front as a site of resistance, by articulating the range of rights being violated.
Focusing on what we’re fighting for
Re-centering the problems of fracking as they impact the right to a healthy home makes sense to those of us witnessing the degradation of the places people need in order to live and flourish. A rights-based approach focuses on what we’re fighting for, rather than giving extra airtime to the already-powerful frame we must fight against.
If you need assistance protecting your rights from planned fracking, the Delaware Riverkeeper Network offers a guide for communities and their local leaders to defending environmental rights at the municipal level.
For communities at any stage of gas development, Environmental Health Project has created a Where to Turn for Help directory full of sources for air testing services, community organizing, health information, tracking and reporting fracking development and violations, and much more.
Whether or not you feel the direct impacts of fracking, we are all connected to this extensive process. Fracking’s commodity products – energy and plastics – are part of all of our lives; it’s climate-altering effect diminishes all of our futures. More importantly, we all have a crucial role to play. Here is how you can get further involved:
Communicate with your lawmakers – share with them this article series or your own take on fracking, and ask what frame they are using when they make decisions on this and other dangerous modes of energy extraction.
Join Halt the Harm Network to get connected to people, groups and events “working to fight the harms of oil and gas development.”
Bringing rights into the conversation on fracking challenges the fracking-friendly frame, and promotes instead protection for those in fracked households.
Special thanks to the many individuals and families who shared the experiences that informed this article series.
References:
Resick, L. K., Knestrick, J. M., Counts, M. M., & Pizzuto, L. K. (2013). The meaning of health among mid-Appalachian women within the context of the environment. Journal of Environmental Studies and Sciences , 3 (3), 290-296.
Short, D., Elliot, J., Norder, K., Lloyd-Davies, E., & Morley, J. (2015). Extreme energy, ‘fracking’ and human rights: a new field for human rights impact assessments? , The International Journal of Human Rights, 19:6, 697-736, DOI:10.1080/13642987.2015.1019219
John Graham, Senior Scientist at Clean Air Task Force, personal communication, June 9, 2017. Health impacts modeling completed using EPA Co-Benefits and Risk Assessment (COBRA) Screening Tool, using estimated PM 2.5 air emissions for permitted Shell ethane cracker in Beaver County, PA and four additional facilities planned in Ohio and West Virginia.
Richard Heinberg cited in Short, D., Elliot, J., Norder, K., Lloyd-Davies, E., & Morley, J. (2015). Extreme energy, ‘fracking’ and human rights: a new field for human rights impact assessments? , The International Journal of Human Rights, 19:6, 697-736, DOI:10.1080/13642987.2015.1019219
Resick, L. K., Knestrick, J. M., Counts, M. M., & Pizzuto, L. K. (2013). The meaning of health among mid-Appalachian women within the context of the environment. Journal of Environmental Studies and Sciences , 3 (3), 290-296.
Cooley, R., & Casagrande, D. (2017). Marcellus Shale as Golden Goose. ExtrACTION: Impacts, Engagements, and Alternative Futures. Routledge.
Resick, L. K., Knestrick, J. M., Counts, M. M., & Pizzuto, L. K. (2013). The meaning of health among mid-Appalachian women within the context of the environment. Journal of Environmental Studies and Sciences , 3 (3), 290-296.
Connor et al., p. 54. Linda Connor, Glenn Albrecht, Nick Higginbotham, Sonia Freeman, and Wayne Smith. (2004). Environmental Change and Human Health in Upper Hunter Communities of New South Wales, Australia. EcoHealth 1 (Suppl.2), ,47-58. DOI: 10.1007/s10393-004-0053-2
https://www.fractracker.org/a5ej20sjfwe/wp-content/uploads/2017/08/Pipeline-House-Feature-Leiter.jpg400900FracTracker Alliancehttps://www.fractracker.org/a5ej20sjfwe/wp-content/uploads/2025/09/2025-Wordmark-Logo.pngFracTracker Alliance2017-08-03 12:40:072021-04-15 15:02:36The Right to a Healthy Home
An Ohio family took joy in raising their kids and cattle at their farmhouse, built in 1853 with crooked walls and no indoor bathrooms. When they leased land to fracking activity, however, the “beep, beep, beep” of heavy truck traffic kept them up all night, and a cow died after drinking a strange fluid flowing on the land during the cold of winter. They dedicated their retirement savings to moving and building a new home, only to soon after receive a compressor station as their neighbor – close enough to hear the engines at all hours and loud enough to make them dread even walking out to their mailbox.
During the upswing of a boom-and-bust cycle of the gas industry in Greene County, the influx of outside workers and the high demand on rental housing resulted in one particular family being unable to secure an apartment. Without adequate housing, their children were temporarily taken from their custody.
In Huntingdon, a young woman resisted a pipeline being forced through her property by stationing herself in a tree, while workers with chainsaws felled those around her. Eminent domain enabled the gas company to claim this privately-owned land under a weak guise of “public good.”
These unsettling but true stories hint at the countless ways fracking plays out in individual households. A healthy home environment – with clean air, potable drinking water, and safety from outside elements – is essential to human life and functioning. Yet, the industrial processes involved in unconventional oil and gas development (UOGD), often summed up with the term “fracking,” may interfere with or even take away the ability to maintain a healthy home.
This article aims to put these household impacts, and the right to a healthy home, at the center of the fracking debate.
Framing the issue
The way we understand just about anything depends on our frame of reference. A frame, like the frame around a picture, brings its contents into focus. At the same time, it excludes the information outside its borders. A frame declares that what’s inside is what matters. When it comes to the human effects of fracking, various conflicting frames exist, each dictating their own picture of what fracking actually does and means.
The frame we use to look at the fracking debate is so important, because it dictates how we talk about and think about the problem. Likewise, if we can identify the frame others are using when they talk about fracking, we can see more clearly what they have prioritized and what they are leaving out of the conversation.
Two researchers who conducted surveys, interviews, and focus groups in five Pennsylvania counties in 2014 and 2015 argue for the need for a new frame.1 Some of the common ways of talking about fracking not only favor shale gas development for reasons like those included in the frame on the left above, they also work against those trying to make a stand against the negative effects fracking. These researchers suggest that, rather than arguing within the existing, dominant frames, activists should consider proactively “reframing the debate around other core values.” The right to a healthy home is a widely-shared value. I propose we adopt a frame that puts that right at the center of the picture.
What is a “healthy home”?
The term healthy home isn’t new. The federal agencies Housing and Urban Development (HUD) and the Centers for Disease Control (CDC) both use this phrase in defining the importance of a home environment free from hazards and contaminants, like lead and radon. Simply put, a healthy home is one that supports health.
Why Now?
We sit poised at a unique moment to take on the task of reframing fracking. While new drilling in some places appears to be on the decline, countless large-scale petrochemical projects, like a growing crop of plastic-producing ethane crackers in the northeast US, are ramping up. These facilities will demand massive supplies of natural gas and byproducts, perpetuating and likely increasing drilling.
Engagement is urgent and timely,2 and the entire country has a role to play. This moment in our energy history is a chance for all of us – those affected by, in favor of, concerned about, eager to welcome, or otherwise learning about UOGD – to get clear on our frame of understanding fracking.
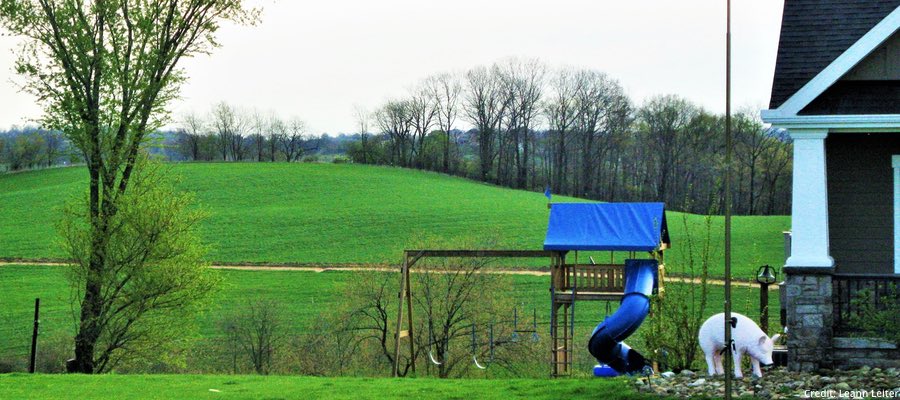
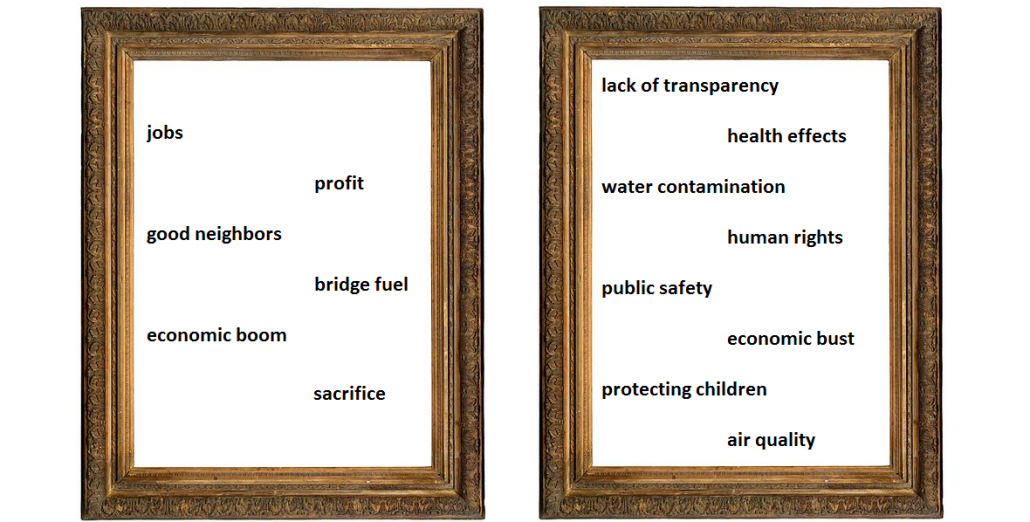
A pipeline right-of-way, about 200 yards behind this house and children’s swingset, shows how close fracking infrastructure comes to homes. Photo credit: Leann Leiter
Why a “Healthy Homes” Frame?
Proponents of frames that endorse fracking often live at a considerable distance from the processes involved,3 buffering them and their families from its impacts. According to researchers4 who listened to the testimonies of residents at a community hearing, the distance they lived from the industrial activities shows up in how they talk about fracking. Those in favor tend to use a depersonalized, “birds-eye view” in describing the impacts. People for whom the negative impacts are or will be a part of their lives rely on more descriptive, specific, and place-based language.
Similarly, a frame that focuses on household impacts emphasizes the on-the-ground, lived experience of living near fracking infrastructure. This frame approaches the debate on fracking by continually asking, what is this like for the people who live with the process? What are the impacts to their home environment? Such a frame does not ignore large-scale issues of jobs and energy supply, but grounds these bigger questions with the real and urgent consequences to the people who are suffering.
Household impacts
Despite rulings that define UOGD as an industrial process, drilling companies locate all manner of infrastructure – wells, pipelines, compressor stations, among others – in areas formerly residential or agricultural. Rules dictating distances from UOGD facilities to structures like houses vary by municipality and state. Yet, these new and often imposing facilities repeatedly occupy the immediate view of homes, or are within close proximity that defy medical and safety warnings.
Video: Glaring light of burning flares and noises both droning and sudden, along with major truck traffic and other changes to the immediate landscape around the household, produce high levels of stress, leading to its own health problems, creating an environment where water may become unsafe to drink and breathing the air becomes a hazard.
The Oil & Gas Threat Map (by Earthworks and FracTracker) shows the populations within a half-mile “threat radius” of infrastructure that includes fracking – close enough for residents to be exposed to contaminated air emissions, and possibly smell disturbing odors, hear loud sounds and feel vibrations, and see bright lights and the fire of emergency flares. As confirmed by the EPA, in some cases, UOGD results in contamination of drinking water, as well.
Researchers at The Environmental Health Project (EHP) offer individual health assessments to residents living in the shadow of fracking operations. In a physician’s thorough review of over 61 assessments, they identified the following symptoms to be temporally related to gas activity:
Table 1. Symptoms temporally related to UOGD
SYMPTOM CATEGORY
n
%
Symptom
n
%
UPPER RESPIRATORY SYMPTOMS
39
64%
Nose or throat irritation
25
41%
Sinus pain or infections
17
28%
Nose bleeds
8
13%
CONSTITUTIONAL SYMPTOMS
33
54%
Sleep disruption
26
43%
Fatigue
13
21%
Weak or Drowsy
9
15%
NEUROLOGICAL SYMPTOMS
32
52%
Headache
25
41%
Dizziness
11
18%
Numbness
9
15%
Memory loss
8
13%
PSYCHOLOGICAL SYMPTOMS
32
52%
Stress or anxiety
23
38%
Irritable or moody
12
20%
Worry
6
10%
LOWER RESPIRATORY SYMPTOMS
30
49%
Cough
21
34%
Shortness of breath
19
31%
Weezing
14
23%
GASTRO-INTESTINAL SYMPTOMS
27
44%
Nausea
13
21%
Abdominal pain
12
20%
EYE SYMPTOMS
23
38%
Itchy eyes
11
18%
Painful or dry
10
16%
DERMATOLOGICAL SYMPTOMS
19
31%
Rash
10
16%
Itching
7
11%
Lesions or blisters
6
10%
CARDIAC SYMPTOMS
17
28%
Palpitations
9
15%
Chest pain
6
10%
Other cardiac symptoms
6
10%
HEARING CHANGES OR TINNITUS
10
16%
Hearing loss
3
5%
Tinnitus (ringing in the ear)
10
16%
MUSCULOSKELETAL
10
16%
Painful joints
9
15%
Aches
7
11%
ENDOCRINE
7
11%
Hair loss
7
11%
n = Number of patients reporting symptom, out of 61 patients assessed
% = Percentage of patients reporting symptom, out of 61 patients assessed
Mental and emotional stress can exacerbate and create physical health symptoms. For households close to fracking, the fear of a disaster, like a well pad fire, or concern for the long term health effects of exposures through air and water can create serious stress. These developments change communities, sometimes in divisive, negative ways, potentially adding to the stress.
Fracking, a disruptive, landscape-altering process can also produce what’s called solastalgia, whereby negatively-perceived changes to the land alter a person’s sense of belonging. In the case of fracking in residential areas, people may lose not only their relationship to the land, but their homes as they once knew them.5 Solastalgia, considered by some researchers to be a new psycho-social condition, is “the lived experience of the physical desolation of home.”6
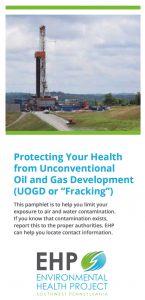
When Home is Unsafe, Where to Get Help
Click to expand and explore the tri-fold. Click here to access and print this free resource, and many others by EHP.
EHP offers a new resource for protecting your health at a household level, called: “Protecting Your Health from Unconventional Oil and Gas Development.” We created this free informational resource in collaboration with residents and health care providers in four different shale gas counties.
The final product is the direct result of input and knowledge from 15 focus groups and project meetings in these affected communities with over 100 participants, including residents and healthcare providers. EHP has packed this resource with practical steps for households amid shale gas development to limit their exposure to air and water contamination that may be associated with fracking.
For follow-up questions, or for free personalized health services for those experiencing fracking-related exposures, you can contact EHP directly at 724-260-5504 or by email at info@environmentalhealthproject.org.
Re-Centering Home in the Fracking Debate
Putting affected households at the center of the fracking debate better reflects the experiences of people on the front lines. This powerful frame could help counter the power of those who speak positively about fracking, but lack direct experience of the process.
For those at the frontlines of fracking, the intent is that these resources and tools will help you protect your health and your homes.
For those not yet directly affected by fracking, you can lend a hand. Show support for health protective measures by signing up at EHP for updates on events, education, and opportunities to make your voice heard. And, whenever and wherever you can weigh in on the debate, put a frame around fracking that puts impacted households at the center.
References
Cooley, R., & Casagrande, D. (2017). Marcellus Shale as Golden Goose. ExtrACTION: Impacts, Engagements, and Alternative Futures.
Short, D., Elliot, J., Norder, K., Lloyd-Davies, E., & Morley, J. (2015). Extreme energy, ‘fracking’ and human rights: a new field for human rights impact assessments?, The International Journal of Human Rights, 19:6, 697-736, DOI:10.1080/13642987.2015.1019219
Cooley, R., & Casagrande, D. (2017). Marcellus Shale as Golden Goose. ExtrACTION: Impacts, Engagements, and Alternative Futures.
Mando, J. (2016). Constructing the vicarious experience of proximity in a Marcellus Shale public hearing. Environmental Communication, 10(3), 352-364.
Resick, L. K. (2016). Gender, protest, and the health impacts of unconventional natural gas development. In Y. Beebeejaum (Ed.), The participatory city (pp. 167-175). Berlin: Jovis Verlag GmgH.
Albrecht et al (2007). Solastalgia: the distress caused by environmental change, Australasian Psychiatry . Vol 15 Supplement.
By Leann Leiter, Environmental Health Fellow for the SW-PA Environmental Health Project and FracTracker Alliance
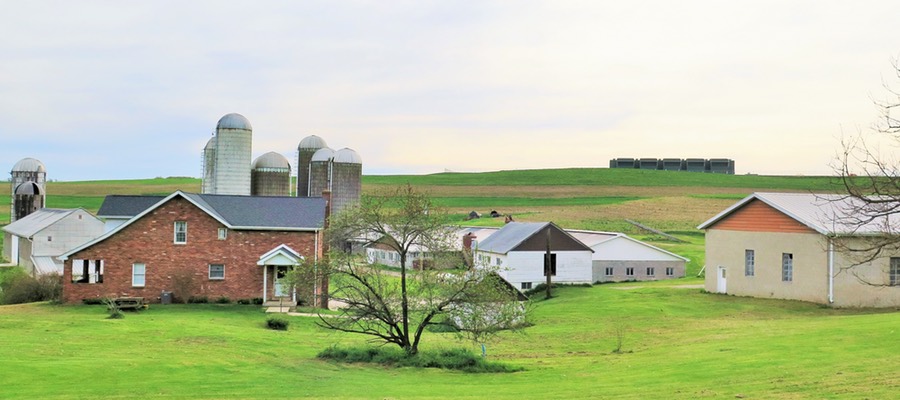
Feature photograph: A compressor station sits above a beautiful farm in Washington County, Pennsylvania. Photo credit: Leann Leiter
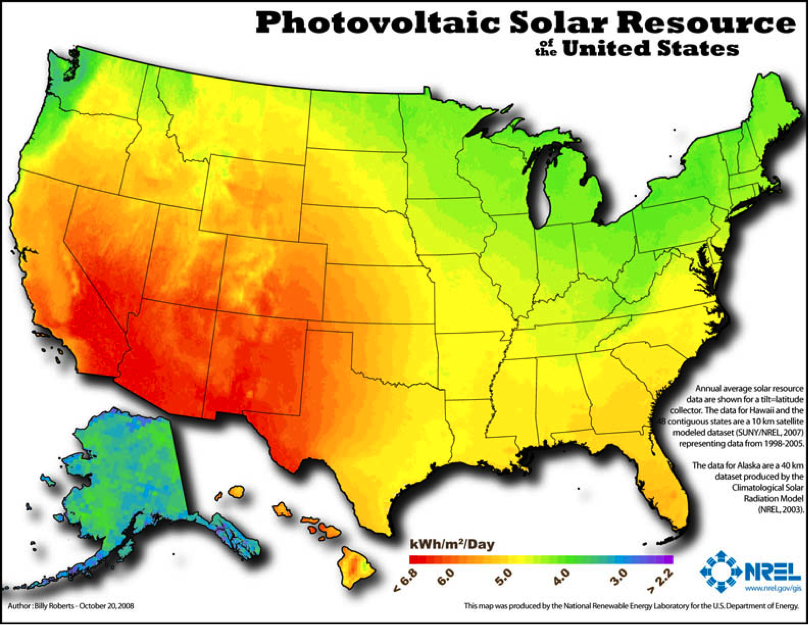
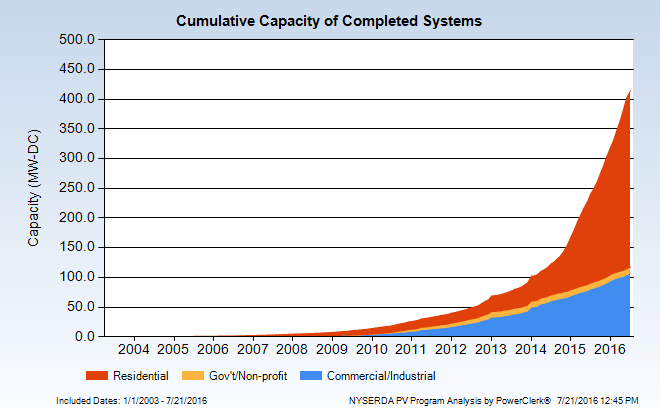
It’s difficult to talk about the risks of oil and gas extraction without providing data on energy alternatives in the conversation. Let’s look at New York State, as an example. There, solar power is taking a leadership position in the renewable energy revolution in the United States. Although New York State receives far less sunshine than many states to the west and south, the trends are bright! Currently, New York State ranks seventh in the nation in installed solar capacity, with over 700 MW of power generated by the sun, enough to power 121,000 homes.
Despite common assumptions that solar power only makes sense where the sun shines 360 days a year, we’ve been seeing successful adoption of solar in Europe for years. For example, in Germany, where even the most southern part of the country is further north of the Adirondack Mountains in New York State, close to 7% of all the power used comes from combined residential and commercial scale photovoltaic sources–35.2 TWh in all. Munich, one of the sunniest places in all of Germany, has a lower average solar irradiation rate of 3.1 kWh/m2/day than most cities in New York State; compare it with locations in New York like Rochester (3.7 kWh/m2/day), New York City (4.0 kWh/m2/day), and Albany (3.8 kWh/m2/day). At present, Germany still leads New York State by more than double the electrical output from solar for equivalent areas.
Cumulative Solar Capacity in New York
The cumulative capacity for completed photovoltaic systems in New York State has risen steeply in the past three years, with ground-mounted and roof-top residential capacity outpacing commercial capacity by a wide margin.
Nonetheless, commercial and industrial scale installations in New York account for over 100 MW of power capacity in the state.
Large-Scale Solar Installations Map
This map shows the location of those large-scale solar installations in the US (zoom out to see full extent of US), as of March 2016. Here is our interactive map:
In the past fifteen years, the increase in small to medium-sized solar installations in New York State has been significant, and growth is projected to continue. The following animation, based on data from the New York State Energy Research and Development Authority (NYSERDA), shows that increase in capacity (by zip code) since 2000:
Solar Installations by Zip Code
NYSERDA also provides maps that show distributions of residential, governmental/NGO, and commercial solar energy projects (images shown below). For example, Suffolk County leads the way in the residential arena, with nearly 8200 photovoltaic (PV) systems on roofs and in yards, with an average size of 8.3 kW each.
Erie County has 128 PV systems run by governmental and not-for-profit groups, with an average size of about 27 kW each. Albany County has over 320 commercial installations, with an average size each of about 117 kW.
New York State’s Future Solar Contribution
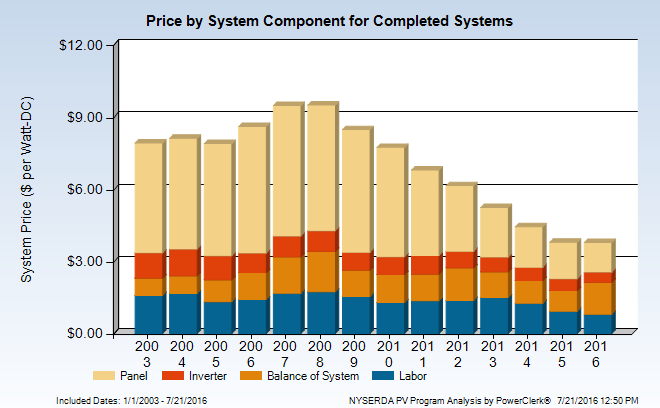
Price of Completed Solar Systems 2003-2016
The prices of solar panels is steeply declining, and is coupled with generous tax incentives. The good news, according to the Solar Energy Industries Association (SEIA), is that over the next five years, New York State’s solar capacity is expected to quadruple its current output, adding over 2900 MW of power. This change would elevate New York State from seventh to fourth place in output in the US.
By Karen Edelstein, Eastern Program Coordinator, FracTracker Alliance
https://www.fractracker.org/a5ej20sjfwe/wp-content/uploads/2016/08/NY-Solar-Feature.jpg400900Karen Edelsteinhttps://www.fractracker.org/a5ej20sjfwe/wp-content/uploads/2025/09/2025-Wordmark-Logo.pngKaren Edelstein2016-08-08 09:31:242020-03-12 17:17:46New York: A Sunshine State!
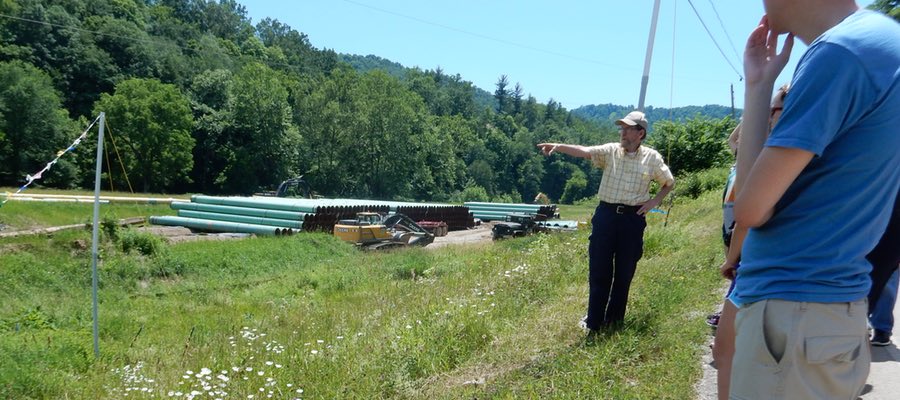
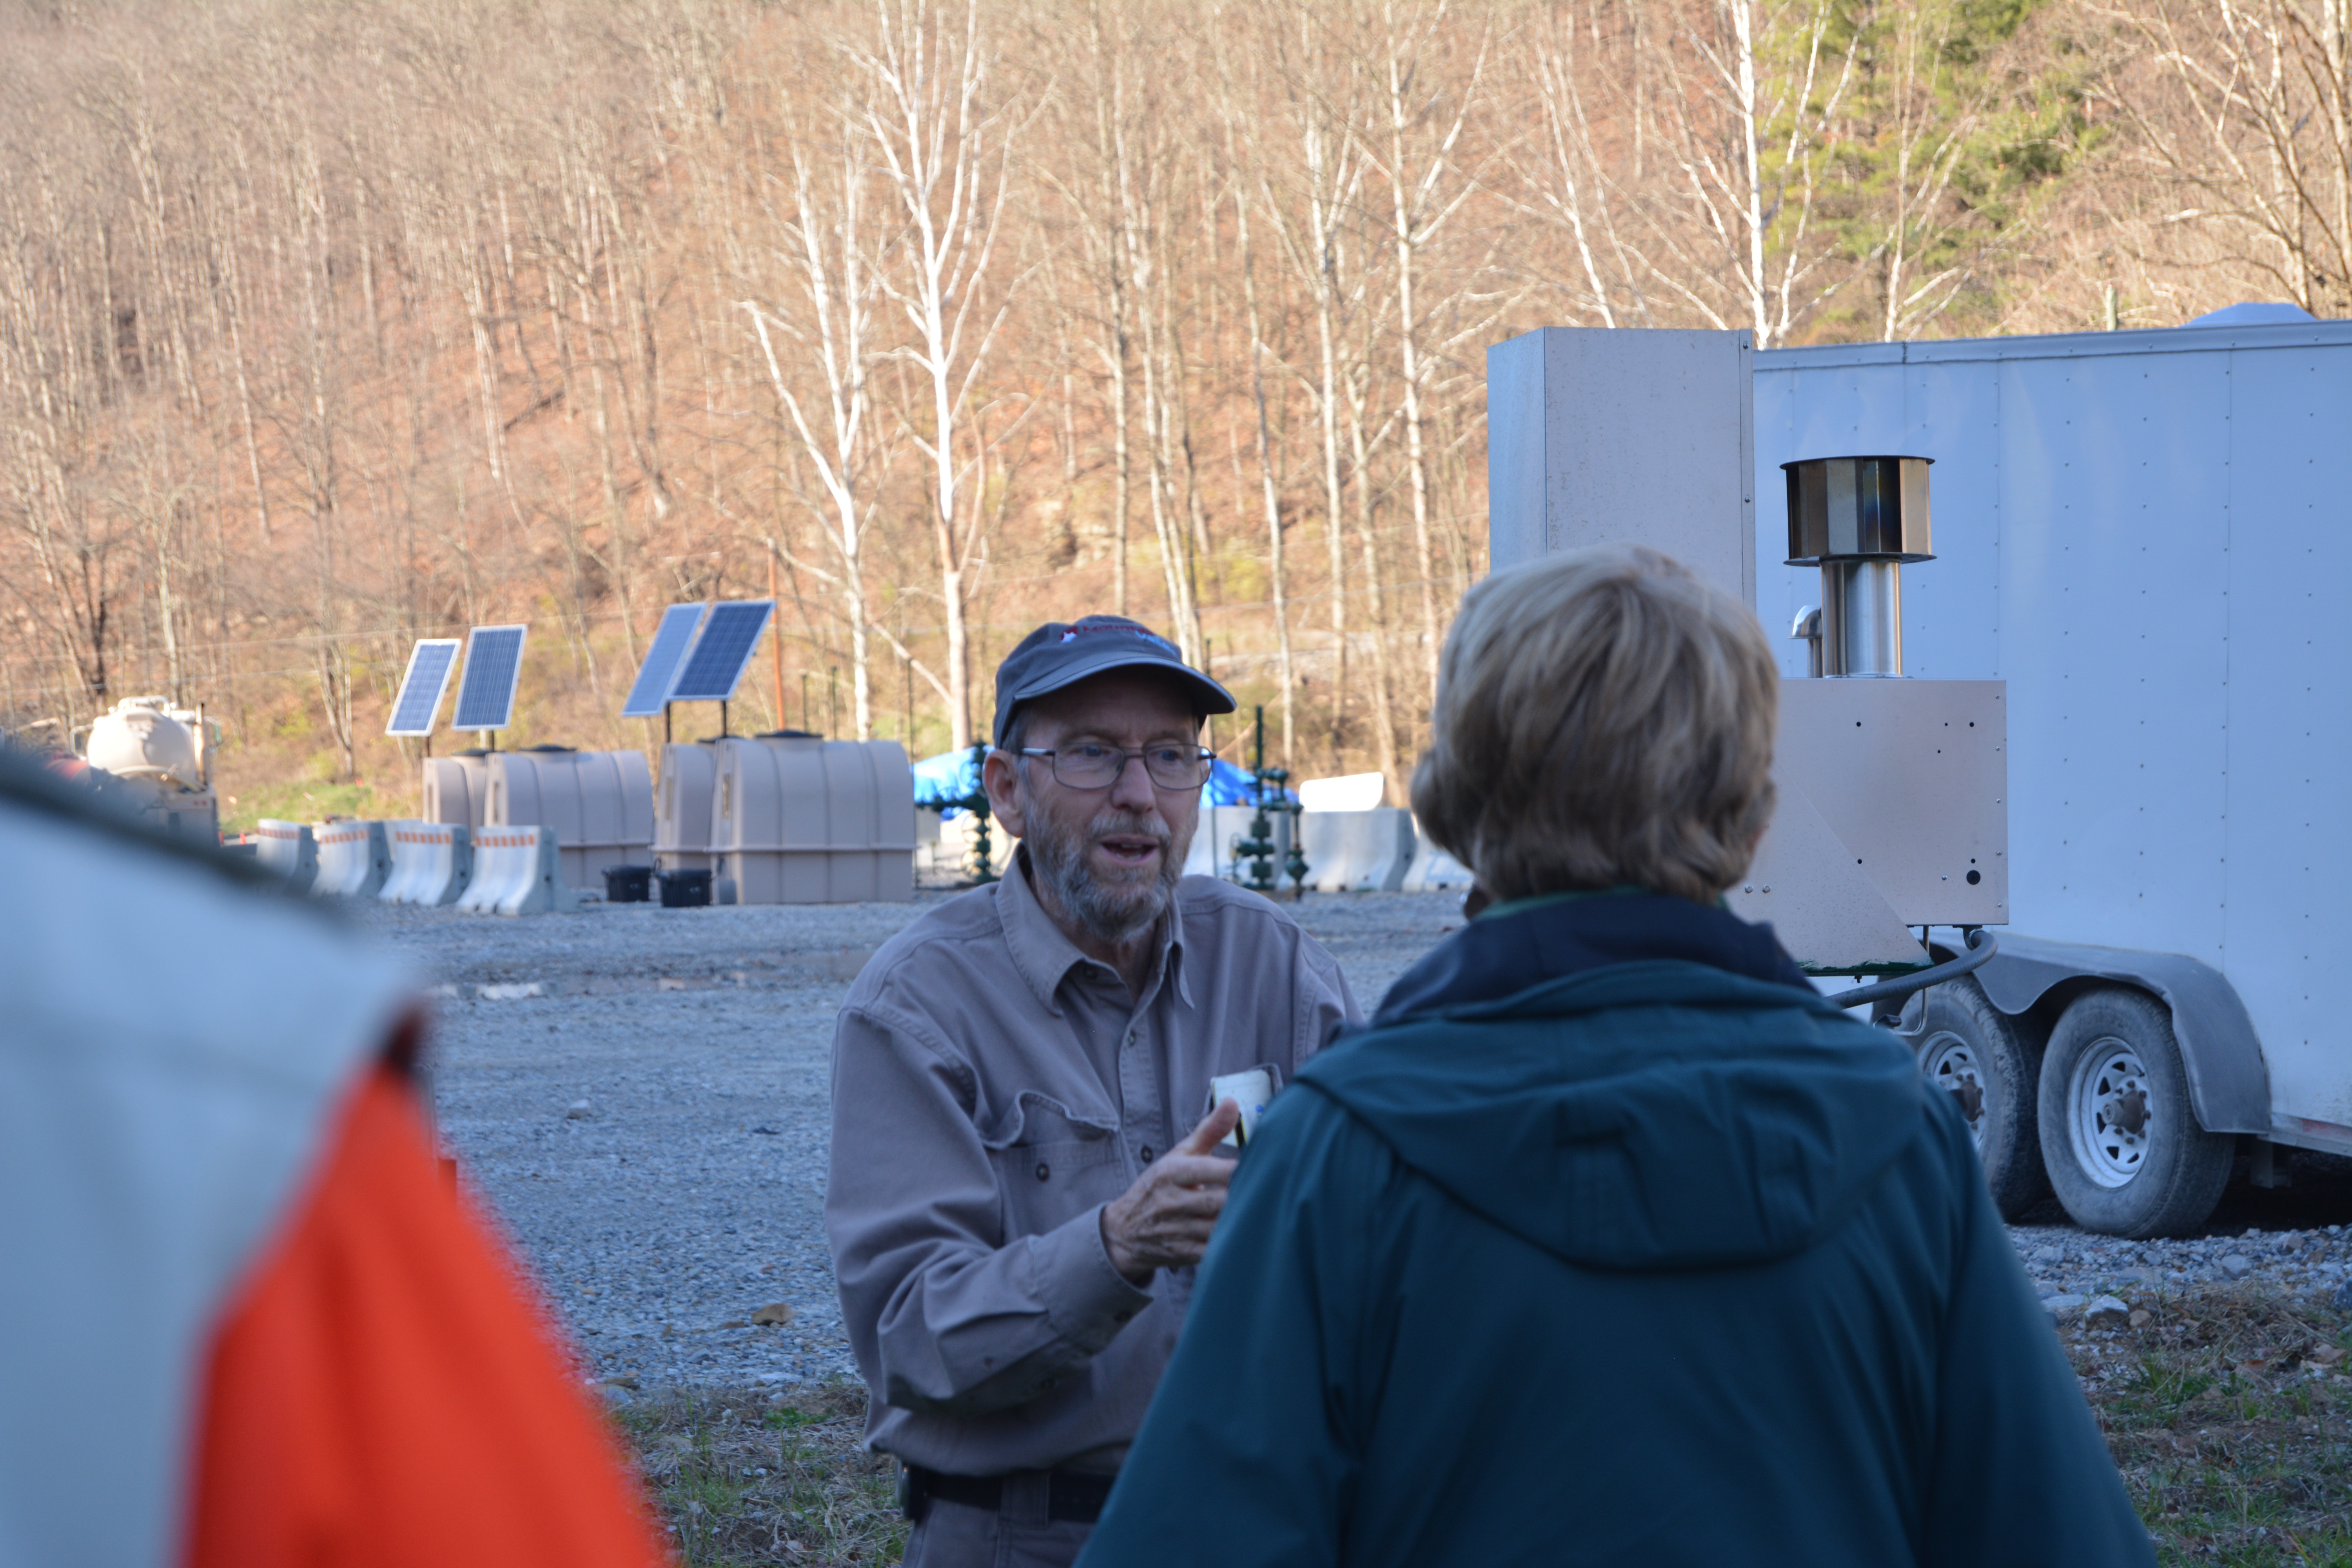
As many of you know, educating the public is a FracTracker Alliance core value – a passion, in fact. In addition to our maps and resources, we help to provide hands-on education, as well. The extraordinary Bill Hughes is a FracTracker partner who has spent decades “in the trenches” in West Virginia documenting fracking, well pad construction, water withdrawals, pipeline construction, accidents, spills, leaks, and various practices of the oil and gas industry. He regularly leads tours for college students, reporters, and other interested parties, showing them first-hand what these sites look, smell, and sound like.
While most of us have heard of fracking, few of us have seen it in action or how it has changed communities. The tours that Bill provides allow students and the like to experience in person what this kind of extraction means for the environment and for the residents who live near it.
Biking to Support FracTracker and Bill Hughes
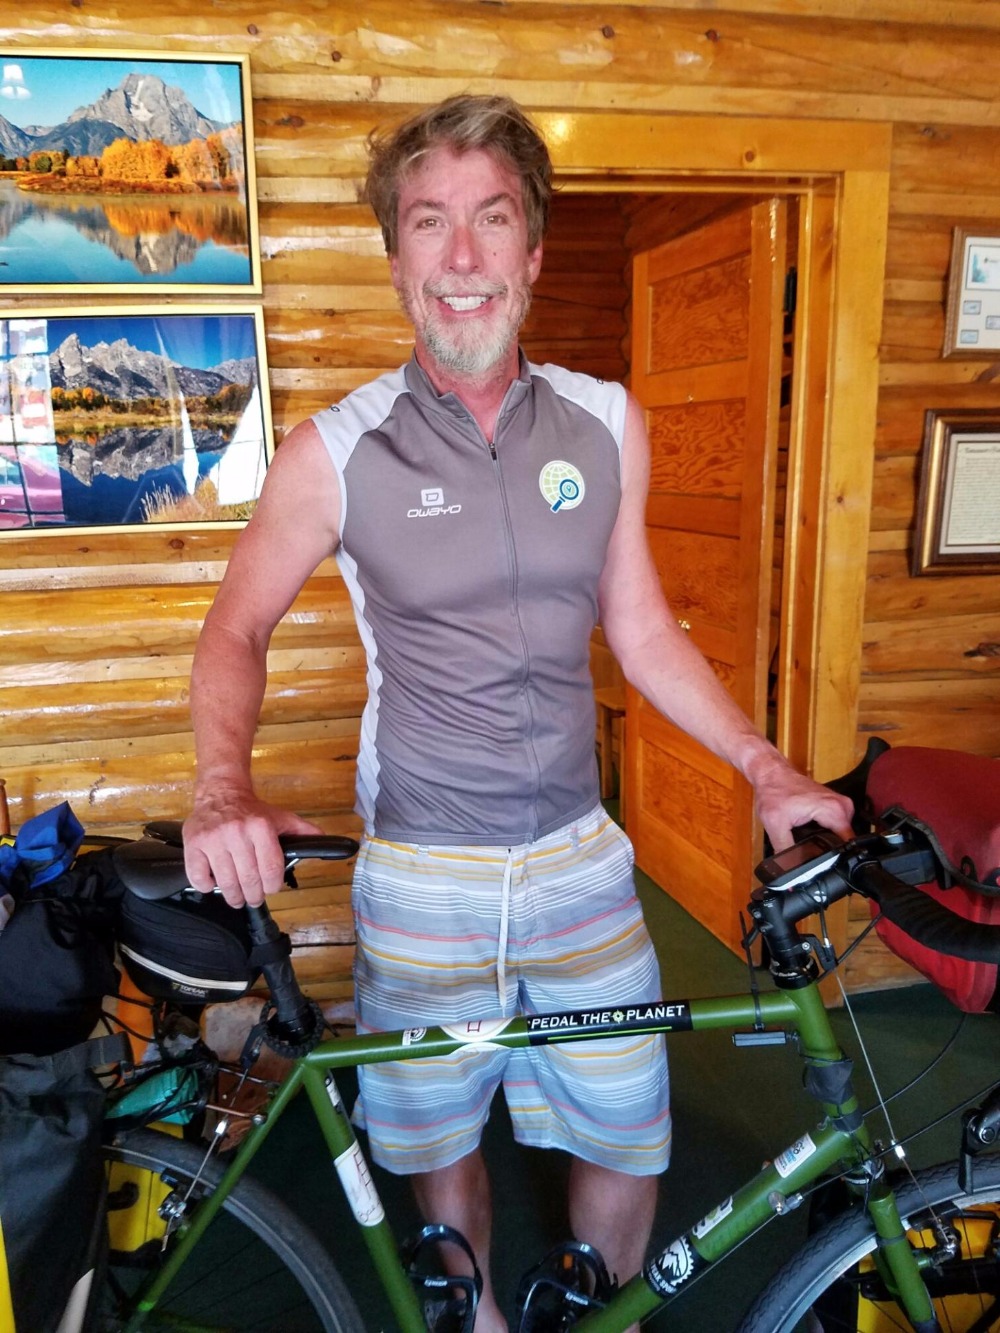
Dave Weyant at the start of his cross-country Pedal for the Planet bike trip
In the classic spirit of non-profit organizations, we work in partnership with others whenever possible. Right now, as you read this posting, another extraordinary Friend of FracTracker, Dave Weyant (a high school teacher in San Mateo, CA), is finishing his cross-country cycling tour – from Virginia to Oregon in 70 days.
Dave believes strongly in the power of teaching to reach the hearts of students and shape their thinking about complicated issues. As such, he has dedicated his journey to raising money for FracTracker. He set up a GoFundMe campaign in conjunction with his epic adventure, and he will donate whatever he raises toward Bill’s educational tours.
Help us celebrate Dave Weyant’s courage, vision, and generosity – and support Bill Hughes’s tireless efforts to open eyes, evoke awareness, and foster communication about fracking – by visiting Dave’s GoFundMe page and making a donation. Every gift of any size is most welcome and deeply appreciated.
100% of the funds raised from this campaign will go to support Bill’s oil and gas tours in West Virginia. FracTracker Alliance is a registered 501(c)3 organization. Your contribution is tax deductible.
And to those of you who have already donated, thank you very much for your support!
https://www.fractracker.org/a5ej20sjfwe/wp-content/uploads/2016/07/Hughes-Tour-Feature.jpg400900Guest Authorhttps://www.fractracker.org/a5ej20sjfwe/wp-content/uploads/2025/09/2025-Wordmark-Logo.pngGuest Author2016-07-27 10:30:012020-03-11 16:48:40A Cross-Country Ride to Support Oil and Gas Tours in West Virginia


