Tag Archive for: All

Woody Biomass & Waste-To-Energy

By Ted Auch, Great Lakes Program Coordinator, FracTracker Alliance

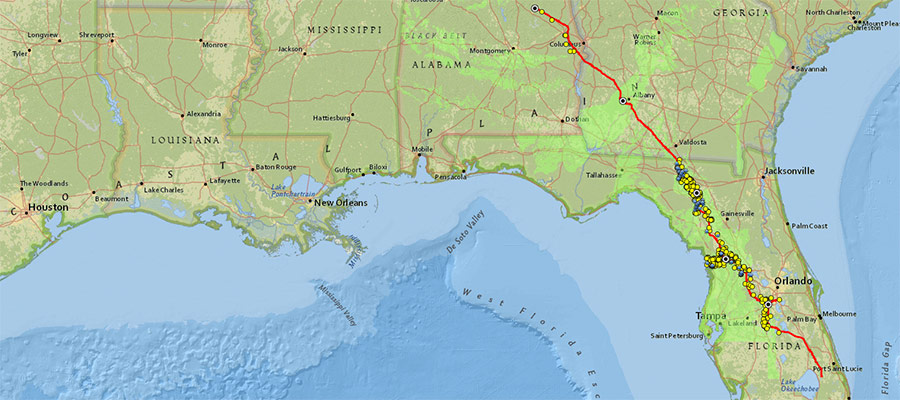
While solar and wind energy gets much of the attention in renewable energy debates, various states are also leaning more and more on burning biomass and waste to reach renewable energy targets and mandates. As is the case with all sources of energy, these so-called “renewable energy” projects present a unique set of environmental and socioeconomic justice issues, as well as environmental costs and benefits. In an effort to document the geography of these active and proposed future projects, this article offers some analysis and a new map of waste and woody biomass-to-energy infrastructure across the U.S. with the maximum capacities of each facility.


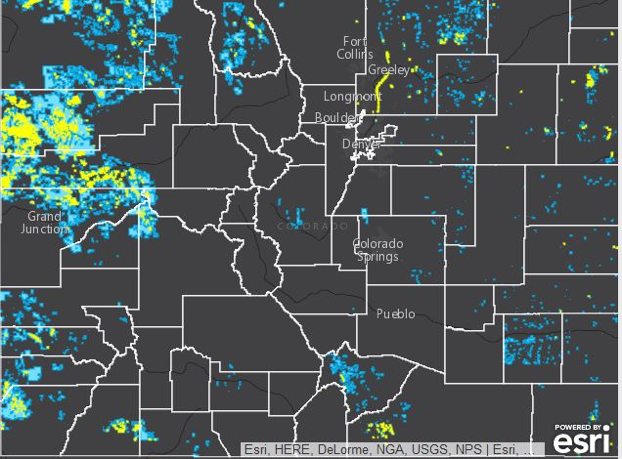
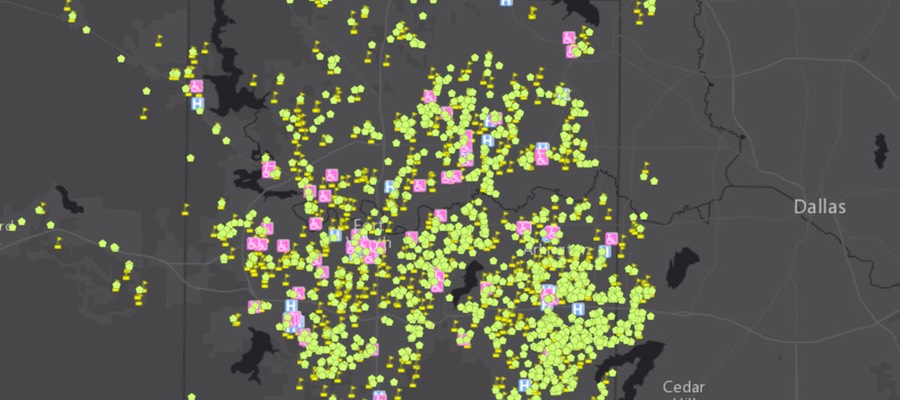
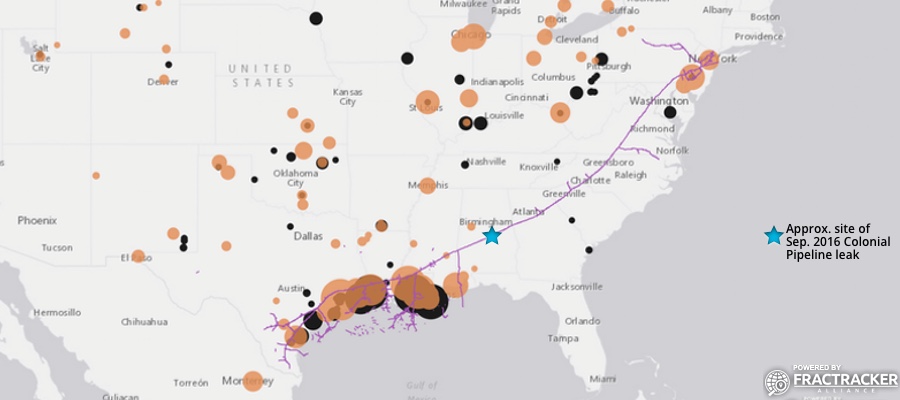
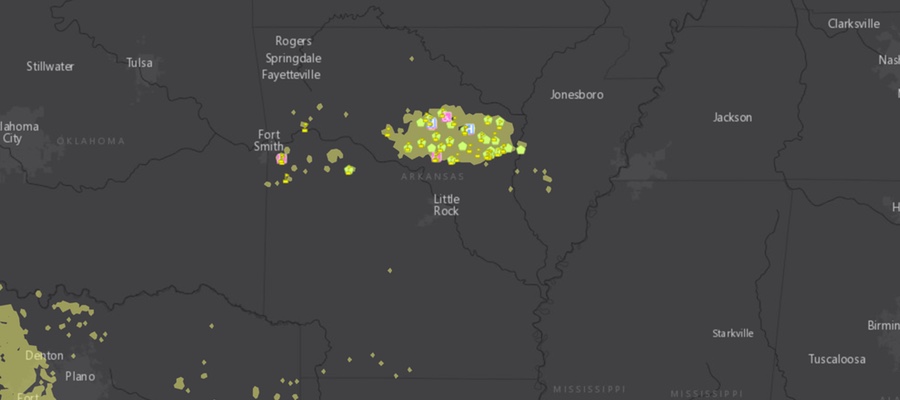
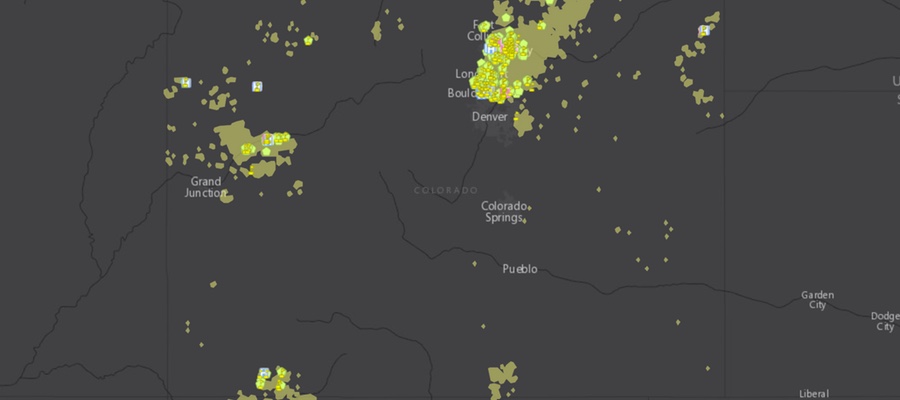
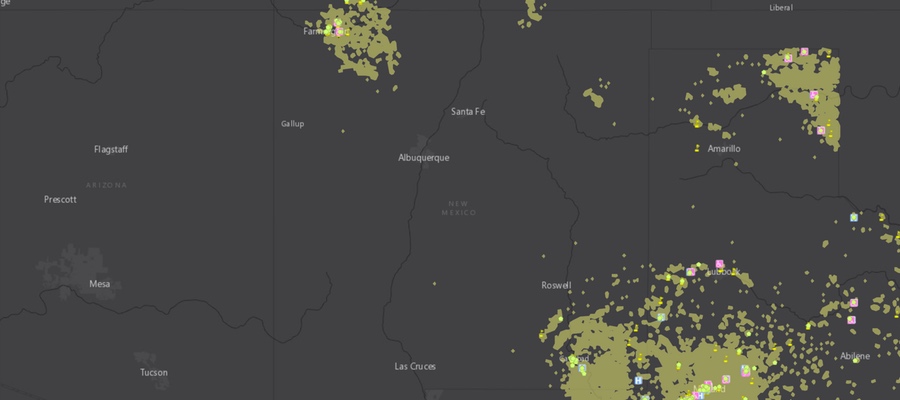
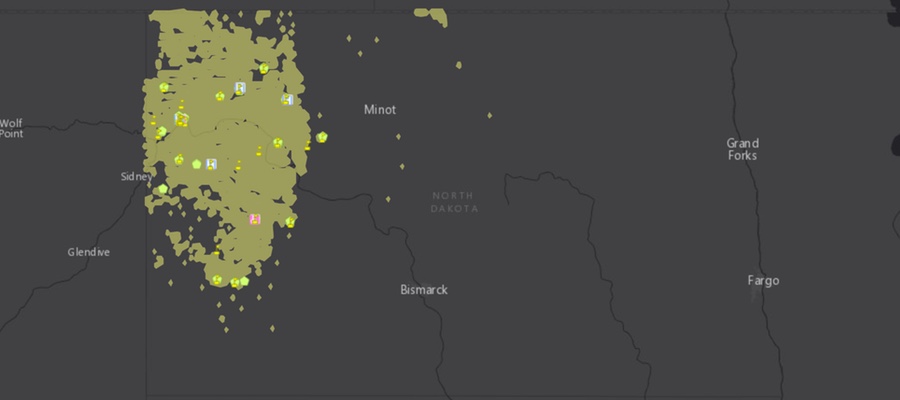
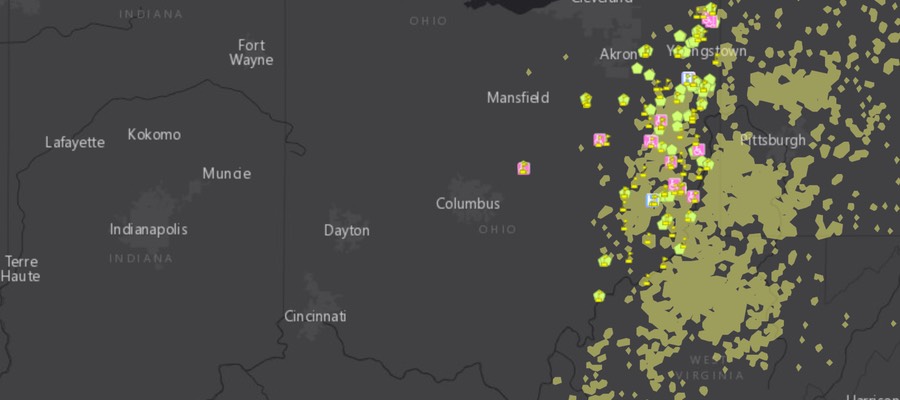
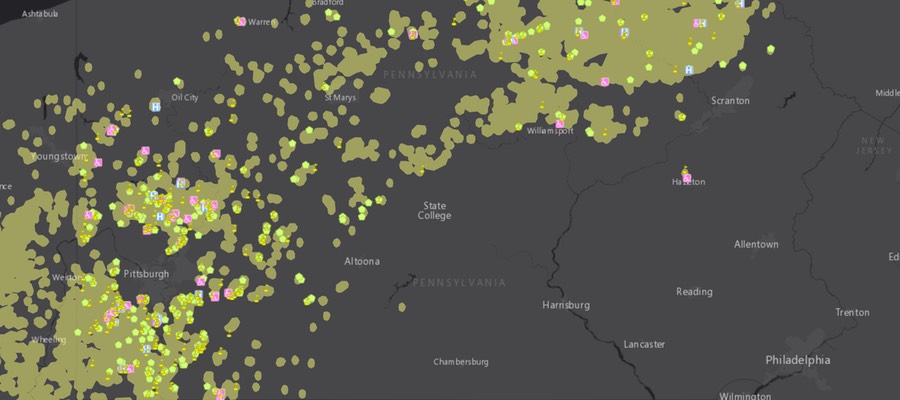
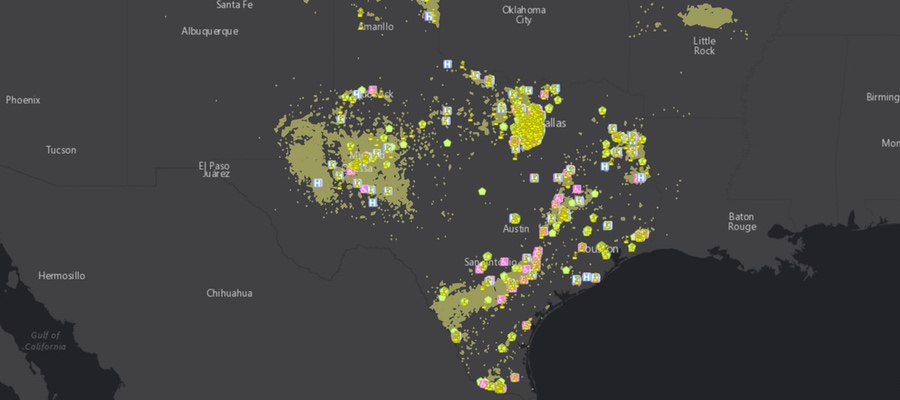
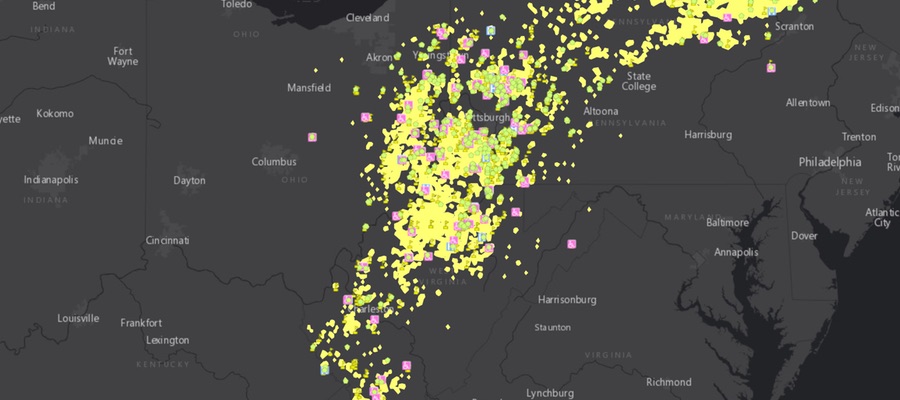
Map of U.S. Facilities Generating Energy from Biomass and Waste

View map full screen to see map legend, additional layers, and bookmarks
How FracTracker maps work

Woody Biomass-to-Energy

To illustrate the problems of woody biomass-to-energy projects, one only needs to look at Michigan. Michigan’s growing practice of generating energy from the wood biomass relies on ten facilities that currently produce roughly 209 Megawatts (an average of 21 MW per facility) from 1.86 million tons of wood biomass (an average of 309,167 tons per facility). Based on our initial analysis this is equivalent to 71% of the wood and paper waste produced in Michigan.

Making matters worse, these ten facilities rely disproportionately on clearcutting 60-120 years old late successional northern Michigan hardwood and red pine forests. These parcels are often replanted with red pine and grown in highly managed, homogeneous 20-30 year rotations. Reliance on this type of feedstock stands in sharp contrast to many biomass-to-energy facilities nationally, which tend to utilize woody waste from urban centers. Although, to provide context to their needs, the area of forest required to service Michigan’s 1.86 million-ton demand is roughly 920 mi2. This is 1.65 times the area of Chicago, Milwaukee, Detroit, Cleveland, Buffalo, and Toronto combined.


Panorama of the Sunset Trail Road 30 Acre Biomass Clearcut, Kalkaska Conty, Michigan


Based on an analysis of 128 U.S. facilities, the typical woody biomass energy facility produces 0.01-0.58 kW, or an average of 0.13 kW per ton of woody biomass. A few examples of facilities in Michigan include Grayling Generating Station, Grayling County (36.2 MW Capacity and 400,000 TPY), Viking Energy of McBain, Missaukee County (17 MW Capacity and 225,000 TPY), and Cadillac Renewable Energy, Wexford County (34 MW Capacity and 400,000 TPY).


The relationship between wood processed and energy generated across all U.S. landfill waste-to-energy operations is represented in the figure below (note: data was log transformed to generate this relationship).


Waste-To-Energy

Dr. Jim Stewart at the University of the West in Rosemead, California, recently summarized the Greenhouse Gas (GHG) costs of waste landfill energy projects and a recent collaboration between the Sierra Club and International Brotherhood of Teamsters explored the dangers of privatizing waste-to-energy given that two companies, Waste Management and Republic Services/Allied Waste, are now a duopoly controlling all remaining U.S. landfill capacity (an additional Landfill Gas Fact Sheet from Energy Justice can be found here).

Their combined analysis tells us that, by harnessing and combusting landfill methane, the current inventory of ninety-three U.S. waste-to-energy facilities generate 5.3 MW of electricity per facility. Expanded exploitation of existing landfills could bring an additional 500 MW online and alleviate 21.12 million metric tons of CO2 pollution (based on reduction in fugitive methane, a potent greenhouse gas). Looking at this capacity from a different angle, approximately 0.027 MW of electricity is generated per ton of waste processed, or 1.64 MW per acre. If we assume the average American produces 4.4 pounds of waste per day, we have the potential to produce roughly 6.9 million MW of energy from our annual waste outputs, or the equivalent energy demand created by 10.28 million Americans.


The relationship between waste processed per day and energy generated across all U.S. landfill waste-to-energy operations is represented in the figure below.


Conclusion

Waste burning and woody biomass-to-energy “renewable energy”projects come with their own sets of problems and benefits. FracTracker saw this firsthand when visiting Kalkaska County, Michigan, this past summer. There, the forestry industry has rebounded in response to several wood biomass-to-energy projects. While these projects may provide local economic opportunity, the industry has relied disproportionately on clearcutting, such as is seen in the below photograph of a 30-acre clearcut along Sunset Trail Road:


As states diversify their energy sources away from fossil fuels and seek to increase energy efficiency per unit of economic productivity, we will likely see more and more reliance on the above practices as “bridge fuel” energy sources. However, the term “renewable” needs parameterization in order to understand the true costs and benefits of the varying energy sources it presently encompasses. The sustainability of clearcutting practices in rural areas—and the analogous waste-to-energy projects in largely urban areas—deserves further scrutiny by forest health and other environmental experts. This will require additional mapping similar to what is offered in this article, as well as land-use analysis and the quantification of how these energy generation industries enhance or degrade ecosystem services. Of equal importance will be providing a better picture of whether or not these practices actually produce sustainable and well-paid jobs, as well as their water, waste, and land-use footprints relative to fossil fuels unconventional or otherwise.


Relevant Data

All US Waste-to-Energy Operations along with waste processed and energy produced (MW)

All US Woody Biomass-to-Energy Operations along with waste processed and energy produced (MW)

Sabal Pipeline Map

The Sabal Trail Pipeline: A Sinking Feeling

Construction is underway for a $3.2 billion, 515-mile-long interstate gas pipeline, running from central Alabama, through southwestern Georgia, and deep into Central Florida. The Sabal Trail Pipeline is a project of Duke Energy, NextEra Energy, and Spectra Energy. Spectra is the fossil fuel corporation responsible for other controversial pipelines also under construction – notably the Algonquin Incremental Market (AIM) Project. AIM, the target of ongoing protests in the Hudson Valley (NY) and elsewhere, would run from central New Jersey to ports in the Boston, MA area, passing within a few hundred feet of Indian Point Nuclear Power Plant on the Hudson River.

The Sabal Trail project is touted by Spectra to be crucial to aiding economic development along its route, and fueling gas-fired power generators in the Southeast United States. Environmentalists, however, view the project quite differently. Such development plans rarely come without a cost to communities, and to the environment.

A Unique Geology

Reflecting its geological origins as part of a shallow ancient ocean, the southeastern United States is underlain by porous limestone bedrock, known as karst. Water running through the karst bedrock flows not only through small pores, but often through extensive underground caves. When under under pressure, water can bubble up to the surface in a multitude of freshwater springs throughout the region. It’s not hard to imagine how contamination to the limestone aquifer in one area can spread rapidly and widely.

The karst bedrock, due to the sometimes large voids in its structure, is also prone to the formation of sinkholes, some of which are small; others are large enough to swallow whole buildings. Recognizing these risks, opponents of the Sabal Trail pipeline frequently cite the inherent danger of pipelines bending and rupturing should the ground beneath them give way, leading to potentially dangerous gas leakages or explosions.

One piece of recent research from the University of Georgia maps the prevalence of sinkholes in Doughterty County, GA, one of the many counties the Sabal Trail pipeline would pass through.  For reference, FracTracker has added the path of the pipeline to the Dougherty County map, above.

In the interactive map below, we show the full proposed pipeline route and associated compressor stations. Karst geology, documented sinkholes, and springs near the route of the pipeline are also shown. The double-arrows in the upper right corner of the map will launch a full-screen view of the map, including a map legend. Use the “Layers” dropdown along the top bar of that map to turn on locations of nearby schools and hospitals that could be impacted by a nearby pipeline emergency. In addition, a “Bookmarks” dropdown menu along the same top bar that will allow zooming to locations along the pipeline mentioned in this article.

Map of the proposed Sabal Trail pipeline route, karst geology, and known sinkholes

View map full screen | How FracTracker maps work

Growing Opposition

In October 2015, the United States Environmental Protection Agency (EPA) issued a scathing letter detailing the impacts that the proposed pipeline would have on the Floridan Aquifer, water quality, and ecology in this region of sensitive karst geology. Two months later, however, in mid-December, the EPA suddenly reversed its position. While reasons included an endorsement of industry’s choices to avoid “many of the most sensitive areas” that could be impacted, ABC News has suggested that political favoritism could have played a role, as well.  This video, published on November 24, 2016 by ABC/FirstCoast News, describes that situation, and also includes excellent footage of construction impacts.

Currently, the construction is proceeding. Federal Energy Regulatory Commission (FERC) has granted eminent domain to industry to build the project through seized private property. Although all federal permits for the pipeline construction are in place, a joint lawsuit filed by the Sierra Club, the Gulf Restoration Network, and Flint Riverkeeper has challenged that permitting process. There is opposition to the pipeline in Alabama, Georgia, and Florida–the three states in which construction is occurring.

The video clips below documents the noise associated with the pipeline’s construction, as well as views of the sinkhole terrain along its route.

Sabal Trail gas pipeline noise pollution at the Santa Fe River (Nov. 25, 2016).
Credit: Merrillee on Vimeo.

Sabal Trail gas transmission, at O’Brien (Hildreth) Compressor Station in Northern Florida.
Credit: Merrillee on Vimeo.

Water Protectors

As winter descends on the northern Plains, thousands of indigenous people representing hundreds of tribes, as well as non-Native allies, have gathered in camps near the Sioux Standing Rock Reservation to pray and protest the Dakota Access Pipeline (DAPL), which would drill an oil pipeline through sacred Native lands and under the Missouri River. Participants in this movement are united by the words “Water Is Life” (Mni Wiconi), in recognition of the threats that an oil spill would present to their homeland and the source of drinking water for the tribe. Hundreds of arrests of peaceful protesters have been made there in recent months, many resulting in serious injuries to the protesters as water cannons, rubber bullets, concussion grenades, and attack dogs have been used in efforts to intimidate the activists.

Coordination among First Nations groups against other fossil fuel infrastructure is happening elsewhere, too. For example, in September 2016, at least fifty US and Canadian aboriginal groups signed a treaty, saying they will work together to fight proposals that would bring crude oil from the Alberta tar sands via pipeline, tanker, and rail.

The protests against the Sabal Trail Project are similarly themed to those at Standing Rock, but have not resulted in violence towards protesters thus far. Along the Suwanee River in Florida, peaceful protesters have assembled at the Sacred Waters encampment and, on November 12, 2016, faced off with authorities in an effort to stop pipeline drilling under the Santa Fe River between Branford and Fort White, Florida.  14 people were arrested in that protest. Demonstrations at the site continue, with a dawn march and demonstration that began just after sunrise on November 26th. No arrests were made on that day. Another protest encampment, the Crystal Waters Camp, is also in place near Fort Drum, Florida, where observers noted hydrocarbon releases from the pipeline construction into Fort Drum Creek and destruction of wildlife by a pipeline crew. Still other protests about the potential environmental risks posed by the Sabal Trail have taken place recently in both Orlando and Live Oak, Florida.

Even in the phases of construction, environmentalists in Georgia discovered that the Sabal Trail pipeline had started leaking drilling mud from a pilot hole into the Withlacooche River in late October, and continued to ooze turbid mud for at least three weeks. Environmental advocates from the WWALS (the Withlacoochee, Alapaha, Little, and Upper Suwannee River) Watershed Coalition raised concerns that if a pilot hole could cause such a leakage, what could happen once full-scale directional drilling was occurring?

By Karen Edelstein, Eastern Program Coordinator

Updated Pipeline Incident Analysis

By Matt Kelso, Manager of Data & Technology

As massive new pipeline projects continue to generate news, the existing midstream infrastructure that’s hidden beneath our feet continues to be problematic on a daily basis. Since 2010, there have been 4,215 pipeline incidents resulting in 100 reported fatalities, 470 injuries, and property damage exceeding $3.4 billion.

Chart 1: Cumulative impacts pipeline incidents in the US. Data collected from PHMSA on November 4th, 2016. Operators are required to submit incident reports within 30 days.

Figure 1: Cumulative impacts pipeline incidents in the US. Data collected from PHMSA on November 4th, 2016. Operators are required to submit incident reports within 30 days.

In our previous analyses, pipeline incidents occurred at a rate of 1.6 per day nationwide, according to data from the Pipeline and Hazardous Materials Safety Administration (PHMSA). Rates exceeding 1.9 incidents per day in 2014 and 2015 have brought the average rate up to 1.7 incidents per day. Incidents have been a bit less frequent in 2016, coming in at a rate of 1.43 incidents per day, or 1.59 if we roll results back to October 4th in order to capture all incidents that are reported within the mandatory 30 day window.

Chart 1: Pipeline incidents per day for years between 2010 and 2016. Incidents after October 4, 2016 may not be included in these figures.

Figure 2: Pipeline incidents per day for years between 2010 and 2016. Incidents after October 4, 2016 may not be included in these figures.

These figures are the aggregation of three reports, namely natural gas transmission and gathering pipelines (828 incidents since 2010), natural gas distribution (736 incidents), and hazardous liquids (2,651 incidents). Not all of the hazardous liquids are petroleum related, but the vast majority are. 1,321 of the releases involved crude oil, and an additional 896 involved other liquid petroleum products, accounting for 84% of hazardous liquid incidents. The number could be higher, depending on the specific substances involved in the 399 highly volatile liquid (HVL) related incidents. The HVL category includes propane, butane, liquefied petroleum gases, ethylene, and propylene, as well as other volatile liquids that become gaseous at ambient conditions.

What is causing all of these pipeline incidents?

Figure 3: Cause of pipeline incidents for all reports received from January 1, 2010 through November 4, 2016.

Nonprofits, academics, and concerned citizens looking for accurate pipeline data will find that it is restricted, with the argument that releasing accurate pipeline data constitutes a threat to national security.  This makes little sense for several reasons. First, with over 2.4 million miles of pipelines, they are nearly omnipresent. Additionally, similar data access restrictions only apply to midstream infrastructure such as pipelines and compressor stations, whereas the locations for wells, refineries, and power plants are all publicly available, despite the presence of the same volatile hydrocarbons at these facilities. Additionally, pipelines are purposefully marked with surface placards to help prevent unintentionally impacting the infrastructure.

In fact, a quick look at the causes of pipeline incidents reveal that it it much more dangerous to not know where the pipelines are located. In the “Other Incident Cause” category (Figure 3) there are 152 incidents that were caused by unsuspecting motor vehicles. When this is combined with incidents resulting from excavation damage, we have 558 cases where “not knowing” about the pipeline’s location likely contributed to the failure. On the other hand, there are 14 incidents (only .003%) where the cause is identified as intentional. While even one case of tampering with pipeline infrastructure is unacceptable, PHMSA incident data indicate that obfuscated pipelines are 40 times more likely to cause a problem when compared to sabotage. Equipment failures and corrosion account for more than half of all incidents.

Where do these incidents occur?

PHMSA is not allowed to make accurate pipeline location data available for download, but such rules apparently do not apply to pipeline incidents. The following map shows the 4,215 pipeline releases since 2010, highlighting those that have resulted in injuries and fatalities.

Pipeline incidents in the US. Please zoom in to access specific incident data.  To see the legend and other tools, Please click here.


Pipeline Incidents by State for reports received 1/1/2010 through 11/4/2016.

Figure 4: Pipeline incidents by state for reports received 1/1/2010 through 11/4/2016.

While operators are required to submit the incident’s location as a part of their report to PHMSA, data entry errors are common in the dataset. The FracTracker Alliance has been able to identify and correct a few of the higher profile errors, such as the February 9, 2011 explosion in Allentown, PA, the report for which had mangled the latitude and longitude values so badly that the incident was rendered in Greenland. Other errors persist in the dataset, however. Since 2010, pipeline incidents have occurred in Washington, DC, Puerto Rico, and 49 states (the exception being Vermont). Ten states have at least 100 incidents apiece during the past six years (see Figure 4), and more than a quarter of all pipeline incidents in that time frame have occurred in Texas.

Which operators are responsible?

Figure 5: This table shows the ten operators with the most reported incidents, along with the length of their pipeline network.

Figure 5: This table shows the ten operators with the most reported incidents, along with the length of their pipeline network.

Altogether, there are 521 pipeline operators with reported releases, although many of these are affiliated with one another in some fashion. For example, the top two results in Figure 5 are almost certainly both subsidiaries of Enterprise Products Partners, L.P.

The real outlier in Figure 5, in terms of incidents per 100 miles, is Kinder Morgan Liquid Terminals; LLC. However, this is one of ten or more companies that share the Kinder Morgan name when reporting pipeline inventories. When taken in aggregate, companies with the Kinder Morgan name accounted for 142 incidents over a reported 7,939 miles, for a rate of 1.8 incidents per 100 miles. It should be noted that this, along with all of the statistics in Figure 5, are entirely based on matching the operator name between the incident and inventory reports.  Kinder Morgan’s webpage boasts of 84,000 miles of pipelines in the US — there are numerous possible explanations for the discrepancy in pipeline length, including additional Kinder Morgan subsidiaries, as well as whether gathering lines that aren’t considered to be mains are on both lists.

The operators responsible for the most deaths from pipeline incidents since 2010 include Pacific Gas & Electric (15), Washington Gas Light (9), and Consolidated Edison Co. of New York (8). Of course, the greatest variable in whether or not a pipeline explosion kills people or not is whether or not the incident happens in a populated location. In the course of this analysis, there were 230 explosions and 635 fires over 2,500 days, meaning that there is pipeline explosion somewhere in the United States every 11 days, on average, and a fire every fourth day. The fact that only 65 of the incidents resulted in fatalities indicates that we have been rather lucky with incidents in the midstream sector.

The Mississippi Fracking Fight: Saving Forests, Woodpeckers, and the Climate

By Wendy Park, senior attorney with the Center for Biological Diversity


If the Bureau of Land Management (BLM) gets its way, large areas of Mississippi’s Bienville and Homochitto national forests will be opened up to destructive fracking. This would harm one of the last strongholds for the rare and beautiful red-cockaded woodpecker, create a new source of climate pollution, and fragment our public forests with roads, drilling pads and industrial equipment. That’s why we’re fighting back.

My colleagues and I at the Center for Biological Diversity believe that all species, great and small, must be preserved to ensure a healthy and diverse planet. Through science, law and media, we defend endangered animals and plants, and the land air, water, and climate they need. As an attorney with the Center’s Public Lands Program, I am helping to grow the “Keep It in the Ground” movement, calling on President Obama to halt new leases on federal lands for fracking, mining, and drilling that only benefit private corporations.

That step, which the president can take without congressional approval, would align U.S. energy policies with its climate goals and keep up to 450 billion tons of greenhouse gas pollution from entering the atmosphere. Already leased federal fossil fuels will last far beyond the point when the world will exceed the carbon pollution limits set out in the Paris Agreement, which seeks to limit warming to 1.5 °C above pre-industrial levels. That limit is expected to be exceeded in a little over four years. We simply cannot afford any more new leases.

Fracking Will Threaten Prime Woodpecker Habitat

In Mississippi, our concerns over the impact of fracking on the rare red-cockaded woodpecker and other species led us to administratively protest the proposed BLM auction of more than 4,200 acres of public land for oil and gas leases the Homochitto and Bienville national forests. The red-cockaded woodpecker is already in trouble. Loss of habitat and other pressures have shrunk its population to about 1% of its historic levels, or roughly 12,000 birds. In approving the auction of leases to oil and gas companies, BLM failed to meet its obligation to protect these and other species by relying on outdated forest plans, ignoring the impact of habitat fragmentation, not considering the effects of fracking on the woodpecker, and ignoring the potential greenhouse gas emissions from oil and gas taken from these public lands. The public was also not adequately notified of BLM’s plans.


Mississippi National Forests, Potential BLM Oil & Gas Leasing Parcels, and Red Cockaded Woodpecker Sightings


View map fullscreenHow FracTracker maps work

Fracking Consequences Ignored

According to the National Forest Service’s 2014 Forest Plan Environmental Impact Statement, core populations of the red-cockaded woodpecker live in both the Bienville and Homochitto national forests, which provide some of the most important habitat for the species in the state. The Bienville district contains the state’s largest population of these birds and is largely untouched by oil and gas development. The current woodpecker population is far below the target set by the U.S. Fish and Wildlife Service’s recovery plan. A healthy and fully recovered population will require large areas of mature forest. But the destruction of habitat caused by clearing land for drilling pads, roads, and pipelines will fragment the forest, undermining the species’ survival and recovery.

red-cockaded_woodpecker_insertNew leasing will likely result in hydraulic fracturing and horizontal drilling. In their environmental reviews, BLM and the Forest Service entirely ignore the potential for hydraulic fracturing and horizontal drilling to be used in the Bienville and Homochitto national forests and their effects on the red-cockaded woodpecker. Fracking would have far worse environmental consequences than conventional drilling. Effects include increased pollution from larger rigs; risks of spills and contamination from transporting fracking chemicals and storing at the well pad; concentrated air pollution from housing multiple wells on a single well pad; greater waste generation; increased risks of endocrine disruption, birth defects, and cardiology hospitalization; and the risk of earthquakes caused by wastewater injection and the hydraulic fracturing process (as is evident in recent earthquakes in Oklahoma and other heavily fracked areas).

Greenhouse Gas Emissions and Climate Change

Oil and gas development also results in significant greenhouse gas emissions from construction, operating fossil-fuel powered equipment during production, reclamation, transportation, processing and refining, and combustion of the extracted product. But BLM and the Forest Service have refused to analyze potential emissions or climate change effects from new leasing. Climate change is expected to worsen conditions for the woodpecker, compounding the harms of destructive drilling practices. Extreme weather events will become more frequent in the Southeast U.S. as temperatures rise. Hurricane Katrina resulted in significant losses of woodpecker habitat and birds in the Mississippi national forests. The Forest Service should be redoubling its efforts to restore and preserve habitat, but instead it is turning a blind eye to climate change threats.

At a time when world leaders are meeting in Morocco to discuss the climate crisis and scientists tell us we already have enough oil and gas fields operating to push us past dangerous warming thresholds, it’s deeply disturbing that the Obama administration continues to push for even more oil and gas leases on America’s public lands. The BLM’s refusal to acknowledge and analyze the effects of fracking on the climate, at-risk species, and their habitat, is not only inexcusable it is illegal. The science is clear: The best way to address catastrophic warming — and protect wildlife — is to keep fossil fuels in the ground.

Photographs for this article were sourced from the U.S. Department of Agriculture fair-use photostream.

Oil and gas production on public lands

Interactive maps show nearness of oil and gas wells to communities in 5 states

As an American, you are part owner of 640 million acres of our nation’s shared public lands managed by the federal government. And chances are, you’ve enjoyed a few of these lands on family picnics, weekend hikes or summer camping trips. But did you know that some of your lands may also be leading to toxic air pollution and poor health for you or your neighbors, especially in 5 western states that have high oil and gas drilling activity?

A set of new interactive maps created by FracTracker, The Wilderness Society, and partner groups show the threatened populations who live within a half mile of  federal oil and gas wells – people who may be breathing in toxic pollution on a regular basis.

Altogether, air pollution from oil and gas development on public lands threatens at least 73,900 people in the 5 western states we examined. The states, all of which are heavy oil and gas leasing areas, include ColoradoNew MexicoNorth DakotaUtah and Wyoming.

Close up of threat map in Colorado

Figure 1. Close up of threat map in Colorado

In each state, the data show populations living near heavy concentrations of wells. For example just northeast of Denver, Colorado, in the heavily populated Weld County, at least 11,000 people are threatened by oil and gas development on public lands (Figure 1).

Western cities, like Farmington, New Mexico; Gillette, Wyoming; and Grand Junction, Colorado are at highest risk of exposure from air pollution. In New Mexico, especially, concentrated oil and gas activity disproportionately affects the disadvantaged and minorities. Many wells can be found near population centers, neighborhoods and even schools.

Colorado: Wells concentrated on Western Slope, Front Range

Note: The threatened population in states are a conservative estimate. It is likely that the numbers affected by air pollution are higher.

In 2014, Colorado became the first state in the nation to try to curb methane pollution from oil and gas operations through comprehensive regulations that included inspections of oil and gas operations and an upgrade in oil and gas infrastructure technology. Colorado’s new regulations are already showing both environmental and financial benefits.

But nearly 16,000 people – the majority living in the northwestern and northeastern part of the state – are still threatened by pollution from oil and gas on public lands.

Many of the people whose health is endangered from pollution are concentrated in the fossil-fuel rich area of the Western Slope, near Grand Junction. In that area, three counties make up 65% of the total area in Colorado threatened by oil and gas development.

In Weld County, just northeast of Denver, more than 11,000 residents are threatened by air pollution from oil and gas production on federal lands. But what’s even more alarming is that five schools are within a half mile radius of wells, putting children at risk on a daily basis of breathing in toxins that are known to increase asthma attacks. Recent studies have shown children miss 500,000 days of school nationally each year due to smog related to oil and gas production.

State regulations in Colorado have helped improve air quality, reduce methane emissions and promote worker care and safety in the past two years, but federal regulations expected by the end of 2016 will have a broader impact by regulating pollution from all states.

New Mexico: Pollution seen from space threatens 50,000 people

With more than 30,000 wells covering 4.6 million acres, New Mexico is one of the top states for oil and gas wells on public lands. Emissions from oil and gas infrastructure in the Four Corners region are so great, they have formed a methane hot spot that has been extensively studied by NASA and is clearly visible from space.

Nearly 50,000 people in northwestern New Mexico – 40% of the population in San Juan County – live within a half mile of a well. 

Dangerous emissions from those wells in San Juan County disproportionately affect minorities and disadvantaged populations, with about 20% Hispanic, almost 40% Native American, and over 20% living in poverty.

Another hot spot of oil and activity is in southeastern New Mexico stretching from the lands surrounding Roswell to the southern border with Texas. Wells in this region also cover the lands outside of Carlsbad Caverns National Park, potentially affecting the air quality and visibility for park visitors. Although less densely populated, another 4,000 people in two counties – with around 50% of the population Hispanic – are threatened by toxic air pollution.

Wyoming: Oil and gas emissions add to coal mining pollution

Pollution from oil and gas development in Wyoming, which has about as many wells as New Mexico, is focused in the Powder River Basin. This region in the northeast of the state provides 40% of the coal produced in the United States.

Oil and gas pollution threatens approximately 4,000 people in this region where scarred landscapes and polluted waterways are also prevalent from coal mining. 

With the Obama administration’s current pause on federal coal leasing and a review of the federal coal program underway, stopping pollution from oil and gas on public lands in Wyoming would be a major step in achieving climate goals and preserving the health of local communities.

Utah: Air quality far below federal standards

Utah has almost 9,000 active wells on public lands. Oil and gas activity in Utah has created air quality below federal standards in one-third of Utah’s counties, heightening the risk of asthma and respiratory illnesses. Especially in the Uintah Basin in northeastern Utah – where the majority of oil and development occurs – a 2014 NOAA-led study found oil and gas activity can lead to high levels of ozone in the wintertime that exceed federal standards.

North Dakota: Dark skies threatened by oil and gas activity

The geology of western North Dakota includes the Bakken Formation, one of the largest deposits of oil and gas in the United States. As a result, high oil and gas production occurs on both private and public lands in the western part of the state.

Nearly 650 wells on public lands are clustered together here, directly impacting popular recreational lands like Theodore Roosevelt National Park.

The 70,000-plus-acre park – named after our president who first visited in 1883 and fell in love with the incredible western landscape – is completely surrounded by high oil and gas activity. Although drilling is not allowed in the park, nearby private and public lands are filled with active wells, producing pollution, traffic and noise that can be experienced from the park. Due to its remote location, the park is known for its incredible night sky, but oil and gas development increases air and light pollution, threatening visibility of the Milky Way and other astronomical wonders.

You own public lands, but they may be hurting you

Pollution from oil and gas wells on public lands is only a part of a larger problem. Toxic emissions from oil and gas development on both public and private lands threaten 12.4 million people living within a half mile of wells, according to an oil and gas threat map created by FracTracker for a project by Earthworks and the Clean Air Task Force.

Now that we can see how many thousands of people are threatened by harmful emissions from our public lands, it is more important than ever that we finalize strong federal regulations that will help curb the main pollutant of natural gas – methane – from being leaked, vented, and flared from oil and gas infrastructure on public lands.

Federal oil and gas wells in western states produce unseen pollution that threatens populations at least a half mile away. Photo: WildEarth Guardians, flickr.

Federal oil and gas wells in western states produce unseen pollution that threatens populations at least a half mile away. Photo: WildEarth Guardians, flickr.

We need to clean up our air now

With U.S. public lands accounting for 1/5 of the greenhouse gas footprint in the United States, we need better regulations to reduce polluting methane emissions from the 96,000 active oil and gas wells on public lands.

Right now, the Bureau of Land Management is finalizing federal regulations that are expected by the end of 2016. These regulations are expected to curb emissions from existing sources – wells already in production – that are a significant source of methane pollution on public lands. This is crucial, since by 2018, it is estimated that nearly 90% of methane emissions will come from sources that existed in 2011.

Federal regulations by the BLM should also help decrease the risk to communities living near oil and gas wells and helping cut methane emissions by 40 to 45% by 2025 to meet climate change reduction goals.

Final regulations from the Bureau of Land Management will also add to other regulations from the EPA and guidance from the Obama administration to modernize energy development on public lands for the benefit of the American people, landscapes and the climate. In the face of a changing climate, we need to continue to monitor fossil fuel development on public lands and continue to push the government towards better protections for land, air, wildlife and local communities.


By The Wilderness Society – The Wilderness Society is the leading conservation organization working to protect wilderness and inspire Americans to care for our wild places. Founded in 1935, and now with more than 700,000 members and supporters, The Wilderness Society has led the effort to permanently protect 109 million acres of wilderness and to ensure sound management of our shared national lands.

Photo by David Nix 2015

Documenting Oil and Gas Industry Damage in North Dakota

North Dakota is now in its third oil boom due to the drilling technologies of horizontal drilling and hydraulic fracturing that have made once-inaccessible oil accessible. The Bakken formation covers western North Dakota, eastern Montana, and parts of Manitoba and Saskatchewan. At the height of the boom in 2014, just under 12,000 wells were active across the west, extracting 1.1 million barrels (bbl) of oil per day and flaring at 32%. The boom has bumped North Dakota to the second largest oil and gas producing state, second only to Texas.

Dakota Resource Council (DRC) is a member-led, grassroots organization that has been working in extraction-impacted communities in North Dakota since 1978. DRC’s members work on oil and gas campaigns that aim to eliminate impacts to land, air, water, and livelihoods of the citizens of North Dakota. Campaign issues on oil and gas industry damage include: flaring, pipelines, radioactive/oilfield waste, state accountability, and oil-by-rail.

The following photos from DRC show impacts of current and legacy oil and gas extraction in western North Dakota – an area in the heart of the Bakken that is historically a rich agricultural and ranching region. The vast contrast between the two industries are not complementary.

Bear Den Bay Incident

Fort Berthold Indian Reservation is the epicenter of fracking in the Bakken. On July 8, 2014 a wastewater pipeline rupture was accidentally discovered in rural Mandaree on the reservation. The pipeline is owned by Crestwood Midstream, LLC – a Texas-based company.

An estimated 1 million gallons of toxic saltwater ran down a ravine, ending up in the tributary of Bear Den Bay, which is located ¼ mile from the city of Mandaree’s water intake. The spill was contained, but the state doesn’t know exactly how much waste went into the bay. Tribal administration released a statement that beaver dams prevented the fluids from reaching the lake.

Weeks after the incident Crestwood released a statement saying:

… while assessment of the effect is ongoing, examination and testing to date show that an area of grass, brush and trees about 200 yards long sustained damage. Some produced water ran down a ravine into natural pools in a small stream at the bottom, but it appears that the produced water stopped there… The impact on fish and wildlife appears to have been minimal, in fact beavers, turtles, frogs, deer and pelicans have been seen returning to and re-inhabiting the impacted area.

To date, there has been no penalty for the damage that has been done to the land and reclamation is ongoing. Below are photos documenting the incident’s effects:

The Legacy of North Dakota Oil Booms

Western North Dakota has weathered through two previous oil booms in the early 1950’s and 1980’s. Previous booms left behind infrastructure that sits abandoned today. Due to hydraulic fracking technology, once-inaccessible oil is now accessible. These pre-existing wells are called legacy wells, that produce roughly 5% of North Dakota’s 1.2 million barrels per day.

Much of these wells contain infrastructure that has been in place for over 60 years. Pipelines have not been mapped or regulated in North Dakota until recently. Farmers are finding underground tanks and pipelines filled with toxic sludge. Just like previous oil booms, North Dakota was not prepared for the cost of extraction. Scroll through the following gallery showing a variety of legacy sites in ND.


By Nicole Donaghy, Dakota Resource Council

Brook Lenker, Executive Director, FracTracker

Staff Spotlight: Brook Lenker

As the last article in our staff spotlight series, learn more about Executive Director, Brook Lenker, and how his early environmental work in Pennsylvania brought him to FracTracker Alliance.

Time with FracTracker: 5 years

Education: I graduated from Towson University near Baltimore in 1989 with a degree in geography and environmental planning. I loved the course of study so much that I enrolled in the graduate school and worked on my master’s degree in the same field.

Office Location: Camp Hill, PA

Title: Executive Director

What do you actually do in that role?

From my office in Camp Hill, I lead a wonderful, talented team of eight staff working from five locations around the country. My role is to make sure FracTracker has the strategic direction, staff capacity, financial resources, and board leadership to be effective, impactful.

Previous Positions and Organizations

YBWA cleanup 2013 Brook on creek

Brook during a creek cleanup

While I was evening commuting to Maryland, I served as program director for a county recreation department in Central Pennsylvania. Later, I landed a position with the Alliance for the Chesapeake Bay, eventually becoming the Director of Watershed Stewardship. The activities we coordinated – river sojourns, stream and habitat restoration, stormwater education, and more – took me around the multi-state watershed even though I was based in Harrisburg.

My next stop was the Pennsylvania Department of Conservation and Natural Resources where for over seven years I served as the Manager of Education and Outreach. My responsibilities included community relations and promoting ecological awareness and stewardship. A program called iConservePA was a focal point. My colleagues and I used creative communications strategies to encourage Pennsylvanians to “Take Conservation Personally.” This and other agency initiatives suffered when fracking began to boom.

How did you first get involved working on oil and gas issues / fracking?

As I became demoralized by the degradation I witnessed and read about, I was given the chance to direct FracTracker. I took the reins in late 2011 as the website transitioned out of the University of Pittsburgh. By the summer of 2012, we formed the nonprofit FracTracker Alliance, and I became its executive director. Sometimes things happen for a reason.

It’s hard to believe I’ve been at the helm of FracTracker for nearly five years. Knowing that we’re a helpful force in the fight against the harms of extraction is rewarding. The projects and the people with whom I interact are inspiring. While the challenges facing our planet are daunting and, at times, depressing, I’m lucky to be able to exercise my convictions in the workplace.

What is one of the most impactful projects that you have been involved in with FracTracker?

Brook Lenker in Argentina

Brook Lenker in Argentina

It’s been an unforgettable journey so far. I’ve learned so much and met so many great people – from different states and different countries. Perhaps my greatest experience to date was a tour to Argentina in May 2015. Alongside reps from Ecologic Institute and Earthworks, we presented to hundreds of people at different venues including the senate of Argentina. As I spoke of the insights of FracTracker and other researchers, an interpreter put my words into Spanish. I felt overwhelmingly humble and grateful.

Environmental injustice knows no bounds, but good people everywhere make a profound difference.

Screenshot from Vulnerable Populations Map

Sensitive Receptors near Fracked Oil & Gas Wells

EnvironmentAmerica_reportcover

Cover of Dangerous and Close report. Click to view report

FracTracker Alliance has been working with the Frontier Group and Environment America on a nationwide assessment of “fracked” oil and gas wells. The report is titled Dangerous and Close, Fracking Puts the Nation’s Most Vulnerable People at Risk. The assessment analyzed the locations of fracked wells and identified where the fracking has occurred near locations where sensitive populations are commonly located. These sensitive sites include schools and daycare facilities because they house children, hospitals because the sick are not able to fight off pollution as effectively, and nursing homes where the elderly need and deserve clean environments so that they can be healthy, as well. The analysis used data on fracked wells from regulatory agencies and FracFocus in nine states. Maps of these nine states, as well as a full national map are shown below.

No one deserves to suffer the environmental degradation that can accompany oil and gas development – particularly “fracking” – in their neighborhoods. Fracked oil and gas wells are shown to have contaminated drinking water, degrade air quality, and sicken both aquatic and terrestrial ecosystems. Additionally, everybody responds differently to environmental pollutants, and some people are much more sensitive than others. In fact, certain sects of the population are known to be more sensitive in general, and exposure to pollution is much more dangerous for them. These communities and populations need to be protected from the burdens of industries, such as fracking for oil and gas, that have a negative effect on their environment. Commonly identified sensitive groups or “receptors” include children, the immuno-compromised and ill, and the elderly.  These groups are the focus of this new research.


National Map

National interactive map of sensitive receptors near fracked wells


View Map Fullscreen | How Our Maps Work

State-By-State Maps in Dangerous and Close Report

Click to view interactive maps associated with each state

Colonial Pipeline and site of Sept 2016 leak in Alabama

A Proper Picture of the Colonial Pipeline’s Past

On September 9, 2016 a pipeline leak was detected from the Colonial Pipeline by a mine inspector in Shelby County, Alabama. It is estimated to have spilled ~336,000 gallons of gasoline, resulting in the shutdown of a major part of America’s gasoline distribution system. As such, we thought it timely to provide some data and a map on the Colonial Pipeline Project.

Figure 1. Dynamic map of Colonial Pipeline route and related infrastructure

View Map Fullscreen | How Our Maps Work | The Sept. 2016 leak occurred in Shelby County, Alabama

Pipeline History

The Colonial Pipeline was built in 1963, with some segments dating back to at least 1954. Colonial carries gasoline and other refined petroleum projects throughout the South and Eastern U.S. – originating at Houston, Texas and terminating at the Port of New York and New Jersey. This ~5,000-mile pipeline travels through 12 states and the Gulf of Mexico at one point. According to available data, prior to the September 2016 incident for which the cause is still not known, roughly 113,382 gallons had been released from the Colonial Pipeline in 125 separate incidents since 2010 (Table 1).

Table 1. Reported Colonial Pipeline incident impacts by state, between 3/24/10 and 7/25/16

State Incidents (#) Barrels* Released Total Cost ($)
AL 10 91.49 2,718,683
GA 11 132.38 1,283,406
LA 23 86.05 1,002,379
MD 6 4.43 27,862
MS 6 27.36 299,738
NC 15 382.76 3,453,298
NJ 7 7.81 255,124
NY 2 27.71 88,426
PA 1 0.88 28,075
SC 9 1639.26 4,779,536
TN 2 90.2 1,326,300
TX 19 74.34 1,398,513
VA 14 134.89 15,153,471
Total** 125 2699.56 31,814,811
*1 Barrel = 42 U.S. Gallons

** The total amount of petroleum products spilled from the Colonial Pipeline in this time frame equates to roughly 113,382 gallons. This figure does not include the September 2016 spill of ~336,000 gallons.

Data source: PHMSA

Unfortunately, the Colonial Pipeline has also been the source of South Carolina’s largest pipeline spill. The incident occurred in 1996 near Fork Shoals, South Carolina and spilled nearly 1 million gallons of fuel into the Reedy River. The September 2016 spill has not reached any major waterways or protected ecological areas, to-date.

Additional Details

Owners of the pipeline include Koch Industries, South Korea’s National Pension Service and Kohlberg Kravis Roberts, Caisse de dépôt et placement du Québec, Royal Dutch Shell, and Industry Funds Management.

For more details about the Colonial Pipeline, see Table 2.

Table 2. Specifications of the Colonial and/or Intercontinental pipeline

Pipeline Segments 1,1118
Mileage (mi.)
Avg. Length 4.3
Max. Length 206
Total Length 4,774
Segment Flow Direction (# Segments)
Null 657
East 33
North 59
Northeast 202
Northwest 68
South 20
Southeast 30
Southwest 14
West 35
Segment Bi-Directional (# Segments)
Null 643
No 429
Yes 46
Segment Location
State Number Total Mileage Avg. Mileage Long Avg. PSI Avg. Diameter (in.)
Alabama 11 782 71 206 794 35
Georgia 8 266 33 75 772 27
Gulf of Mexico 437 522 1.2 77 50 1.4
Louisiana 189 737 3.9 27 413 11
Maryland 11 68 6.2 9 781 30
Mississippi 63 56 0.9 15 784 29
North Carolina 13 146 11.2 23 812 27
New Jersey 65 314 4.8 28 785 28
New York 2 6.4 3.2 6.4 800 26
Pennsylvania 72 415 5.8 17 925 22
South Carolina 6 119 19.9 55 783 28
Texas 209 1,004 4.8 33 429 10
Virginia 32 340 10.6 22 795 27
PSI = Pounds per square inch (pressure)

Data source: US EIA


By Sam Rubright, Ted Auch, and Matt Kelso – FracTracker Alliance

Chieftain Sands - Chetek WI Mine North

Frac Sand Photos Available on FracTracker.org

With the advent of hydraulic fracturing to increase production of oil and gas from tight geologic formations, such as shale, the demand for fracking sand (frac sand, or frack sand) has increased drastically in recent years. What does this process look like, you might ask. To help you understand this subsidiary of the oil and gas industry, we’ve compiled all of our frac sand photos into three albums on the topic.

Frac Sand Mining Photo Album

This album contains all of the photos we have amassed of frac sand mining and transportation operations – both from the ground and the sky.


Flyover Tours

We have also been fortunate enough to receive two flyover tours of frac sand mining taking place in 2013 and 2016 by LightHawk.


View All Albums

All of these frac sand photos, and more, can also be found on our Energy Imagery page, organized by topic and also location.

If you have photos or videos that you would like to contribute to this growing collection of publicly available information, just email us at info@fractracker.org, along with where and when the imagery was taken, and by whom.