FracTracker Alliance names Shannon Smith as Executive Director. Shannon has been with FracTracker since May 2019, initially in the role of Manager of Communications & Development, and more recently as Interim Executive Director.
https://www.fractracker.org/a5ej20sjfwe/wp-content/uploads/2019/10/image10.jpeg480640FracTracker Alliancehttps://www.fractracker.org/a5ej20sjfwe/wp-content/uploads/2025/09/2025-Wordmark-Logo.pngFracTracker Alliance2022-02-11 14:39:152022-12-21 14:55:00FracTracker Alliance Names Shannon Smith as Executive Director
The map below shows 6,950 total incidents since 2010, translating to 1.7 incidents per day. Pipelines are dangerous, in part because regulation around them is ineffective.
New York State Department of Environmental Conservation (DEC) Oil and Gas Database includes records for nearly 45,000 wells in the state, nearly all of which are related to the oil and gas industry. Of these records, only 19,600 include drilling dates; some records simply reflect drilling permits that were applied for and expired, or were cancelled for other reasons. Of the records listed, 99% of those drilled are vertical, “conventional” wells.
Research by Bishop (2013) indicates that there could be more than 30,000 additional oil and gas wells that are not documented in the DEC’s database, and potentially not adequately plugged.
Over the past half-century, drilling activity in New York State has ebbed and flowed. In that period of time, drilling interest in oil and gas saw two main peaks: between 1975 and 1985, and — especially for gas — between 2004 and 2010. Gas drilling activity has currently tailed off to practically nothing since the ban on high-volume hydraulic fracturing was passed in late 2014.
In 2018 and 2019, there was a brief flurry of oil drilling, but that too has dropped off. The causes for the decline in new wells are complicated, but likely reflect a combination of reduced consumption of fossil fuels, as well as steady decreases in the price of oil and gas. Prices in the past several years are up to half what they were previously. In addition, the impact of COVID on the industry has also contributed to this decline, although other sources assert that the fossil fuel industry has benefited from the global pandemic.
In this article we’ll look specifically at spatial and temporal patterns in oil and gas drilling across New York State.
Mapping analysis
Every year, FracTracker updates the full state-wide dataset of oil, gas, and other assorted (non-drinking water) wells. To see the entire “big picture,” you can explore our interactive map below, which shows all wells in the New York State database, from prior to 1900 through late February 2021.
New York State Oil and Gas Wells
This map shows that, despite New York State banning high volume hydraulic, nearly 45,000 wells have been drilled, according to the Department of Environmental Conservation (DEC). Not all the wells in the DEC’s database were actually drilled; some were sites that were permitted, but never explored. Many have been plugged and abandoned. There may be nearly as many undocumented wells as there are in the database, given that record keeping in earlier years was nowhere near as comprehensive as it is today.
In order to turn layers on and off in the map, use the Layers dropdown menu. This tool is only available in Full Screen view. Data sources can be found in the Details section of the map as well as listed the end of this article.
FracTracker has also taken a more fine-grained approach to consider the patterns in drilling in New York State both spatially and temporally. Using the DEC wells database, we first filtered out well data for records that had actual spud (drilling) dates between 1970 and the present. Then, using pivot tables in Microsoft Excel, we graphed the data, and also looked for patterns around where the drilling was taking place.
Emergent from this process, we see the following.
Spatial distributions
Oil and gas hotspots are directly related to the underlying geology of a region. In New York State, the majority of oil wells have been drilled in the Chipmunk and Bradford Formations, followed by the Fulmer Valley, Glade, and Richburg Formations.
Oil Wells in NYS and Their Associated Geological Formations
Updated February 2021
Figure 1. Oil Wells in NYS and Their Associated Geological Formations. Gas wells have historically been most productive in the Medina Formation, followed by the Queenston, and also Trenton-Black River Formations. Data source: New York State DEC Oil and Gas Database.
Gas Wells in NYS and Their Associated Geological Formations
Updated February 2021
Figure 2. Gas wells in NYS and their associated geological formations. Data source: NYS DEC Oil and Gas Database.
Temporal distributions
Activity in drilling has exhibited distinct patterns over time, as well.
In 1982 and 1983, gas drilling in New York State surged, with 774 and 667 new wells drilled over those two years, respectively. The hot spot was in the Medina Group, which over the years, continued to be a primary focus. Well depths in this section of bedrock average around 3,400 feet at that time, although wells were exploited at a more shallow depth in subsequent years. Starting in 1995, gas was discovered in the Black River shale formation, with reservoirs more than 10,000 feet deep in some places. All of these wells were vertically oriented, but still were exploited using hydraulic fracturing technologies.
Oil
The early to mid-1980s marked a relatively high level in oil well drilling in New York State, with a peak occurring in 1984, with 153 wells drilled. After a lull of about 20 years, activity picked up again in 2005, hitting a high point in 2006 when 188 oil wells were drilled. In 2010, there was another peak with 188 wells, followed by a waning period of 4 years. Then, in 2019, interest exploded in a small area of the Bradford oil fields in Cattaraugus County, with 156 wells drilled, and an average production of 319 barrels per well over the course of that year.
Economic implications
According to EIA estimate from 2014, the cost of drilling an onshore oil well is between $4.9 – 8.3 million, however smaller vertical wells like those common in New York State are likely to cost more in the range of $150,000. With the price of oil at $64 a barrel in 2019, in its first year in production, the gross profit of any of these wells in New York, based on reported production, would have been between $0 and $120,000, with an average year around $20,400 per well. It’s hard to imagine how drilling for oil in recent years in New York State could have possibly been profitable, in particular with the steep drop-off in production typically seen after the first year or two.
These simple examples of a localized “oil boom” in New York State provide a stark example of exactly how unsustainable these endeavors are, particularly for small drilling operators. So, despite the enthusiastic rush to oil drilling in 2019, activity after that has been followed by a quick decline, with only 41 oil wells drilled in New York State in 2020, and only 4, so far, in 2021.
Patterns in other types of wells
The increase in dry wells seems to track with the general patterns of oil and gas exploration. Hence, in periods when a lot of oil and gas wells are being drilled, there will be a higher number of wells that are dry, or nonproductive. During the 1970s, there was also a strong peak in disposal wells drilled. We are not certain whether this is, or is not, related to the high number of gas wells drilled during this period.
New York State moving towards better stewardship of legacy wells
Some of the oil and gas wells drilled in the 19th and early 20th century were particularly poorly documented (or not documented at all), and improperly plugged. This creates a public and environmental safety hazard, with more than 30,000 of these undocumented oil and gas wells spread across the state potentially leaking methane into the air and water. Finding the abandoned and orphan wells has been a long term problem because they are often located in rough terrain across central and western New York. Fortunately, the New York State Department of Environmental Conservation has taken new measures to locate and plug these legacy wells, using drone technology. FracTracker reported on a pilot initiative a few years ago that was testing this technique, but the new program is backed by $400,000 in funding from NYSERDA, the New York State Energy Research and Development Authority, in support of New York States ambitious goals to reduce greenhouse gas emissions through the Climate Leadership and Community Protection Act.
The Takeaway
One hundred years ago, few people expressed concerns about the environmental hazards associated with oil and gas drilling. Record-keeping was spotty, which has left us with a legacy of wells whose locations are lost to memory, or simply improperly plugged. After several periods of vigorous mineral extraction activity in the 1980s and early 2000s, oil and gas drilling has declined in its profitability, and formerly easily-accessed reserves have been depleted. Today, with unprecedented interest in clean energy sources like wind, geothermal, and solar, society can become less dependent on fossil fuels, and focus on responsibly stewarding the remnants of these “dinosaurs,” using new technologies to help clean up the damages left by them.
https://www.fractracker.org/a5ej20sjfwe/wp-content/uploads/2021/04/New-York-State-wells-feature.jpg8331875Karen Edelsteinhttps://www.fractracker.org/a5ej20sjfwe/wp-content/uploads/2025/09/2025-Wordmark-Logo.pngKaren Edelstein2021-04-01 11:10:062021-04-15 14:08:35New York State Oil & Gas Well Drilling: Patterns Over Time
In December 2019, Plains All-American and Valero pipeline companies announced plans to build the 49-mile Byhalia Pipeline through southwestern Tennessee and northwestern Mississippi. The proposed Byhalia Connection Pipeline is a 24-inch, high pressure (1500 psi) conduit, conveying crude oil coming Oklahoma, bound for the Gulf coast. The pipeline, which is designed to carry up to 420,000 barrels of oil a day, provides a link between the Diamond Pipeline to the west and the Capline Pipeline to the east. Construction is planned to begin in early 2021, and be completed by year’s end. Plains All-American insists that all safety precautions are being considered, but the outcry among residents and environmental advocates has been considerable.
Many factors—environmental, geological, social, and economic—have emerged as reasons that this pipeline should not move ahead. And industry most certainly didn’t count on pushback from the local community. Residents, allies, and the media have risen up to challenge the project. In this article, we’ll take a look at the story from various perspectives, augmented by FracTracker’s mapping insights.
UPDATE: On Friday, July 2, 2021, Plains All American announced that it would be abandoning its plans to build the controversial Byhalia Connection Pipeline. As one activist involved in the fight proudly stated, “We’ve shown them that we aren’t the path of least resistance. We are the path of resilience.” Read more about this momentous victory for the people of South Memphis here.
This interactive map looks at the various risks associated with the proposed Byhalia Connection Pipeline. The map contains all of the data layers related to the topics in this article. Scroll down in this article to find interactive maps separated out by topic. All data sources are listed in the “Details” section of the maps, as well as at the end of this article. Items will activate in this map dependent on the level of zoom in or out.
The 49-mile route of the proposed Byhalia Connection Pipeline passes through a patchwork of rural, suburban, and urban landscapes. Along the route, the pipeline would cross seven named waterways — Johnson Creek, Hurricane Creek, Bean Patch Creek, Camp Creek, Short Brook, Camp Creek Canal, and Coldwater Creek — and also pass immediately adjacently to a nearly 5-mile-long wetlands complex that surrounds the Coldwater River. But the natural environment is home to many more waterways than those that have official names on topographic maps. According to FracTracker’s inspection of National Wetlands Inventory data collected by the United States Fish and Wildlife Service, the proposed pipeline crosses or touches 62 streams in 102 separate locations, 25 forested wetlands, an emergent wetland, 17 ponds, and one lake.
Close to the City of Memphis, 0.8 miles of the pipeline would run directly through the Davis Wellfield Wellhead Protection Zone. The proposed pipeline is located over the extraordinary Memphis Sands Aquifer, which provides potable water for more than 400,000 people. Memphis Light, Gas and Water (MLGW) Company pumps water from over 175 artesian wells in Shelby County, Tennessee, alone—right in the path of the pipeline route. The aquifer itself is a sensitive resource, already under demand by the human population of the area, as well as many industries such as breweries and as a supply of cooling water for a nearby power plant.
Memphis Sands Aquifer is part of the larger Middle Claiborne Aquifer, a groundwater and geological unit in the lower Mississippi drainage. Technically speaking, the Memphis Sands portion of the aquifer is located in Tennessee, but is continuous with the Sparta Sands Aquifer, located in Mississippi. In the eastern portion of the Byhalia Connection’s proposed route, wetlands along Coldwater River are directly part of the recharge zone of this aquifer.
Byhalia hydrologic components
To learn more about the hydrologic features that may be impacted by the proposed Byhalia Connection Pipeline, explore our interactive map. When this map is viewed full-size, you can choose to view additional layers from the drop-down Layers menu.
The Memphis Sands Aquifer lies 350 to 1000 feet under Memphis (see Figure 1), and spans an area of 7500 square miles, roughly the size of Lake Ontario. “It’s one of the best (aquifers) in the world in terms of thickness, aerial content, quality of water”, according to Roy Van Arsdale, Professor of Geology at University of Memphis. Under Shelby County alone — where Memphis is located — the aquifer contains approximately 58 trillion gallons of clean water. Over time, the aquifer has seen threats from overpumping, as the population of Memphis grew. In addition, industrial pollution has turned up in some samples, including cancer-causing benzene. Policy protections on the aquifer have been lacking, although there is increasingly vocal public awareness about the need for more comprehensive groundwater resource protection in the area.
Figure 1. Cross-section of aquifers under Memphis, TN. Graphic modified from here.
Although water withdrawals from the aquifer have declined significantly since 2000 due, in part, to more water-efficient household appliances that reduce demand in comparison with older models, the MLGW pumped 126 million gallons a day from the aquifer in 2015. Consequently, the level of the aquifer has been rising in recent years, as the rate of recharge has exceeded use.
The courts have suggested that the water in the aquifer is an intrastate resource, and that therefore, Mississippi cannot have sole governance over the extraction of the water within its state boundaries. Instead, usage should be through “equitable apportionment.” Further arguments are still pending, as of late 2020. In short, as Figure 1 shows, withdrawal and recharge of the aquifer do not respect state boundaries.
The details of water law, and who can tap into these, and other deep, ancient aquifers, are complex questions in which agriculture, ecology, geology, and technology bump up against each other. All of these interests, not to mention human health, could be heavily impacted by a crude oil pipeline rupture or other accident that resulted in contamination of this groundwater resource.
Human health
Crude oil spills release a panoply of volatile organic compounds into the air and water that are extremely harmful to human and environmental health. These include benzene, ethylbenzene, toluene, and xylene. Polycyclic aromatic hydrocarbons (PAHs), such as carcinogenic benzo[a]pyrene, are also released. In addition, if the oil combusts, hydrogen sulfide gas, as well as heavy metals, including nickel, mercury, and cadmium, will become airborne.
The take-away is that crude oil spills from pipelines are not uncommon, result in environmental damage, impacts on the health and safety of workers and nearby residents. Most importantly, despite monitoring and inspections, pipelines fail. A partial list of pipeline failures is shown in the sidebar.
Within the 2-mile buffer of the pipeline, there are 20 facilities that the United States Environmental Protection Agency (US EPA) lists in its Toxic Release Inventory (TRI), including several chemical plants associated with hydrocarbon extraction. Carcinogens such as polycyclic aromatic compounds, benzene, styrene, dioxins, and naphthalene are just a few of the compounds produced by facilities owned by Valero Energy Corporation, Drexel Chemical Company, and other companies within the 2-mile buffer zone of the pipeline, which compound the risks to the populations there. In addition, while the TRI lists exposure to toluene and xylene from these facilities, neither are categorized by EPA’s TRI database as a carcinogen due to a lack of data; however, their deleterious impacts on the central nervous system are undeniable, and well- documented (see examples here and here).
In this interactive map, you can see sites in the proposed Byhalia Connection route that are listed in the TRI, as well as civic facilities like schools, daycare centers, and health care facilities. When this map is viewed full-size, you can choose to view additional layers from the drop-down Layers menu.
Geological
The most active seismic fault line in the eastern United States — the New Madrid Fault — is located about 40 miles from one end of the proposed pipeline (see Figure 2). The last major earthquakes along this fault line occurred in 1811 and 1812. Although the current Richter scale was not in use at that time, first quake in mid-December 1811 was estimated to have had a magnitude of between 7.2 and 8.2, and was followed by an aftershock of about 7.4. In January and February of 1812, there were additional earthquakes of this magnitude. Obviously, at this time in history, there was relatively sparse population in the area, and little infrastructure. Were such a quake to occur today, the outcomes would be catastrophic.
According to a Wikipedia entry, “[i]n October 2009, a team composed of University of Illinois and Virginia Tech researchers headed by Amr S. Elnashai, funded by the Federal Emergency Management Agency, considered a scenario where all three segments of the New Madrid fault ruptured simultaneously with a total earthquake magnitude of 7.7. The report found that there would be significant damage in the eight states studied – Alabama, Arkansas, Illinois, Indiana, Kentucky, Mississippi, Missouri, and Tennessee – with the probability of additional damage in states farther from the New Madrid Seismic Zone. Tennessee, Arkansas, and Missouri would be most severely impacted, and the cities of Memphis, Tennessee, and St. Louis, Missouri, would be severely damaged. The report estimated 86,000 casualties, including 3,500 fatalities, 715,000 damaged buildings, and 7.2 million people displaced, with two million of those seeking shelter, primarily due to the lack of utility services. Direct economic losses, according to the report, would be at least $300 billion.” Source: University of Illinois report]
Another article on the New Madrid fault added that “….the US Geological Survey and the University of Memphis Center for Earthquake Research estimate there’s a 7 to 10 percent chance of a major quake — one with a magnitude between 7.5 and 8.0 — occurring in the region in the next 50 years….’ The scope is about as big as you could possibly have,’ said Jonathon Monken, director of the Illinois Emergency Management Agency and chairman of the Central U.S. Earthquake Consortium… ‘Putting it in a purely financial context, Hurricane Katrina was a $106 billion disaster. We estimate this would be a $300 billion disaster, the worst in the history of the United States.’”
Earthquake damage to pipelines can occur from movement on the fault itself, soil liquefaction, uplift, and landslides, resulting in potentially catastrophic situations. Engineering solutions to minimize or prevent seismic damage to pipelines do exist. These solutions must be part of the overall pipeline design, however. For example, the Trans-Alaska oil pipeline was constructed with considerations for earthquake impacts in mind. For more information, read about the solution that was implemented there.
Byhalia geological context
This map shows the New Madrid seismic zone in the context of the proposed Byhalia Connection Pipeline. When this map is viewed full-size, you can choose to view additional layers from the drop-down Layers menu.
As eloquently reported in a series of articles in mlk50.com, the siting of the Byhalia Connection Pipeline is not only an issue environmental tied with the natural environment. This is very much an issue of environmental justice, as well. Many of the census blocks along the proposed, preferred route of the pipeline, are 99% Black. Boxtown, a community in southwest Memphis is one of places, and already has a long history of impacts by environmental contamination from the dozens of industries that operate there. Toxic waste from coal power plants includes heavy metals and radioactive materials.
The pipeline route from Memphis to its terminus in Mississippi takes a circuitous route, avoiding wealthier parts of the city and its suburbs, but goes directly through low-income areas, some of which are inhabited by a nearly 100% Black population.
FracTracker looked at US Census data along the pipeline route, and calculated a half-mile (minimum recommended) and two-mile buffer zone from the pipeline right-of-way to consider populations that might be impacted in the case of an accident.
Byhalia route demographics
Explore the the demographics along the proposed Byhalia Connection Pipeline route. When this map is viewed full-size, you can choose to view additional layers from the drop-down Layers menu, such as the non-white population ration along the proposed pipeline route.
There are 15,000 people living in the immediate evacuation zone of a half mile from the pipeline. In some parts of South Memphis, within this half-mile evacuation zone, population density is above 4,000 people per square mile, and the Black population approaches 100%. Within a two mile distance, the number climbs to over 76,000. Depending on the direction of the wind, a crude oil-induced fire could spew dangerous levels of volatile organic compounds through the air towards these populations. The disproportional risks to minority and low-income populations make the location of this pipeline — undeniably — an issue of environmental justice.
Demographic
Within ½ mile of Byhalia Connection Pipeline
Within 2 miles of Byhalia Connection Pipeline
Total population
15,041
76,016
Non-white population
7204 (48%, although some parts of South Memphis are 99+%)
27,548 (36%, although some parts of South Memphis are 99+%)
Low income population
4272 (28%, although some parts of South Memphis are 90+%)
43,486(57%, although some parts of South Memphis are 90+%)
Table 1: Population demographics along the proposed Byhalia Connection pipeline corridor.
Key civic facilities are also located within the half-mile evacuation zone of the pipeline. Were a disaster to occur, would the schools, childcare centers and medical facilities be able to successfully usher their residents and students to safety? Would they have had regular safety trainings to prepare them for this possibility?
Facility
Within ½ mile of pipeline
Within 2 miles of pipeline
Child care
4 (one within 800 feet)
30
Public school
2 (one within 800 feet)
26
EMS
2
11
Hospital
0
1
Private school
0
1
Table 2: Facilities along the proposed Byhalia Connection pipeline corridor (also shown in the interactive map here).
Al Gore calls proposed Byhalia Connection pipeline ‘reckless, racist rip-off’ at rally
Former Vice President Al Gore voiced his opposition to the Byhalia Connection and put Memphis elected officials on notice during a rally against the pipeline on March 14, 2021.
“Why is it that 64% of the polluting facilities of these pipeline communities are located in or adjacent to Black communities? Why is it that the cancer rate in SW Memphis four times higher than the national average? Why is it that Black children suffer from asthma three times more than white children? Why is it that the death rate from asthma for Black children is ten times higher than for white children?” – Former Vice President Al Gore
Approximately 300 property owners adjacent to the pipeline have already accepted monetary compensation to abandon their homes or sell property easements to make way for the pipeline. If a landowner refuses payment offered by the pipeline company for a property easement — often far under market value — the company can take the landowner to court, and seize the property (or portion of it) with no requirement of compensation. Although a majority of property owners accepted the terms of the easements drawn up by Byhalia’s developers, at least 14 did not. When numerous owners refused, nine properties were targeted for taking by eminent domain, and sued by the pipeline company. The Southern Environmental Law Center (SELC) is defending many of these property owners, claiming that the seizures — regardless of whether they are temporary or permanent — do not comply with the criteria of meeting a public good. The oil being transported in the proposed pipeline is entirely bound for export.
“The pipeline company is not created by, affiliated with or owned by the government, and the general public would have no access to the proposed crude oil pipeline… So, there is no ‘public use’ justifying the use of the condemnation power as required by Tennessee law,” said one of SELC’s attorneys. In addition, SELC has cited the illegality of the pipeline route because it runs through the municipal wellfield, and therefore violates permits issued by the Army Corps of Engineers. The Army Corp was still considering this request, as of mid-January 2021.
Furthermore, the eminent domain targeting of land owned by Black Americans in the south is a pointed question of racial justice. Historically, black and brown people throughout the United States have had far lower levels of home ownership than whites. This gap is most pronounced in lower income areas.
Figure 5: Homeownership rate in the US, by household income (2017). Source: The Urban Institute.
“The 71.9 percent white homeownership rate in 2017 represented a 0.7 percentage point decline since 2010, and the 41.8 percent black homeownership rate represented a 2.7 percentage point decline during that same period. The 30.1 percentage point gap is wider than it was when race-based discrimination against homebuyers was legal.” The Urban Institute
Figure 6: Homeownership in the US by race or ethnicity. Source: The Urban Institute.
Losing land to eminent domain represents a loss of control for a landowner — white or black. But the loss is especially unjust when a property may have been so hard won, and sometimes the result of a multi-generational lineage of ownership, as is the case for many properties along the Byhalia right-of-way.
Pipeline Incidents
Crude oil spills, 2010-2021
FracTracker has created an interactive map showing the locations of crude oil spills across the United States between 2010 and 2021, using the most up-to-date information from PHMSA, the Pipeline and Hazardous Materials Safety Administration.
You can also read more about a wider diversity of hazardous liquid materials accidents analyzed by FracTracker in an article from February 2020, entitled “Pipelines Continue to Catch Fire and Explode”.
The litany of reports of pipeline accidents associated with the transport of crude oil bear witness to an astounding volume that leaks into the environment — much of which cannot be cleaned up. Pipelines leak. Causes range from corrosion and failed fittings and seams, to striking the pipeline accidentally with heavy machinery, to “acts of God” like landslides.
These types of accidents and spills are too many to mention, but Wikipedia and other grassroots sites list scores of incidents between 2000 and 2019, alone. During that time period, at least 8.5 million gallons of crude oil were spilled into the environment. While the Byhalia pipeline is supposed to be buried 4 feet underground, and a handful of the accidents on this list involved pipelines exposed to the air, crude oil pipeline spills occurred for numerous other reasons, including:
490,000 gallon release due to a rupture caused by a dent in the pipeline (Kentucky, 2000)
192,000 gallon release due to a break in a miter bend (Pennsylvania, 2000)
150,000 gallon release after pipeline was struck by highway maintenance equipment (Oklahoma, 2001)
252,000 gallon release into a marsh, due to pipe failure from shipping-induced cracks (Minnesota, 2002)
100,000 gallon release, some of which flowed into Nemadji River near a terminal (Wisconsin, 2003)
Multiple incidents with Enbridge pipeline spilling in excess of 26,000 gallons (Michigan, 2003)
5000 gallon release from pipeline near Yellowstone River (Montana, 2004)
36,000 gallon spill (Oklahoma, 2005)
210,000 gallon spill into Prudhoe Bay as a result of poor maintenance to remove corrosion (Alaska, 2006)
134,000 gallon release from pipeline failure (Minnesota, 2006)
63,000 gallon release into farmland and drainage ditch due to incomplete weld in pipeline (Wisconsin, 2007)
201,000 gallon spill contaminates water table after construction crew struck the pipeline (Wisconsin, 2007)
Leak and explosion (killing two workers) of pipeline due to safety, repair, and maintenance failures (Minnesota, 2007)
1,300,000 gallon spill due to a pipeline seam failure (Texas, 2008)
243,000 gallon spill due to a pipeline seam failure (Illinois, 2008)
52,500 gallon release into a farm field and nearby creek, due to pipeline rupture (Ohio, 2009)
6500 gallon release due to maintenance operation failure (Wisconsin, 2009)
159,000 gallon release from rupture of pipeline due to material defect (North Dakota, 2010)
843,444 gallon spill into wetlands due to pipe rupture. 50 homes evacuated due to dangerous benzene levels. The cost of the clean-up was $1.21 billion US (Michigan, 2010) Source: here
21,000 gallon spill near wetlands (Illinois, 2010)
84,000 gallon spill due to pipeline corrosion (Wyoming, 2010)
16,800 gallon spill due to threaded connection failure on pipeline (North Dakota, 2011)
42,000 gallon release from pipeline rupture due to internal pipeline corrosion (Oklahoma, 2011)
60,000 gallon spill into Yellowstone River due to pipeline rupture (Montana, 2011)
8400 gallon leak from pipeline (Louisiana, 2012)
38,000 gallon spill at a tank farm (Illinois, 2012)
300,000 gallon spill into yards and gutters, and towards lake. Wildlife coated, 22 houses evacuated. Failure due to hook cracks and low impact toughness of pipeline seam (Arkansas, 2013)
15,288 gallon spill when contractors struck a pipeline (Texas, 2014)
18,900 gallon spill into wildlife preserve after pipeline failure (Ohio, 2014)
189,000 gallons spilled as result of a pipeline rupture, killing wildlife (Louisiana, 2014)
30,000 gallon spill in one hour due to a broken pipeline, contaminating a public water supply (Montana, 2015)
124,000 gallon spill after a pipeline rupture (California, 2015)
4200 gallon spill into a creek after a pipeline fitting failed (Illinois, 2015)
37,800 gallon leak, two weeks after the same pipeline passed inspection (California, 2015)
42,000 gallon leak into a terminal, due to internal corrosion in the pipeline (Oklahoma, 2015)
1500 gallon spill into a creek bed (Wyoming, 2016)
21,000 gallon spill, only days after pressure was increased in a pipeline (California, 2016)
45,000 gallons of spilled from a pipeline (California, 2016)
5300 gallon spill into water after pipeline hit by a dredger (Louisiana, 2016)
319,000 gallons sprayed an area after a pipeline rupture (Oklahoma, 2016)
529,800 gallon spill into a creek after a pipeline was damaged from a landslide (North Dakota, 2016)
420,300 gallon spill when pipeline failed for unknown causes (Colorado, 2017)
42,630 gallon spill from ruptured pipeline, due to internal corrosion (Texas, 2017)
19,000 gallon release from pipeline (Oklahoma, 2017)
87,000 gallon spill after contractor hit a pipeline, resulting in an evacuation of nearby residents (Texas, 2017)
672,000 gallon spill under the Gulf of Mexico, due to a cracked pipeline (Louisiana, 2017)
276,900 gallon spill in 15 minutes, after a metal-tracked vehicle ran over a pipeline (South Dakota, 2017)
84,000 gallon leak into a pond after a pipeline ruptured (Oklahoma, 2018)
31,000 gallon leak into a creek, contaminating 5 miles of the waterway, caused by an open valve (Oklahoma, 2019)
383,000 gallon leak into a 5-acre wetland (North Dakota, 2019)
Case study of a pipeline explosion
A 2020 research paper states, “Modeling and analysis of a catastrophic oil spill and vapor cloud explosion in a confined space upon oil pipeline leaking” provides a stark example of the damage done from the leak and explosion of a crude oil pipeline operating at a third of the pressure proposed for Byhalia.
“It is obvious that the explosion caused big damages to the adjacent buildings, roads, and public structures. Moreover, the explosion, combustion, and the shock wave caused injuries and deaths of workers, pedestrians, and residents. The total affected zone spread nearly 5 km [3.1 miles].”
Note: The oil pipeline shown in Shengzhu, Xu, et al.’s paper in was 28 inches in diameter, and operating at a pressure of between 400 and 660 psi. A vapor cloud from the spill into a municipal drainage area caused this explosion, which killed 62 people and injured 136 in November 2013. The 24-inch, proposed Byhalia pipeline would operate at triple the pressure of the pipeline shown in these photos of its explosion.
(a) bird’s eye view of the location of the explosion point, (b) scene of the oil spill point after explosion, (c) scene of the nearby street, (d) scene of the drainage of the adjacent plant.
Figure 7: Scene of an oil pipeline explosion site in China. (a) bird’s eye view of the location of the explosion point, (b) scene of the oil spill point after explosion, (c) scene of the nearby street, (d) scene of the drainage of the adjacent plant. Image from Shengzhu, Xu, et al.
In case of a large spill: Consider initial downwind evacuation for at least 300 meters (1000 feet).
In case of a fire: If tank, rail car or tank truck is involved in a fire, ISOLATE for 800 meters (1/2 mile) in all directions; also, consider initial evacuation for 800 meters (1/2 mile) in all directions. Source: Petroleum crude oil hazards
The Byhalia Connection Pipeline is receiving considerable scrutiny, both from media sources like the Memphis Daily News and MLK50, as well as advocacy groups including Sierra Club’s Tennessee Chapter, the Southern Environmental Law Center, Memphis Community Against the Pipeline, and Protect Our Aquifer. In a move considered egregious by a vast swath of stakeholders, in early February 2021, the US Army Corps of Engineers approved a Nationwide 12 permit to fast-track the Byhalia project, effectively cutting out public comment from the process, and lightening the environmental review requirements. Because the project touches vulnerabilities in the intersection of environment, economics, health, safety, and social justice, this discussion is not likely to easily recede into the background, despite placating claims by the companies that are poised to profit.
Protests are ongoing, and just recently, on February 22, 2021, United States Congressional Representative Steve Cohen sent a direct appeal to President Biden to revoke a key permit for Byhalia, directly citing the burden the pipeline would impose on long-suffering Black neighborhoods in South Memphis. Simultaneously, the Public Works Department of Memphis is considering a resolution condemning the pipeline, and asking the Memphis Light, Gas, and Water Division to oppose the project.
This story will undoubtedly continue to evolve in the upcoming months.
The Takeaway
Regardless of where a pipeline is sited, there are inevitably risks to the environment, and to human communities living nearby. The proposed Byhalia Connection pipeline project is situated in a particularly problematic intersection where environmental justice, hydrology, geology, and risks to human and environmental health intersect. Without taking all of these factors into consideration, a potentially catastrophic cascade of impacts may ensue. Engagement and resistance to the project by the residents in the area, as well as support by advocacy groups, will hopefully result in comprehensive consideration of all the risks. Time will tell whether the project is modified, or simply defeated.
September 16, 2021 update:
In September, 2021, building on lessons learned from the fight against the now-defeated Byhalia Pipeline, Shelby County policymakers approved an ordinance that prohibits construction of new pipelines within 1500 feet of residential areas. The Memphis City Council is also expected to eventually vote on an ordinance that will directly protect the Memphis Sand Aquifer.
References & Where to Learn More
MLK50.com maintains an archive of excellent reading materials on this controversial project that can be found here.
Data downloaded by FracTracker Alliance from US Energy Information Administration (EIA) https://www.eia.gov/maps/layer_info-m.php and adjusted to orthoimagery in area near Byhalia project, by FracTracker.
Coldwater National Wetlands Inventory (2-mile buffer to Byhalia)
Non-white percentage, 1/2 mile evacuation zone from Byhalia pipeline
Data downloaded 21 April 2020 from ftp://newftp.epa.gov/EJSCREEN/2019/ by FracTracker Alliance, then reprojected into UTM, clipped, and recalculated 27 January 2021. Data originally posted by US Environmental Protection Agency on 11/8/2019.
Non-white percentage, 2-mile buffer to Byhalia pipeline
Data downloaded 21 April 2020 from ftp://newftp.epa.gov/EJSCREEN/2019/ by FracTracker Alliance, then reprojected into UTM, clipped, and recalculated 27 January 2021. Data originally posted by US Environmental Protection Agency on 11/8/2019.
Low income percentage, 1/2 mile evacuation zone from Byhalia pipeline
Data downloaded 21 April 2020 from ftp://newftp.epa.gov/EJSCREEN/2019/ by FracTracker Alliance, then reprojected into UTM, clipped, and recalculated 27 January 2021. Data originally posted by US Environmental Protection Agency on 11/8/2019.
Low income percentage, 2-mile buffer to Byhalia pipeline
Data downloaded 21 April 2020 from ftp://newftp.epa.gov/EJSCREEN/2019/ by FracTracker Alliance, then reprojected into UTM, clipped, and recalculated 27 January 2021. Data originally posted by US Environmental Protection Agency on 11/8/2019.
The Falcon Ethane Pipeline System is at the center of major investigations into possible noncompliance with construction and public safety requirements and failing to report drilling mud spills, according to documents obtained from the Pennsylvania Department of Environmental Protection (PA DEP) by FracTracker Alliance. These investigations, which are yet to be released, also uncovered instances of alleged data falsification in construction reports and Shell Pipeline Company firing employees in retaliation for speaking up about these issues.
Shell’s Falcon Pipeline, which is designed to carry ethane to the Shell ethane cracker in Beaver County, PA for plastic production, has been under investigation by federal and state agencies, since 2019. The construction of the pipeline is nearing completion.
Allegations in these investigations include issues with the pipeline’s coating, falsified reports, and retaliation against workers who spoke about issues.
Organizations are calling on public agencies to take action to protect public welfare and the environment along the entire pipeline route through Ohio, West Virginia, and Pennsylvania.
These investigations reveal yet another example of the life-threatening risks brought on by the onslaught of pipeline construction in the Ohio River Valley in the wake in the fracking boom. They also reveal the failure of public agencies to protect us, as documents reveal the federal agency that oversees pipeline safety did not adequately respond to serious accusations brought to its attention by a whistleblower.
These new concerns are coming to light as people across the country are demanding bold action on plastic pollution and the climate crisis through campaigns such as Build Back Fossil Free,Plastic Free President, and Future Beyond Shell. On a local level, residents in the Ohio River Valley continue to shoulder the health burdens of the fracking industry, despite a recent ban on fracking in the eastern part of Pennsylvania, which a growing body of scientific evidence verifies. The Falcon Pipeline, which would transport fracked gas for plastic production, is directly at odds with these demands.
These allegations are serious enough to warrant immediate action. We’re calling on the Pipeline and Hazardous Materials Safety Administration (PHMSA) to thoroughly examine these allegations and suspend construction if not yet completed, or, in the case that construction is complete, operation of the Falcon Pipeline. Furthermore, we call on state environmental regulators to fully investigate construction incidents throughout the entire pipeline route, require Shell Pipeline to complete any necessary remediation, including funding independent drinking water testing, and take enforcement action to hold Shell accountable. Read our letters to these agencies here.
According to documents obtained through a public records request, a whistleblower contacted PHMSA in 2019 with serious concerns about the Falcon, including that the pipeline may have been constructed with defective corrosion coating. PHMSA is a federal agency that regulates pipeline operation. The whistleblower also shared environmental threats occurring within the DEP’s jurisdiction, prompting the PA DEP and Pennsylvania Attorney General’s Office to get involved.
Many of the issues with the Falcon relate to a construction method used to install pipelines beneath sensitive areas like roads and rivers called horizontal directional drilling (HDD). Shell Pipeline contracted Ellingson Trenchless LLC to complete over 20 HDDs along the Falcon, including crossings beneath drinking water sources such as the Ohio River and its tributaries. FracTracker and DeSmog Blog previously reported on major drilling mud spills Shell caused while constructing HDDs and how public agencies have failed to regulate these incidents.
Falcon Pipeline Horizontal Directional Drilling locations and fluid losses
This map shows the Falcon Pipeline’s HDD crossings and spills of drilling fluid spills that occurred through 3/5/2020. To see the data sources, click on the information icon found in the upper right corner of the map header as well as under the map address bar.
Correspondence between the PA DEP and PHMSA from February 26, 2020 reveal the gravity of the situation. While PHMSA conducted an inquiry into the whistleblower’s complaints in 2019 and concluded there were no deficiencies, PA DEP Secretary Patrick McDonnell wrote that his agency felt it was incomplete and urged PHMSA to conduct a more thorough investigation. Secretary McDonnell noted the PA DEP “has received what appears to be credible information that sections of Shell’s Falcon Pipeline project in western PA, developed for the transportation of ethane liquid, may have been constructed with defective corrosion coating protection,” and that “corroded pipes pose a possible threat of product release, landslide, or even explosions.”
FracTracker submitted a Freedom of Information Act request with PHMSA asking for documents pertaining to this inquiry, and was directed to the agency’s publicly available enforcement action webpage. The page shows that PHMSA opened a case into the Falcon on July 16, 2020, five months after Secretary McDonnell sent the letter. PHMSA sent Shell Pipeline Company a Notice of Amendment citing several inadequacies with the Falcon’s construction, including:
inadequate written standards for visual inspection of pipelines;
inadequate written standards that address pipeline location as it pertains to proximity to buildings and private dwellings;
compliance with written standards addressing what actions should be taken if coating damage is observed during horizontal directional drill pullback; and
inadequate welding procedures
Shell responded with its amended procedures on July 27, 2020, and PHMSA closed the case on August 13, 2020.
Of note, PHMSA states it is basing this Notice on an inspection conducted between April 9th and 11th, 2019, when construction on the Falcon had only recently started. PHMSA has confirmed its investigation on the Falcon is ongoing, however we question the accuracy of self reported data given to PHMSA inspectors should be questioned
The PA DEP also brought the matter to the attention of the US Environmental Protection Agency.
Timeline of events in the Falcon investigation
Public knowledge of these investigations is limited. Here’s what we know right now. Click on the icons or the event descriptions for links to source documents.
Shell confirms that the “instruments do not record data in real time and that site personnel record the information ‘contemporaneously with drilling operations’,” and propose to continue operations with this method
PHMSA’s website shows that the agency opens a case into the Falcon Pipeline. PHMSA states it is basing this case on the inspection April 9-11, 2019 inspection.
The Falcon pipeline also crosses through Ohio and briefly, West Virginia. While we do not know how these states are involved in these investigations, our past analyses raise concerns about the Ohio Environmental Protection Agency’s (OEPA) ability to regulate the pipeline’s HDD crossings.
One of the focuses of the Pennsylvania DEP’s investigation is the failure to report drilling fluid spills that occur while constructing a HDD crossing. The PA DEP shut down all HDD operations in November, 2019 and forced Shell to use monitors to calculate spills, as was stated in permit applications.
A horizontal directional drilling (HDD) construction site for the Falcon Pipeline in Southview, Washington County, Pennsylvania. You can see where the drilling mud has returned to the surface in the top left of the photo. Photo by Cyberhawk obtained by FracTracker Alliance through a right-to-know request with the Pennsylvania Department of Environmental Protection.
The Falcon Pipeline’s HDD locations are often close to neighborhoods, like the HOU-02 crossing in Southview, Washington County, Pennsylvania. Photo by Cyberhawk obtained by FracTracker Alliance through a right-to-know request with the Pennsylvania Department of Environmental Protection.
To our knowledge, the OEPA did not enforce this procedure, instead relying on workers to manually calculate and report spills. Shell’s failure to accurately self-report raises concerns about the safety of the Falcon’s HDD crossings in Ohio, including the crossing beneath the Ohio River, just upstream of drinking water intakes for Toronto and Steubenville, Ohio.
Public water system wells, intakes, and Drinking Water Source Protection Areas nears the Falcon Pipeline Route. Note, the pipeline route may have slightly changed since this map was produced. Source: Ohio EPA
The Shell ethane cracker
The Falcon is connected to one of Shell’s most high-profile projects: a $6 billion to $10 billion plastic manufacturing plant, commonly referred to as the Shell ethane cracker, in Beaver County, Pennsylvania. These massive projects represent the oil and gas industry’s far-fetched dream of a new age of manufacturing in the region that would revolve around converting fracked gas into plastic, much of which would be exported overseas.
Many in the Ohio River Valley have raised serious concerns over the public health implications of a petrochemical buildout. The United States’ current petrochemical hub is in the Gulf Coast, including a stretch of Louisiana known colloquially as “Cancer Alley” because of the high risk of cancer from industrial pollution.
While the oil and gas industry had initially planned several ethane crackers for the region, all companies except for Shell have pulled out or put their plans on hold, likely due to the industry’s weak financial outlook.
Royal Dutch Shell owes a more complete explanation to shareholders and the people of Pennsylvania of how it is managing risk. Shell remains optimistic regarding the prospects for its Pennsylvania Petrochemical Complex in Beaver County, Penn. The complex, which is expected to open in 2021 or 2022, is part of a larger planned buildout of plastics capacity in the Ohio River Valley and the U.S. IEEFA concludes that the current risk profile indicates the complex will open to market conditions that are more challenging than when the project was planned. The complex is likely to be less profitable than expected and face an extended period of financial distress.
Many of Pennsylvania’s elected officials have gone to great lengths to support this project. The Corbett administration enticed Shell to build this plastic factory in Pennsylvania by offering Shell a tax break for each barrel of fracked gas it buys from companies in the state and converts to plastic (valued at $66 million each year). The state declared the construction site a Keystone Opportunity Zone, giving Shell a 15-year exemption from state and local taxes. In exchange, Shell had to provide at least 2,500 temporary construction jobs and invest $1 billion in the state, giving the company an incredible amount of power to decide where resources are allocated in Pennsylvania.
Would the state have asked Shell for more than 2,500 construction jobs if it knew these jobs could be taken away when workers spoke out against life-threatening conditions? Will the politicians who have hailed oil and gas as the only job creator in the region care when workers are forced to hide their identity when communicating with public agencies?
States fail to regulate the oil and gas industry
The PA DEP appears to have played a key role in calling for this investigation, yet the agency itself was recently at the center of a different investigation led by Pennsylvania Attorney General Josh Shapiro. The resulting Investigating Grand Jury Report revealed systematic failure by the PA DEP and the state’s Department of Health to regulate the unconventional oil and gas industry. One of the failures was that the Department seldom referred environmental crimes to the Attorney General’s Office, which must occur before the Office has the authority to prosecute.
The Office of Attorney General is involved in this investigation, which the PA DEP is referring to as noncriminal.
The Grand Jury Report also cited concerns about “the revolving door” that shuffled PA DEP employees into higher-paying jobs in the oil and gas industry. The report cited examples of PA DEP employees skirting regulations to perform special favors for companies they wished to be hired by. The watchdog research organization Little Sis listed 47 fracking regulators in Pennsylvania that have moved back and forth between the energy industry, including Shell’s Government Relations Advisor, John Hines.
National attention on pipelines and climate
The Falcon Pipeline sits empty as people across the nation are amping up pressure on President Biden to pursue bold action in pursuit of environmental justice and a just transition to clean energy. Following Biden’s cancellation of the Keystone XL pipeline, Indigenous leaders are calling for him to shut down other projects including Enbridge Line 3 and the Dakota Access Pipeline.
Over a hundred groups representing millions of people have signed on to the Build Back Fossil Free campaign, imploring Biden to create new jobs through climate mobilization. Americans are also pushing Biden to be a Plastic Free President and take immediate action to address plastic pollution by suspending and denying permits for new projects like the Shell ethane cracker that convert fracked gas into plastic.
If brought online, the Falcon pipeline and Shell ethane cracker will lock in decades of more fracking, greenhouse gasses, dangerous pollution, and single-use plastic production.
Just as concerning, Shell will need to tighten its parasitic grip on the state’s economic and legislative landscape to keep this plant running. Current economic and political conditions are not favorable for the Shell ethane cracker: financial analysts report that its profits will be significantly less than originally presented. If the plant is brought online, Shell’s lobbyists and public relations firms will be using every tactic to create conditions that support Shell’s bottom line, not the well-being of residents in the Ohio River Valley. Politicians will be encouraged to pass more preemptive laws to block bans on plastic bags and straws to keep up demand for the ethane cracker’s product. Lobbyists will continue pushing for legislation that imposes harsh fines and felony charges on people who protest oil and gas infrastructure, while oil and gas companies continue to fund police foundations. Shell will ensure that Pennsylvania keeps extracting fossil fuels to feed its ethane cracker.
The Falcon pipeline is at odds with global demands to address plastic and climate crises. As these new documents reveal, it also poses immediate threats to residents along its route. While we’re eager for more information from state and federal agencies to understand the details of this investigation, it’s clear that there is no safe way forward with the Falcon Pipeline.
Royal Dutch Shell has been exerting control over people through the extraction of their natural resources ever since it began drilling for oil in Dutch and British colonies in the 19th Century. What will it take to end its reign?
https://www.fractracker.org/a5ej20sjfwe/wp-content/uploads/2021/03/Falcon-Ohio-River-Crossing-Feature-A.LauschkeLightHawk-scaled.jpg6671500Erica Jacksonhttps://www.fractracker.org/a5ej20sjfwe/wp-content/uploads/2025/09/2025-Wordmark-Logo.pngErica Jackson2021-03-17 08:48:432021-04-15 15:11:21Shell’s Falcon Pipeline Under Investigation for Serious Public Safety Threats
For the past four decades, groups of Alaska Natives including the Gwich’in and Iñupiat, international institutions including the United Nations and the Inter-American Commission on Human Rights, the US government, the state of Alaska, and environmental groups have debated whether or not oil extraction should be allowed in the Arctic National Wildlife Refuge (ANWR).
Made up of 19.3 million acres in northeastern Alaska, ANWR is an area with great cultural significance and ecological richness. Fossil fuel extraction poses significant material, reputational, and human rights risks according to the Gwich’in Steering Committee, a group formed in 1988 in response to proposals to drill for oil in the coastal plain of ANWR, or what they call the Sacred Place Where All Life Begins, Iizhik Gwats’an Gwandaii Goodlit.
In the past few months, the Trump administration issued nine leases, the first ever in the Arctic refuge’s coastal plain, even as major oil companies skipped out on bidding in the area and all major U.S. and Canadian banks pledged not to fund fossil fuel development in the Refuge. The sale was a major flop, which points to the larger movement away from fossil fuels, an inevitable transition reinforced by President Joe Biden’s 60-day moratorium on oil and gas leasing on federal lands.
But despite efforts to protect ANWR, leases that went through under the Trump administration threaten to further violate human rights and damage wildlife.
The great risk of ecological devastation from oil & gas exploitation
Described as “North America’s Serengeti,” ANWR is the continent’s most intact and remote wilderness environment, a landscape of fragile tundra ecosystems and diverse wildlife. The Refuge is home to more than 40 fish and mammal species and over 200 bird species. Though harsh, the landscape exists in a delicate balance. Specially-adapted plant species thrive during long winters and short growing seasons, supporting annual wildlife migrations and hibernations, ecosystem functions, and a wealth of natural resources.
Of particular significance is Area 1002, mapped in Figure 2 below. The 1.5-million-acre area site within ANWR sits between the north slope of the Brooks Range in Alaska and the Beaufort Sea, and is the summer calving and feeding site of the Porcupine caribou, and a site sacred to the Gwich’in Tribe.
The Porcupine caribou herd has travelled the 1,500-mile trek, the longest documented terrestrial mammal migration in the world, to gather there for at least the past 23,000 years.
The herd is one of the area’s keystone species (i.e., if it were removed from the ecosystem, the landscape’s functional integrity would suffer and drastically change). The 125,000-strong herd plays a key ecological and cultural role in the Refuge, and the distribution and health of the herd is a direct indicator of the health of the entire ecosystem. Their annual journey provides them with good forage and relief from predators and mosquitos.
Oil and gas development could interfere with the Caribou herd’s migrations as industrial disturbances discourage the instinctual movements of pregnant and nursing caribou mothers – especially problematic given their slow reproductive rate – and could diminish the population.
The Porcupine caribou herd in the Arctic National Wildlife Refuge (ANWR), Alaska. Photo courtesy of NWF Blogs, 2015.
Oil & Gas in ANWR
ANWR is also the site of oil fields, estimated by the US Geologic Survey in 2001 to contain between 11.6 to 31.5 billion barrels of oil (BBO) versus the 1987 estimate of 4.8 to 29.4 BBO, (95- and 5-percent probabilities) and mean values are 20.7 BBO versus 13.8 BBO (current assessment compared to 1998 assessment). and natural gas liquids (NGLs).
For millennia, the northern Alaskan alpine tundra has been home to Native communities – including the Gwich’in, Hare, Iñupiaq, and Koyukon, who have a legacy of living sustainably in this complex, fragile, and sometimes very demanding, environment (see Figure 1). The health and wellbeing of these communities is intricately tied to the health of the environment surrounding them.
Along Alaska’s coast, outside of ANWR between Prudhoe Bay and Barrow (Utqiagvik) where oil and gas extraction is happening already, the current environmental damage from oil and gas extraction is undeniable. Extractive activities have disconnected wildlife corridors and negatively affected subsistence hunting, and the local tourism industry oriented around polar bear and whale viewing opportunities has suffered.
Though the issue has divided Alaskan communities, all those living in and around ANWR will likely face challenges borne of further oil and gas development.
Language Groups and Natural Features of the North Slope of Alaska
This map shows the Arctic National Wildlife Refuge in the context of oil fields; Native Alaskan language groups in Alaska and eastward into Canada; along with the habitats of the Central Arctic, Western Arctic, and Porcupine caribou herd — a species held sacred by the Gwich’in people. Please note that the Native Alaskan language group territories should be interpreted somewhat loosely, as it’s difficult to estimate the precise location and distinction between groups. See Figure 2 for a detailed map of the oil fields.
But pressure from drilling opponents – including Alaskan Natives, environmental activists, and scientists – a global recession, low oil prices, and waning faith and interest in the oil and gas sector curbed expected lease sales. Major oil companies chose to forego the auction – a sale that US banks (and some Canadian institutions) refused to bankroll. The auction received only three bidders – one of which was the State of Alaska – and generated only a fraction of the revenue it was projected to raise. Half of the parcels drew no bidders at all.
Results of the January 2021 oil & gas lease sale in Area 1002
This map shows parcels purchased by three entities during the January 6, 2021 lease sale in Area 1002, a site of particular cultural and ecological importance within ANWR.
Figure 2: Results of the January 6, 2021 oil and gas lease sale in Area 1002, FracTracker Alliance, January 2021. Data layer for oil and gas lease area digitized by Karen Edelstein using a Bureau of Land Management map.
Despite the lukewarm response, the BLM received 13 bids on 11 lease tracts (symbolized in Figure 2, above, with diagonal red lines). This area spans 437,804 acres, is valued at a little over 14.4 million dollars and is estimated to contain eight billion barrels of recoverable oil.
Knik Arm Services and Regenerate Alaska each secured one parcel. Half of the sale’s revenue will go to the federal government, and half will go to the State of Alaska. The leases auctioned off are renewable and active for ten years. The BLM announced on January 19 that it signed and issued leases on nine of the 11 tracts. View the record of lease sales here.
40 Year Timeline Leading to the Recent Auction
The Trump Administration’s leasing decision followed 40 years of gridlock over oil and gas exploration and drilling in one of the nation’s most pristine environments. The timeline below outlines major developments in the struggle to protect ANWR:
1960: President Dwight Eisenhower establishes an 8.9-million-acre expanse in Alaska’s tundra as the nation’s first ecosystem-scale conservation area, specifically for its “unique wildlife, wilderness, and recreational values.”
1972: The Arctic Slope Regional Corporation (ASRC) was recognized under the Alaska Native Claims Settlement Act, which transferred 44 million acres to Indigenous control and instigated the creation of 12 regional, private, for-profit companies intended to represent and protect Indigenous business interests and their ownership of the land and its resources.
1980: President Jimmy Carter signs into law the Alaska National Interest Lands Conservation Act (ANICLA), which expands the protected area to 19.3 million acres and renames it the Arctic National Wildlife Refuge (ANWR). The Act mandates that potential oil reserves in the 1.5-million-acre Coastal Plain be considered for development only with Congress’ authorization.
1987: Under President Ronald Reagan, an Environmental Impact Statement (EIS) for ANWR’s oil and gas exploration is drafted, and the US Department of Interior recommends Congress open the Coastal Plain for exploration.
2002 – 2003: During President George W. Bush’s Administration, the House repeatedly approves drilling in ANWR – only to be met with the Senate’s rejection.
2015: President Barack Obama’s Administration releases the U.S. Fish & Wildlife Service’s Comprehensive Conservation Plan for ANWR, calling for core areas – including the Coastal Plain – to be designated as wilderness, the highest level of protection for public lands.
2017: Following House instructions, the Senate Energy & Natural Resources Committee legislates $1 billion in revenue creation between 2018 – 2027, and to that end, passes an ANWR drilling provision. President Donald Trump signs the bill into law through the Tax Cuts & Jobs Act, which makes several significant changes to individual income tax and — notably – mandates energy and job creation and economic growth for future generations, through which the Trump Administration and Republican lawmakers advance fossil fuel industry expansion. The law includes the ANWR lease provision as a way to generate revenue to offset the associated tax cuts, in turn opening up the Coastal Plain to drilling.
“Gwich’in Council International (GCI) represents 9,000 Gwich’in in the Northwest Territories (NWT), Yukon, and Alaska as a Permanent Participant in the Arctic Council; the only international organization where Indigenous peoples have a seat at the decision-making table alongside national governments. GCI supports Gwich’in by amplifying our voice on sustainable development and the environment at the international level to support resilient and healthy communities.”
March 26, 2019: Gwich’in leaders from across the United States and Canada were joined by faith leaders, scientists, and veterans to stand before Congress and testify on behalf of the Arctic National Wildlife Refuge and its coastal plain, and to support passage of The Arctic Cultural and Coastal Plain Protection Act. Witnesses included Ms. Bernadette Demientieff, Executive Director, Gwich’in Steering Committee; The Honorable Galen GilbertChief, Arctic Village Council; The Honorable Dana Tizya-Tramm, Chief, Vuntut Gwitchin First Nation; The Honorable Victor Joseph, Chief/Chairman, Tanana Chiefs Conferece; Mr. Sam Alexander, Board Member, Gwich’in Council International; Mr. Fenton Rexford, Advisor to the Mayor of the North Slope Borough, Tribal Member, Native Village of Kaktovik; Rev. Mark Lattime, Bishop of Alaska, The Episcopal Church; Dr. Steven Amstrup, Chief Scientist, Polar Bears International; Mr. Chad Brown, Founder, Soul River, Inc.; Mr. Richard Glenn, Executive Vice President, External Affairs, Arctic Slope Regional Corporation; Mr. Matthew Rexford, Tribal Adminisrator, Native Village of Kaktovik.
October 2019: The Gwich’in Steering Committee, Cultural Survival, Land is Life, First Peoples Worldwide, and the American Indian Law Clinic at the University of Colorado submitted a report to the the United Nations Human Rights Council. In the report, “Observations on the State of Indigenous Human Rights in the United States of America,” groups state that “The government of the United States has repeatedly failed to protect the human rights of the Gwich’in by aggressively pursuing oil and gas development in the Coastal Plain of the Arctic National Wildlife Refuge without first obtaining the Free, Prior and Informed Consent of the Gwich’in Nation.”
In the same month, the U.S. Department of the Interior (DOI) released the Final Environmental Impact Statement (EIS) for the Coastal Plain Oil and Gas Leasing Program. Its release was a clear suppression of science and public opinion.
U.S. Secretary of the Interior David Bernhardt made the following dubious claims: “Affordable energy and great paying energy jobs help power our nation’s economy, which is clearly thriving under President Trump’s policies,” stated. After rigorous review, robust public comment, and a consideration of a range of alternatives, today’s announcement is a big step to carry out the clear mandate we received from Congress to develop and implement a leasing program for the Coastal Plain, a program the people of Alaska have been seeking for over 40 years.”
December 2020: The Gwich’in Steering Committee, including Tribal Governments and Village Councils, and more than a dozen conservation groups seek a temporary restraining order and preliminary injunction prohibiting Trump from approving and issuing oil and gas leases along the Coastal Plain. The filing asserts that it is well-known and documented that seismic exploration would cause irreparable harm to the landscape, its biodiversity, and its people, as well as their tribal archaeological and cultural resources – negative impacts that go beyond the lease tracts granted to purchasers, because it promises rights-of-way and easements that breach parcel boundaries.
“This is bum news but it’s not going to stop us from fighting to protect it,” said Bernadette Demientieff, chair of the Gwich’in Steering Committee that brought the lawsuit. “This is sacred land to the Gwich’in. This is our way of life, and we’re not going to just allow anyone to come in and destroy our way of life, because our children are going to be the ones who have to live with the destruction that they caused.”
January 6, 2021: President Trump opens up the lease sale in a public auction hosted and streamed live on the BLM website.
January 19, 2021: On their last full day in office, the Trump Administration announces it had officially issued oil and gas leases in ANWR. The outgoing administration also tried to push through a law requiring banks to finance many industries, including oil and gas companies and assault weapons manufacturers, that major institutions – counting JP Morgan Chase and Goldman Sachs – announced they would no longer finance.
January 20, 2021: President Joe Biden signed 17 executive orders his first day in office – 30 in the first three days – that reverse several of his predecessor’s environmentally-damaging policies . Biden directed the Secretary of the Interior to “place a temporary moratorium on all activities of the Federal Government relating to the implementation of the Coastal Plain Oil and Gas Leasing Program, as established by the Record of Decision signed August 17, 2020, in the Arctic National Wildlife Refuge. The Secretary shall review the program and, as appropriate and consistent with applicable law, conduct a new, comprehensive analysis of the potential environmental impacts of the oil and gas program.”
Subsequently, the Department of the Interior issued Secretarial Order No. 3395, implementing a 60-day suspension of new oil and gas leasing and drilling permits for federal land and water.
The Gwich’in Steering Committee released the following statement in response: “The Gwich’in Steering Committee opposes all forms of development and calls on Regenerate Alaska and its parent company, 88 Energy, to halt its plans.”
January 27, 2021: Biden issues a pause on oil and gas leasing in non-tribal federal lands and offshore waters, which lengthened the 60-day moratorium issued the week prior. He also ordered the creation of an interagency working group to prioritize economic revitalization of communities dependent on fossil fuels, and to focus on transitioning these workers to cleaner energy industries.
“We’re not going to lose jobs; we’re going to create jobs,” Biden said in his remarks about this executive order. Republicans criticized this move, saying it will eliminate jobs and hurt US businesses, but Biden’s order didn’t apply to all permitting. He added, “We’re not going to ban fracking,” a point he emphasized in his 2020 presidential campaign.
Did we miss anything? Let us know if you have important milestones to add to the timeline above!
The future of ANWR
Despite his plan to temporarily halt oil and gas leasing, Biden has approved at least 31 drilling permits since his inauguration. The Department of the Interior – whose top officials Biden put in charge of oil permitting decisions – states that the order, set to expire March 20, does not equate to a drilling permit freeze and does not apply to tribal lands. However, energy companies are still worried they may not be able to secure permits.
There are a few tactics that Biden can use to delay oil and gas exploration in ANWR, including reopening the Department of Interior’s record of decision (ROD), instituting a bid rejection, or delaying permits that companies need to search for oil and build infrastructure – though it is possible that companies could secure their leases and just wait for the administration to change (in their favor).
“We are eager to hear the Biden administration’s plan to replace the economy that it’s brought to a standstill, and look forward to working side-by-side with the President to create new, sustainable solutions,” said Voice of the Arctic Iñupiat (VOICE) President Sayers Tuzroyluk.
Voice of the Arctic Iñupiat is a nonprofit organization and communication network working across North Slope communities to address and participate in legislation, regulations, and government programs to protect their culture, and to ensure natural resource development in a safe and responsible manner.
Biden will also need to prioritize fossil fuel industry workers whose livelihoods are uncertain from his extended moratorium – for people in ANWR, and in other US communities.
The Takeaway
Regulatory actions to open ANWR for drilling in ANWR have significant and potentially grievous implications for Alaska’s Native peoples, and do not bode well for Alaska’s air, water, and landscape, and the biodiverse species such as the Porcupine caribou that call it home.
Increased fossil fuel activity will also continue to alter the landscape and hinder its function by disconnecting migration and breeding habitat, disturbing and/or displacing animal populations, threatening their survival, and destroying the delicate ecological balance of the Coastal Plain.
However this issue is resolved, the rights of Alaskan Natives should be foremost in future decision-making and is of utmost importance to the future of their epic lands. Following their leadership, there’s hope that the solution will be equitable for both people and the environment
References & Where to Learn More
Gwich’in Steering Committee – The Gwich’in Steering Committee was formed in 1988 in response to proposals to drill for oil in the Sacred Place Where Life Begins, the coastal plain of the Arctic National Wildlife Refuge.
The Gwich’in Place Name and Story Atlas is an interactive Story Map that invites visitors to explore the culture, history, traditional knowledge, and land use of the Gwich’in through Gwich’in place names. The Atlas is the result of more than two decades of collaboration between the Gwich’in Social and Cultural Institute, Gwich’in Elders, and traditional land users living in the Gwich’in Settlement Region communities of Aklavik, Fort McPherson, Inuvik and Tsiigehtchic.
The Gwich’in Elders’ Biographies Research Project is a project of the Gwich’in Social & Cultural Institute’s Department of Cultural Heritage. Researchers interviewed 24 elders from the four Gwich’in communities, and collected their life histories. Many of the elders describe a very traditional lifestyle of moving seasonally on the land, being the last generation to live in this traditional manner. Their stories communicate their love and knowledge of the land, and speak to the importance of family ties, place names, legends, and historical events. They also offer snapshots of the sweeping changes the Gwich’in experienced in the 20th century.
The Right to be Cold is Sheila Watt-Cloutier’s memoir of growing up in Quebec’s Arctic on the front lines of climate change. “It is the story of an Inuk woman finding her place in the world, only to find her native land giving way to the inexorable warming of the planet.” She became one of the most influential Indigenous environmental, cultural, and human rights advocates in the world. She served as the elected Canadian president of the Inuit Circumpolar Council from 1995 to 2002, and in 2002 she was elected its international chair. She launched the world’s first international legal action on climate change through a petition to the Inter-American Commission on Human Rights.
Saqiyuq: Stories from the Lives of Three Inuit Women by Nancy Wachowich, Apphia Agalakti Awa, Rhoda Kaukjak Katsak and Sandra Pikujak Katsak offers a collection of stories from a grandmother, daughter, and granddaughter from the Baffin Island community of Pond Inlet, Nunavut. Saqiyuq is the Inuktitut word for ‘a strong wind that suddenly shifts direction.’ Their stories illustrate the shift in Inuit life from nomadic subsistence hunting to permanent settlement in communities, and offer insight into the “enforced acculturation of the Inuit and the imposition of religious and cultural values useless to Inuit culture.”
This article focuses on the city of Arvin as an example to show how some Frontline Communities in California are completely surrounded by an unrelenting barrage of carcinogenic and toxic air pollutants from oil and gas wells. Kern County’s proposed environmental impact report (EIR) would streamline the approval of an additional 67,000 new oil and gas wells in the County and thus further degrade air quality. We provide several recommendations for how local and state decision-makers can better protect public health from these serious threats.
Upstream greenhouse-gas and volatile organic compound (VOC) emissions from oil and gas extraction have been drastically under-reported throughout the United States, and California’s emissions regulations for oil and gas production wells are not comprehensive enough to protect Frontline Communities. The contribution of VOCs from the oil and gas extraction sector is responsible for California’s central valley and Kern County communities being exposed to the worst air quality in the country. As carcinogens, air toxics, and precursors to ozone, VOC’s present a myriad of health threats.
The contribution of VOCs from the well-sites in Kern, in addition to the cumulative burden of the Central Valley’s degraded air quality, puts Kern residents at considerable risk. Obvious loopholes in the California Air Resources Board’s oil and gas rule must be addressed immediately, and revised to prevent the cumulative impact of multiple exposure sources from causing additional documented negative health impacts. Additionally Kern County’s proposed environmental impact report (EIR) would streamline the approval of an additional 67,000 new oil and gas wells in the County and thus further degrade air quality. It is crucial that the EIR is instead revised to eliminate extraction near sensitive populations. (For more details on this proposal, see our more in depth environmental justice analysis of Kern County and our article on the proposed EIR.)
In support of establishing new public health rules that protect Frontline Communities, Earthwork’s Community Empowerment Project, in collaboration with the Central California Environmental Justice Network and FracTracker Alliance, has focused on documenting the uncontrolled emissions from extraction sites within and surrounding the small city of Arvin, California. Using infrared cameras with state of the art optical gas imaging (OGI) technology, the team documented major leaks at multiple well-sites. Footage from Arvin spans the years from 2016-2020. A collection of this footage has been compiled into the interactive story map that follows.
Toxic Emissions Filmed at Oil and Gas Wells in Arvin, CA
This StoryMap explores how current California regulations fail to stop emissions from tanks on oil and gas well-sites by looking at examples of emissions from well-sites in Arvin, California. Place your cursor over the image and scroll down to advance the StoryMap and explore a series of maps charting the fracking-for-plastic system. Click on the icon in the bottom left to view the legend.
The cases of uncontrolled emissions in the story map provides just an example of the inventory of uncontrolled emissions sources in Kern County, and California at large. Finding and filming emissions sources while using OGI cameras in California is not at all uncommon, otherwise there would not be seven prime examples just in the City of Arvin. Prior to 2018, emissions from these well-sites went completely unregulated. While the California oil and gas rule (COGR) was developed to address greenhouse gas emissions from small sources, certain aspects of the rule are not being enforced by the local air districts. Rather than requiring tanks to have closed evaporation systems the air districts allow operators to set pressure/vacuum hatches to open and emit toxic and carcinogenic vapors when pressure builds inside tanks. While this is a safety mechanism on tanks, in practice it allows tanks to be consistent sources of exposure that put neighboring communities at risk. Specifically, California Code of Regulations, Title 17, Division 3, Chapter 1, Subchapter 10 Climate Change, Article 4, § 95669, Leak Detection and Repair, Paragraph I states that “Hatches shall remain closed at all times except during sampling, adding process material, or attended maintenance operations.”
While the COGR rule is a step in the right direction to reduce emissions, oil and gas’s legacy of degradation to ambient air quality has placed the Central Valley in the worst categories for these pollutants in the country. This puts Kern residents at considerable risk. The local health department continues to report improved conditions and increased numbers of healthy air days, but the truth is the mean, median and maximum values of ozone concentrations at US EPA monitoring locations in Kern County have remained relatively constant at harmful levels from 2015-2019. Expanding the data to 2020 shows a two sharp decreases in ambient levels of pollutants that correspond to decreases in reported production volumes for the county. The first decrease in 2016 corresponds to a drop in production following the institution of State Bill requirements for fracking permits. The decrease in 2020 is a result of the slowed production and burning of fossil fuels related to the Covid-19 Pandemic, as shown below in Figure 1.
Figure 1. Plot of annual Maximum 1 hour Ozone concentrations at all monitoring locations in western Kern County. Ozone concentrations are presented in parts per million. Annual trends in ambient concentrations of ozone. Note the decrease in concentrations in 2016 and in 2020. Both events correlate to decreases in production.
Using the U.S. EPA’s AirData mapping portal, air quality data for Kern County was exported, compiled and plotted to show trends over time. Above in Figure 1, annual ambient concentrations of ozone are shown. The trends of ambient concentrations follow similar trends in the spatial and temporal distribution of CalGEM reported production volumes. FracTracker Alliance is conducting more thorough analyses of these correlations, so stay tuned for future reports.
The locations of these monitoring locations are shown below in the map in Figure 2. Note that there are not any monitors in northwestern Kern, near large oil fields including North Belridge and Lost Hills. The communities near these fields, such as the City of Lost Hills are predominantly Latinx with elevated levels of linguistic isolation and poverty.
Figure 2. Map of Air Quality Monitors in Kern County.
Conclusion
Permitting new oil and gas wells in Kern County is certain to degrade the already harmful local and regional ambient air quality of the Central Valley. Kern County’s proposed EIR, as it stands will streamline an additional 67,000 sources of VOCs to the inventory of emissions already impacting communities. The health impacts from concentrations of ozone are well established, and the release of VOCs are major risk driver for communities living closest to oil and gas extraction operations as well as for regional public health. Together, these primary and secondary pollutants create a major risk driver for Kern County communities. Globally, these emissions are responsible for upwards of 8 million premature deaths annually. The burden on Frontline Communities in Kern County is likely much higher, and will only grow if the currently drafted EIR is passed. Additional air quality monitoring stations in northwestern Kern County should be installed immediately to help track air quality impacts.
To reduce this harm to Frontline Communities, California Senator Scott Weiner has submitted a new senate bill. Senate Bill 467 would stop the issuance of hydraulic fracturing permits and create a public health setback distance of 2,500 feet from homes, schools and other health care facilities for all new drilling permits. The bill would also create a program to provide new training and job opportunities for workers who would be negatively impacted by the bill. Senate Bill 467 provides the first step for a green transition away from the health impacts resulting from fossil fuel industries.
The Take Away
Built on sound data and ample research, FracTracker recommends the following measures be taken to protect the health of California’s overburdened Frontline Communities: Kern County should revise its environmental impact report to address the onslaught of harmful oil and gas emissions (EIR), California Air Resources Board’s oil and gas rule should close its loophole allowing emissions from the pressure/vacuum hatch on the tank to be exempt from regulation, and legislators should educate themselves on the importance of 2,500 foot setbacks requirements for oil and gas wells.
References & Where to Learn More
FracTracker’s public comments regarding recommendations to modify the Kern County Draft Environmental Impact Report (EIR): https://www.fractracker.org/a5ej20sjfwe/wp-content/uploads/2021/03/Kern.EIR_.comments_FracTrackerAlliance_3.8.21_compressed.pdf
A new collaboration between FracTracker Alliance and Algalita is aiming to help middle school and high school students understand the connection between plastics and fracking — and the wide ranging implications for climate change, environmental injustice, and human health.
Most young people today understand that plastics are problematic. But, there is still often a disconnect between the symptom of plastics in our oceans, and the root causes of the problem. Algalita’s mission is to empower a new generation of critical thinkers to shift the broken and unjust systems that are causing the plastic pollution crisis. Algalita’s strategy is creating educational experiences directly with the movement’s diverse leaders, and this new project with FracTracker is a perfect example.
Specifically, Algalita and FracTracker have been working together to add new lessons to Algalita’s brand-new online, gamified, action platform: Wayfinder Society. Through this program, students can guide their own exploration of the complexities of the plastics issue, and can take action at their own pace and scale, by completing lessons and action-items (called Waymarks) based on difficulty, topic, and type of impact.
The first of two FracTracker Waymarks outlines the connection between fracking and plastic production. Students explore a map showing the full plastics production process from fracking pads, to pipelines, to ethane crackers, and packaging factories.
In a second Waymark that builds off of the first, students explore the massive petrochemical buildout on the Gulf Coast and in the Ohio River Valley. The map allows students to analyze the greenhouse gas emissions predicted for this buildout using the data point pop-up boxes. They can also examine the effects of climate change on communities amongst the buildout by viewing the coastal flood zone areas in Texas and Louisiana. Beyond that, students can investigate how facilities are impacting their peers in schools close to massive ethane cracker facilities. Finally, students are introduced to the movement’s #PlasticFreePresident Campaign, giving them a direct action to apply their new knowledge.
Mapping Fracking’s Link to Plastic Production
This StoryMap was created by FracTracker for Wayfinder Society, a program by Algalita. Learn more at Algalita.org. Place your cursor over the image and scroll down to advance the StoryMap and explore a series of maps charting the fracking-for-plastic system. Click on the icon in the bottom left to view the legend. Scroll to the end of the StoryMap to learn more and access the data sources.
Algalita is excited about this partnership for so many reasons. For one, GIS is a critical skill for young people to learn. These two Waymarks pose an accessible and non-intimidating introduction to ArcGIS by using simple maps and StoryMaps like the one above. The maps let students get comfortable with GIS concepts and capabilities like layers, data attribute tables, measuring tools, and filters. Allowing students to explore how plastics are produced through a geographical lens provides a unique visual and interactive experience for them. The goal is for students to be able to connect petrochem buildout, with the plastics, climate and justice issues that they are focusing on — often separately. Our aim is that by putting this part of the story in context of real physical space they will more easily make those connections. We hope these lessons spark some students’ interest in mapping, geography, and GIS, providing a new generation of changemakers with GIS in their toolbox.
On top of that, we are stoked to be building this partnership with FracTracker because the success of our collective movement depends on strong, clear communication and synergies between the nodes of the movement’s network. The FracTracker Waymarks give our Wayfinders direct access to real-time data, visualizations, and expert insights that they can then use to level-up their actions and stories around their activism. And, they connect the dots not just for students, but also for educators and movement partners like us at Algalita — we are all for this powerful lever for change!
Check out Wayfinder Society here. Access the FracTracker Waymarks here and here— but you’ll need to be logged in. If you’re a student, get started by creating a profile, and then start earning Cairns (points)! If you’re an educator, parent or mentor, and interested in exploring the site, email us here for the guest login.
By Anika Ballent, Education Director, Algalita
Algalita empowers a new generation of critical thinkers who will shift the broken and unjust systems that are causing the plastic pollution crisis. We do this by offering educational experiences created directly with the movement’s diverse leaders.
Anika has been working in the movement against plastic pollution for ten years, studying microplastics in benthic and freshwater environments. She brings together her science background and creativity to educate young changemakers through hands-on experiences in schools, Algalita’s International Youth Summit, and online programs.
All other data points were mapped by FracTracker Alliance referencing various online sources. While this map is based on actual infrastructure, it is intended as a model of the fracking-for-plastic lifecycle and certain steps may vary in real life.
Access to reliable data is crucial to our understanding of risky fracking waste disposal, and in turn, our ability to protect public health. But when it comes to oil and gas liquid waste disposal wells in Pennsylvania, despite monitoring by two separate agencies, we are left with an incomplete and inaccurate account.
If we were to emulate the Charles Dickens classic, this article might begin, “It was the best of datasets, it was the worst of datasets.” Unfortunately, even that would be too generous when it comes to describing available data around oil and gas liquid waste disposal wells in Pennsylvania. To fully understand the legacy and current state of these wells, it is necessary to query the two agencies that have a role in overseeing them, the United States Environmental Protection Agency (EPA) and the Pennsylvania Department of Environmental Protection (DEP).
Given the relatively small inventory of these wells compared to other oil and gas producing states, the problems with the two datasets are enormous. Before jumping into these issues, however, it would be useful to review the nature of these wells, why there are two regulatory agencies involved, and why there are so few of them in Pennsylvania in the first place, relatively speaking.
Disposal Wells Categories
To further our industrial exploits of the planet, humans have found it useful to inject all kinds of things into the earth. In the United States, this ultimately falls under the jurisdiction of EPA’s Underground Injection Control (UIC) program, and the point of injection is known as an injection well. Altogether, there are six classes of injection wells, with those related to oil and gas operations falling into Class II.
There are three categories of Class II injection wells, including waste disposal, enhanced recovery, and hydrocarbon storage. There is also an infamous exemption known as the “Haliburton Loophole,” which has allowed oil and gas companies to inject millions of gallons of hydraulic fracturing fluid into oil and gas wells in order to stimulate production without any federal oversight at all.
When most people speak of “injection wells” in an oil and gas context, they are usually referring to waste disposal wells, and this is our focus here. This well type is also referred to as Class II-D (disposal) and salt water disposal wells (SWD). This latter term is used by a majority of state regulators, so we will use that abbreviation here, even though considering this type of toxic and radioactive fluid “salt water” is surely one of the industry’s most egregious euphemisms.
Dealing with Dangerous Fluids
There are two main types of liquid waste that are disposed of at SWD injection wells. As always, these waste types have a number of different names to keep everyone on their toes but for the sake of simplicity will call them “flowback” and “brine,” and both are problematic materials to handle. Additionally, the very act of industrial-scale fluid injection presents problems in its own right.
As mentioned above, when operators pump a toxic stew of water, sand, and chemicals into a well to stimulate oil and gas production, that mixture is known as hydraulic fracturing fluid, or fracking fluid. Some of these chemicals are so secretive that even the operators of the well don’t know what is included in the mix, let alone nearby residents or first responders in the event of an incident.
Between 10% and 100% of this fluid will return to the surface, and is then known as flowback fluid, becoming a waste stream. In Pennsylvania, the average amount of fracking fluid injected into production wells exceeds 10 million gallons in recent years according to data from the industry’s self-reporting registry known as FracFocus. With more than 12,000 of these wells drilled statewide, disposing of this waste stream becomes an enormous concern.
In addition to flowback fluid, there are pockets of ancient fluids encountered by the drilling and fracking processes that return to surface as well. These solutions are commonly referred to as brine due to their extremely high salt content, although this is not the type of fluid that you’d want to baste a Thanksgiving turkey with. Total salt concentrations can reach up to 343 grams per liter, roughly ten times the salt concentration of sea water. These brines include but are not limited to the familiar sodium chloride that we use to season our food, but include other components as well, including significant bromide and radium concentrations.
When Pennsylvania experimented with our public health by authorizing disposal of these fracking brines in municipal plants designed to treat sewer sludge, the bromides in that drilling waste stream became problematic as they interacted with disinfectants to cause a cancerous class of chemicals known as trihalomethanes. This ended the practice of surface “treatment” from these sites into streams in 2011, and along the way caused many water authorities to switch from chlorine to chloramine disinfectant processes. This, in turn, may have exacerbated lead exposure issues in the region, as the water disinfected with chloramine often eats away at the calcium scale deposits covering lead pipes and solder in the region’s older homes.
Marcellus and Utica wastewater are also very high in a radioactive isotope of radium known as Ra-226, which has a half-life of 1600 years. After that amount of time, half of the present radium will have emitted an alpha particle, which can cause mutations in strands of DNA when introduced inside the body, through contaminated drinking water, for example. After the hazardous expulsion of the alpha particle, the result become radon gas, which is estimated to cause 20,000 lung cancer deaths per year in the United States. Further down the decay chain is Polonium 210, which was infamously used in the assassination of Russian spy Alexander Litvinenko in London in 2006.
None of this should be injected into formations beneath people’s homes, near drinking water supplies, streams, or really anywhere that we aren’t comfortable sacrificing for the next few thousand years.
On top of all the problems with the water chemistry of both produced water and brine, the very act of injecting these fluids into the ground has triggered a large number of earthquakes in areas with frequent or large volumes of waste injection. This human-caused phenomenon is known as induced seismicity. The most well-known example of this is the previously stable state of Oklahoma which surged to have more magnitude 3.0+ earthquakes than California for a number of years during a drilling boom in that region. The largest of these was the magnitude 5.8 Pawnee earthquake in 2016.
Figure 3. PA Earthquakes and Potential Causes: 1/2000 – 2/2021, Magnitude 2.0 or Greater. Most earthquakes in the eastern portion of the state are associated with Quaternary faults. In the western portion, the causes are less straightforward, and include zipper fracking, mine blasting or collapse, and faults that are more ancient and deeper than the Quaternary faults, many of which remain unmapped. As the use of SWD wells increases, seismic activity may increase as well.
Manmade earthquakes are not limited to Oklahoma. For example, there were approximately 130 seismic events in one year period in the Youngstown, Ohio area due to SWD activity, including one measuring 4.0 on the last day of 2011. Over the years, the regulatory reaction to induced earthquakes seems to walking along the slippery slope from “that can’t happen” to “that can’t happen here” to “they’re all small earthquakes” to “we can mitigate the impact,” despite all evidence to the contrary.
Two Regulators
So who gets to be in charge of this dumpster fire? As mentioned above, this is ultimately under the umbrella of EPA’s Underground Injection Control program. However, they have a complicated arrangement with the various states defining who has primary enforcement authority for this type of well.
In Pennsylvania, such wells must obtain a permit from EPA before obtaining a second permit from DEP. In a 2017 hearing in Plum Borough, Allegheny County, furious residents concerned with a variety of issues with a proposed SWD well were told that in Pennsylvania, EPA could only consider whether or not the well would violate the 1972 Clean Water Act when considering the permit, and that the correct audience for everything else would be DEP. Both permits for this well that is near and undear to me were ultimately issued, and operations are expected to begin in the next month if Governor Wolf does not instruct the DEP to reconsider their permit.
There is some precedent for overturning such a permit. In March of 2020, DEP yanked a permit for a SWD well in Grant Township, Indiana County, suddenly respecting a home-rule charter law that the agency had previously sued the Township over.
Without the prospect of royalties or impact fees, no community wants these wells and regulators know that they are nothing but problems. However, the reality is that the regulators oversee an industry that produces a tsunami of this toxic waste – more than 61.8 million barrels of it from unconventional wells in Pennsylvania in 2020 according to self-reported data, which is almost 2.6 billion gallons of the stuff, or slightly more than the capacity of Beaverdam Run Reservoir in Cambria County, a 382 acre lake with an average depth of 20 feet.
Unsuitable Geography
Nationally, injection wells are quite common, with over 740,000 such wells in the EPA inventory for 2018 and Class II (O&G) wells represent about a quarter of this figure. Of these Class II injection wells, roughly 20% are for fluid disposal, giving us an estimated 37,000 SWD wells nationwide. This number is expected to go up, as more than three-quarters of the 8,600 permits issued in 2018 were for oil and gas purposes.
However, in Pennsylvania, there have been quite few of these, compared to other states. The primary reason for this is its geology, which has largely been considered unsuitable for this type of activity. For example, a 2009 industry analysis states:
“The disposal of flowback and produced water is an evolving process in the Appalachians. The volumes of water that are being produced as flowback water are likely to require a number of options for disposal that may include municipal or industrial water treatment facilities (primarily in Pennsylvania), Class II injection wells [SWDs], and on-site recycling for use in subsequent fracturing jobs. In most shale gas plays, underground injection has historically been preferred. In the Marcellus play, this option is expected to be limited, as there are few areas where suitable injection zones are available.”
I discussed this topic in a phone call with an official from EPA, who largely confirmed this point of view, but preferred the phrase, “the geology is complicated” instead of the word “unsuitable.” When the UIC program was established from the 1974 Safe Drinking Water Act, there were only seven such wells in operation, and according to EPA’s data, there were still just 11 active SWD wells in the Commonwealth but with more on the way. I was cautioned that the geology wasn’t the only reason, however. Neighboring Ohio had hundreds of these wells, many of which are clustered close to the border with Pennsylvania. The two states have different primacy and permitting arrangements, which is a factor as well.
I have not come across sources mentioning why Pennsylvania’s geology was so unsuitable – or complicated, if we are being generous. However, there are numerous widespread issues that could be a factor, including voids created by karst and legacy coal mines, and formations that might have otherwise trapped gasses and fluids being punctured with up to 760,000 mostly unplugged oil and gas wells and more than one million drinking water wells.
Even when these fluids have been pumped deep underground, they are not necessarily out of sight and out of mind. For example, an abandoned well in Noble County Ohio suddenly began spewing gas field brine just a few weeks ago, resulting in a fish kill in a nearby stream. The incident is believed to be related to SWD wells in the general vicinity even though the closest of these is miles away from the toxic geyser. The waste fluids injected beneath the surface will exploit any pathway available through crumbling or porous rocks to alleviate the pressure built up from the injection process. These fluids don’t care whether the target is an old gas well, mine void, or drinking water aquifer.
Of course, we could ask the question in reverse, and ask what makes the injection of oil and gas fluids suitable in other locations, and the aggregated evidence would lead us to “nothing” as our answer. Nothing, other than the fact that drilling and fracking produces billions of gallons of liquid waste, and that it has to go somewhere.
Although EPA play a major role in permitting and regulating SWD wells in Pennsylvania, they do not publish data related to these wells on their website. FracTracker started hearing rumors about a spate of new SWD permits all over the state that were not accounted for in DEP data. As it turns out, many of these turned out to be other oil and gas wastewater processing facilities, and the public’s confusion about these is completely understandable because these facilities lacked the proper public notice process. These facilities are concerning in their own right – and residents of Pennsylvania should look here to see if one of these 49 facilities are in their neighborhoods – but these are not disposal wells.
To clear up the confusion, I submitted a Freedom of Information Act request to EPA for a spreadsheet of their Class II injection wells in Pennsylvania. This was apparently an onerous task that would require more than ten hours of labor on their behalf. When I mentioned that I was mostly interested in disposal wells, that sped the process up considerably.
Ultimately, I received a portion of the data fields that I had asked for.
Asked For
Received
Well Name
Yes
Well API Number
Yes
Class II Category (disposal, recovery, storage)
No
Date application received
No
Application status (e.g., pending, complete)
Yes
Application result (e.g., approved, rejected)
No
Application result date (date of EPA’s decision)
No
Well status (e.g., active, plugged)
Yes
Well county name
Yes
Well municipality name
No
Well latitude
Yes
Well longitude
Yes
Table 1 – Summary of fields requested and received in FracTracker’s FOIA submission with EPA.
I started to compare the EPA dataset to DEP’s SWD well dataset, which is a part of its conventional well inventory. Each source had 23 records. We were off to a good start, but this data victory turned out to be limited in scope as the discrepancies between the two datasets continued to grow. Inconsistencies between the two datasets are as follows:
County
DEP API
DEP Well Name
EPA API Match
EPA Name Match
Notes
Allegheny
003-21223
SEDAT 3A
Y
Y
Armstrong
005-21675
HARRY L DANDO 1
Y
Y
Beaver
007-20027
COLUMBIA GAS OF PENNA INC CGPA5
Y
Y
Bedford
009-20039
KENNETH A DIEHL D1
N
N
Not on EPA List
Cambria
021-20018
THE PEOPLES NATURAL GAS CO 4627X
N
N
Not on EPA list
Clearfield
033-27255
FRANK & SUSAN ZELMAN 1
N
Y
DEP / EPA API Number mismatch
033-27257
POVLIK 1
N
Y
No EPA API No.
033-00053
IRVIN A-19 FMLY FEE A 19
Y
Y
033-22059
SPENCER LAND CO 2
Y
Y
Elk
047-23835
FEE SENECA RESOURCES WARRANT 3771 38268
Y
Y
047-23885
FEE SENECA RESOURCES WARRANT 3771 38282
N
Y
DEP / EPA API Number mismatch
Erie
049-24388
NORBERT CROSS 2
Y
Y
049-20109
HAMMERMILL PLT 1
N
N
Not on EPA List
049-00013
HAMMERMILL 3
N
N
Not on EPA List
049-00012
HAMMERMILL 1
N
N
Not on EPA List
Greene
N
N
Not on DEP list. EPA Permit PAS2D210BGRE – no API to match
Indiana
063-31807
MARJORIE C YANITY 1025
Y
Y
063-20246
T H YUCKENBERG 1
Y
Y
Somerset
111-20059
W SHANKSVILLE SALT WATER DISP 1
Y
N
111-20006
MORRIS H CRITCHFIELD 1
Y
N
Potter
105-20473
H A HEINRICK RW-55
CA
Y
Category Anomaly – Not on DEP SWD list – does appear as Plugged OG Well (consistent w/ EPA status notes)
Venango
121-44484
LATSHAW 9
Y
Y
Warren
123-39874
BITTINGER 4
N
Y
API Mismatch (But does match Bittinger #1) Lat/Long match site name
123-33914
JOSEPH BITTINGER 1
N
Y
API Mismatch (But does match Bittinger #4) Lat matches site name, Long slightly off
123-33944
JOSEPH BITTINGER 2
Y
Y
123-33945
JOSEPH BITTINGER 3
CA
Y
Category Anomaly – Not on DEP SWD list – does appear as “Injection”
123-34843
SMITH/RAS UNIT 1
CA
Y
Category Anomaly – Not on DEP SWD list – does appear as “Observation”
123-22665
LEROY STODDARD & FRANK COFFA 1 WELL
N
N
Not on DEP list of all wells. Does appear on eFACTS. No location data
Table 2 – Discrepancies between EPA and DEP data for SWD wells in PA.
Altogether, there was at least one data discrepancy on 17 out of 28 wells (61%) on the combined inventories, and this is allowing for significantly different formatting of the well’s name. The DEP list contained five records that were not on the EPA dataset at all, four records where the well’s API number did not match, three instances where the DEP well type was different from EPA’s listing, two wells with matching API numbers but different well names, two wells that were missing the API number on the EPA list, and one well that was on the EPA list that I have not been able to find in any of DEP’s inventories. These last two wells could not be mapped due to the lack of location data.
It isn’t always possible to know which dataset is erroneous, but the EPA list has several obvious omissions and one instance where the API number and well name are in the wrong columns. The quality of DEP data has improved over the years and appear to have some data controls in place to avoid some of these basic errors. For that reason, I suspect that most of the problems stem from the EPA dataset, and I have used DEP coordinates to map these wells.
Waste Disposal Wells in Pennsylvania
This map contains numerous layers that explore the current state of Class II-D Salt Water Disposal (SWD) injection wells for oil and gas waste in Pennsylvania. View the map “Details” tab below in the top left corner to learn more and access the data, or click on the map to explore the dynamic version of this data.
In the early 1970s, it was recognized that industrial injection of oil and gas waste underground could lead to risks to human health and the environment, so several major protective laws were put in place, including the Clean Water Act of 1972, the Safe Drinking Water Act of 1974, and the Pennsylvania’s 1971 Environmental Rights Amendment. Decades later, it feels like the Pennsylvania Department of Environmental Protection and the United States Environmental Protection Agency don’t take their regulatory responsibilities very seriously when it comes to oil and gas liquid waste disposal wells. While the state does have fewer of this type of well than other states, there are five that are currently under construction, according to the EPA dataset. Many of these, like the Sedat 3A well in Allegheny County, have come after significant community opposition, and many of the residents’ concerns have not been addressed by either agency.
There will undoubtedly be more of these disposal wells proposed in the near future. Residents would do well to hassle their municipalities to update their ordinances for this type of well if they happen to live in a place where such ordinances are possible. Solicitors should be instructed to regularly scour the Pennsylvania Bulletin and be in contact with EPA for the earliest possible notification of a proposed site, so that there is time to respond within the comment periods.
Additionally, the sloppiness of the datasets calls all sorts of questions into play regarding the co-regulation of these wells. In the case of an incident, it’s not even clear that both agencies have the information on hand to even locate the site in the field. Meanwhile, a 61% error rate between the sites name, API number, and status does not inspire confidence that agencies are keeping a close eye on these facilities, to say the least.
Above all, we must all realize that it isn’t safe to assume that someone will let us know when these types of facilities are proposed. Regulators have shown us through their actions that they are thinking far more about the billions of gallons of waste that needs to be disposed of than of the well-being of dozens or even hundreds of neighbors near each toxic dump site.
References & Where to Learn More
Data supporting this article, as well as the static map in Figure 3, can be found here.
FracTracker Pennsylvania articles, maps, and imagery: https://www.fractracker.org/map/us/pennsylvania/
https://www.fractracker.org/a5ej20sjfwe/wp-content/uploads/2021/02/Waste-Disposal-Wells-in-Pennsylvania-feature-scaled.jpg6671500Matt Kelso, BAhttps://www.fractracker.org/a5ej20sjfwe/wp-content/uploads/2025/09/2025-Wordmark-Logo.pngMatt Kelso, BA2021-02-26 12:23:392021-04-15 14:08:41Pennsylvania’s Waste Disposal Wells – A Tale of Two Datasets
Kyle Ferrar, Western Program Coordinator for FracTracker Alliance, contributed to the December 2020 memo, “Recommendations to CalGEM for Assessing the Economic Value of Social Benefits from a 2,500’ Buffer Zone Between Oil & Gas Extraction Activities and Nearby Communities.”
The purpose of this memo is to recommend guidelines to CalGEM for evaluating the economic value of the social benefits and costs to people and the environment in requiring a 2,500 foot setback for oil and gas drilling (OGD) activities. The 2,500’ setback distance should be considered a minimum required setback. The extensive technical literature, which we reference below, analyzes health benefits to populations when they live much farther away than 2,500’, such as 1km to 5km, but 2,500’ is a minimal setback in much of the literature. Economic analyses of the benefits and costs of setbacks should follow the technical literature and consider setbacks beyond 2,500’ also.
The social benefits and costs derive primarily from reducing the negative impacts of OGD pollution of soil, water, and air on the well-being of nearby communities. The impacts include a long list of health conditions that are known to result from hazardous exposures in the vulnerable populations living nearby. The benefits and costs to the OGD industry of implementing a setback are more limited under the assumption that the proposed setback will not impact total production of oil and gas.
The comment letter submitted by Voices in Solidarity against Oil in Neighborhoods (VISIÓN) on November 30, 2020 lays out an inclusive approach to assessing the health and safety consequences to the communities living near oil and gas extraction activities. This memo addresses how CalGEM might analyze the economic value of the net social benefits from reducing the pollution suffered by nearby communities. In doing so, this memo provides detailed recommendations on one part of the broader holistic evaluation that CalGEM must use in deciding the setback rule.
This memo consists of two parts. The first part documents factors that CalGEM should take into account when evaluating the economic benefits and costs of the forthcoming proposed rule. These include factors like the adverse health impacts of pollution from OGD, the hazards causing them and their sources, and the way they manifest into social and economic costs. It also describes populations that are particularly vulnerable to pollution and its effects as well as geographic factors that impact outcomes.
The second part of this memo documents the direct and indirect economic benefits of the proposed rule. Here, the memo discusses the methods and data that should be leveraged to analyze economic benefits of reducing exposure to OGD pollution through setbacks. This includes the health benefits, impacts on worker productivity, opportunity costs of OGD activity within the proposed setback, and the fact that impacted communities are paying the external costs of OGD.
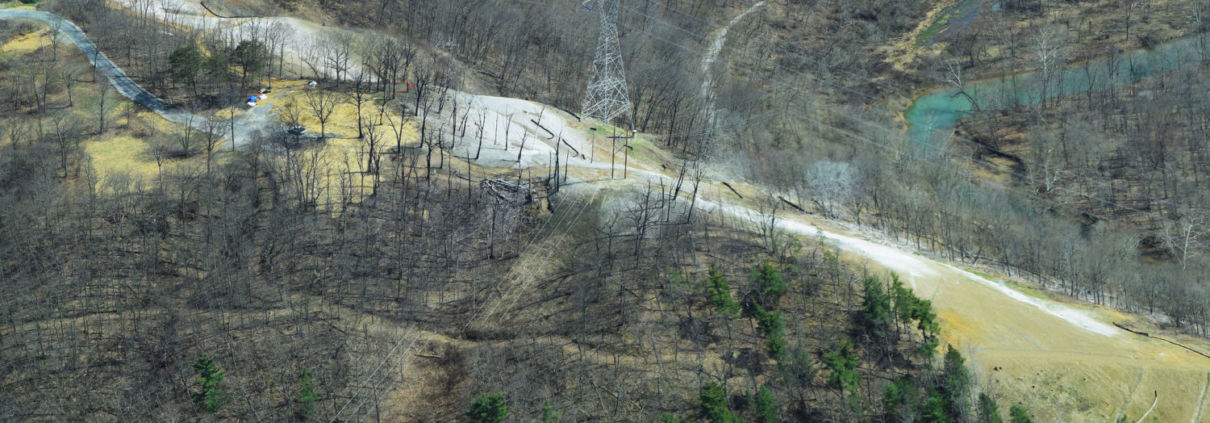
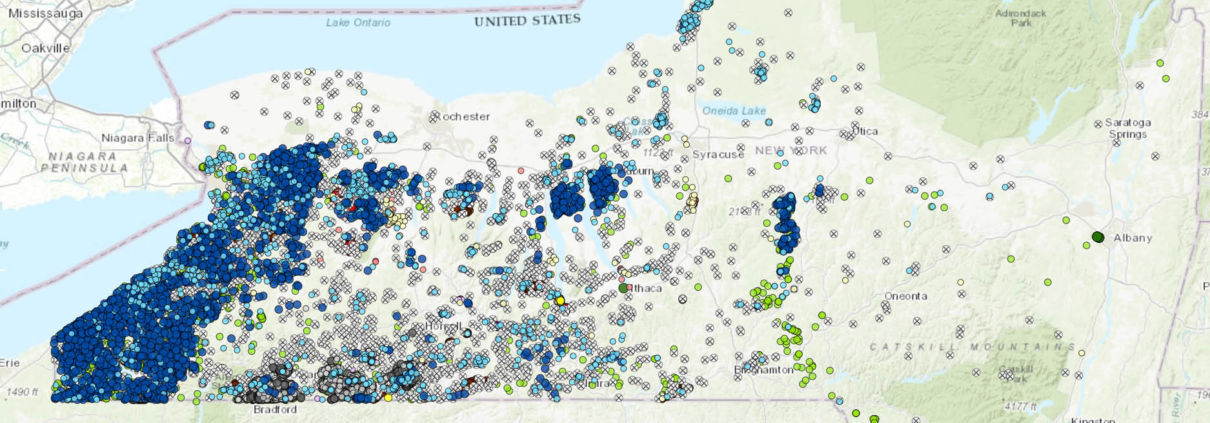
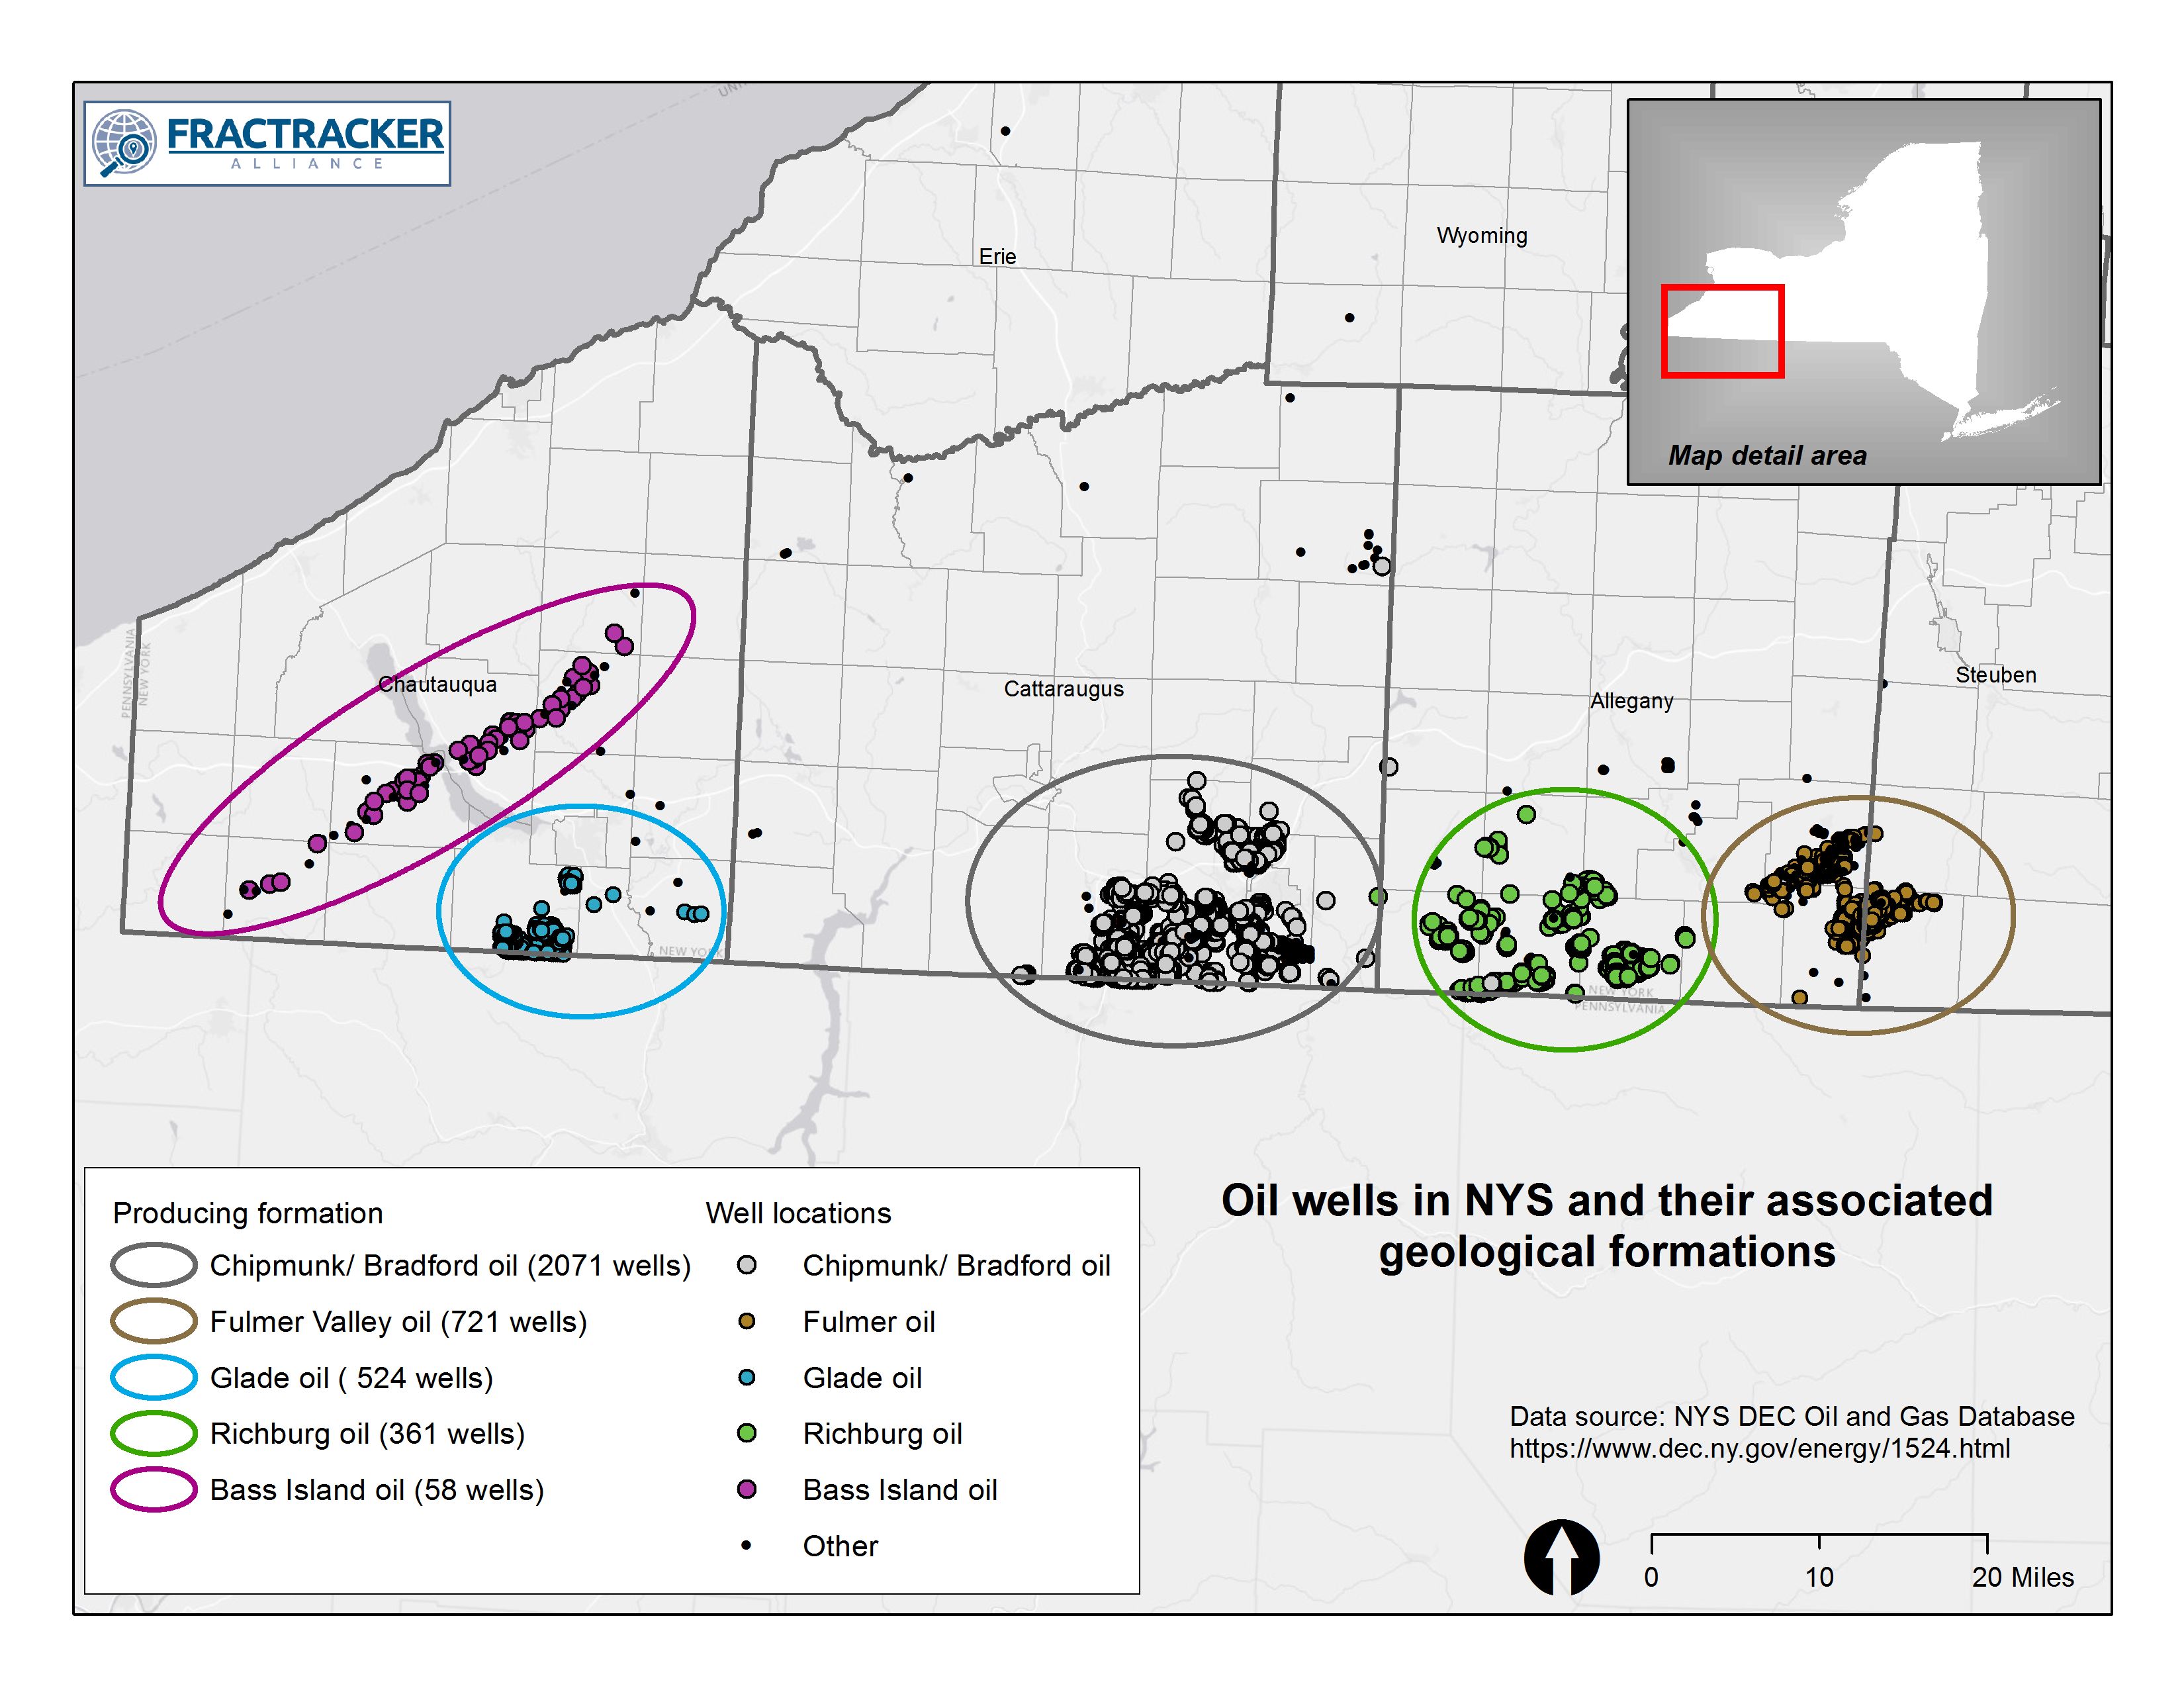 Figure 1. Oil Wells in NYS and Their Associated Geological Formations. Gas wells have historically been most productive in the Medina Formation, followed by the Queenston, and also Trenton-Black River Formations.
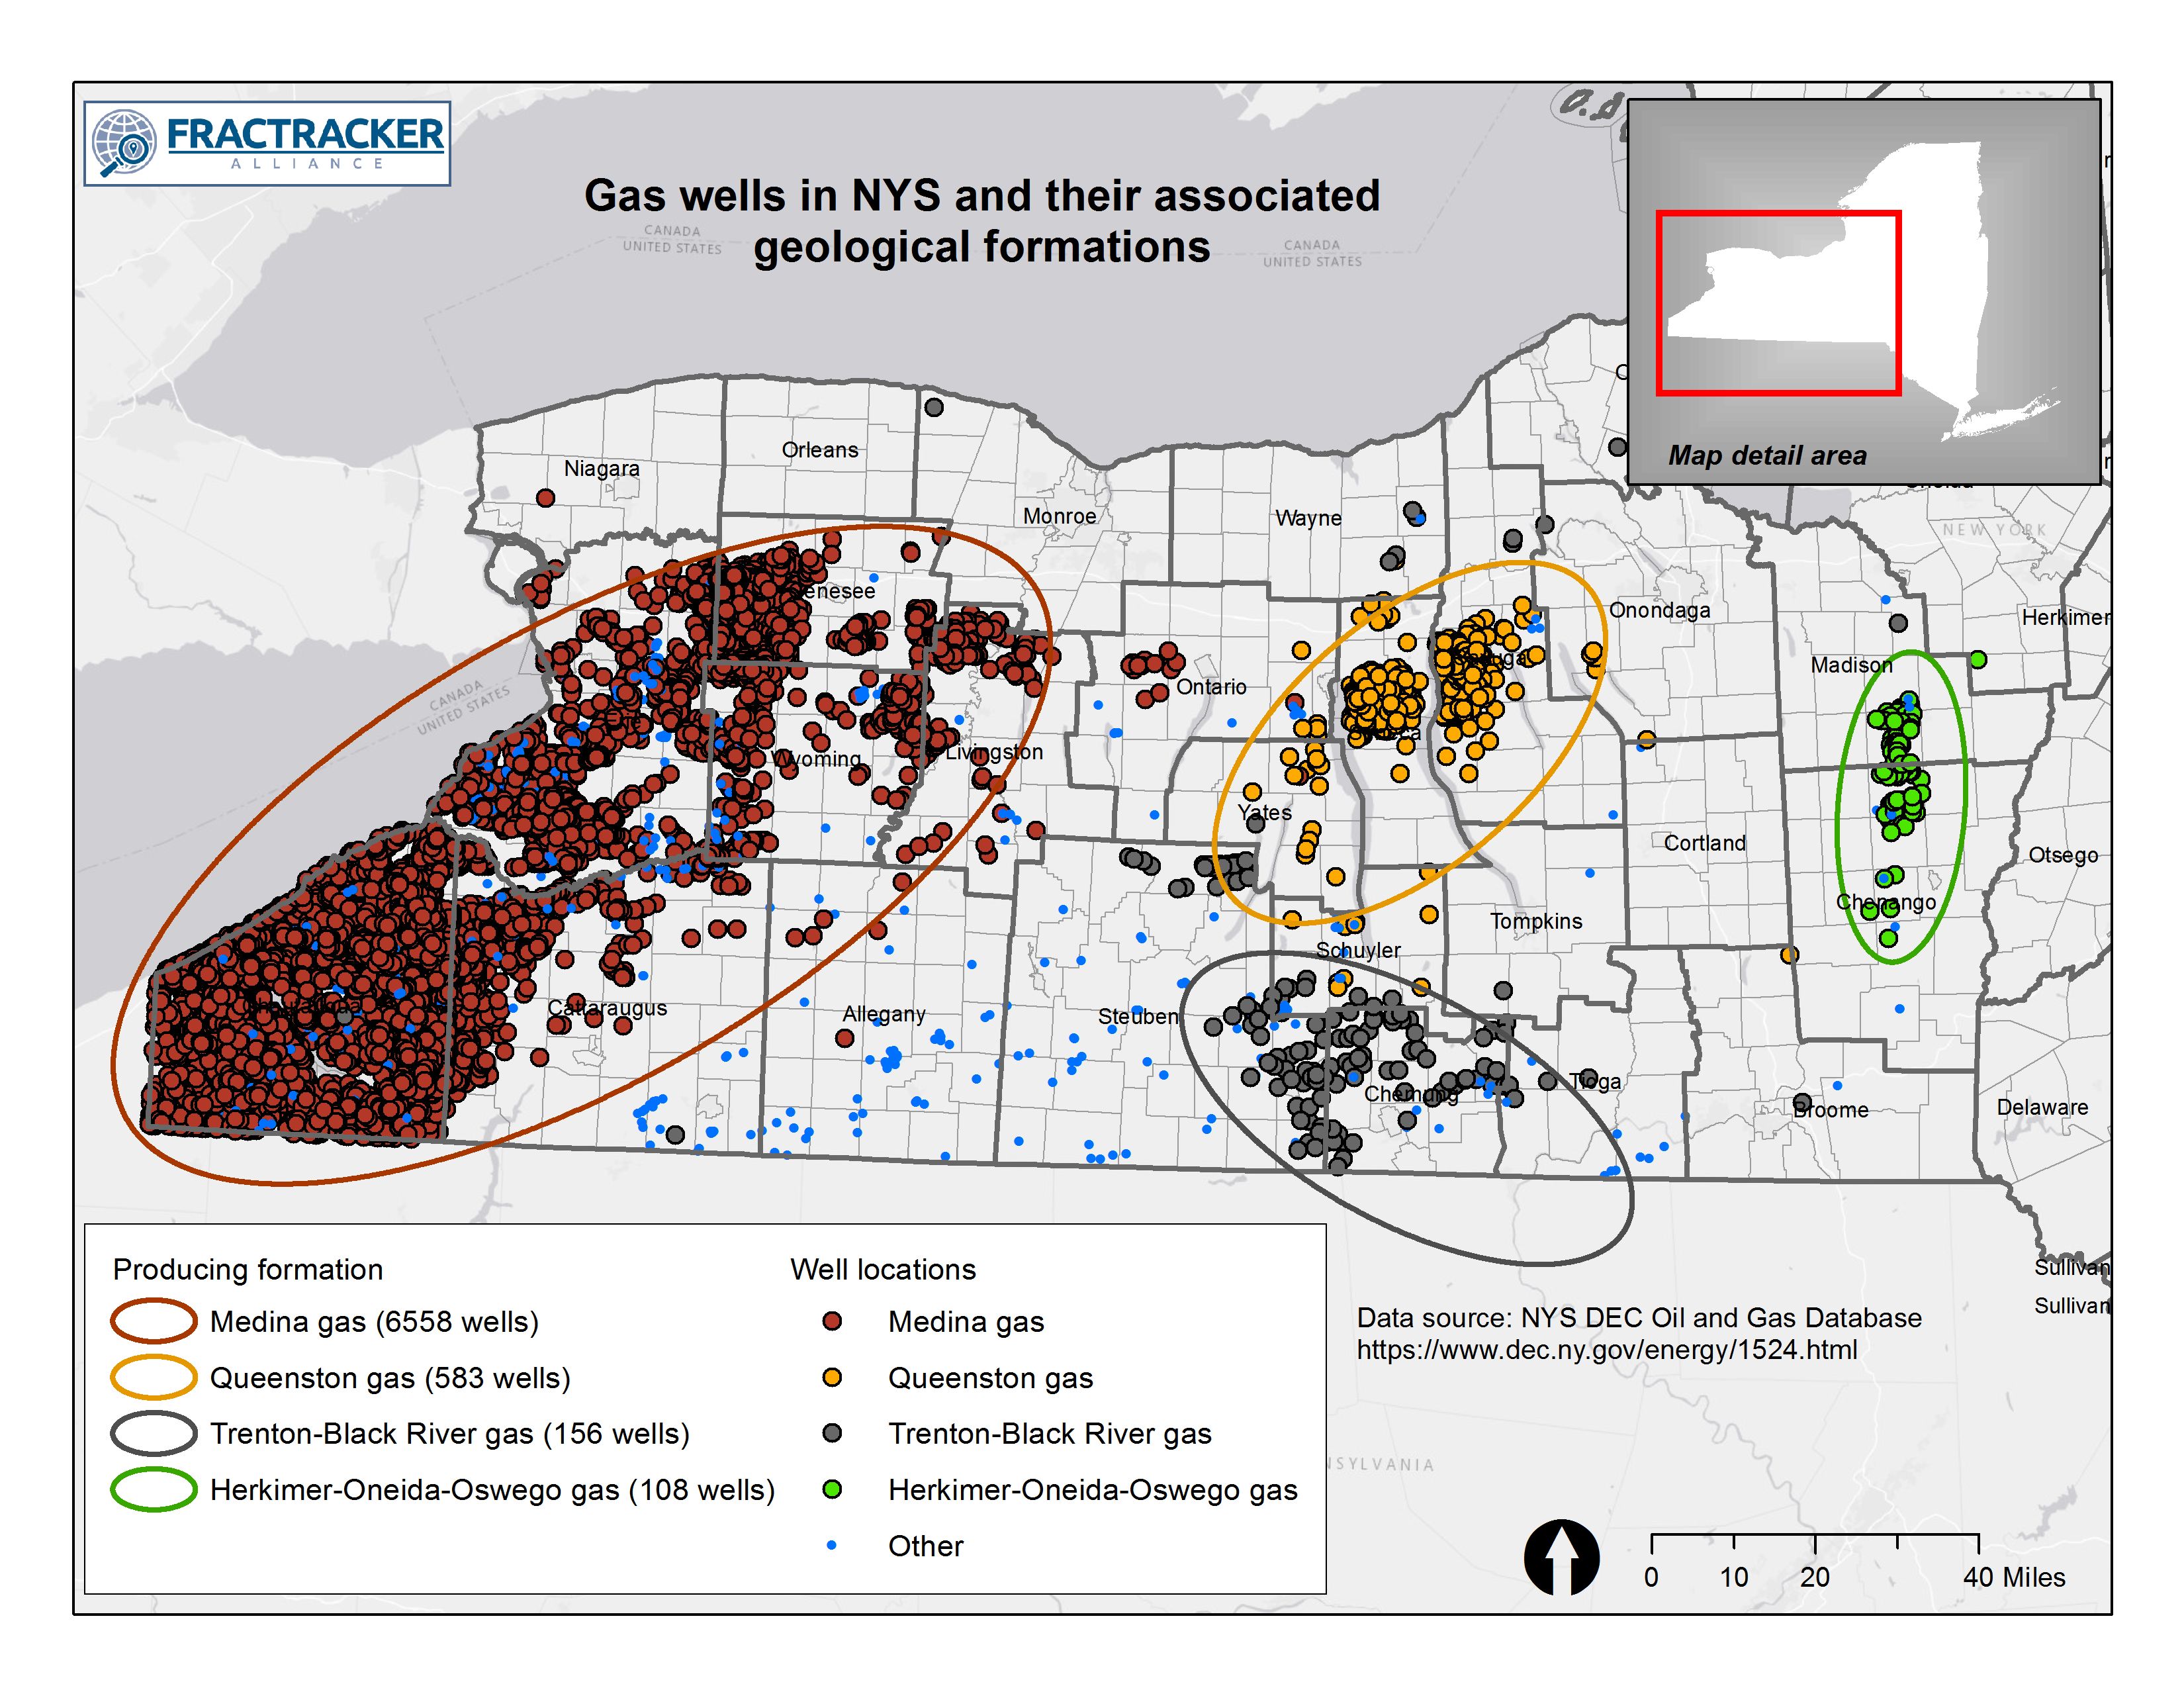
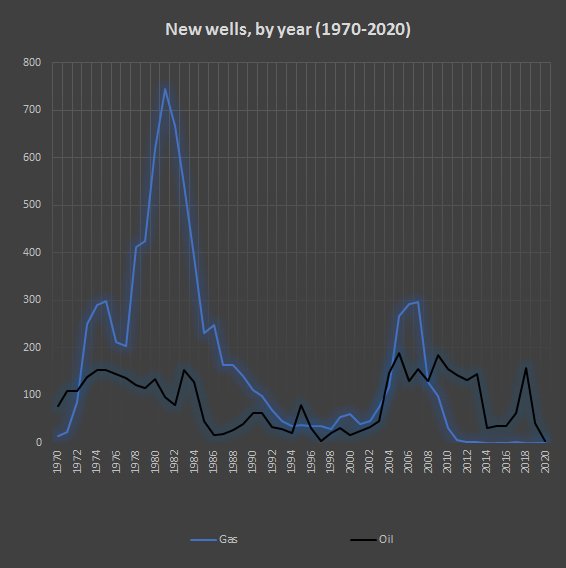
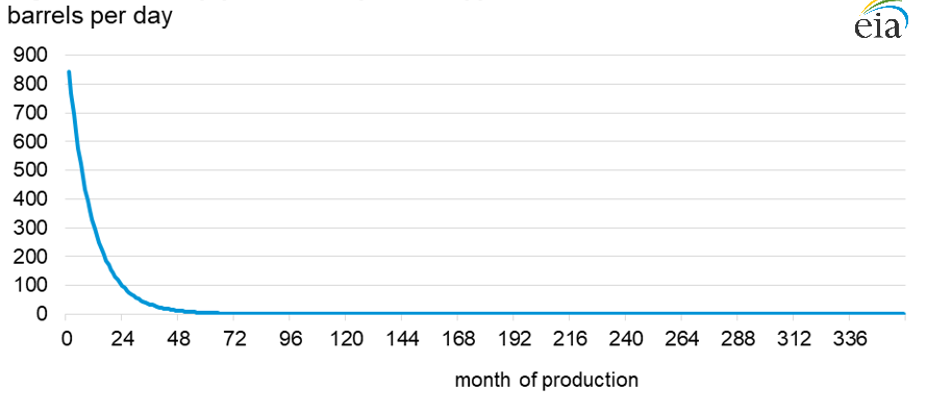
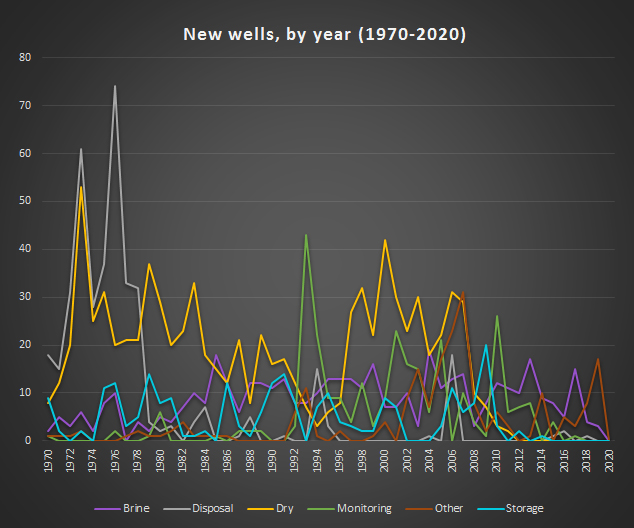
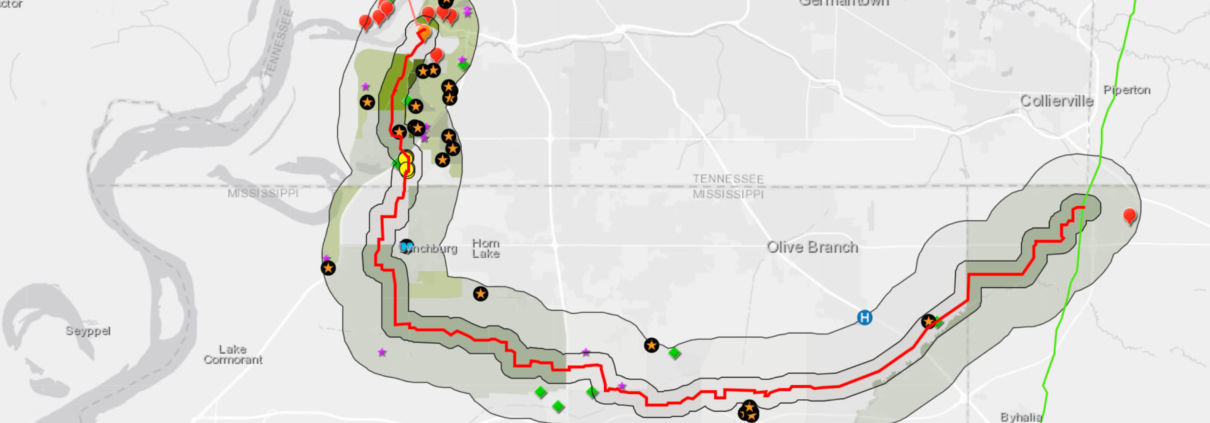
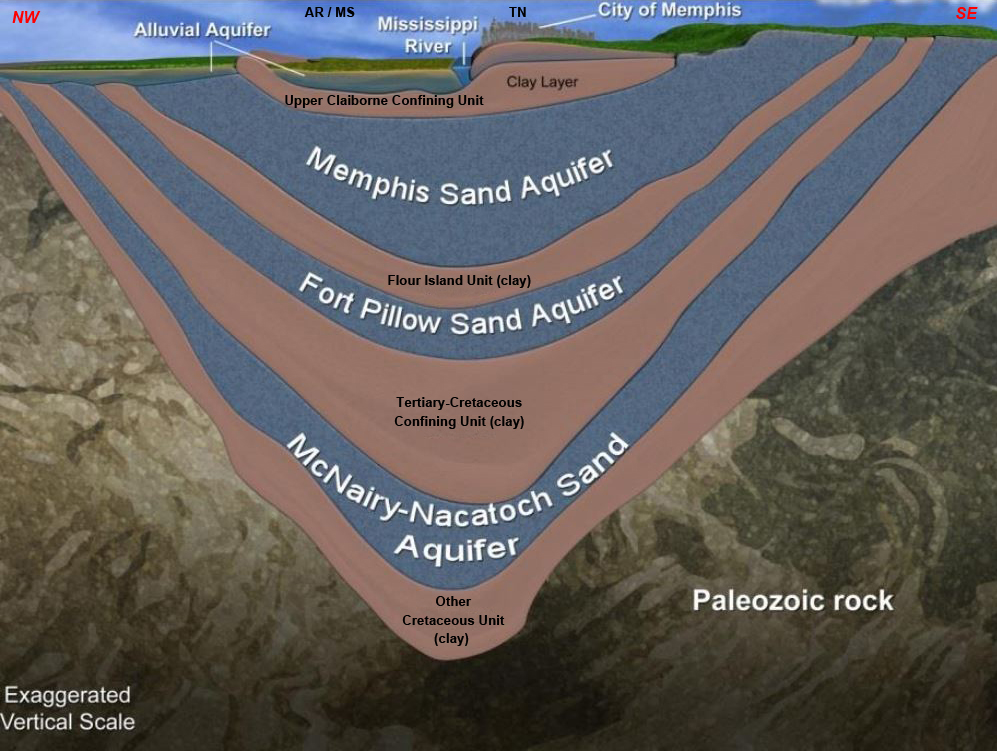
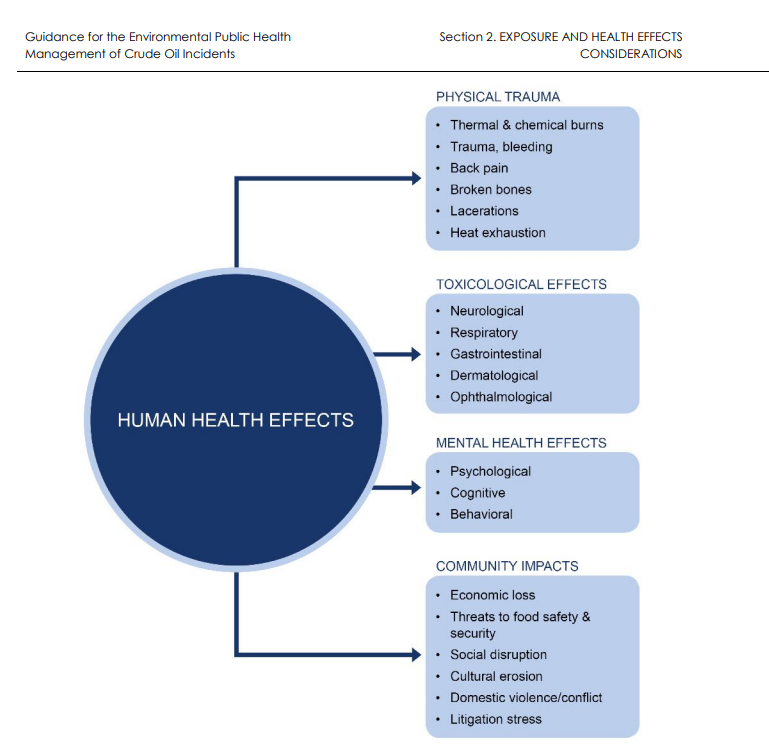
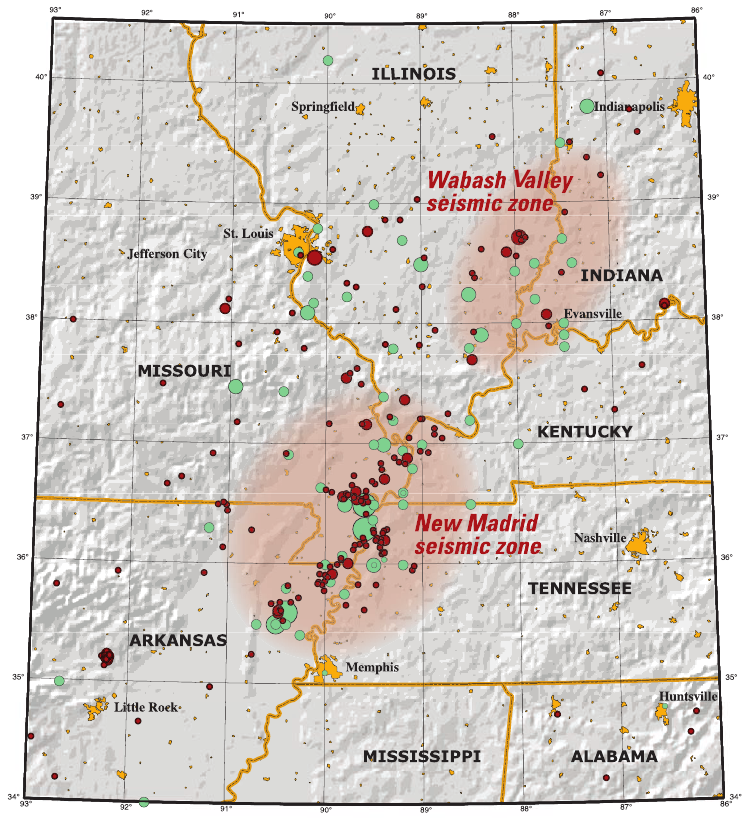

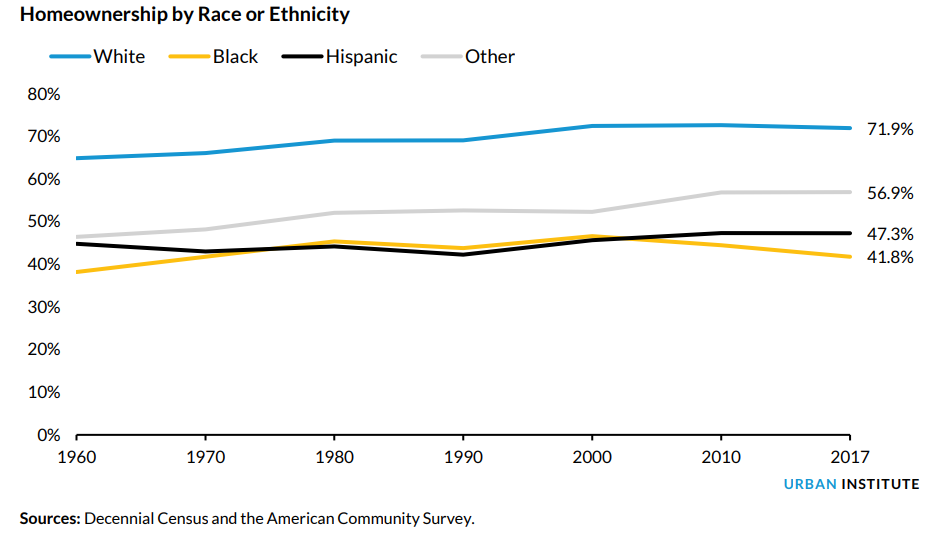
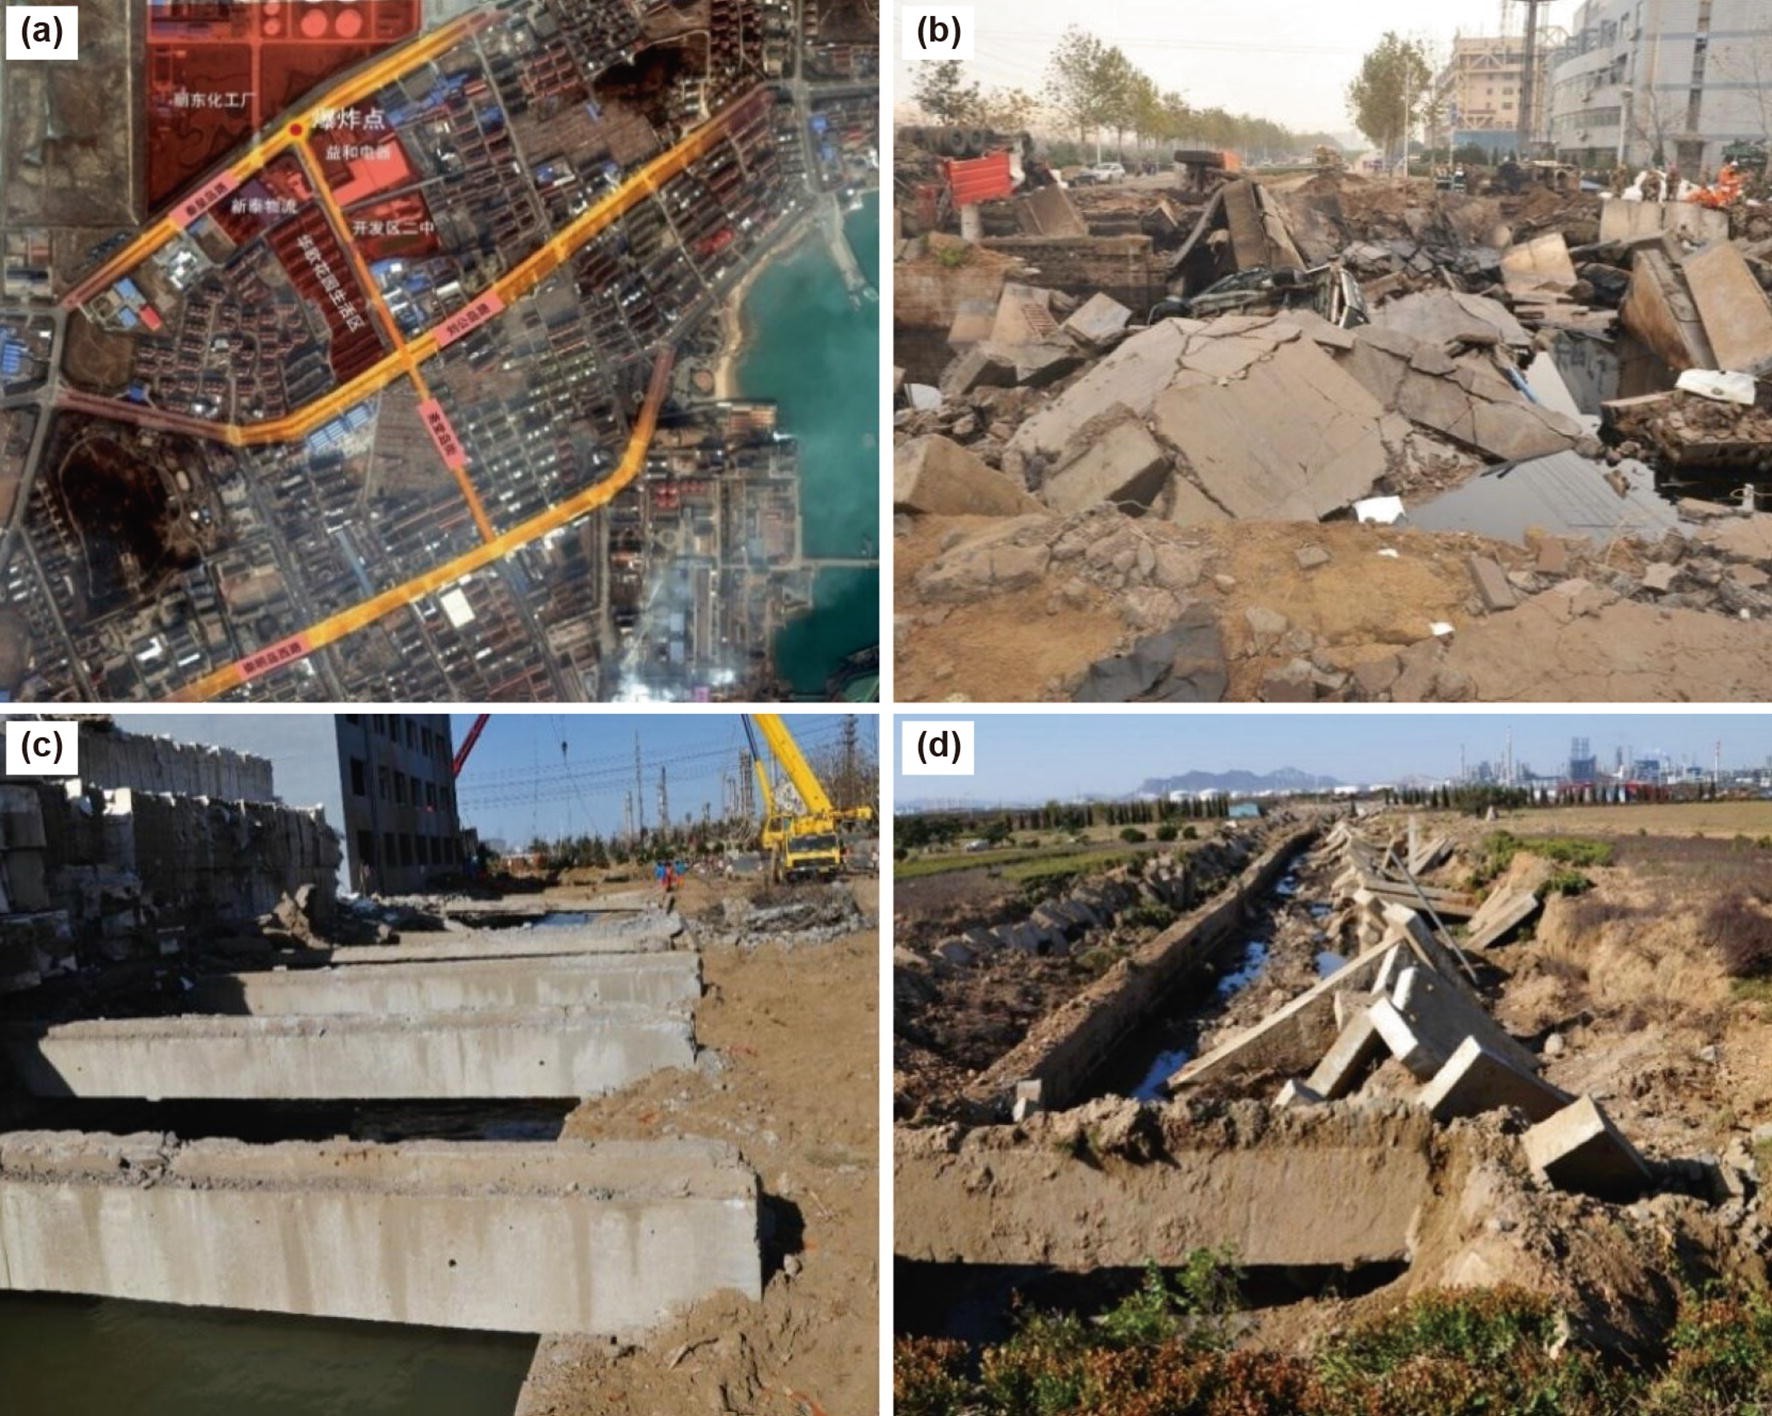


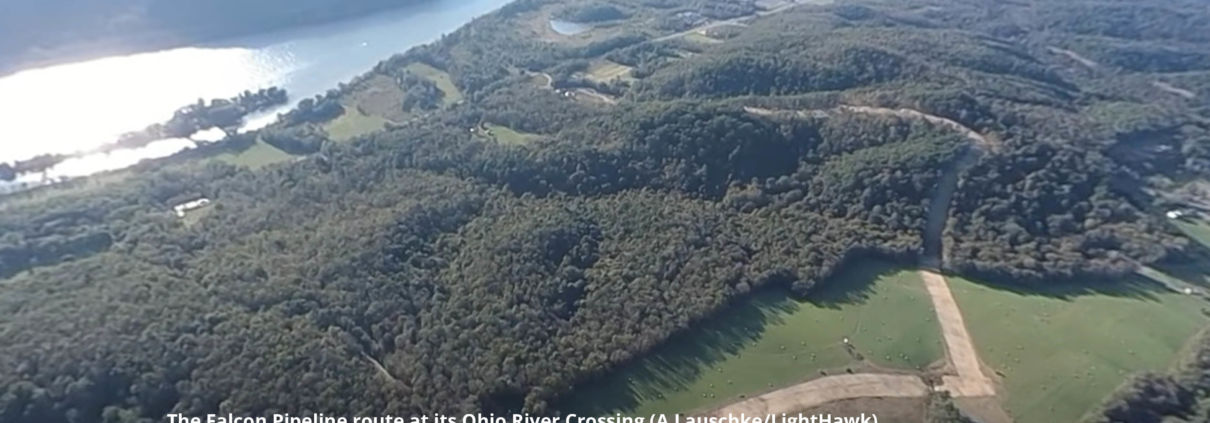
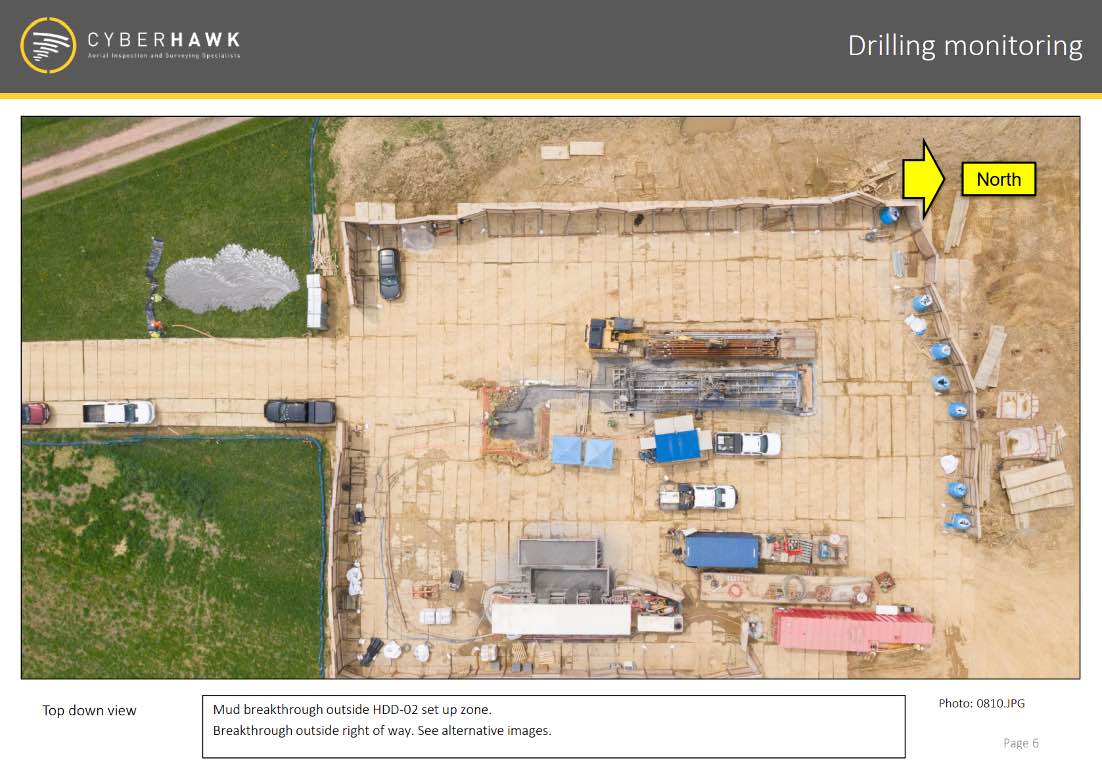
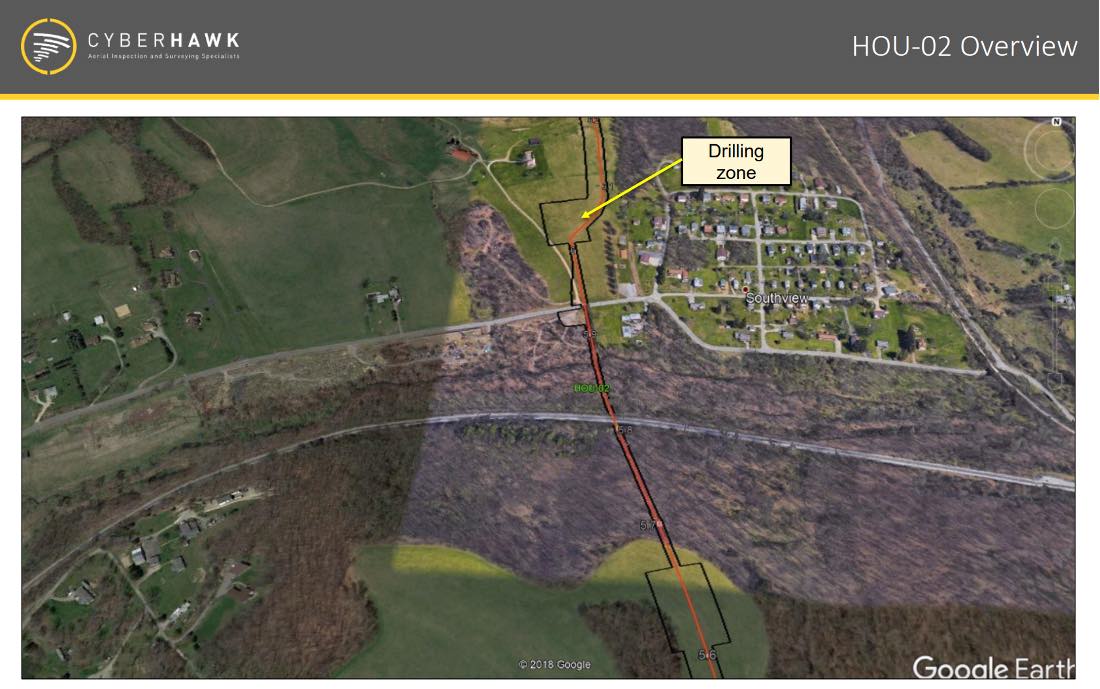
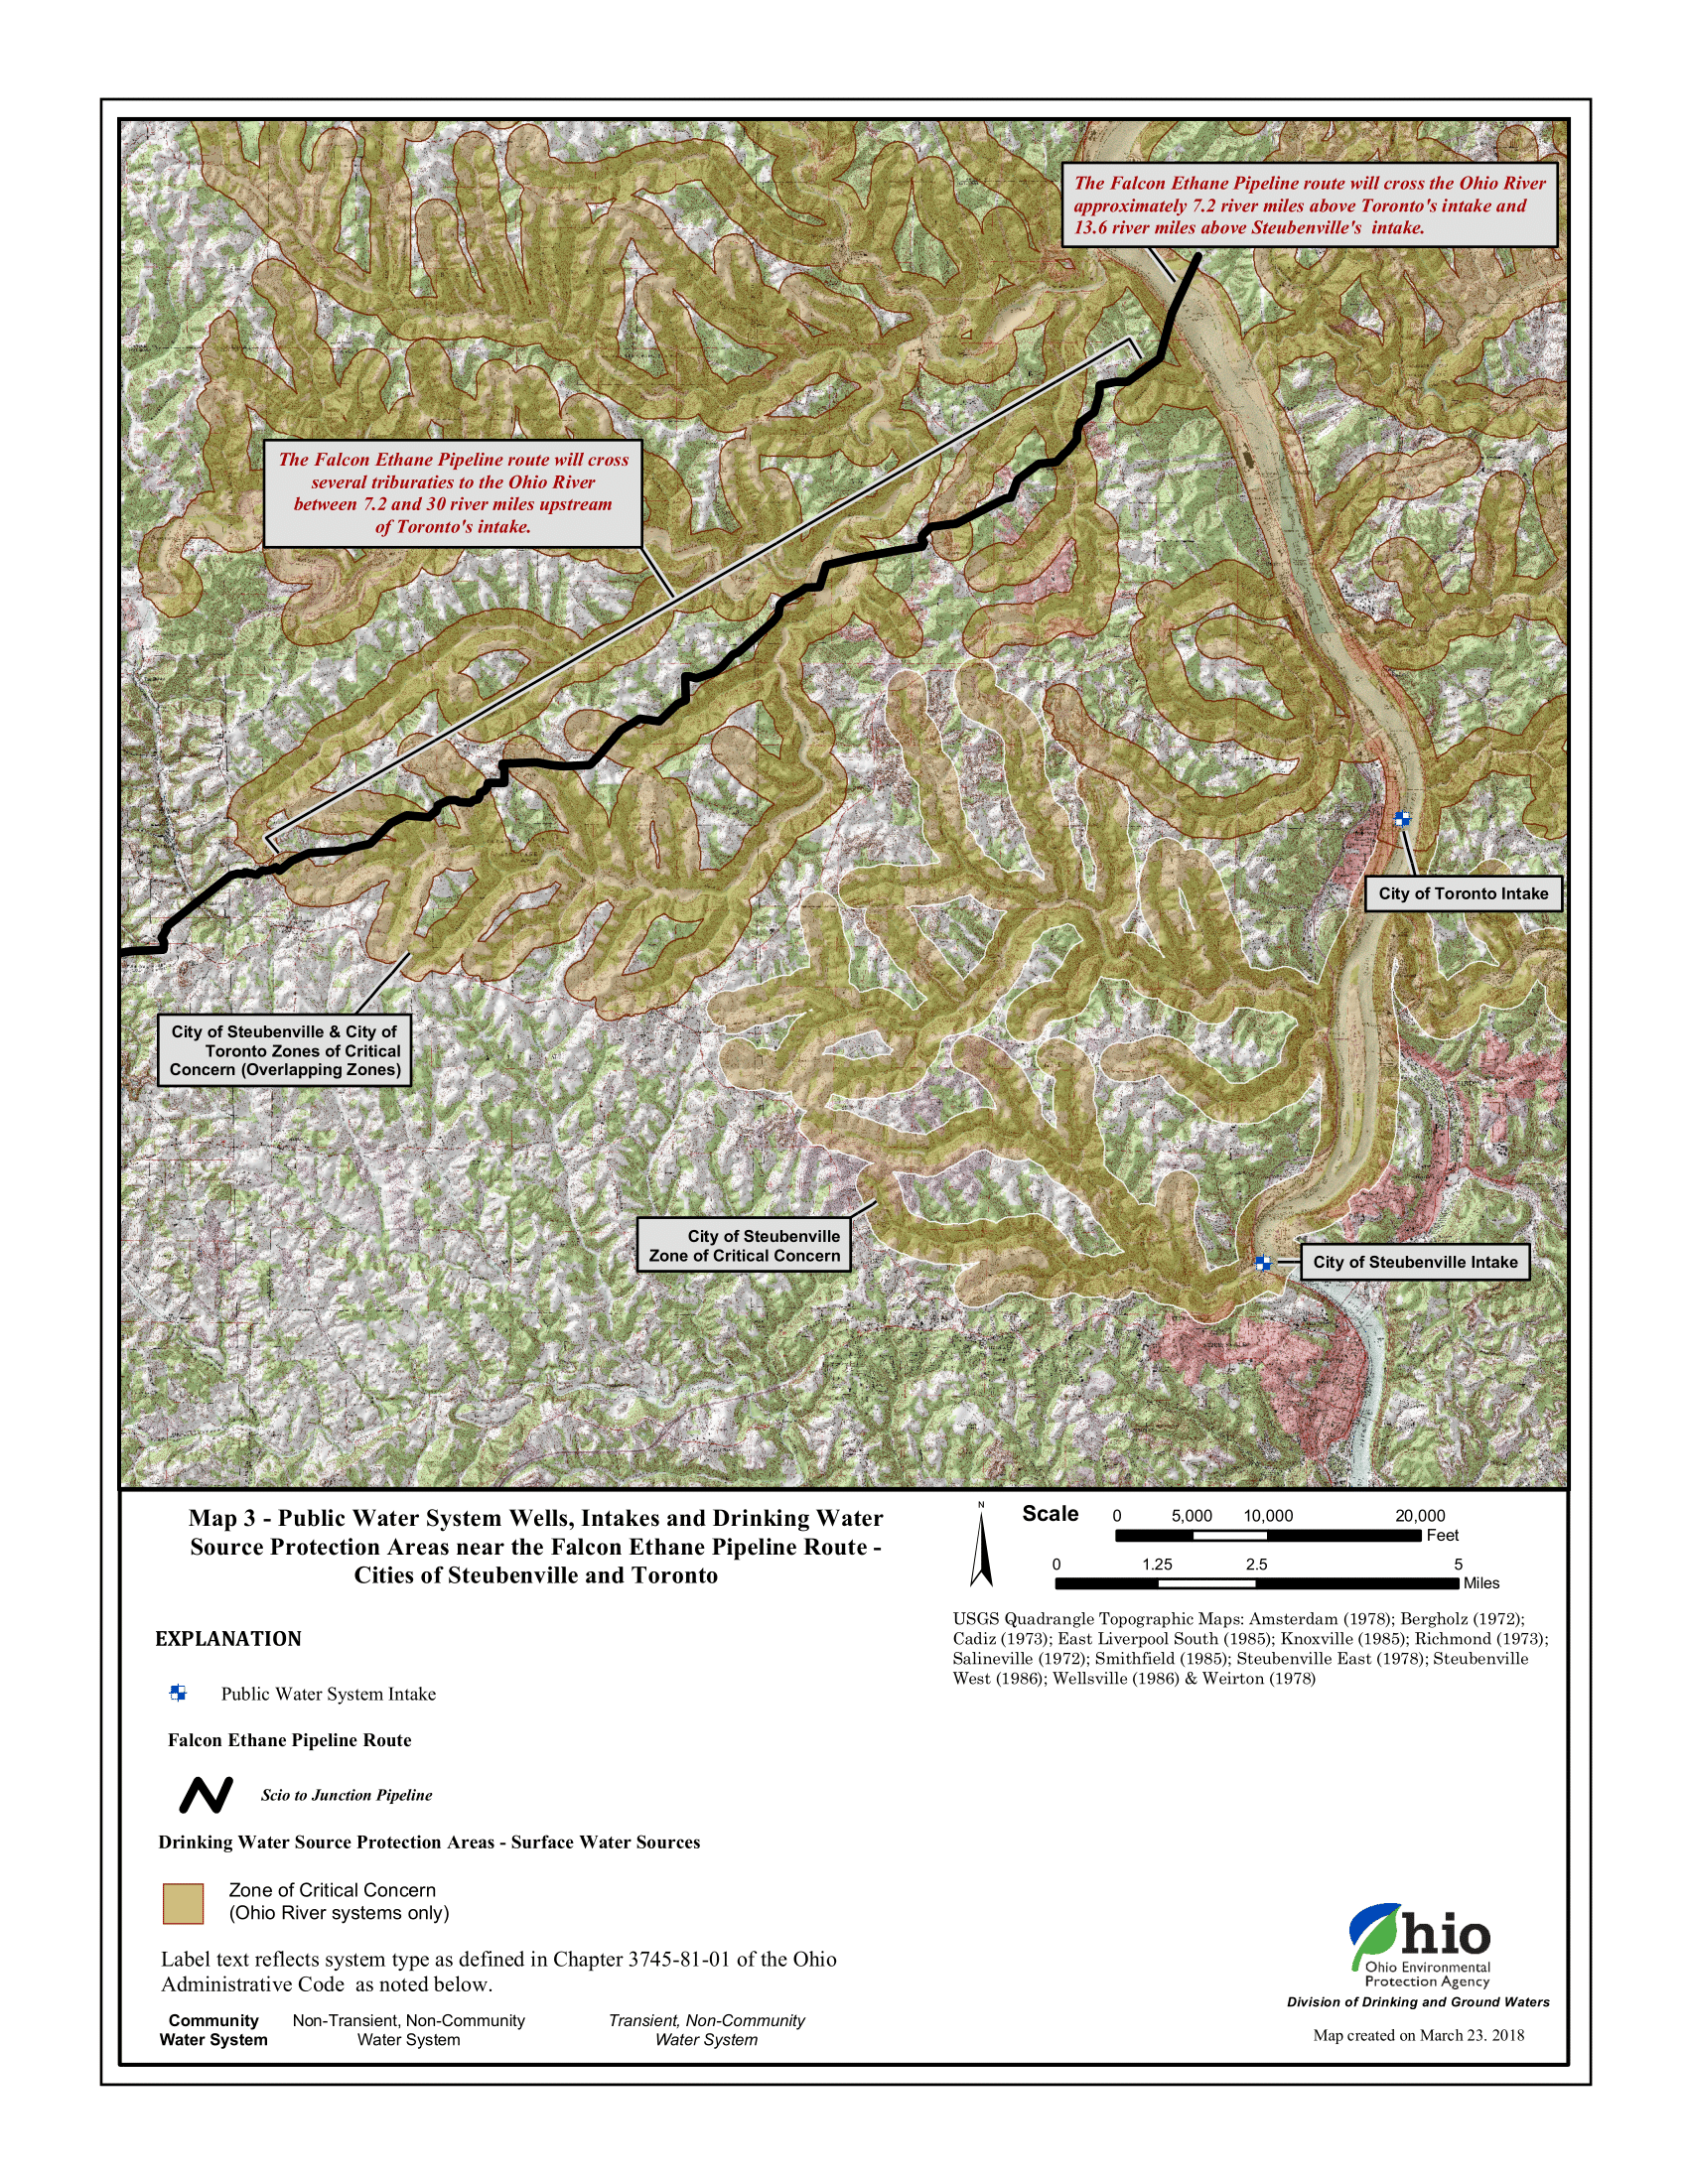
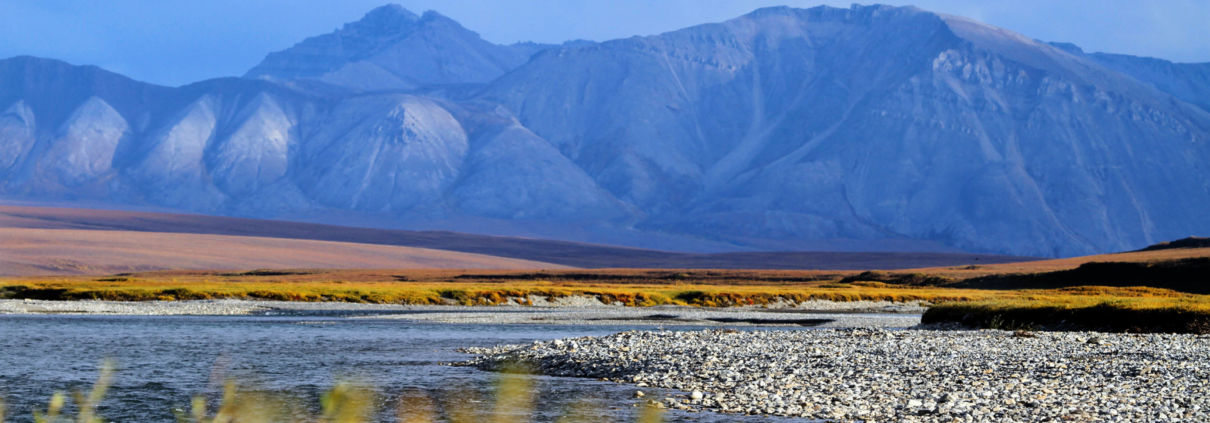
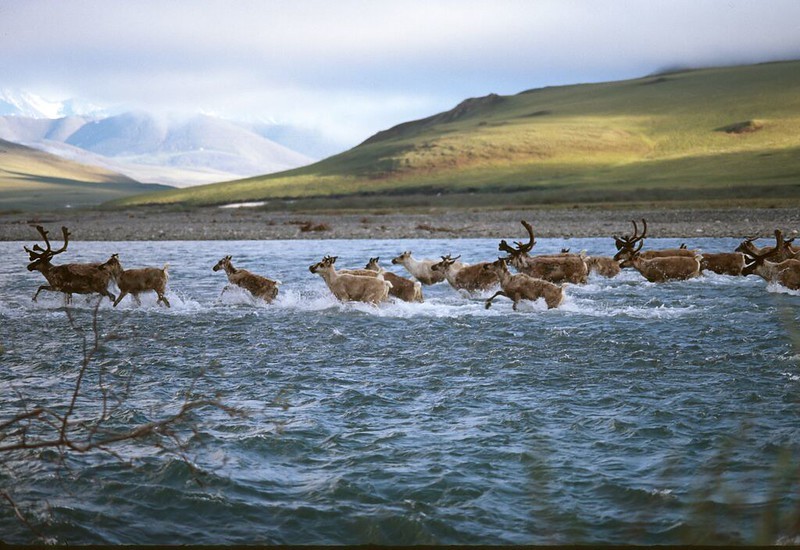


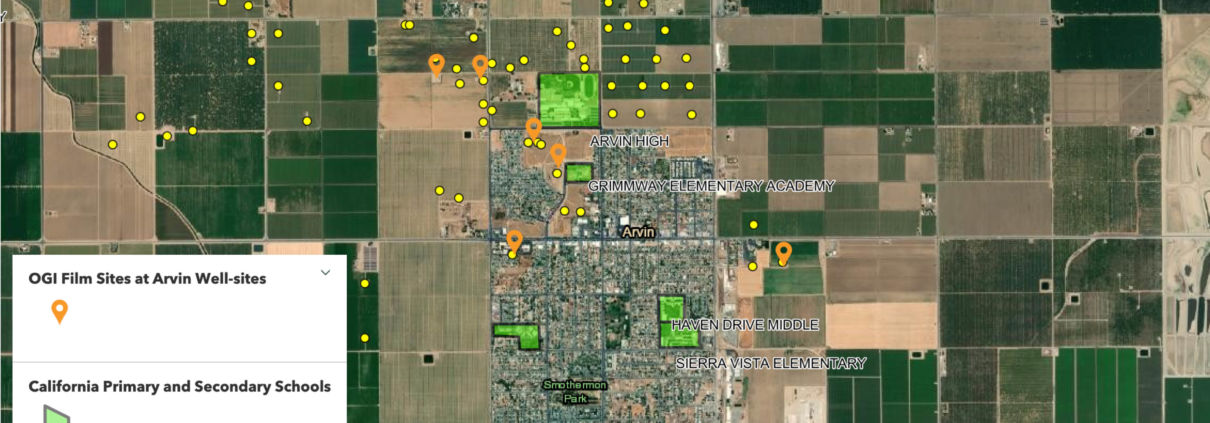
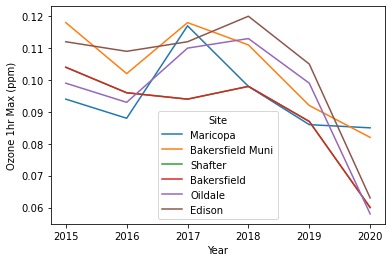
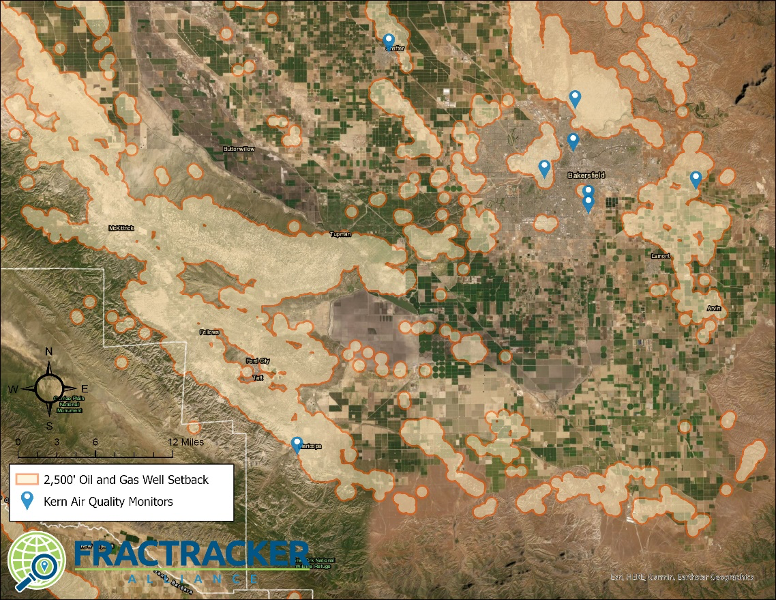
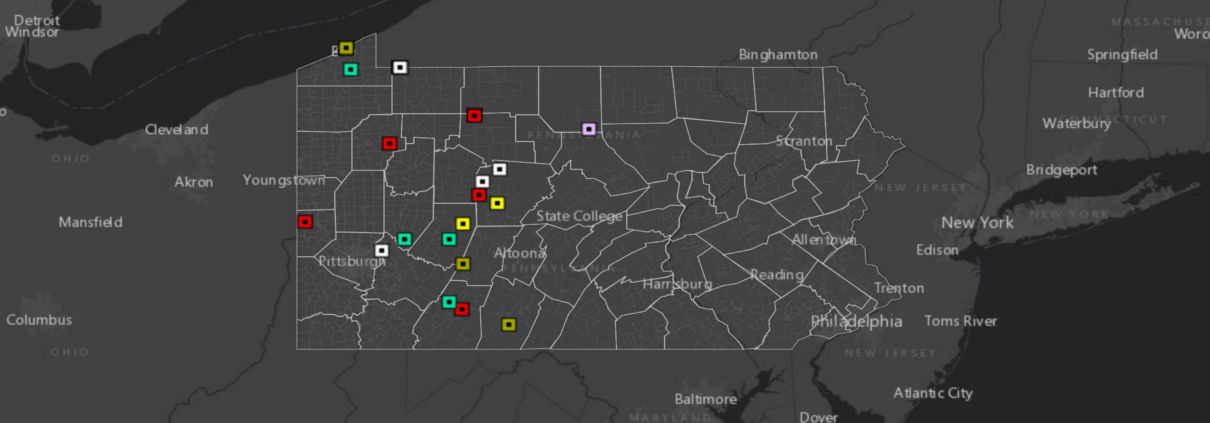 FracTracker Alliance, 2021