Fracking has been raised as an issue that could determine the outcome of the 2020 US presidential election. Republican candidates have cited erroneous figures of how many fracking jobs exist in Pennsylvania, and have falsely claimed that Democratic presidential candidate Joe Biden and running mate Kamala Harris seek to ban fracking. And while the Democratic candidates have made suggestive comments in the past, they have made their position clear. As Senator Harris stated in the vice presidential debate: “I will repeat, and the American people know, that Joe Biden will not ban fracking. That is a fact.”
The debate around this issue is not on whether or not fracking should be banned– something neither party advocates– but rather around the facts. Republican candidates have inflated the extent of fracking jobs by up to 3500 percent. But the natural gas industry and the fracking boom have failed to deliver the job growth and prosperity that was predicted by proponents a decade ago. In reality, the total number of jobs in the natural gas industry in Pennsylvania never reached more than 30,000 over the last five years and is now less with the industry’s economic decline.
The total number of jobs in the natural gas industry in Pennsylvania never reached more than 30,000 over the last five years and is now less with the industry’s economic decline.
The debate should not be around the facts- those are already firmly established. The debate should be around how to best support fossil fuel workers in the inevitable transition to cleaner energy. What does a just transition that supports workers and the climate look like?
FracTracker Alliance and The Breathe Project have compiled a fact sheet to help us answer this question based on where Pennsylvania currently stands.
Straight Talk on the Future of Jobs in Pennsylvania (September 2020)
The Breathe Project and FracTracker Alliance have crafted the following messaging for refuting the conflated job numbers being touted by pro-fossil fuel organizations and political candidates regarding fracking and jobs in Pennsylvania that, in some cases, has inflated natural gas jobs in the state by 3500 percent.
The natural gas industry and the fracking boom have failed to deliver the job growth and prosperity that was predicted by proponents a decade ago. The total number of jobs in the natural gas industry in Pennsylvania never reached more than 30,000 over the last five years and is now less with the industry’s economic decline.
FACT: The Pa. Dept. of Labor and Industry (DLI) reported that direct employment in natural gas development totaled 19,623 in 2016. This was down from 28,926 total natural gas development jobs in 2015. This includes jobs in drilling, extraction, support operations and pipeline construction and transportation. (StateImpact, 2016)
Pa. DLI calculated the employment figures using data from six data classifications at the U.S. Bureau of Labor Statistics — specifically, the North American Industry Classification System (NAICS) codes for cured petroleum and natural gas extraction, natural gas liquid extraction, drilling oil and gas wells, support activities for oil and gas operations, oil and gas pipeline and related structures and pipeline transportation of natural gas. (Natural Gas Intel, 2016)
Inflated estimates of fracking-related jobs in Pennsylvania under previous Gov. Tom Corbett included regulators overseeing the industry as gas jobs, truck drivers, and those working in highway construction, steel mills, coal-fired power plants, sewage treatment plants, and others. Pa. Gov. Tom Wolf’s administration revised the way gas industry jobs were calculated to reflect a more accurate depiction of jobs in the sector.
FACT: Food & Water Watch calculated that there were 7,633 jobs pre-boom (2001 – 2006), which rose to 25,960 oil and gas industry jobs post-boom (2016 – 2018). (FWW, March 2020)
Food & Water Watch created a more accurate model using a definition that encompasses only jobs directly involved with domestic oil and gas production, specifically: oil and gas extraction; support activities for oil and gas operations; drilling oil and gas wells; oil and gas pipeline construction; and pipeline transportation.
FACT: The Food & Water Watch analysis also reports that misleadingly broad definitions in industry-supported job reports overstated the industries’ scope. The industry analysis included broad swaths of manufacturing industries including “fertilizer manufacturing,” convenience store workers, and gas station workers, which accounted for nearly 35 percent of all oil and gas jobs in their analysis. (FWW, PwC at 5 and Table 4 at 9, 2019)
FACT: As a point of comparison, in 2019, close to 1 million state residents were working in healthcare, 222,600 in education, and over 590,000 in local and state government. (Pennsylvania Bureau of Labor Statistics, July, 2020)
FACT: To forecast fracking-related job growth, the American Petroleum Institute used a model with exaggerated multipliers and faulty assumptions, such as the amount of purchases made from in-state suppliers, and it double counted jobs, leading to wildly optimistic estimates. (Ohio River Valley Institute, August 2020)
FACT: In addition, many of the jobs claimed in a 2017 American Chemistry Council Appalachian petrochemical economic impact study would arise in plastics manufacturing, which raises two concerns. First, both the ACC study and subsequent reports by the U.S. Department of Energy assume that 90% of the ethylene and polyethylene produced by imagined Appalachian cracker plants would be shipped out of the region to be used in manufacturing elsewhere in the country and the world. Of the 10% that would presumably stay in the region, much or most of it would serve to replace supplies that the region’s plastics manufacturers currently source from the Gulf Coast. (Ohio River Valley Institute, August 2020)
The fracking and petrochemical industries create unsustainable boom and bust cycles that do not holistically improve local economies.
FACT: Economic analyses show that the oil and gas industry is a risky economic proposition due to the current global oversupply of plastics, unpredictable costs to the industry, a lower demand for plastics, and increased competition. The analyses call into question industry’s plans to expand fracking and gas infrastructure in the region. (IEEFA, August 2020)
FACT: Plans to build petrochemical plants in Beaver County, Pennsylvania and Belmont, Ohio, for the sole purpose of manufacturing plastic nurdles will not be as profitable as originally portrayed. (IEEFA Report, June 2020)
A clean energy economy is the only way forward.
FACT: The Dept. of Energy’s U.S. Energy and Employment Report (2017) and E2 Clean Jobs Pennsylvania Report (2020) shows that clean energy jobs in Pennsylvania employ twice as many people as the fossil fuel industry prior to the pandemic.
FACT: The 4-state region of Ohio, West Virginia, Kentucky and Pennsylvania has formed a coalition of labor, policy experts and frontline community leaders called Reimagine Appalachia. This coalition is in the process of addressing the vast number of jobs in renewable and clean energy industries in a report that will be published this fall.
Reimagine Appalachia seeks major federal funding packages that will create jobs, rebuild infrastructure and addresses climate change that will ensure that no one is left behind going forward.
The Breathe Project is a coalition of citizens, environmental advocates, public health professionals and academics using the best available science and technology to improve air quality, eliminate climate pollution and make our region a healthy, prosperous place to live.
FracTracker Alliance is a 501(c)3 organization that maps, analyzes, and communicates the risks of oil, gas, and petrochemical development to advance just energy alternatives that protect public health, natural resources, and the climate.
Feature image of construction of the Royal Dutch Shell cracker plant in Beaver County, Pennsylvania, October 2019. Ted Auch, FracTracker Alliance.
https://www.fractracker.org/a5ej20sjfwe/wp-content/uploads/2020/10/TAuch_Plastics-Cracker_Construction-Shell-BeaverCounty_PA_Oct2019-Feature-scaled.jpg6671500Shannon Smithhttps://www.fractracker.org/a5ej20sjfwe/wp-content/uploads/2025/09/2025-Wordmark-Logo.pngShannon Smith2020-10-14 11:54:592021-04-15 14:16:07Straight Talk on the Future of Fracking Jobs in Pennsylvania
Job Title: Data & GIS Intern Internship Period: February 1, 2021 – April 23, 2021, three months Application Deadline: November 20, 2020 Compensation: $12/hour, 10 hours per week Locations: Two remote positions available in collaboration with either the Pittsburgh, PA office or the Cleveland, OH office.
FracTracker internships are dedicated to current college and graduate students, as well as recent grads. Applicants should enjoy working with datasets, visualizations, and maps as well as analyzing and writing about oil, gas, and petrochemical issues. FracTracker is offering two paid internships from February 1 through April 23, 2020 in collaboration with the following offices: Pittsburgh, PA and Cleveland, OH. These positions are expected to be 100% remote depending on public health conditions. See where we work.
Learn more about FracTracker’s internship program and explore the work past intern projects.
The responsibilities of paid interns revolve around the daily work of the other FracTracker staff, time-sensitive projects, and the interns’ own areas of interests. Responsibilities will vary, but may include:
Data mining, cleaning, management, and GIS mapping
Limited spatial analyses using GIS software
Translation of data into blog posts
Communications support, including website development, content creation, and other tasks as needed
Qualifications
PREFERRED SKILLS:
GIS/mapping; Experience with ArcGIS
Writing and editing; Experience with Microsoft Word
Public speaking
Citizen science
Research
Data management; Experience with Microsoft Excel
Website development; Knowledge of WordPress
Teamwork and interpersonal skills
Ability to work independently
Communication and adherence to deadlines
MINIMUM EDUCATION/QUALIFICATIONS:
Enrollment in or recent graduation from an accredited college or university is required. Majors can include geography, computer science, environmental science, public health, planning or a related field.
Interest in the mission of FracTracker; Familiarity with environmental justice issues
Knowledge of environmental and/or public health concerns or other issues of relevance to understanding the implications of oil and gas extraction and climate change
Application Process
To apply for one of our spring 2021 paid data & GIS internship positions, please submit the following materials through the online application form below: cover letter, resume, and three references. Applications are not accepted via email, but you may address questions to Shannon Smith at smith@fractracker.org.
Deadline to apply: November 20, 2020 at 5:00pm EST.
Interviews will be conducted during the period of November 30 – December 11, 2020, and a decision made by December 18, 2020. All applicants will be contacted regarding the outcome of their application.
About FracTracker Alliance
Insights Empowering Action
FracTracker Alliance maps, analyzes, and communicates the risks of oil, gas, and petrochemical development to advance just energy alternatives that protect public health, natural resources, and the climate.
by Ted Auch, FracTracker Great Lakes Program Coordinator, and Rebecca Johnson, Communications & Administrative Specialist
FracTracker is pleased to release our improved multimedia platform of fracking imagery for your convenient use. You can easily view, download, and share photos and videos of oil, gas, and petrochemical impacts. We’ve made it easy for you to find what you need within over 1,600 photos, GIFs, and videos of the various aspects of fossil fuel industries and activities. All media are free to download and use for all visitors, and the collection will only expand as our work continues!
“The aeroplane has unveiled for us the true face of the earth.” by French writer and aviator Antoine de Saint-Exupéry author of Le Petit Prince (The Little Prince)
Ted Auch, FracTracker Great Lakes Program Coordinator:
It was nearly five years ago on a beautiful Wednesday morning that I met Paul Feezel, a concerned citizen of Carroll County, Ohio, and Cleveland Museum of Natural History’s David Beach at the Carroll County-Tolson Airport (40.5616667, -81.0780833). The occasion was a flight with pilot Mike Stich to see what the Fracking Boom had done to Carroll and neighboring counties.
The aspect of the industry that I came away from that flight most worried about was the hundreds of miles of pipelines we saw connecting well pad to well pad and meandering on downstream to processing facilities. These pipelines took such circuitous routes between pads that everyone in the plane was scratching their heads, wondering how such routes made any financial sense for the operators to get their raw product to market.
Ever since that flight, I have spent a significant chunk of my time at FracTracker mapping the extent of these so-called gas “gathering pipelines” across Ohio, West Virginia, and Pennsylvania. I remain as flummoxed as I was on that day how such a hastily laid and poorly regulated network of pipelines makes sense. More recently, I have been wondering what the cumulative impact of these non-FERC-regulated pipelines has been on forests, wetlands, and the remaining agriculture in the region.
We have flown over this area several more times since that initial flight, with pilots volunteering their time to navigate planes provided by our excellent partners at LightHawk. As I wrote a little over two years ago:
“… you can’t really understand or appreciate the enormity, heterogeneity, and complexity of the unconventional oil and gas industry’s impact unless you look at the landscape from the cockpit of a Cessna 172. This vantage point allows you to see the grandeur and nuance of all things beautiful and humbling. Conversely, and unfortunately more to the point of what I’ve seen in the last year, a Cessna allows one to really absorb the extent, degree, and intensity of all things destructive. I’ve had the opportunity to hop on board the planes of some amazing pilots, like Dave Warner, a forester formerly of Shanks, West Virginia … Tim Jacobson, Esq., out of La Crosse, Wisconsin, northern Illinois retired commodity and tree farmer Doug Harford, and Target corporate jet pilot Fred Muskol, out of the Twin Cities area of Minnesota.”
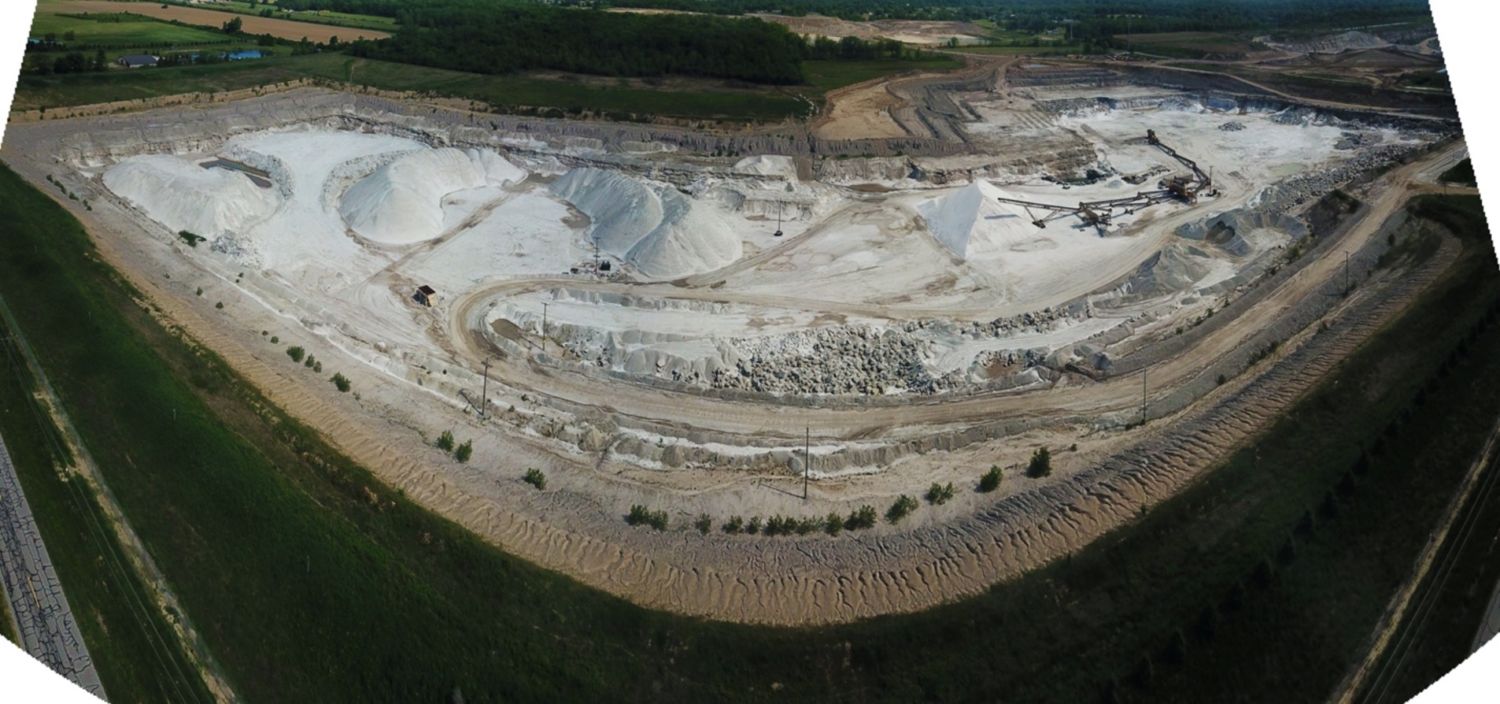
Frac sand mine impoundment pond in Wedron, IL, 2018. Photo by Ted Auch, with aerial assistance from Lighthawk.
I wrote the “Bird’s-Eye-View” piece in August 2018, and since then we’ve made additional flights with our LightHawk partners, including a harrowing flight over Pine Creek State Park in Pennsylvania last May, part of our “Wilderness Lost” digital atlas series that now includes a similar project for the adjoining Loyalsock Creek.
The May 2019 flight was exhilarating to say the least – and thanks to the skills of our pilot Steve Kent, we executed the flight and extracted some powerful imagery that was three months later appended during better flying conditions with pilot Bob Keller. This flight was notable because the cloud ceiling was around 2,400 feet, and some peaks we were flying over and around were in excess of 1,200 feet, which gave us very little room to maneuver, at times forcing us to fly down into valleys to avoid the clouds. This flight also was a great opportunity for me and Steve to practice our communication, given that we were flying so low and slow, which meant that Steve would basically give me a ten-second slot to open my window, lean out, and shoot, while he was banking around the site of interest. Unlike other flights – including the subsequent flight in the Pine Creek – we did not have any opportunities to fly around infrastructure more than once, given how volatile the cloud ceiling was, and that if there was an opening that would allow us to move laterally, we had to take it.
Between our Pine Creek flights and that initial Carroll County aerial tour, we’ve compiled literally thousands of high-quality and illustrative images of the Hydraulic Fracturing Industrial Complex. When we say “hydraulic fracturing” – or “fracking” – we are not simply referring to drill rigs and frack pads, like the industry would limit us to in our analysis, but rather all manner of activities and infrastructure, to include drill rigs and pads – but also pipelines, waste disposal sites, processing plants, and frac sand mining activities, from the aforementioned forests of northeastern Pennsylvania, to Texas’ Gulf Coast. To this point, several authors have used our imagery, such as Paul Bogard and Tom Pearson, the Proceedings of the National Academy of Sciences (PNAS), Yale Environment 360, Oil Change International, the Anthropology Magazine SAPIENS, etc.
Since COVID-19 brought everything to a halt, my colleague Rebecca Johnson and I have been working to organize these images, migrating our older and more cumbersome inventory to the image and video hosting website Flickr, where we could more appropriately catalog, group, and map these images.
Please make use of this resource and keep fighting for a more just energy future.
Steel plants in Detroit, MI. Photo by Ted Auch, FracTracker Alliance, with aerial assistance from Lighthawk.
I began working with FracTracker in May 2019, coming in with a new and relatively limited perspective on the energy landscape, compared to Ted’s, my partner in this undertaking, who has spent years – from the ground and from above – capturing this expansion, its degradation, and the challenges it presents. After seeing the collection of Ted’s and others’ pictures on our website, I knew we needed to amplify our efforts in graphic documentation, in order for more people to see and feel what we are collectively up against.
This task was not taken lightly. FracTracker’s imagery backlog was daunting, to say the least. I scrolled through countless pictures and videos of different aspects of fossil fuel infrastructure and activity until my eyes glazed over. I had no idea the extent of the industry landscape and its effects – and so I had no idea where to even begin. The collection was immense, but the need to get more eyes on these revealing depictions was even bigger.
How was best to expose and illuminate the extensive buildout of and degradation from these resource-intensive, extractive industries?
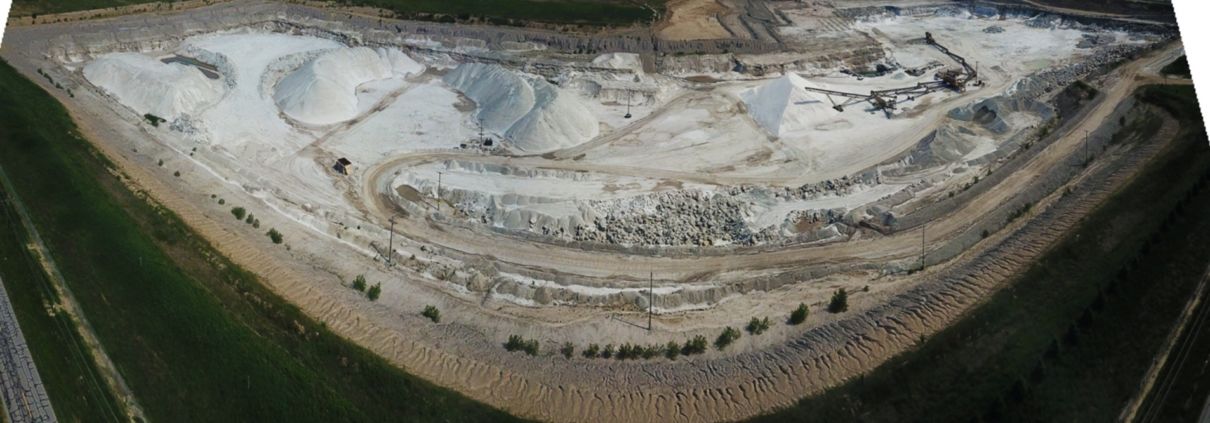
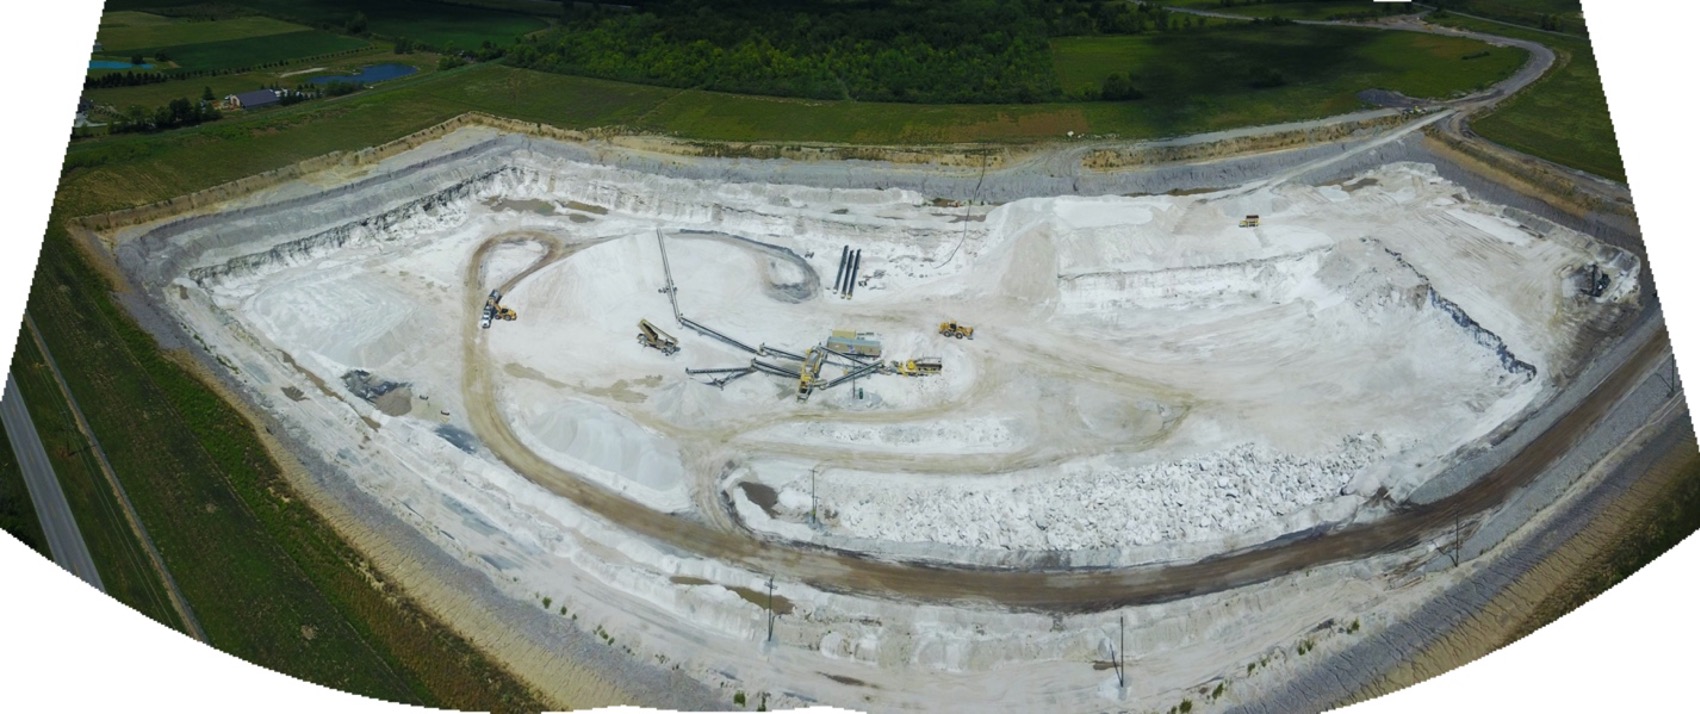
Cataloguing began with the frac sand industry, and I slowly pieced together the breadth and depth of resource extraction. The aerial snapshots and panoramic captures of enormous mines, immense sand piles, and vast, sandy, slurry ponds connected by looming conveyors and miles of train tracks created a twisting path through my mind, traversing the various stages of extraction to production, through landscapes wrought with reckless human consumption. But frac sand is only one starting point in the onslaught, is only an upstream activity that sets the stage for further ruin downstream, with oil and gas extraction, petrochemical and plastic production, and various types of pollution and erroneous waste disposal from all these activities – not to mention the waste and pollution following human consumption, when we think we are “done” with a material.
As I sifted through images, the dots started connecting, and what started as a simple list of subjects quickly became an outline of what our country’s communities and environment were up against. Navigating through the picture hoard, Ted and I regularly discussed the people he had met while capturing these shots.
He spoke of friends he has made along the way – people in communities that had endured this buildout, seeing their lands chipped away, their natural corridors disconnected, and their waterways depleted or entirely consumed to make room for more industrial sites. It had compelled some of them to leave their homes, and some were even forced to abandon their sacred lands, left only with the lasting, heartbreaking memory of seeing it sullied beyond recognition and repair.
Detroit residents Doug Wood and Theresa Landrum stand in front of a Marathon Oil refinery in southwest Detroit, MI, 2020. Photo by Ted Auch, FracTracker Alliance.
This realization lead to our stepwise sorting of imagery by these industries and activities to include the impacts and hazards to communities, culture, and livelihoods, already endured, happening currently, and looming ominously in the future. It’s easy to see the negative alterations from a bird’s-eye view, with the tainted landscape laid out below, punctured by ugly facilities and marred by indiscriminate ruin. It is another, more emotional thing to connect these scenes to those living in them, to the livelihoods dissolved and the generational homes displaced. Farmers have seen their lands infringed upon, their soils tainted and their waters poisoned. Communities have witnessed their air quality deteriorate, their children and friends fall sick, and their neighborhoods empty, at the expense of these industries. An often-overlooked aspect of extraction is those who bear its initial ramifications in their own communities.
At this point, we’ve winnowed our vast trove of imagery down to over 1,600 images across 46 albums. After weeding through this extensive catalog to identify our most powerful snapshots, we thought it would be appropriate to present the first iteration of this over five-month project to our audience and collaborators, with the hopes of better informing/illustrating your work.
With our migration to Flickr, I hope more eyes find this imagery, explore our collections, and follow the connections from album to album, to better understand the effects of fossil fuel activities. Whether it is the withered landscapes, the depleted environments, or the fragmented lives that speak to the viewer most, it is important to remember what has been endured to procure these resources, and what it will take to move to a cleaner, more just energy landscape.
In the event some of you were not aware of certain aspects of the industry, please take this opportunity to tour these albums and familiarize yourself with the myriad infrastructure and impacts of fracking.
A primary source of inspiration for this aerial photography endeavor is the late Bill Hughes out of Wetzel County, West Virginia, who left us in March 2019. Bill was a force of nature in West Virginia’s documentation, with his camera and local know-how, the fracking industry’s negligence, and the fact that they seemed to run roughshod over his beloved state’s beautiful landscape. As our Executive Director Brook Lenker wrote following Bill’s death:
“Just taking pictures was not enough. Context was needed. Bill interpreted each picture – explaining the location, thing or activity, and significance of every image. Did it represent a threat to our water, air, or land? When did it happen? What happened before and after? Did it show a short- or long-term problem? Should state regulatory agencies see it to become better informed? Dissemination followed in many forms: tours of the gas fields; power point presentations to groups in five states; op-ed pieces written for news media; countless responses to questions and inquiries; even blogs and photo essays for various websites. Ceaseless Bill never stopped caring. Maybe Bill Hughes should be an official emblem for Earth Day – a humble, faithful man of modest proportions, spreading the stewardship imperative from a little electric car. Hitch a ride, follow his lead, and, like Bill, always tell it like it is.”
We hope that our work in the air and on the ground photographing industry impacts would make Bill proud. We will continuously update these Flickr albums, and offer as much background and locational data as possible to facilitate an unsurpassed level of depth and breadth for all users.
FracTracker Alliance has released a new mapof drilling fluid spills along the Mariner East 2 pipeline route, showing 320 spills from its construction since 2017. Of those, a combined 147 incidents have released over 260,000 gallons of drilling fluid into Pennsylvania waterways.
The unpermitted discharge of drilling fluid, considered “industrial waste,” into waters of the Commonwealth violates The Clean Streams Law.
What you need to know:
Sunoco’s installation of the Mariner East 2 pipeline has triggered 320 incidences of drilling mud spills since 2017, releasing between 344,590 – 405,990 gallons of drilling fluid into the environment. View an interactive map and see a timeline of these incidents.
Construction has caused between 260,672 – 266,223 gallons of drilling fluid to spill into waterways, threatening the health of ecosystems and negatively affecting the drinking water of many residents.
There have been 36 spills since Pennsylvania entered a statewide shutdown on March 16th, 2020, in response to the COVID-19 pandemic. These spills released over 10,000 gallons of drilling fluid — most of which poured into Marsh Creek Lake in Marsh Creek State Park. See a map of this incident.
While the total reported volume of drilling fluid released into the environment from the pipeline’s construction is between 344,590 – 405,990 gallons, the actual total is larger, as there are 28 spills with unknown volumes. Spills of drilling mud are also referred to as “inadvertent returns,” or “frac-outs.”
Most of these spills occurred during implementation of horizontal directional drills (HDD). HDDs are used to install a pipeline under a waterway, road, or other sensitive area. This technique requires large quantities of drilling fluid (comprising water, bentonite clay, and chemical additives), which when spilled into the environment, can damage ecosystems and contaminate drinking water sources.
ME2 Background
The Mariner East 2 pipeline project is part of the Mariner East pipeline system, which carries natural gas liquids (NGLs) extracted by fracked wells in the Ohio River Valley east, to the Marcus Hook Facility in Delaware County, Pennsylvania. The NGLs will then go to Europe to be turned into plastic. Explore FracTracker’s other resources on this project:
There have been 36 spills since the Commonwealth shutdown statewide on March 16th, 2020, leaks that have jeopardized drinking water sources, putting communities at even higher risk during the COVID-19 pandemic.
On August 11th, construction caused a 15-foot wide and eight-foot deep subsidence event in the wetland (Figure 1). This caused drilling fluid to flow underground and contaminate groundwater, while also “adversely impacting the functions and values of the wetland.” Thirty-three acres of the lake are now closed to boating, fishing, and other uses of the lake — an extra blow, given the solace state parks have provided to many during this pandemic.
Figure 1. This HDD crossing in Upper Uwchlan Township, Chester County, caused over 8,000 gallons of drilling mud to spill into waterways. However, installation of the parallel 16-inch pipeline also caused spills at this same location in 2017.
A plume of drilling mud, captured here on video, entered the Marsh Creek Lake and settled on the lake bottom.
Upper Uwchlan Reroute
Last week, the PA DEP ordered Sunoco to suspend work on this HDD site and to implement a reroute using a course Sunoco had identified as an alternative in 2017:
“A 1.01 mile reroute to the north of the HDD is technically feasible. This would entail adjusting the project route prior to this HDD’s northwest entry/exit point to proceed north, cross under the Pennsylvania Turnpike, then proceed east for 0.7 miles parallel to the turnpike, cross Little Conestoga Road, then turn south, cross under the turnpike, and then reintersect the existing project route just east of this HDD’s southeast entry/exit point. There is no existing utility corridor here, however; therefore, this route would create a Greenfield utility corridor and would result in encumbering previously unaffected properties. The route would still cross two Waters of the Commonwealth and possible forested wetlands, and would pass in near proximity or immediately adjacent to five residential home sites. Both crossings of the turnpike would require “mini” HDDs or direct pipe bores to achieve the required depth of cover under the highway. Considered against the possibility of additional IRs [inadvertent returns] occurring on the proposed HDD, which are readily contained and cleaned up with minimal affect to natural resources, the permanent taking of the new 4 easement and likely need to use condemnation against previously unaffected landowners results in SPLP’s opinion that managing the proposed HDD is the preferred option.”
Based on that description, the route could follow the general direction of the dashed line in Figure 2:
Figure 2. Possible reroute of Mariner East 2 Pipeline shown with dashed line
The August incident likely surprised no one, as it was not the first spill at this location, and Sunoco’s own assessment acknowledged that this HDD crossing came with “a moderate to high risk of drilling fluid loss and IRs.”
Residents also sounded alarm bells for this drilling site. The proposal for just this location garnered over 200 public comments, all of which called on the DEP to deny Sunoco’s permit for drilling in this area. Many implored the DEP to consider the alternate route Sunoco must now use.
George Alexander, a Delaware County resident who runs a blog on this pipeline, the Dragonpipe Diary, says, “Sunoco/Energy Transfer continues to demonstrate in real time that they cannot build the Mariner Pipelines without inflicting harm upon our communities … The Marsh Creek situation is reminiscent of the damage to another favorite Pennsylvania lake, Raystown Lake in Huntingdon County.”
In 2017, Sunoco spilled over 200,000 gallons of drilling fluid into Raystown Lake, and released millions more underground. The spill caked acres of the lakebed with a coating of mud, hurting aquatic life and limiting recreational access to the lake. Sunoco failed to report the spills when they occurred, and the DEP fined the company $1.95 million for the incident. The fine is one of many Sunoco has incurred, including a $12.6 million penalty in February 2018 for permit violations, and more recently, a $355,636 penalty for drilling fluid discharges into waterways across eight counties.
The fracking boom triggered investment in projects to convert the fracked gas to plastic, leading to an oversupply in the global market. The industry made ambitious plans based on the price of plastic being $1/pound. Now, in 2020, the price is 40 – 60 cents per pound. If the Mariner East 2 pipeline is brought online, it likely will not be as profitable as its operators expected.
The poor finances of the oil and gas industry have led to the demise of several pipeline projects over the last few months. Phillips 66 announced in March it was deferring two pipelines — the Liberty Pipeline, which would transport crude oil from Wyoming to Oklahoma — and the Red Oak Pipeline system, planned to cross from Oklahoma to Texas. Kinder Morgan expressed uncertainty for its proposed Texas Permian Pass pipeline, and Enterprise Products Partners cancelled its Midland-to-ECHO crude oil pipeline project. The Atlantic Coast Pipeline also was cancelled this past July by Duke Energy and Dominion Energy, following “an unacceptable layer of uncertainty and anticipated delays,” and the Williams Constitution pipeline was also abandoned after years of challenges. In fact, the EIA recently reported that more pipeline capacity has been cancelled in 2020 than new capacity brought in service.
Will the Mariner East 2 be the next to fall?
Before you go
A note from the Safety 7: The Safety 7 are seven residents of Delaware and Chester Counties who are challenging Sunoco before the [Pennsylvania Public Utility Commission]. If you are outraged at the ongoing threat to our communities from this dangerous, destructive pipeline, please consider donating to the Safety 7 Legal fund … Our next hearing begins September 29, and funds from your support are urgently needed. This motion is representative of the kind of legal work we need, if we are to prevail in protecting our communities from this dangerous pipeline project. Please contribute today if you are able, and please share this appeal widely and let your friends and family know why this case matters to you!
https://www.fractracker.org/a5ej20sjfwe/wp-content/uploads/2020/09/ME2FeatureImage.jpg6661500Erica Jacksonhttps://www.fractracker.org/a5ej20sjfwe/wp-content/uploads/2025/09/2025-Wordmark-Logo.pngErica Jackson2020-09-17 11:20:062021-04-15 14:16:08Mariner East 2 Causes Dozens of Spills Since Lockdown Began, Over 300 in Total
With this recent development, it is necessary to provide science-based recommendations for the EIR to prioritize the protection of the health of frontline communities. Frontline communities bear the most risk. Emissions from oil and gas infrastructure and exposure to water and soil contamination most affect those living closest. It is therefore vital for an EIR to institute protections that address these known and well-established sources of exposure. In addition, the EIR must prioritize a requirement by law that all regulatory information is equitably available and imparted to Frontline Communities; with Kern County, this means providing regulatory notices in Spanish, the predominantly spoken language in this area, according to household census data.
In preparation of the Kern County rule-making process, FracTracker Alliance has prepared new analyses of Kern County communities. These analyses have mapped and assessed the distribution of oil and gas wells within Kern County for proximity to sensitive receptors. This information is vital to understand how the “most drilled County” in the United States manages the risks associated with oil and gas extraction. According to CalGEM data updated September 1, 2020, there are 78,016 operational oil and gas wells countywide. Of these, 5,906 (7.6%) are within 2,500 feet of a sensitive receptor, receptors being homes, schools, healthcare facilities, child daycare facilities, and elderly care facilities. Thirty-six CHHS healthcare facilities and 35 schools in Kern County are within 2,500 feet of an operational oil and gas well. In fact, 646 operational wells are within 2,500 feet of a school in Kern County. Most of these at-risk, sensitive receptors are in Kern’s cities, large and small.
Table 1. Well Counts in Kern County
Most of the population of Kern County is in its cities. Unincorporated, rural areas of Kern County are in majority zoned for large estate landownership and agriculture, and have low population density, rather than designated for residential, single-family homes, apartments, developments, and mobile homes. Oil and gas extraction operations and well sites are dispersed throughout the county, including near and within the residentially-zoned areas of cities. Given that the county’s population density is highest in cities, these areas present the greatest public health risk for exposures to toxic emissions and spills from fossil fuel extraction operations. This analysis focuses specifically on the Frontline Communities of Kern County, where oil and gas extraction is occurring near city limits.
Table 2. Operational oil and gas well counts near cities and sensitive receptors.
Frontline Communities
These include Lost Hills, Lamont, Taft, Arvin, Shafter and Bakersfield. In Table 2 (above) are counts of operational wells within two miles of each city, along with demographic profiles for each incorporated/unincorporated city, based on American Community Survey (2013-2018) census data (downloaded from Census.gov). Population estimates are based on the ACS block groups. For block groups larger than city boundaries, the population was assumed to be within city limits, although in certain cases, such as Arvin, a small section of a block group was eliminated from the city demographic counts. This assumption is validated by the county and city zoning parcels. The maps below in Figures 1 – 6 show the municipal zoning parcels for these cities, with maps that include operational oil and gas wells. Note the proximity of residential- and urban-zoned parcels to oil and gas extraction in Kern County, and the difference in zoning between the cities and the rest of the county. Cities are zoned for residences, including apartments, single-family homes, and mobile homes. Most of the rest of the county is agriculture and estates, where predominantly wealthy residents and corporations own large holdings.
Figure 1. Municipal zoning boundaries of the City of Lost Hills.
Figure 2. Municipal zoning boundaries of the City of Lamont.
Figure 3. Municipal zoning boundaries of the City of Taft.
Figure 4. Municipal zoning boundaries of the City of Arvin.
Figure 5. Municipal zoning boundaries of the City of Shafter.
Figure 6. Municipal zoning boundaries of the City of Bakersfield.
Economic Disparity in Environmental Justice Communities
These six cities and their Frontline Communities experience a disparity of exposure to environmental pollutants, particularly emissions from oil and gas extraction operations — as well as pesticides, regionally degraded air quality (from ozone and particulate matter), and contaminated groundwater. Besides the risk disparity, these communities are also vulnerable from several other factors, including disparities in economic opportunity, demographics, and access to information.
Compared to the rest of Kern County, Frontline Communities in these unincorporated and incorporated cities have less financial opportunity. The maps in Figures 7 – 9 below show block groups and the proportions of the population with annual median incomes less than or equal to $40,000. This value was chosen because it is less than 80% of the countywide median income of $51,579 in 2018. For comparison, the statewide median income is $75,277. Lack of economic opportunity for these communities limits the ability to leverage financial resources to protect their community health and to maintain local-level financial independence from corporate influence. In Lost Hills, over 80% of the city block group closest to the Lost Hills Oil Field has a median income less than or equal to $40,000. The same trend is visible for Lamont, Taft, and Arvin. In Figure 9, the only section of Taft with higher annual median income is sparsely populated and predominantly open space, as confirmed in Figure 3. For the areas of Frontline Community block groups within 2,500 feet of an operational well, 36% of the population makes under $40,000; 80% of the Kern County annual median income is $41,000.
In the maps below, the American Community Survey data is summarized in percentages of one, where, for example, light orange (<.400) in the map refers to areas where 20% – 40% of the population’s annual median income is less than or equal to $40,000.
Table 3. Demographical Profile of each city, including the percentage of Spanish-speaking households and proportion of households with limited English proficiency.
Figure 7. Lost Hills income disparity: This map shows the population percentage with annual incomes of less than or equal to $40,000, which is less than 80% of the Kern median income of $51,579 (2018).
Figure 8. Lamont income disparity: This map shows the population percentage with annual incomes less than or equal to $40,000, which is less than 80% of the Kern median income of $51,579 (2018).
Figure 9. Taft income disparity: This map shows the population percentage with annual incomes less than or equal to $40,000, which is less than 80% of the Kern median income of $51,579 (2018).
Figure 10. Arvin income disparity: This map shows the population percentage with annual incomes less than or equal to $40,000, which is less than 80% of the Kern median income of $51,579 (2018).
Linguistic Isolation Disenfranchises Frontline Communities
Access to information is vital for representation. Without representation, communities have no power over their autonomy. Kern County’s Frontline Communities are denied this basic, but absolutely vital right. According to the U.S. Census, over 51% of Kern County is Hispanic, and the maps below show that the demographics of the Frontline Communities in these cities are regularly between 80 – 100% Hispanic. Additionally, the maps illustrate that the households in these communities are majority Spanish-speaking households, many with limited English proficiency (all persons aged five and older reported speaking English less than “very well”). Yet Kern County regulators only provide information, notices, and other materials in English. This linguistically segregates power in Kern County, limiting Spanish-speaking Kern residents and citizens from participating in local decision-making processes.
Using the five-year ACS census data (2018) clipped by the 2,500 feet well setback zone, I have calculated the percentage and number of Spanish-speaking households. For the areas of Frontline Community block groups within 2,500 feet of an operational well, 9,077 households (30.8%) speak Spanish as their primary language, and 1,900 households have limited access to proficient English translators.
Figure 11. Lost Hills Hispanic population demographics: This map shows the Hispanic percentage of the population. In these maps, the ACS data is summarized in percentages of one, where, for example, light orange (<.400) refers to areas where 20% – 40% of the population is Hispanic.
Figure 12. Lost Hills Spanish-speaking households: This map shows the percentage of the households that speak Spanish as their primary language. In these maps, the ACS data is summarized in percentages of one, where, for example, light orange (<.400) refers to areas where 20% – 40% of the households are Spanish speaking.
Figure 13. Lost Hills Limited English Spanish-speaking households: This map shows the household percentage that speak Spanish as their primary language, with limited English-speaking proficiency. In these maps, the ACS data is summarized in percentages of one, where, for example, light orange (<.400) refers to areas where 20% – 40% of the households are Spanish speaking and have limited English proficiency.
Figure 14. Lamont Hispanic population demographics: This map shows the Hispanic percentage of the population. In these maps, the ACS data is summarized in percentages of one, where, for example, light orange (<.400) refers to areas where 20% – 40% of the populations is Hispanic.
Figure 15. Lamont Spanish-speaking households: This map shows the percentage of the households that speak Spanish as their primary language. In these maps the ACS data is summarized in percentages of one, where, for example, light orange (<.400) refers to areas where 20% – 40% of the households are Spanish speaking.
Figure 16. Lamont Limited English Spanish-speaking households: This map shows the percentage of the households that speak Spanish as their primary language, with limited English-speaking proficiency. In these maps, the ACS data is summarized in percentages of one, where, for example, light orange (<.400) refers to areas where 20% – 40% of the households are Spanish speaking and have limited English proficiency.
Figure 17. Taft Hispanic population demographics: The map shows the Hispanic percentage of the population. In these maps the American Community Survey data is summarized in percentages of 1, where, for example, light orange (<.400) in the map below refers to areas where 20%-40% of the populations is Hispanic.
Figure 18. Taft Spanish-speaking households: This map shows the percentage of the households that speak Spanish as their primary language. In these maps, the ACS data is summarized in percentages of one, where, for example, light orange (<.400) refers to areas where 20% – 40% of the households are Spanish speaking.
Figure 19. Arvin Hispanic population demographics: This map shows the Hispanic percentage of the population. In these maps, the ACS data is summarized in percentages of one, where, for example, light orange (<.400) refers to areas where 20% – 40% of the populations is Hispanic.
Figure 20. Arvin Spanish-speaking households: This map shows the percentage of the households that speak Spanish as their primary language. In these maps, the ACS data is summarized in percentages of one, where, for example, light orange (<.400) refers to areas where 20% – 40% of the households are Spanish speaking.
Figure 21. Arvin Limited English Spanish-speaking households: This map shows the percentage of the households that speak Spanish as their primary language, with limited English-speaking proficiency. In these maps, the ACS data is summarized in percentages of one, where, for example, light orange (<.400) refers to areas where 20% – 40% of the households are Spanish speaking, with limited English proficiency.
Figure 22. Shafter Hispanic population demographics: This map shows the Hispanic percentage of the population. In these maps, the ACS data is summarized in percentages of one, where, for example, light orange (<.400) refers to areas where 20% – 40% of the populations is Hispanic.
Figure 23. Shafter Spanish-speaking households: This map shows the percentage of the households that speak Spanish as their primary language. In these maps, the ACS data is summarized in percentages of one, where, for example, light orange (<.400) refers to areas where 20% – 40% of the households are Spanish speaking.
Figure 24. Bakersfield Hispanic population demographics: This map shows the Hispanic percentage of the population. In these maps, the ACS data is summarized in percentages of one, where, for example, light orange (<.400) refers to areas where 20% – 40% of the populations is Hispanic.
Figure 25. Bakersfield Spanish-speaking households: This map shows the percentage of the households that speak Spanish as their primary language. In these maps, the ACS data is summarized in percentages of one, where, for example, light orange (<.400) refers to areas where 20% – 40% of the households are Spanish speaking.
Conclusions
These maps make it visually clear that the Frontline Communities near oil and gas extraction in Kern County are largely disenfranchised from the democratic process, a direct result of California’s regulatory agencies refusing to provide notices and other important documents and information in Spanish. Additionally, these same communities have limited options, due to economic disparities that make Kern County’s Frontline Communities the poorest in the state of CA. These two factors leveraged against communities prevent them from obtaining self-governance or autonomy over the industrialization occurring in and around their neighborhoods. Furthermore, the demarcations of census boundaries splitting the incorporated and unincorporated cities are essentially gerrymandered to disguise the blatant environmental inequities that exist in Kern County, in direct violation of the California Environmental Quality Act. Kern County must consider these injustices in the development of new environmental impact review requirements for oil and gas operators.
The following addendum incorporates additional demographics data that more thoroughly describes Frontline Communities in Kern County. We focus on the Frontline Communities closest to intense oil extraction operations. This analysis prioritizes areas with substantial population density. Remote sensing (satellite imagery) data and direct knowledge of Kern County cities was used to define the sample areas for this analysis. These techniques and methods avoid the type of spatial bias that distorted the results of the environmental justice (EJ) analysis inthe 2020 Kern County draft EIR (chapter 7 PDF pp.1292-1305).
2020 Kern County Draft EIR
The EJ analysis included in the 2020 Kern County Draft EIR uses the spatial bias of US census designated areas to generate false conclusions. The Draft EIR can do this in two ways:
First, the Draft EIR uses census tracts in the place of smaller census designated areas. The draft EIR states the county conducted, “an analysis of Kern County census tract five-year American Community Survey (ACS) demographic and poverty data for the period was conducted … and the five-year data is the most accurate form of ACS data, has the largest sample size, and is the only ACS data that covers tiny populations.” While this is true about the five-year data, the authors chose to analyze using census tracts, which are much too large to cover small populations. It is not clear why the authors would have chosen census tracts, rather than the higher resolution ‘census block groups’ ACS dataset, as both datasets are readily available from the US Census Bureau.
Additionally, the draft EIR limits the sociodemographic analysis to only census tracts that contain PLSS QTR/QTRS’s ranked as Tier 1, so that it does not include neighboring communities in different census tracts in the demographical analysis. As discussed in the draft EIR, Tier 1 areas contain four or more operational wells in a tiny area. The draft EIR explicitly states that Tier 1 Qtr(s) do not contain schools or healthcare facilities. This trend is not limited to just the Qtr/Qtr sections. The census tracts containing the Tier 1 sections contain very few sensitive receptors, like schools and healthcare facilities. This is because census tracts and other census designated areas are drawn specifically to differentiate between urban and rural/industrial areas. Census tracts containing oil fields cover large rural areas, and intentionally avoid areas with any significant population density. This results in donuts and other strange shapes, where communities in much smaller census tracts (by area) are enveloped by large rural census tracts containing oil fields. As shown in the maps below, this eliminates all communities with any real population density from the draft EIR EJ analysis, even though they are the communities nearest to the oil fields.
In the maps below, census tracts are compared to census block groups, to show the difference in size and nature of their spatial distribution. In most cases, census tracts encompassing populated areas are tiny, and limited to the urban boundaries of cities. In the cases of Shafter and Arvin, the residential census tracts are encircled by a different donut-shaped census tract, actually containing most of the operational wells and oil fields. While the census tracts of the Frontline Communities are within very short distances of operational oil and gas wells and major fields at large, most communities are not included in the Kern 2020 draft EIR EJ analysis. With Lost Hills, the city of Lost Hills is within the same census tract as the Lost Hills oil field and several other extensive oil fields. The city of Lost Hills is the closest community to oil extraction operations in the census tract, and the small city contains just over 50% of the total population within this massive census tract. But because of the sheer size of the census tract, demographics of this Frontline Community are diluted by the vast rural area of northwestern Kern County, which is higher income with demographics 10% less Latino.
Map A1. Arvin Census Designated Areas. The map shows the city of Arvin and includes both census tracts and census block groups for comparison. It shows operational oil and gas wells in the map, along with 2,500’ buffers. This Frontline Community would be excluded in an analysis that only considers census tracts containing Tier 1 areas negatively impacted by oil and gas extraction operations. The census tracts that make up the majority of the city of Arvin are enveloped on all four sides by one larger census tract that contains most oil and gas wells.
Map A2. Shafter Census Designated Areas. The map shows the city of Shafter and includes both census tracts and census block groups for comparison. It shows operational oil and gas wells in the map, along with 2,500’ buffers. This Frontline Community would not be included in an analysis that only considers census tracts containing Tier 1 areas negatively impacted by oil and gas extraction operations. The census tract containing the North Shafter oil field forms a donut around the city of Shafter.
Map A3. Lost Hills Census Designated Areas. The map shows the city of Lost Hills and includes both census tracts and census block groups for comparison. It shows operational oil and gas wells, along with 2,500’ buffers. While the city of Lost Hills may be included in the 2020 Kern draft EIR EJ analysis, the results will not reflect the demographics of the community due to the incredibly large size of the census tract. It does not even entirely fit in the frame of this map!
Map A4. Bakersfield Census Designated Areas. The map shows the city of Bakersfield and includes both census tracts and census block groups for comparison. It shows operational oil and gas wells, along with 2,500’ buffers. This Frontline Community would not be included in an analysis that only considers census tracts containing Tier 1 areas negatively impacted by oil and gas extraction operations. The oil and gas wells in the Kern River, Kern Front and other oil fields make up their own unique census tract that also includes extensive areas of rural ‘estate’ zoned lands.
Demographics Analysis
In the initial report below we analyzed the demographics and linguistic isolation of communities who live within 2,500’ of operational oil and gas wells. We found that the urban census block groups closest to Kern’s major oil and gas fields are some of the most linguistically isolated regions in the country. Densely populated block groups near large oil fields in the cities of Lost Hills, Arvin, Lamont and Weepatch suffer from linguistic isolation, where up to 80% of households do not have a proficient english speaker. In the analysis that follows, we focus more on specific Frontline Communities. Generating county-wide statistics using census block groups could result in too much spatial bias. Census designated areas do not have enough uniformity, and those located in and near oil fields are large in area (though would still provide a more accurate picture in comparison to census tracts). Therefore the analyses that follow take a community-centric approach to more accurately describe the demographics of several of Kern’s largest, most populous, Frontline Communities.
Shafter
The City of Shafter, California, is near over 100 operational wells in the North Shafter oil field, as shown below in the map in Figure 2. Technically, the wells are within a donut-shaped census block group (outlined in blue) that surrounds the limits of the urban census block groups (outlined in pink). Shafter’s population of nearly 20,000 is over 86% Latinx, but the surrounding “donut” with just 2,000 people is about 70% Latinx, much wealthier, and with very low population density. The other neighboring rural census areas housing the rest of the Shafter oil field wells follow this same trend.
An uninformed analysis, such as the Kern County EIR, would conclude that the 2,000 individuals who live within the blue “donut” are at the highest risk, because they share the same census designated area as the wells. Notably, the only population center of this census block group (or census tracts, which follow this same trend) is at the opposite end of the block group, far from the Shafter oil field. Instead, the most at-risk community is the urban community of Shafter with high population density; the census block groups within the pink hole of the donut contain the communities and homes nearest the North Shafter field.
Map A5. The City of Shafter, California is located just to the south of the North Shafter oil field. The map shows the 2,500’ setback distance in tan, as well as the census block groups in both pink and blue. Pink block groups show the urban case populations used to generate the demographic summaries.
Lost Hills, Arvin, and Taft
The cities of Lost Hills, Arvin, and Taft are all very similar to Shafter. The cities have densely populated urban centers within or directly next to an oil field. In the maps below in Figures 3 readers can see the community of Lost Hills next to the Lost Hills oil field. Lost Hills, like the densely populated cities of Arvin and Taft, are located very close to large scale extraction operations. Census block groups that include the most affected area of Lost Hills, outlined in pink, while surrounding low population density census block groups are shown in blue. Most of the areas outlined in blue are zoned as “estate” and “agriculture” areas. The outlines of the city boundaries are also shown, along with 2,500’ and mile setback distances from currently operational oil and gas wells.
Lost Hills is another situation where a donut-shaped census area distorts the results of low resolution demographics assessments, such as the one conducted by Kern County in their 2020 Draft EIR (PDF pp. 1292-1305). Almost all of the wells within the Lost Hills oil fields are just outside of a 2,500’ setback, but the incredibly high density of extraction operations results in the combined impact of the sum of these wells on degraded air quality. While stringent setback distances from oil and gas wells are a necessary component of environmental justice, a 2,500’ setback on its own is not enough to reduce exposures and risk for the Frontline Community of Lost Hills. For these Frontline Communities, a setback needs to be much larger to reduce exposures. In fact, limiting a public health intervention to a 2,500′ setback requirement alone is not sufficient to address the environmental health inequities in Lost Hills, Shafter, and other similar communities.
Lost Hill’s nearly 2,000 residents are over 99% Latinx, and over 70% of the households make less than $40,000 in annual income (which is substantially less than the annual median income of Kern County households [at $52,479]). The map in Figure A6 shows that the Lost Hills public elementary school is within 2,500’ of the Lost Hills oil field and within two miles of over 2,600 operational wells, besides the 6,000 operational wells in the rest of the field.
The City of Arvin has 8 operational oil and gas wells within the city limits, and another 71 operational wells within 2 miles. Arvin, with nearly 22,000 people, is over 90% Latinx, and over 60% of the households make less than $40,000 in annual income.
Additionally the City of Taft, located directly between the Buena Vista and Midway Sunset Fields, has a demographic profile with a Latinx population at least 10% higher than the rest of southern Kern County.
Lost Hills, Arvin, and Taft are among the most affected communities of Kern County and represent a large proportion of the Kern citizens at risk of exposure to localized air quality degradation from oil and gas extraction.
In these cases, if only census tract well counts are considered, like in the 2020 Kern County draft EIR, these Frontline Communities will be completely disregarded. Census tracts are intentionally drawn to separate urban/residential areas from industrial/estate/agricultural areas. The census areas that contain the oil fields are very large and sparsely populated, while neighboring census areas with dense population centers, such as these small cities, are most impacted by the oil and gas fields.
Map A6. The Unincorporated City of Lost Hills in Kern County, California is within 2,500’ of the Lost Hills Oil Field. The map shows the 2,500’ setback distance in tan, and the census block groups in both pink and blue. Pink block groups show the urban case populations used to generate the demographic summaries.
Bakersfield
The City of Bakersfield is a unique scenario. It is the largest city in Kern County and as a result suburban developments surround parts of the city. Urban flight has moved much of the wealth into these suburbs. The suburban sprawl has occurred in directions including North toward the Kern River oil field, predominantly on the field’s western flank in Oildale and Seguro. In the map below in Map A7, these areas are located just to the north of the Kern River.
This is a poignant example of the development of cheap land for housing developments in an area where oil and gas operations already existed; an issue that needs to be considered in the development of setbacks and public health interventions and policies. This small population of predominantly white, middle class neighborhoods shares similar risks as the lower-income Communities of Color who account for most Bakersfield’s urban center. Even though these suburban communities are less vulnerable to the oppressive forces of systemic racism, real estate markets will continue to prioritize cheap land for development, moving communities closer to extraction operations.
Regardless of the implications of urban sprawl and suburban development,it is important to not disregard environmental risks for all communities. The demographics of the at-risk areas of the city of Bakersfield are predominantly Non-white (31%) and Latinx (60%), particularly as compared to the city’s suburbs (15% Non-white and 26% Latinx). About 33,000 people live in the city’s northern suburbs, and another 470,000 live in Bakersfield’s urban city center just to the south of the Kern River oil field. The urban population of Bakersfield is exposed to the local and regional negative air quality impacts of the Kern River and numerous other surrounding oil fields making it a disparately impacted community.
Map A7. Map of the city of Bakersfield in Kern County, California between several major oil fields including the Kern Front oil field. The map shows the 2,500’ setback distance in tan, and the census block groups in both pink and blue. Pink block groups show the urban case populations used to generate the demographic summaries.
https://www.fractracker.org/a5ej20sjfwe/wp-content/uploads/2020/09/Pump_Jack_at_the_Lost_Hills_Oil_Field_In_Central_California-feature.jpg8331875Kyle Ferrar, MPHhttps://www.fractracker.org/a5ej20sjfwe/wp-content/uploads/2025/09/2025-Wordmark-Logo.pngKyle Ferrar, MPH2020-09-16 19:45:072021-04-15 14:16:08Recommendations for an EIR to prioritize Kern County Frontline Communities
New Fortress Energy plans to build a liquefied natural gas (LNG) plant in Wyalusing, Pennsylvania, but residents in close proximity to the extensive facility and those along the transportation routes are pushing back due to health and safety concerns.
Overview
North America has an excess of fracked gas. The price of gas continues to plummet, due largely to an oversupply that exceeds market demand from Americans who want to enjoy their so-called “energy independence.” According to the United States Energy Information Administration (EIA), there is almost 18% more stored gas at the end of 2019 as there was at the end of 2018, translating to an increase of over 500 billion cubic feet over the course of a year.
What was once a promised economic boom to many communities has given way to bust. This is due, in part, to less production across the fracking fields, to the cancellation of numerous pipelines, and to the lack of domestic markets for fracked gas.
As costs for wind, solar, and grid-scale battery storage continue to drop, people are increasingly less reliant on fossil fuels. Aside from underground storage, what can industry do with all that excess product so industry has a justification to keep drilling?
Rather than cutting back on production, industry chooses to relieve domestic over-saturation by sending the gas off-shore for export.
While gas is typically moved from source to consumer via pipelines, transporting gas long distances overseas presents a technical challenge. Industry chooses to compress the gas under pressure or cryogenics so that it takes up less space. Liquefied natural gas, or LNG, is simply super-cooled methane, stored at minus 260 degrees Fahrenheit.
A new LNG project in northern Pennsylvania
A little more than a year ago, New Fortress Energy announced plans to invest $800 million to develop a liquefied natural gas plant along the scenic Susquehanna River in the Bradford County, Pennsylvania community of Wyalusing. In this quiet community of fewer than 600 people, formerly open fields and woodland are slated to be converted into massive LNG complex spanning 260 acres. The plant would produce approximately 3.6 million gallons of LNG each day.
Located on the site of the proposed LNG project is a historic marker, memorializing the pre-Colonial settlement of Friedenshütten. Here, indigenous Mahican, Lenape, and Haudenosaunee converts to Christianity lived with Moravian missionaries. The village was active between 1765 and 1772. According to Katherine Faull of Bucknell University “the Friedenshütten mission was dissolved in 1772, ostensibly because of the uncertainty of the land deals that had been made with the Cayuga who had jurisdiction over that part of Pennsylvania.” Portions of the settlement structure area visible in the 1768 map (Figure 1) are 700 feet from the New Fortress methane liquefaction buildings.
Figure 1. Map by Georg Wenzel Golkowsky, 1768 (TS Mp.213.13, Unity Archives, Herrnhut)
New Fortress Energy has plans to cut a 50-foot-wide stormwater drainage ditch directly through this historic site. Construction of the plant would reportedly create up to 500 temporary jobs, and 50 permanent ones.
Figure 2. Aerial view of site preparation work at the New Fortress LNG plant site. Source: Ted Auch, FracTracker Alliance
The site plan for the new facility, developed in October 2018, includes large gas engines, a liquefaction facility, a hydrocarbon impoundment basin, LNG storage and pumps, a gas treatment facility, transformers, and tanker staging areas. Some features are sited within 500 feet of the railroad.
Figure 3. Proposed site plan of the New Fortress LNG facility in Wyalusing, Pennsylvania. Map by FracTracker Alliance.
An air quality plan for the New Fortress LNG facility was approved in July, 2019. Although construction was well underway starting in spring 2019, work is currently paused on the site. New Fortress has not indicated when work would resume, but expects the construction process to span two to 2.5 years.
Where to, after Wyalusing?
Without an adequate market for the gas in the United States, LNG is destined for shipping overseas in specially-designed LNG carrier ships. In 2018, according to US government data reported in rigzone.com:
“….28 countries in total received LNG exports during 2018. However, just ten countries accounted for 82 percent of the U.S. LNG direct tanker exports that year and the top four markets shared 187 shipments between them. South Korea, the top destination, received 73 cargoes in all, followed by Mexico with 53, Japan with 37 and lastly China with 24. Of the remainder, Jordan, Chile, India, Turkey, Spain, Argentina, and Brazil took only a small number of shipments each. In addition to the standard large shipments of LNG in dedicated tankers, small shipments of LNG in special containers known as ISOs were sent to the Bahamas and Barbados.”
Presently, plans are in the works for the construction of a new LNG export facility in Gibbstown, New Jersey, located just downstream from Philadelphia on the Delaware River. The Gibbstown site was formerly the home of Dupont Repauno Works, where dynamite was manufactured from 1880 to 1954. Later, the main products made there were commodity chemicals such as nitric acid. The proposed export terminal design includes two 43-foot-deep docks that would accommodate LNG tankers.
The advocacy organization “Empower NJ” provides a comprehensive description here of the proposed expansion of the deepwater LNG export terminal at Gibbstown. LNG delivered to the site would be stored in an old underground cavern previously used by Dupont. While dredging for a single dock at Gibbstown was approved by the Delaware River in 2019, new plans to build two more loading berths at a second dock are now under consideration.
Modes of transportation from Wyalusing to Gibbstown
In collaboration with Delaware Riverkeeper Network (DRN), FracTracker looked at potential overland routes for how the LNG produced in Wyalusing would reach the nearest export terminal in Gibbstown, New Jersey, a distance of 200 or more miles away.
While transportation by rail of liquefied natural gas had not been permitted by federal regulations, a significant change in rules occurred in June 2020. Under pressure from the current administration in Washington, DC, the Pipeline and Hazardous Materials Safety Administration (PHMSA) issued a final rule that authorized the bulk transportation of LNG by rail.
Plans on how to deliver the LNG from the plant in Wyalusing to the export terminal in Gibbstown, New Jersey have not been finalized, and could be by roadway or railway, or both. According to the Wilkes-Barre, Pennsylvania-based Citizen’s Voice:
In its assessment, PHMSA concluded that transporting LNG via roadways carries the same inherent risks as railways, but there is a higher likelihood of an accident because of the larger number of trucks needed compared to train cars.
The DOT-113 tank cars New Fortress received approval for can carry nearly 30,700 gallons of LNG — three times more than a single tanker truck. But, because train cars carry significantly more LNG and are transported together along railways, an incident “could lead to higher consequences,” according to the environmental assessment.
How much risk?
Because there is little to no precedent of transporting such high volumes of liquefied natural gas on roads or railroads, the extent of the disaster that could occur from a leak or crash is generally unknown. However, Delaware Riverkeeper has cited research warning about the unique characteristics of supercooled gas if it rapidly expands and spreads across terrain:
“….transport of LNG has unique safety hazards, exposing those along this particular rail route to unprecedented and unjustifiable risk. An LNG release boils furiously into a flammable vapor cloud 600 times larger than the storage container. An unignited ground-hugging vapor cloud can move far distances,[1] and exposure to the vapor can cause extreme freeze burns. If in an enclosed space, it asphyxiates, causing death.1 If ignited, the fire is inextinguishable; the fire is so hot that second-degree burns can occur within 30 seconds for those exposed within a mile. An LNG release can cause a Boiling Liquid Expanding Vapor Explosion.[2] The explosive force of LNG is similar to a thermobaric explosion – a catastrophically powerful bomb. The 2016 U.S. Emergency Response Guidebook advises fire chiefs initially to immediately evacuate the surrounding 1-mile area.[3] No federal field research has shown how far the vapor cloud can move chiefs initially to immediately evacuate the surrounding 1-mile area.[4] No federal field research has shown how far the vapor cloud can move…”
You can read Delaware Riverkeeper’s full statement of the organization’s opposition to the transportation of LNG in rail cars here.
Visualizing the routes
FracTracker mapped the most likely transport routes by road and by rail, along with demographic information (Figures 5 – 9). In collaboration with DRN, we also assessed minority and low-income population density along each route, using the Environmental Protection Agency (EPA)’s environmental justice (EJ) screening dataset, EJSCREEN. “Minority” as defined by the United States Census data used by EPA, refers to individuals who reported their race and ethnicity as something other than “non-Hispanic White” alone.
On average, around 21% of the population along the truck routes, and about 25% of the population along the train routes, is part of an EJ community. EJ communities are those that are disproportionately impacted by environmental hazards and with increased vulnerability to said hazards. Due to systemic racism, injustice, and poverty, EJ communities tend to have higher proportions of residents who are low-income and/or minorities.
Total Population
Minority Population
Low-Income Population
Truck Route A
612,747
123,071 (20%)
122,830 (20%)
Truck Route B
929,236
207,924 (22%)
183,420 (20%)
Rail Route A
1,649,638
477,816 (29%)
392,577 (24%)
Rail Route B
1,947,544
479,500 (25%)
411,536 (21%)
Figure 4. Demographics of Environmental Justice (EJ) communities along New Fortress Energy’s liquified natural gas (LNG) transportation routes in the eastern United States.
Click here to view this map fullscreen, in its own window.
And click through the tabs below to see static images of the various routes.
Rail Route A
Figure 5. Rail Route A passes within 2 miles of a population of 1,649,638. 29% (477,816 individuals) are minorities, and 24% (392,577 individuals) are low income, according to 2010 US Census data compiled by the Environmental Protection Agency as part of their EJSCREEN program. Map made by FracTracker Alliance and published by Delaware Riverkeeper Network.
Rail Route B
Figure 6. Rail Route B passes within 2 miles of a population of 1,947,544. 25% (479,500 individuals) are minorities, and 21% (411,536 individuals) are low income, according to 2010 US Census data compiled by the Environmental Protection Agency as part of their EJSCREEN program. Map made by FracTracker Alliance and published by Delaware Riverkeeper Network.
Rail Route A Detail
Figure 7. Detail of Rail Route A close to proposed export terminal, and showing minority population density within 2 miles of the route. Map made by FracTracker Alliance and published by Delaware Riverkeeper Network.
Rail Route B Detail
Figure 8. Detail of Rail Route B close to proposed export terminal, and showing population density within 2 miles of the route. Map made by FracTracker Alliance and published by Delaware Riverkeeper Network.
Truck Route A
Figure 9. Truck Route A passes within 2 miles of a population of 612,747. 20% (123,071 individuals) are minorities, and 20% (122,830 individuals) are low income, according to 2010 US Census data compiled by the Environmental Protection Agency as part of their EJSCREEN program. Map made by FracTracker Alliance and published by Delaware Riverkeeper Network.
Truck Route B
Figure 10. Truck Route B passes within 2 miles of a population of 929,236. 22% (207,924 individuals) are minorities, and 20% (183,420 individuals) are low income, according to 2010 US Census data compiled by the Environmental Protection Agency as part of their EJSCREEN program. Map made by FracTracker Alliance and published by Delaware Riverkeeper Network.
Truck Route A Detail
Figure 11. Detail of Truck Route A close to proposed export terminal, and showing minority population density within 2 miles of the route.
Truck Route B Detail
Figure 12. Detail of Truck Route B close to proposed export terminal, and showing minority population density within 2 miles of the route. Map made by FracTracker Alliance and published by Delaware Riverkeeper Network.
Growing municipal and regulatory opposition to transport of LNG through communities
Municipal opposition against the plan to construct the LNG facility at Wyalusing is mounting. On Wednesday, September 2, 2020, the Borough Council of Clarks Summit, Pennsylvania (Lackawanna County) voted in opposition to the New Fortress Energy LNG project. Their resolution asked the Delaware River Basin Commission to vote to disapprove Dock 2, the cargo destination of the LNG trucks and trains that will be traversing Lackawanna County with their hazardous content.
And in most recent news, on September 10, the Delaware River Basin Commission (DRBC) voted to delay approving an application to expand the port facilities at Gibbstown, NJ that would have enabled LNG tankers to dock there. In this important turn of events, the representatives from New York, Delaware and New Jersey voted for the delay, while the Pennsylvania representative abstained, and the Federal representative from the US Army Corps of Engineers voted to deny it. The vote was preceded by a comment period in which the public expressed unanimous desire to stop the project, citing impacts to human and environmental health, as well as impacts from methane on climate catastrophe.
In the upcoming months, prior to when they meet again until December, the DRBC will more deeply consider the details of the application. Until that time, forward progress on the LNG plant and the export terminal is effectively halted.
8/24/21: This article was updated with the following information:
At their December meeting, the DRBC issued a final approval for construction of the terminal to move ahead, voting 4-0 in favor of the proposal, with the representative from New York State abstaining.
In conclusion
As communities start to consider the impacts to health and safety posed by massive fossil fuel infrastructure—whether that is pipelines, compressor stations, drilling operations, or rail and road transport—clean energy alternatives like solar, wind, and geothermal become the sensible option for all. We applaud the elected officials in Clarks Summit for their vote early this month, and look forward to more following suit.
To stay up to date on the regional pushback against LNG and engage your voice in resistance, learn more at protectnorthernpa.org or sign-up to become an E-activist with Delaware Riverkeeper Network.
Feature photo by Ted Auch, FracTracker Alliance, with aerial support by Lighthawk
[1] “Immediate ignition with liquid still on the ground could cause the spill to develop into a pool fire and present a radiant heat hazard. If there is no ignition source, the LNG will vaporize rapidly forming a cold gas cloud that is initially heavier than air, mixes with ambient air, spreads and is carried downwind.” P. 10 “Methane in vapor state can be an asphyxiant when it displaces oxygen in a confined space.” P. 11. SP 20534 Special Permit to transport LNG by rail in DOT-113C120W rail tank cars. Final Environmental Assessment. Docket No. PHMSA-2019-0100. December 5, 2019. P. 10.
[2] “LNG tank BLEVE is possible in some transportation scenarios.” Sandia National Laboratories, “LNG Use and Safety Concerns (LNG export facility, refueling stations, marine/barge/ferry/rail/truck transport)”, Tom Blanchat, Mike Hightower, Anay Luketa. November 2014. https://www.osti.gov/servlets/purl/1367739 P. 23.
https://www.fractracker.org/a5ej20sjfwe/wp-content/uploads/2020/09/Aerial-view-of-site-preparation-work-at-the-New-Fortress-LNG-plant-site-scaled.jpg5681500Karen Edelsteinhttps://www.fractracker.org/a5ej20sjfwe/wp-content/uploads/2025/09/2025-Wordmark-Logo.pngKaren Edelstein2020-09-15 10:13:212021-08-24 14:53:19LNG development puts Wyalusing, Pennsylvania in the cross-hairs
On August 3, 2020, New Yorkers rejoiced in Governor Cuomo’s signing of legislation to protect the Empire State from Pennsylvania’s fracking waste. Although New York State has banned high-volume, horizontal hydraulic fracturing, or “fracking” within its borders, a fracking waste loophole allowed numerous landfills to received both solid and liquid waste products from drilling operations just south of its border, according to records from the Pennsylvania Department of Environmental Protection (PA DEP).
What has been at stake
A regulatory loophole in New York State’s laws exempted drilling waste from scrutiny as hazardous materials. Therefore, solid and liquid wastes from drilling operations — including many constituents which are considered secret or “proprietary” — were sent to landfills, and in some cases, spread on roads and walkways in the state. Municipalities were provided with very little understanding of the risks those materials might be posing to air and water quality in and around landfills. Until the signing of this legislation, New York State Department of Environmental Conservation has considered road-spreading of waste brine from both conventional and unconventional oil and gas wells that was spread on roads a “BUD,” or a beneficial use determination.
Nevertheless, research has shown that produced water from fracking operations can contain tens to thousands of times the allowable drinking water concentration limit of radium, strontium, barium, lead, arsenic, and other elements. Human health impacts of all phases of drilling operations were explored in a recent paper by Wollin et al. (May 2020).
Water that flows to the surface from oil and gas wells, so-called ‘produced water’, represents a mixture of flow-back, the injected frac fluid returning to the surface, and the reservoir water present in natural oil and gas deposits. Among numerous hazardous compounds, produced water may contain bromide, arsenic, strontium, mercury, barium, radioactive isotopes and organic compounds, particularly benzene, toluene, ethylbenzene and xylenes (BTEX). The sewage outflow, even from specialized treatment plants, may still contain critical concentrations of barium, strontium and arsenic. Evidence suggests that the quality of groundwater and surface water may be compromised by disposal of produced water.
Carcinogenic and radioactive wastes that are brought to the surface with both conventional and unconventional drilling technologies can have toxic impacts on human health and the natural environment, impacting the endocrine, nervous, cardiovascular, and respiratory systems, as well as air and water quality. According to the Natural Resources Defense Council, more than 75 percent of the chemicals used in fracking are associated with harm to human organs, while 25 percent are tied to cancer and other genetic mutations.
How could this be allowed?
Although the federal Resource Conservation and Recovery Act (RCRA)—passed in 1976—specifically safeguards human and environmental health, an amendment to the Act in 1980 exempted from regulation all waste from oil and gas exploration, development, and production. Despite close to 40 years of federal oversight of pollution created by countless industries, oil and gas operations have been subject to far more lax regulations. And although states can pass their own regulations to supplement the federal rule-making, this had not occurred in New York State.
The lead-up to the legislation
The recent legislation to close the fracking loophole in New York State was sponsored in 2019 by Senator Rachel May and Assemblyman Steve Engelbright. Lawmakers had been deadlocked on the issue since 2011, but through much hard work, political and public will, and a favorable complement of elected officials, after the bills finally passed both the New York State Senate and Assembly, they could move to Governor Andrew Cuomo’s desk, where they were signed into law in early August, 2020. According to EarthWorks, all oil and gas waste will be
Subject to laboratory analysis to determine whether it has the characteristics of hazardous waste (i.e., ignitability, corrosivity, reactivity, and toxicity)
Subject wastes to clearer, stronger management regulations like processing, tracking and marking of loads, recordkeeping with a manifest system, reporting to DEC, and specific requirements for clean up in the case of a spill
In addition, the law ensures that waste is disposed of only at facilities equipped to safely handle it.
Now, even wastes like brine from conventional drilling operations must undergo laboratory analysis to determine whether they have characteristics consistent with hazardous materials.
Here’s a look back at our history of accepting fracking waste from Pennsylvania into New York State.
Visualizing a long history of oil and gas waste coming to New York State from Pennsylvania
FracTracker has annually mapped the flow of drilling waste from Pennsylvania to New York State.
Since 2011, nearly 29,000 barrels of fracking liquid waste (drilling fluids, fracturing fluids, produced waters, etc.), along with close to 645,000 tons of solid waste (drill cuttings—some of it radioactive, sludge, contaminated soils, etc.) from Pennsylvania drilling operations have been disposed of in New York State. For more references on radioactivity in drilling materials, explore this resource. Drilling waste reports available from 2010 through the present show a steady decline in waste sent to New York State, beginning in 2011. Nonetheless, New York’s landfills have received as much as 11,548 barrels of drilling waste, and 214,168 tons of solid waste in a given year.
PA DEP’s records are far from complete prior to 2016, however, with disposal destinations unknown for close to 2/3 of liquid waste (see yellow portions of the bar chart in Figure 1) generated between 2012 and 2015.
In more recent years, waste products were accounted for more accurately, as well as shipped to injection wells in Ohio.
On a relatively smaller scale, one can also see how West Virginia’s acceptance of Pennsylvania’s fracking waste has skyrocketed in 2018 and 2019, particularly in comparison to states other than Pennsylvania and Ohio (Figure 2).
Figure 2. Pennsylvania’s liquid unconventional drilling waste disposal by state (excluding Pennsylvania and Ohio), 2010-2019
In general, records indicate more solid waste disposal occurring within Pennsylvania over time, with Ohio accepting varying quantities from year to year, and New York State steadily receiving less over time (Figure 3).
Now that the regulatory loophole has been closed, these numbers should drop to near zero. Data about waste coming from Pennsylvania to New York in the first half of 2020 support that assertion (Figures 4 and 5).
FracTracker applauds New York State for closing the fracking waste loophole and in doing so, continuing to set high standards to protect its residents from the human and environmental impacts created by oil and gas extraction. We hope that other states will follow suit, and develop their own stringent standards to protect human and environmental health, in particular where federal legislation like RCRA has fallen woefully short.
https://www.fractracker.org/a5ej20sjfwe/wp-content/uploads/2020/08/TAuch_Infrastructure-FrackPad_ImpoundmentPond_AccessRoad-PineCreekWatershed_PA_LightHawk_Aug2019-Feature.jpg8331875Karen Edelsteinhttps://www.fractracker.org/a5ej20sjfwe/wp-content/uploads/2025/09/2025-Wordmark-Logo.pngKaren Edelstein2020-08-28 15:38:042021-04-15 14:16:10New York State Closes the Fracking Waste Loophole
By Emma Vieregge, FracTracker Summer 2020 Environmental and Health Fellow
Overview
Unconventional oil and natural gas development, or “fracking,” began in Pennsylvania in the early 2000s. Since then, over 12,000 unconventional wells have been drilled in the state, and over 15,000 violations have been documented at unconventional well sites. As fracking operations continue to expand, increasing numbers of residents have experienced significant health impacts and irreparable damage to their property. Southwest Pennsylvania in particular has been heavily impacted, with high concentrations of oil and gas infrastructure developed in Washington, Greene, and Fayette Counties.
Fracking operations have led to declining air quality, water and soil contamination, and drastic changes to the physical landscape including deforestation, habitat fragmentation, road construction, and damaged farmland. While the volume of scientific literature about the physical and mental health impacts of fracking is rising, few studies exist that specifically focus on residents’ perceptions of the changing physical landscape. The primary goal of this qualitative study was to identify residents’ attitudes about the changing physical landscape resulting from fracking operations. Furthermore, how have these landscape changes affected residents’ engagement with the outdoors and their overall health?
Mental health, green spaces, and a changing landscape
Many scientific studies have documented the relationship between fracking developments and mental health, and between mental health and access to green spaces and engagement with the outdoors. Peer-reviewed studies have looked at heavily fracked communities across the US, many of which focus on Pennsylvania residents. Methods typically involve one-on-one interviews, larger focus groups, surveys, or a combination of the three, to identify how living amongst oil and gas operations takes a toll on everyday life. These studies have found an increase in stress and anxiety, feelings of powerlessness against the oil and gas industry, social conflicts, sleep disturbances, and reduced life satisfaction. Additionally, residents have experienced disruptions in their sense of place and social identity. For a summary of published research about the mental health impacts from fracking, click here.
A healthy strategy many choose to cope with stress and anxiety is engagement in outdoor recreation. Having easily accessible “green spaces,” or land that is partly or completely covered with grass, trees, shrubs, or other vegetation such as parks and conservation areas have been shown to promote physical and mental health. Many scientific studies have identified significantly fewer symptoms of depression, anxiety, and stress in populations with higher levels of neighborhood green space.1 Additionally, green spaces can aid recovery from mental fatigue and community social cohesion.2 3 However, residents in Southwestern Pennsylvania may slowly see their access to green spaces and opportunities for outdoor recreation decline due to the expansion of fracking operations. Figure 1 below shows a visual representation of the interconnected relationship between fracking, access to green spaces, and negative mental health impacts.
Figure 1. The interconnected relationship between fracking operations, landscape changes and decreasing access to outdoor recreation, and negative mental health impacts.
In the last 10-15 years, fracking operations in Southwest Pennsylvania have exploded. The development of new pipelines, access roads, well pads, impoundments, and compressor stations is widespread and altering the physical landscape. Figure 2 below illustrates just one of many examples of landscape disruption caused from fracking operations.
Figure 2. Examples of changes in the physical landscape caused from fracking operations in Greene County (A) and Washington County (B), Pennsylvania. Images taken from Google Earth.
Additionally, this time-slider map (Figure 3) illustrates a larger scale view of landscape changes in Greene County, Pennsylvania in a region just east of Waynesburg.
Figure 3. Time-slider map of a region in Greene County, PA where the left portion of the map is imagery from 2005, and the right portion of the map is from 2017. Active oil and gas wells are indicated by a blue pin, and compressor stations are in green.
Study design
A qualitative study was conducted to answer the following research questions:
What are residents’ perception of the landscape changes brought about by fracking?
Have these landscape changes caused any mental health impacts?
Have changes to the physical landscape from oil and gas operations resulting in any changes in engagement with outdoor recreation?
To better understand these topics, residents living in Southwestern Pennsylvania were recruited to participate in one-on-one phone interviews, and an online survey was also distributed throughout the FracTracker Alliance network. Recruitment for the one-on-one phone interviews was accomplished through FracTracker’s social media, and email blasts through other partnering organizations such as Halt the Harm Network, People Over Petro, and the Clean Air Council. Similarly, the online survey was shared on FracTracker’s social media and also distributed through our monthly newsletter. Since this was not a randomized sample to select participants, these results should not be generalized to all residents living near oil and gas infrastructure. However, this study identifies how certain individuals have been impacted by the changing landscape brought about by fracking operations.
Eight residents completed phone interviews, all of whom resided in Washington County, PA. Residents were first asked how long they have lived in their current home, and if there was oil and gas infrastructure on or near their property. Oil and gas infrastructure was defined as well pads, compressor stations, pipelines, ponds or impoundments, or access roads. Next, residents were asked if they had any health concerns regarding fracking operations and gave personal accounts of how fracking operations have altered the physical landscape near their home and in their surrounding community. For those with agricultural land, additional questions were asked about fracking’s impact on residents’ ability to use their farmland. Lastly, residents were asked questions focused on engagement in outdoor recreation and if fracking had any impact on outdoor recreation opportunities. NVivo, a qualitative analysis software, was used identify emergent themes throughout the interviews,
In addition to the interviews, an online survey was also made available.The main purpose of the survey was to gauge where concerns about landscape changes from fracking operations fell in relation to other oil and gas impacts (i.e. air pollution, water contamination, excess noise and traffic, and soil contamination). Nine responses were recorded, and the results are discussed below. However, if you would like to add your thoughts, you can find the survey at https://www.surveymonkey.com/r/Z5DCWBD.
Main findings and emergent themes
Various emergent themes surrounding the oil and gas industry’s impact on public health and the environment were identified throughout the resident interviews. Residents shared their personal experiences and how they have been directly impacted by fracking operations, especially with reference to the changing physical landscape surrounding their homes and throughout their communities. Participants’ time of residence in Washington County ranged from 3 years to their entire life, and all participants had oil and gas infrastructure (well pad, pipelines, impoundment, access roads, or compressor station) on or next to their property.
Changes to the physical landscape and residents’ attitudes toward the altered environment
The first overarching theme was changes to the physical landscape and residents’ attitudes toward the altered environment. All interview participants expressed concerns about the changes to the physical landscape on or surrounding their property, especially regarding access roads and well pads. Although one participant mentioned that widening the township road in order to make room for fracking trucks benefited the local community, the majority of participants expressed frustration about the construction of access roads, excessive truck traffic, noise, and dust from the unpaved access roads. One individual stated, “My main concern is the dust from the road. I’m constantly breathing that in, and it’s all over my shed, on the cars, the inside of the house, the outside of the house.” Multiple participants discussed the oil and gas operations disrupting what was once peaceful farmland with beautiful scenery (see an example in Figure 4 below). Another individual stated, “And of course, the noise is just unbearable. They don’t stop…the clanging on the pipe, the blow off with the wells, pumps running, generators, trucks coming down the hill with their engine brakes on, blowing their horn every time they want another truck to move.”
Figure 4. Aerial view of oil and gas infrastructure next to a home in Scenery Hill, PA. Image courtesy of Lois Bower-Bjornson from the Clean Air Council.
Impacts to outdoor recreation activities
Impacts to outdoor recreation activities such as hunting, fishing, and hiking were another recurring theme throughout the interviews. Again, a majority of participants believed their opportunities to partake in outdoor recreation have been limited since fracking operations began in their area.
Among the top concerns was deteriorating air quality and increasing numbers of ozone action days, or days when the air quality index (AQI) for ozone reaches an unhealthy level for sensitive populations. Various participants expressed concerns about letting their children outside due to harmful air emissions and odors originating from well pads or compressor stations. Excessive truck traffic was also a safety concern that was mentioned, especially for those individuals with access roads on or neighboring their property.
Additionally, one individual noted landscape changes in areas commonly used for hiking stating, “You might be hiking along a trail and then realize that you’re no longer on the trail. You’re actually on a pipeline cut. Or you’ll get confused while you’re hiking because you’ll intersect with a road that was developed for a well pad, and it’s not on your map.” Along with hiking, participants also noted a change in hunting and fishing opportunities since fracking moved into the region. Concerns were expressed regarding harvesting any fish or wild game due to possible contamination from fracking chemicals, especially near watersheds with known chemical spills.
Going for a hike and immersing oneself in nature is a healthy way to unwind and relieve stress. However, a rising number of well pads and compressor stations are put in place near parks, hiking trails, and state game lands throughout Southwest Pennsylvania (Figure 5). Participants expressed concerns about feeling unable to escape oil and gas infrastructure, even when visiting these recreational areas. As one individual mentioned, “It really does change your experience of the outdoors. And, you know, it’s an area that’s supposed to be a protected natural area. Then you know you can’t really get away. Even there in public lands far away from buildings and roads. And you can’t really get away from it.”
Figure 5. A map of active oil and gas well pads and compressor stations in Washington County, Pennsylvania. Map layers also indicate wells pads and compressor stations within 1 mile of a park, hiking trail, ball park, or state game land.
But what are the mental health impacts that result from the changing physical landscape brought about by fracking? Aside from the physical health effects caused by fracking activity — such as respiratory illnesses from air pollution or skin irritation from contaminated well water — these landscape changes have taken a toll on participants’ mental health as well.
Sentimental value and emotional distress
Many participants described the sentimental value of their property, and the beautiful scenery surrounding their generational family farms. But after fracking began on neighboring property, witnessing their tranquil family farm suddenly become surrounded by dusty access roads, excessive truck traffic, noise, and deteriorating air quality took a serious emotional and mental toll. When asked about the impact of the changing landscape, one participant stated, “It’s the emotional part of watching her childhood farm being destroyed while she is trying to do everything she can to rebuild it to the way it used to be.”
An additional emergent theme surrounding fracking landscape changes was surrounding agricultural impacts. Participants with agricultural land were asked additional questions about fracking’s impacts on their ability to use their farmland. One individual noted that one of their fields was now unusable due to large rocks and filter fabrics left from construction of a well pad, and redirected runoff uphill of their fields. The loss of productive farmland has further contributed to the mental and emotional stress. One participant added, “Our house is ruined, our health is ruined, and our farms are ruined.” In addition to agricultural impacts on large farms, multiple participants also mentioned concerns about their smaller-scale gardens, citing uncertainty about the impacts of air pollution and soil contamination on their produce.
Feelings of powerlessness and social tension
Some participants mentioned feelings of powerlessness against the oil and gas industry. Many families were not consulted prior to fracking operations beginning adjacent to their property. In some cases, this has resulted in significant declines in property values, leaving residents with no financial means to escape oil and gas activity. It is important to note that many residents are given temporary financial incentives to allow fracking on their land. However, to some, the monetary compensation failed to make up for the toll fracking took on their physical and mental health. Lastly, some participants also mentioned feeling stress and anxiety from the social tension resulting from fracking. Debates about the restrictions and regulations on fracking have divided many communities, leading to conflicts and social tensions between once-amiable neighbors.
Survey results
In addition to the interviews, an online survey was distributed to gain more insight as to where concerns about the changing physical landscape fell in relation to other effects associated with oil and gas development (such as poor air quality, water or soil contamination, truck traffic, and noise).
Nine individuals responded to the survey, all of whom indicated having oil and gas infrastructure within five miles of their home. All respondents also indicated that they participated in a wide variety of outdoor recreation activities such as hiking, wildlife viewing/photography, camping, hunting, and fishing.
Interestedly, only five respondents stated they felt fracking had a negative impact on their health, three responded they were unsure, and one responded no. However, all participants felt fracking had a negative impact on their surrounding environment. When discussing outdoor recreation, eight of nine respondents stated they felt fracking limited their access to outdoor recreation opportunities.
Next, respondents indicated that the level of concern related to the changing landscape brought about by fracking was equal to concerns about air pollution, water and soil contamination, noise, and truck traffic (using a 5-point likert scale). Lastly, one respondent stated that they closed their outdoor recreation tourism business due to blowdown emission (the release of gas from a pipeline to the atmosphere in order to relieve pressure in the pipe so that maintenance or testing can take place) and noise from fracking operations.
Conclusion and future directions
In summary, fracking operations have deeply impacted these individuals living in Washington County, Pennsylvania. Not only do residents experience deteriorating air quality, water contamination, and physical health effects, but the mental and emotional toll of witnessing multigenerational farms become forever changed can be overbearing. Other mental health impacts included rising social tensions, feelings of powerlessness, and continuous emotional distress. Fracking operations continue to change the physical landscape, tarnishing Southwest Pennsylvania’s natural beauty and threatening access to outdoor recreation opportunities. Unfortunately, those not living in the direct path of fracking operations struggle to grasp the severity of fracking’s impact on families living with oil and gas infrastructure on or near their property. More widespread awareness of fracking’s impacts is needed to educate communities and call for stricter enforcement of regulations for the oil and gas industry. As one resident summed up their experiences,
“Engines are running full blast, shining lights, and just spewing toxins out there. And you can’t get away from it. You just can’t. You can’t drink the water. You can’t breathe the air. You can’t farm the ground. And you’re stuck here.”
Hopefully, shedding light on residents’ experiences such as these will bring policymakers to reconsider fracking regulations to minimize the impact on public health and the surrounding environment.
By Emma Vieregge, FracTracker Summer 2020 Environmental and Health Fellow
Acknowledgements
The 2020 Environmental Health Fellowship was made possible by the Community Foundation for the Alleghenies and the Heinz Endowments.
Many thanks to all participants who took the time to share their experiences with me, Lois Bower-Bjornson with the Clean Air Council, Jessa Chabeau at the Southwest Pennsylvania Environmental Health Project, and the FracTracker team for all of their feedback and expertise.
Feature image courtesy of Lois Bower-Bjornson from the Clean Air Council.
References:
1 Beyer, K., Kaltenbach, A., Szabo, A., Bogar, S., Nieto, F., & Malecki, K. (2014). Exposure to Neighborhood Green Space and Mental Health: Evidence from the Survey of the Health of Wisconsin. International Journal of Environmental Research and Public Health,11(3), 3453-3472. doi:10.3390/ijerph110303453
2 Berman, M. G., Kross, E., Krpan, K. M., Askren, M. K., Burson, A., Deldin, P. J., . . . Jonides, J. (2012). Interacting with nature improves cognition and affect for individuals with depression. Journal of Affective Disorders,140(3), 300-305. doi:10.1016/j.jad.2012.03.012
3 Maas, J., Dillen, S. M., Verheij, R. A., & Groenewegen, P. P. (2009). Social contacts as a possible mechanism behind the relation between green space and health. Health & Place,15(2), 586-595. doi:10.1016/j.healthplace.2008.09.006
https://www.fractracker.org/a5ej20sjfwe/wp-content/uploads/2020/08/Fracking-SW-PA-feature-Lois-Bower-Bjornson-scaled.jpg6671500Intern FracTrackerhttps://www.fractracker.org/a5ej20sjfwe/wp-content/uploads/2025/09/2025-Wordmark-Logo.pngIntern FracTracker2020-08-20 11:07:572025-05-02 14:44:39Landscape Changes and Mental Health Impacts in Southwestern Pennsylvania Communities: A Qualitative Study
In this special one-day fundraiser event, two intrepid FracTracker teams will build and share a live virtual map as we travel throughout the Ohio River Valley Region documenting oil, gas, and its effects on our health, climate, and environment.
How many sites can we visit in one day? What will we find?
We’ll share our findings to build awareness about the plight of this region—and so many other places victimized by this rogue industry. Plus, viewers will gain a firsthand understanding of how FracTracker turns data into real-world impact.
Proceeds will benefit the ongoing work of FracTracker to decarbonize our economy and promote environmental justice.
Whether you are able to contribute financially at this time or not, we hope you’ll join us on this virtual journey. You’ll see regular video updates along the way as we share our progress, and watch as a story map is updated throughout the day.
Join our team of explorers in spirit and pledge your support! We’re excited to share this journey with you.
https://www.fractracker.org/a5ej20sjfwe/wp-content/uploads/2020/08/FracTracker-in-the-Field-promotion5-scaled.jpg8441500FracTracker Alliancehttps://www.fractracker.org/a5ej20sjfwe/wp-content/uploads/2025/09/2025-Wordmark-Logo.pngFracTracker Alliance2020-08-14 12:44:552021-04-15 14:16:11FracTracker in the Field: Building a Live Virtual Map
As the oil and gas industry feels pressure from former allies and see lending windows from their most loyal banking partners begin to dry up, they will be forced to cut costs elsewhere, and cut corners everywhere. This will come in the form of more industry-friendly regulations on the federal level under the current administration, as well as less stringent oversight at the state level. These trends are explicit manifestations of their desperation and influence.
The state-level laws the oil and gas industries are advocating for can easily fly under the radar. Most people just don’t have the bandwidth to educate themselves on the quiet development of these bills, nor to advocate against them. Much of the public’s attention is understandably focused on the COVID-19 pandemic, mass unemployment, and racial inequality. And, much of the critical attention around oil and gas legislation has correctly focused on the critical infrastructure legislation and related policy proposals we focused on in Part I of this series.
Below, we outline current attempts to weaken environmental regulations in Ohio, North Dakota, and Michigan. It is important to note that this is not an all-inclusive outline, but rather the bills we are aware of through our network of frontline and nonprofit contacts.
Ohio’s House Bill 545
A bill that would be hazardous to the health of all Ohioans, HB 545, intended to “Establish conditions for sale of brine as a commodity,” was introduced by first-term State Representative Adam Holmes, and second-termer Craig Riedel of Western Ohio. This bill would charge the Ohio Department of Natural Resources’ (ODNR) Division of Oil and Gas Resources Management with establishing “conditions and requirements for the sale of brine from oil or gas operations as a commodity, and to exempt that commodity from requirements otherwise applicable to brine.” What could possibly go wrong? The dangers of potentially highly radioactive fracking waste have been known for years, and were recently detailed in great reporting by Justin Nobel for Rolling Stone. Countless others have spent years crying out against radioactive fracking waste being produced, transported, and disposed of all across the Appalachian regions of Ohio, Pennsylvania, and West Virginia.
So, quite a bit could – and likely would – go horribly wrong if we allow ODNR to put lipstick on this fracking waste pig, as it were. The worst part about this is that Representative Holmes knows, (or at least should know), better, given that he lives in Nashport, roughly two miles south of a very active Class II Salt Water Disposal Well, and just a couple more miles from nearly a dozen more injection wells (Figure 1).
Figure 1. Existing and Pending Ohio Class II Salt Water Disposal Injection Wells and Proposed Fracking Waste Docks.
This change from quarterly to annual reporting will have profound implications for what little monitoring citizens are permitted. Clearly, the state has little interest or money to conduct monitoring.
An example of how great the lag could be, and how annual data will essentially be useless for any real-time concerns and/or incidents, the current year’s brine volume data will not be available until February 2021, and even then, the operator will have chances to revise the data. FracTracker has been compiling this data quarterly for years, and we will continue to make data that does exist publicly available.
One has to ask who prompted the demand for this change, and who exactly is on The Oil & Gas Division’s review committee. From the vantage point of most Ohioans concerned about this issue, this reporting change is going in the opposite direction of where a state with primacy over its Class II Wells should be going. When the US EPA has primacy over a state’s wells, as it does in Pennsylvania and Virginia, disposal volumes and pressures are reported annually, but the data are at least broken out monthly. (Note: More on Class II Well primacy and the language that allows states to maintain primacy will come in a future piece.)
As Buckeye Environmental Network Executive Director Teresa Mills and matriarch of the Ohio environmental watchdog community told me, “We have less and less and less information. While Pennsylvania’s website has its problems, it is 150% better than what citizens have access to in Ohio.”
Michigan’s Senate Bill 0431
Michigan’s Senate Bill 0431, introduced by Senate Democrat Adam Hollier in August 2019, was quickly reassigned to the Transportation and Infrastructure Committee in Lansing, after being originally introduced in the Natural Resources Committee. This is just the next step in taking away local control from communities. The language of the bill on Line ten states unapologetically that:
“A local unit of government shall not, by ordinance or otherwise, prevent, prohibit, or deny a permit, approval, or other authorization for the extraction, by mining, of natural resources from any property, by a person with property, possessory, or contractual rights to do so … if … The natural resources are valuable …[and] Very serious consequences would not result from the extraction of the natural resources … For purposes of this section, a consequence is very serious if it substantially exceeds the ordinary impacts of customary mining operations, and poses an actual and unnecessary risk to public health, safety, or welfare that cannot be avoided or ameliorated through the imposition of reasonable controls or conditions on the mining operations.”
If you ask residents of towns like Ludington and South Rockwood, Michigan, what it is like to live next to silica sand mines, they’ll tell you they have very little faith in the recently rebranded Michigan Department of Environment, Great Lakes, and Energy (DEGLE), formerly the Department of Environmental Quality (DEQ). This is the same DEQ that was responsible for the Flint water crisis, in which several of its employees plead no contest to misdemeanors related to their actions during the crisis.
When I called Senator Hollier’s office and asked what the motivation for this bill was, his staffer told me that in their eyes, if a mine proposal were to meet or exceed the rigorous requirements of DEGLE, then they felt it was important that no further hurdles be placed in the proposal’s way moving forward.
Another concern of Michiganders that I have spoken to about this bill, and silica sand mining in general, is this stipulation regarding bonding and reclamation:
“The amount of financial assurance shall be the product of $1,500.00 multiplied by the number of acres disturbed by mining operations, but not yet reclaimed, excluding roadways, plant sites, and open water areas that will remain after completion of reclamation … Reclaiming slopes of the banks of the excavation not exceeding one (1) foot vertical to three (3) feet horizontal, measured from the nearest setback line into any area disturbed by mining operations.”
Most folks believe: A) A bond of $1,500 is way too low, considering all the long-term damage from surface mining; B) The carving out for roadways, plant sites, and open water areas leaves a tremendous amount of any mine’s remaining footprint devoid of any chance of reclamation, and ensures potential environmental and human health hazards in perpetuity, and; C) The one foot rise over three feet run threshold leaves a vast amount of any mine’s footprint extremely unstable.
The general sentiment among Michigan nonprofit organizations is summed up by a note I received from Michigan Environmental Council (MEC) President & CEO Conan Smith, stating:
“I believe this bill is part of an intrigue that we’ve been monitoring as two very rich political donors fight over a proposed gravel mine [in] Metamora Township … one who owns the proposed mine, one who neighbors it and is opposed.
We are, as you might imagine, opposed to this bill. The exemption of local control and [the] presumption that an extractive operation is so necessary as to preempt other local concerns and priorities is in itself sufficiently egregious for us. However, this legislation would also leave the extractive industry almost entirely free of citing regulation, as there is no detailed process at the state level either.
The philosophical challenge we face here, as in many cases, is the tension between private property rights and public health, safety, and welfare. With this bill, the sponsors want a presumption that any activity on private land is reasonable, unless it results in a ‘very serious consequence,’ (a term which has basis in current law that this bill also erases). The new definition of seriousness would essentially be something that is not a normal part of the extractive action. Thus, for example, hundreds of trucks rolling down a dirt road might not be a very serious consequence because that’s just part of normal operations …”
In a sign of how quickly support for legislation shifts, and how elected officials will use crises like COVID-19 to push what Naomi Klein calls “Shock Doctrine,”[1] policy designed to facilitate a frictionless transition to “disaster capitalism,” MEC’s Policy Director Sean Hammond told us on May 21st of this year that, “Without the environmental community or local governments changing their positions, I see it very unlikely that this will move anywhere.” But just nine days later, MEC’s President and CEO emailed a group of those concerned about this bill, saying: “Bad news, friends. We learned yesterday that this bill has sudden new life and may be getting a hearing soon … We could certainly use help to dissuade lawmakers from taking this up.”
But much of the above has come from those at the policy level, living a healthy distance from Michigan’s mines. For the perspective of someone who actually lives next to a mine, I turned to a close friend and hero of mine, Doug Wood, and his wife Dawn, residents of South Rockwood in Monroe County, just a couple miles southwest of Detroit (Figures 3 and 4). Doug and Dawn sent me the following text regarding SB 0431:
“Ever since frac sand mining came to my community, the mine has expanded and accelerated, crushing silica 12 hours a day, right next to homes. It has been a constant battle to get the local government and the quarry to install air monitoring. Now the AGGREGATE industry is pushing to pass this law, Senate Bill 0431, which takes away all the local community’s controls, including [the control of] fugitive dust. I feel that if this law passes, it will be the end of a healthy, livable community.”
Figure 2. Current and Potential Silica Mining Activity, South Rockwood, Michigan, with Dawn and Doug Wood’s property in the southwest corner of the Light Green US Silica and Sylvanian Minerals Potential Polygon.
Figure 3. The Sylvanian Minerals/US Silica frac sand mine in South Rockwood, Michigan, in August 2017 (top) and June 2020 (bottom), with the Wood’s house to the left/west.
North Dakota’s Senate Bill 2344
North Dakota’s Senate Bill 2344 was first introduced to the Energy and Natural Resources Committee on January 21st of this year by Senators Jessica Unruh (R), Dwight Cook (R), and Donald Schaible (R). The North American oil and gas industry knows it has a massive waste issue that it can’t seem to get its collective head around, and in North Dakota, it has countered this structural uncertainty by claiming that landowners do not own the “subsurface pore space” beneath their property, and that this pore space entitles an operator to inject waste into such voids, without compensating landowners.
As Dakota Resource Council Executive Director Scott Skokos told me, “What I’ve heard from attorneys is that this is a taking. Prior to the law change, the porous ground beneath you was part of your property rights, but now it is the government’s … The reason is that it is a taking without compensation! At the legislative hearings, I’ve never seen so many ranchers and mineral owners at the legislature. They thought that because they are a privileged class they would be listened to, and they weren’t. When they got railroaded, they said, ‘What? The government doesn’t work for me?’” Many that are following this bill and associated legal efforts to challenge it think it has a good chance to make it all the way to the US Supreme Court, because it renders the state’s Oil and Gas Production Damage Compensation Act toothless.
Skokos went on to tell me that in “a prior world, where landowners actually had agency over their property in North Dakota, the state’s Century Code clearly stated in Section 38-11.1-04 that landowners were entitled to damages equivalent to ‘lost land value’ and/or ‘lost use of and access to the surface owner’s land.’”
In Mosser v. Denbury Resources, Inc.[2] in 2017, “Use of Pore Space,” and by association, SB 2344, began to percolate as a topic actually up for debate. The Mosser family did not contest the right of Denbury to dispose of fracking waste within their unitized area. This is only because they were hoping to get fair market value for waste disposal, if they would eventually have to incur the costs of damage to their property.
They alleged “claims for nuisance, for trespass and for damages under the Oil and Gas Production Damage Compensation Act.” Judge Charles Miller ruled in favor of the Mossers and stated clearly that surface owners did in fact own pore space; surface owners are entitled to the above damages resulting from pore space use; the surface owner does not have to demonstrate they are using the pore space; and most importantly, compensation per barrel that others are paying for fracking waste disposal may be used by landowners to determine damages.
This ruling was not to the industry’s liking, and they were determined to have the last word, so they worked with the aforementioned Republican Senators to write SB 2344, which contains tons of language regarding the use of pore space for natural gas and CO2 storage, as well as for Enhanced Oil Recovery (EOR) purposes. Senator Jessica Unruh, when not working on behalf of the good people of North Dakota’s District 33, is the Environmental Manager at Coyote Creek Mining Company. Also, it is important to note that Donald Schaible is the sole sponsor of HB 1426, mentioned earlier, that increased penalties for riot offenses.
The most jaw-dropping component of SB 2344 is that it would add a new definition to the state’s Century Code for the term “land,” to be defined as the solid material of earth – regardless of ingredients – but excluding pore space! Yes, those little voids in the rock beneath North Dakotans homes, or maybe up to and including cracks in the soil during dry summers, would not be classified as land, and ipso facto would not entitle landowners to damages if such voids were to be filled in with, say, radioactive fracking waste!
One can only hope that the “get off my land,” fiercely independent, and at times, Libertarian facade North Dakotans like to display will roar when this bill gets traction. I mean after all, isn’t the motto of Tea Party enthusiasts and Second Amendment zealots “Don’t Tread on Me?”
This is Part II of a two-part series on concerning legislation related to the oil, gas, and petrochemical industries. Part I focuses on repressive “critical infrastructure” bills intending to criminalize environmental protestors. Such legislation has already been passed in 11 states.
[1] Ms. Klein’s website describes the “Shock Doctrine” as the following: “It is a story about violence and shock perpetrated on people, on countries, on economies … [The Shock Doctrine] explodes the myth that the global free market triumphed democratically, and that unfettered capitalism goes hand-in-hand with democracy. Instead … it has consistently relied on violence and shock, and reveals the puppet strings behind the critical events of the last four decades.”
https://www.fractracker.org/a5ej20sjfwe/wp-content/uploads/2020/07/Sylvanian-MineralsUS-Silica-frac-sand-mine-in-South-Rockwood-Michigan-2.jpg7041500Ted Auch, PhDhttps://www.fractracker.org/a5ej20sjfwe/wp-content/uploads/2025/09/2025-Wordmark-Logo.pngTed Auch, PhD2020-07-09 09:13:242021-04-15 14:16:11Trends in Proposed State Legislation to Weaken Environmental Regulations
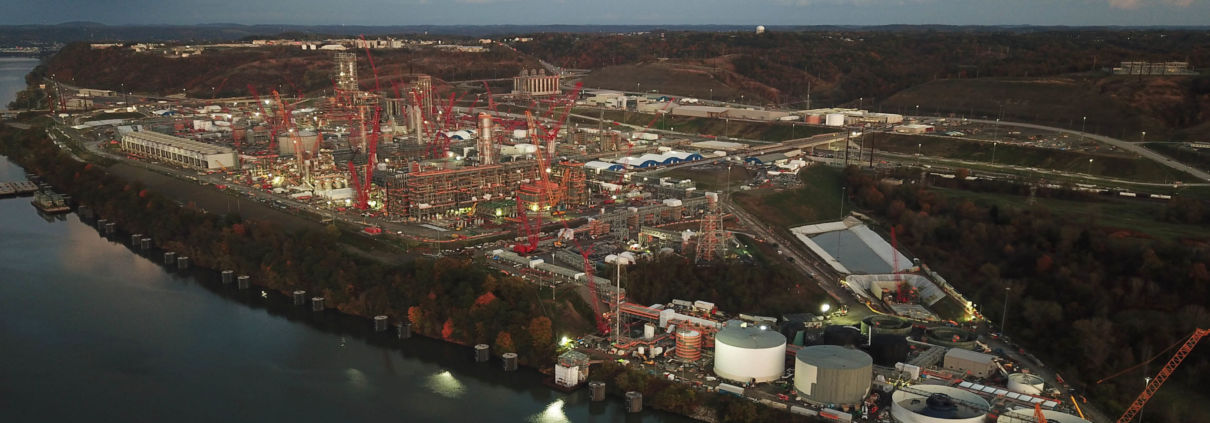 Ted Auch
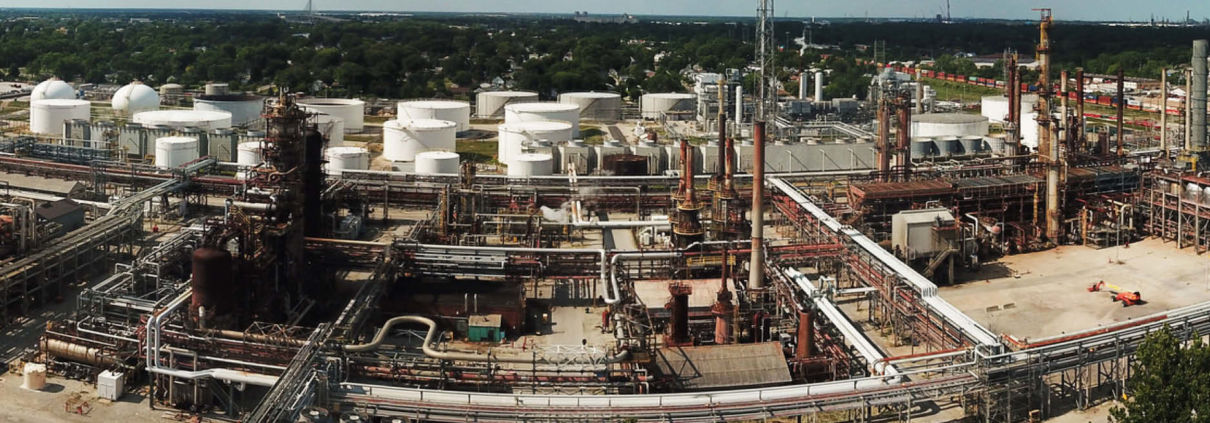
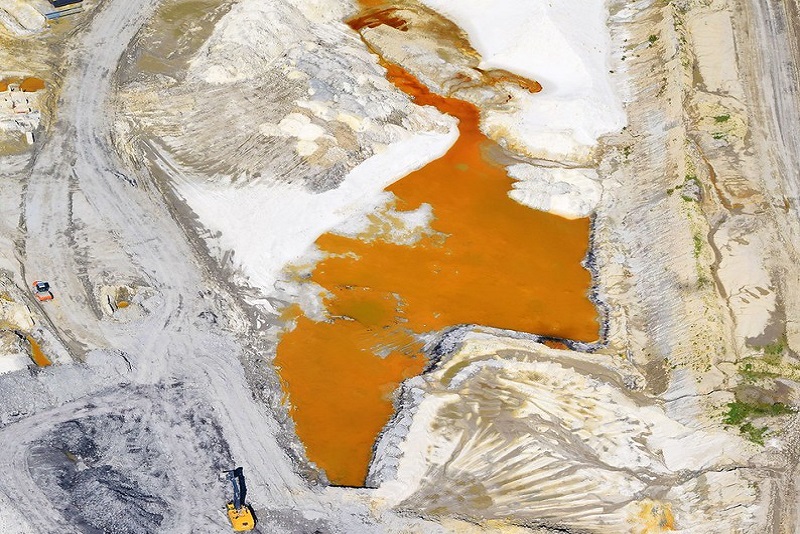
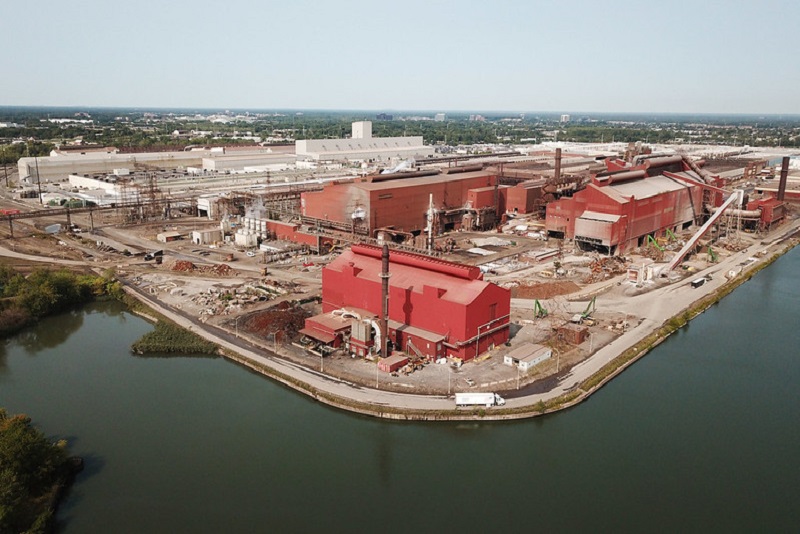
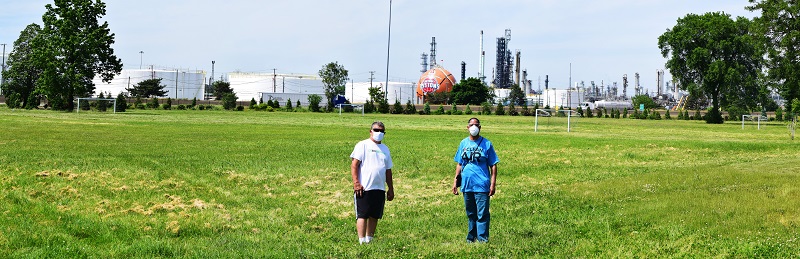
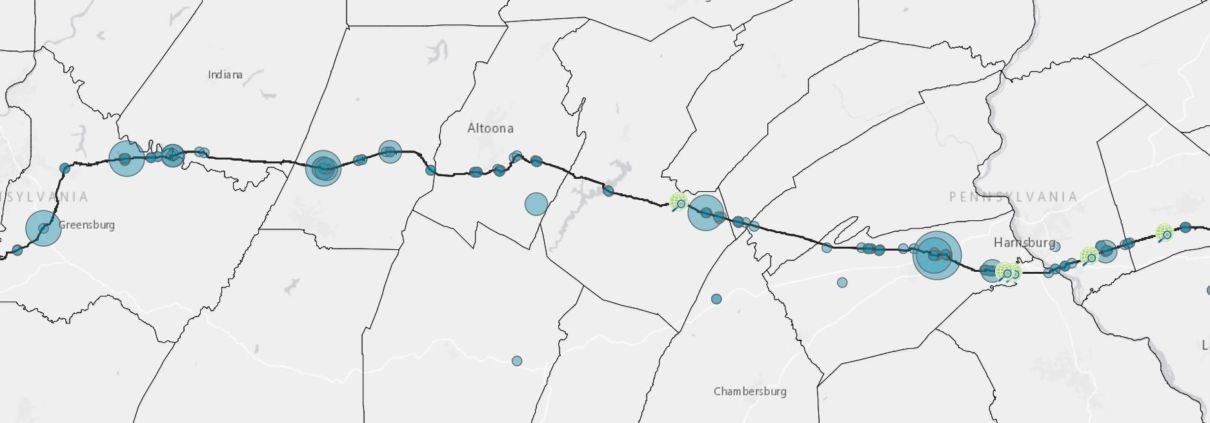
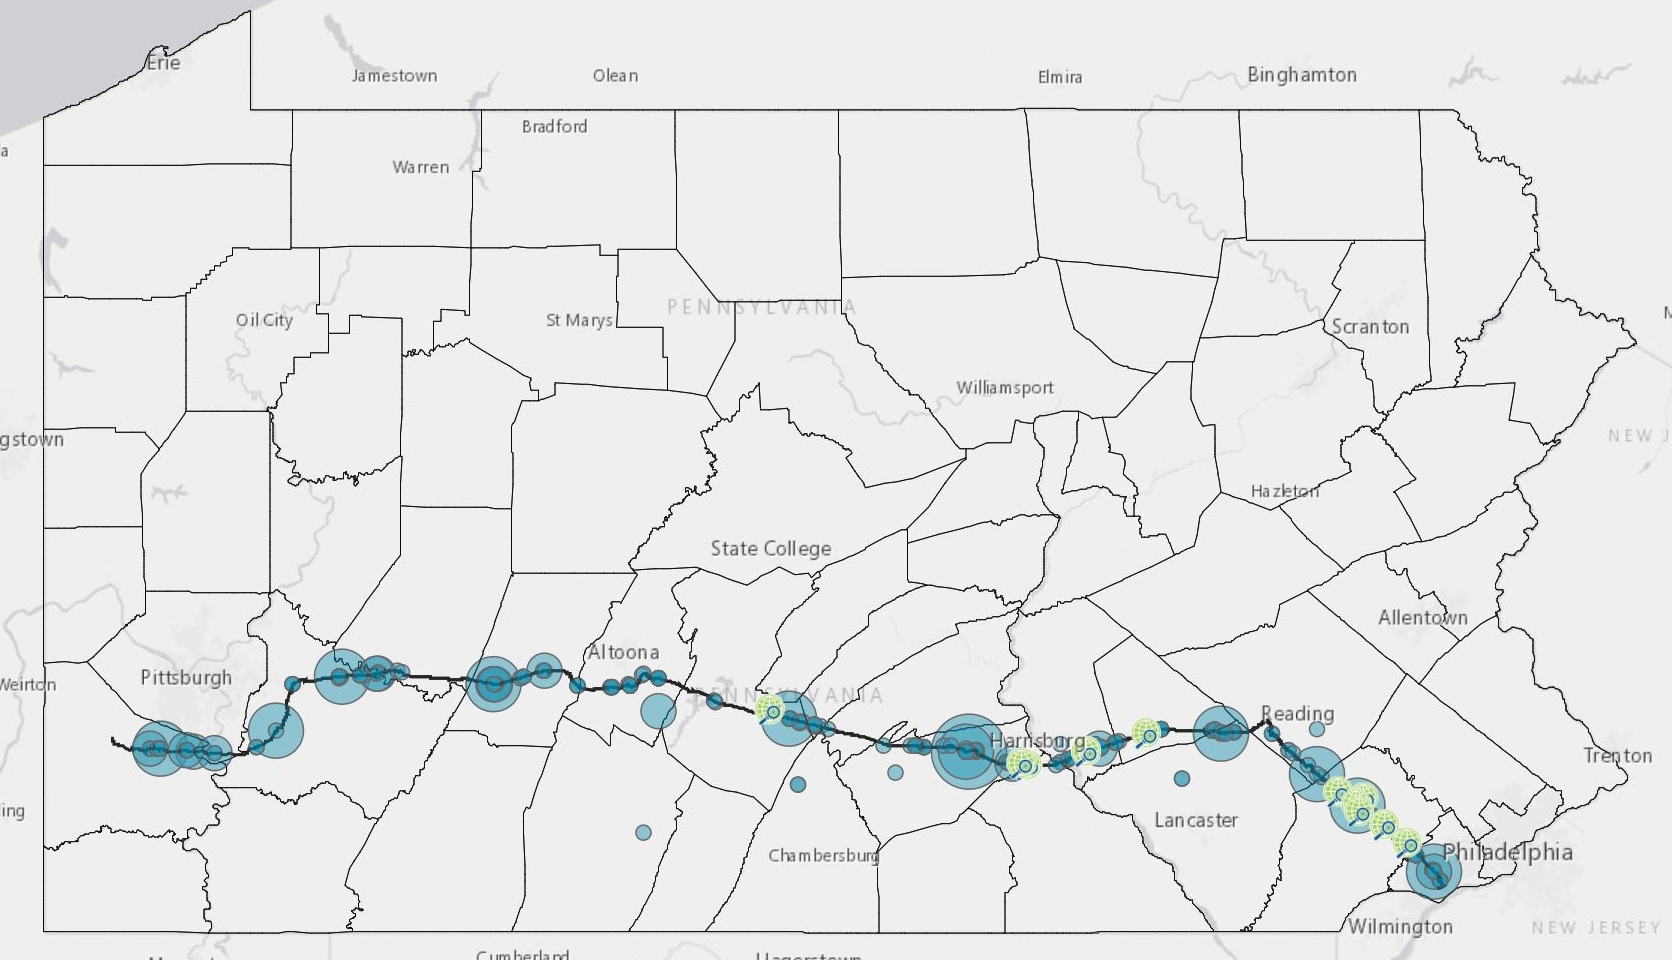
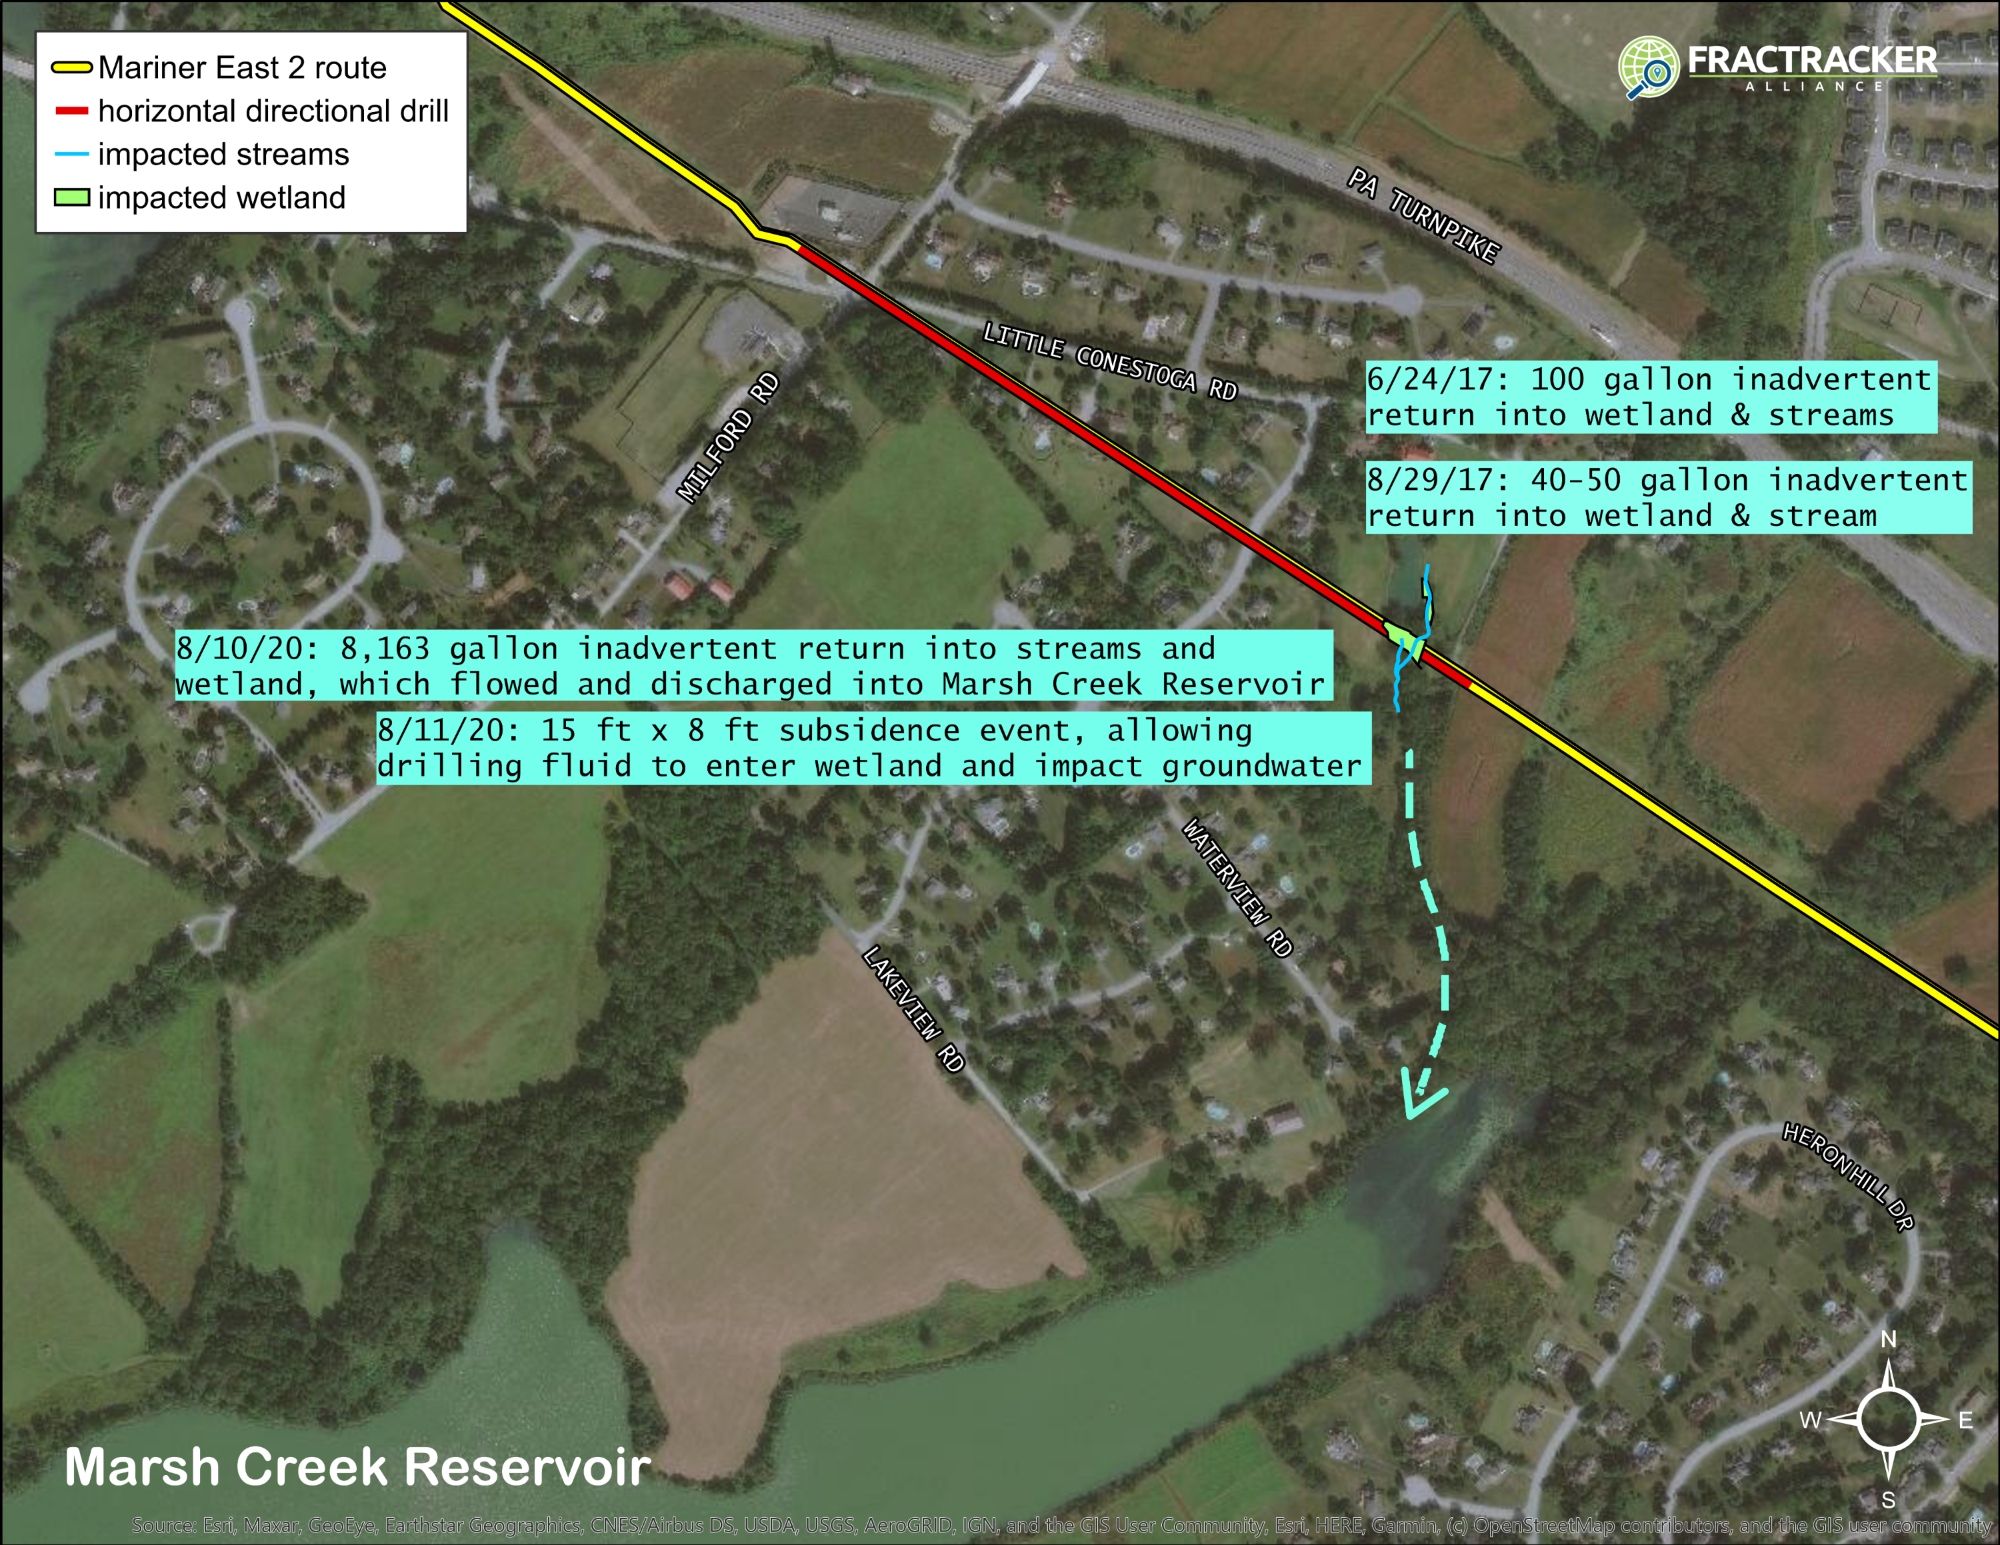
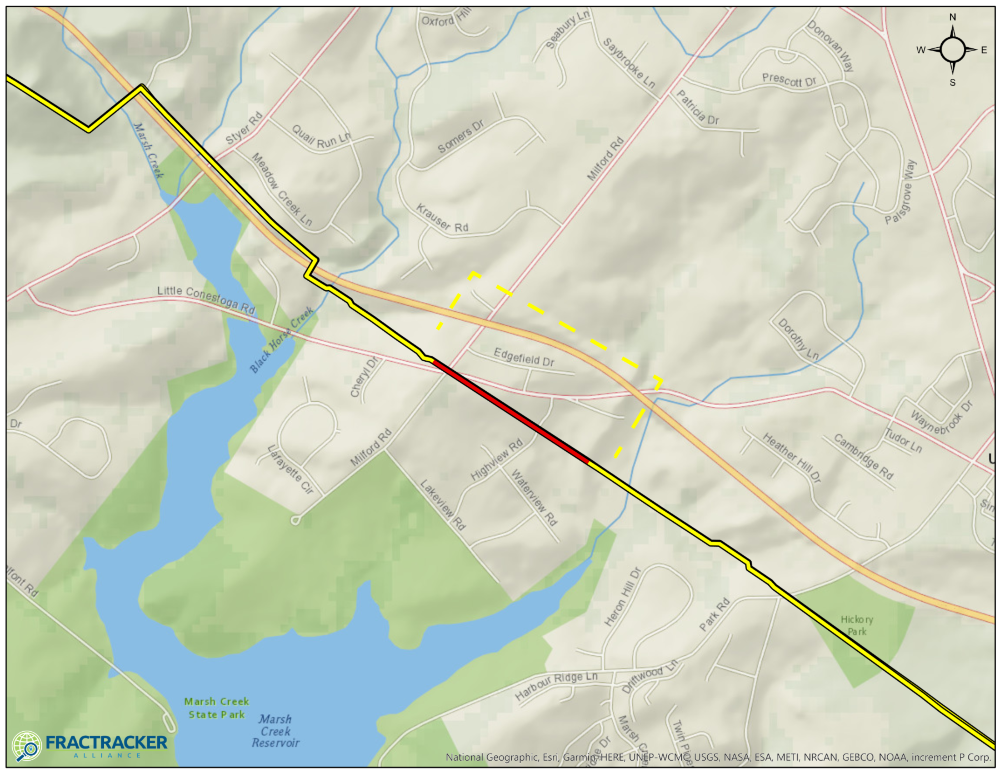
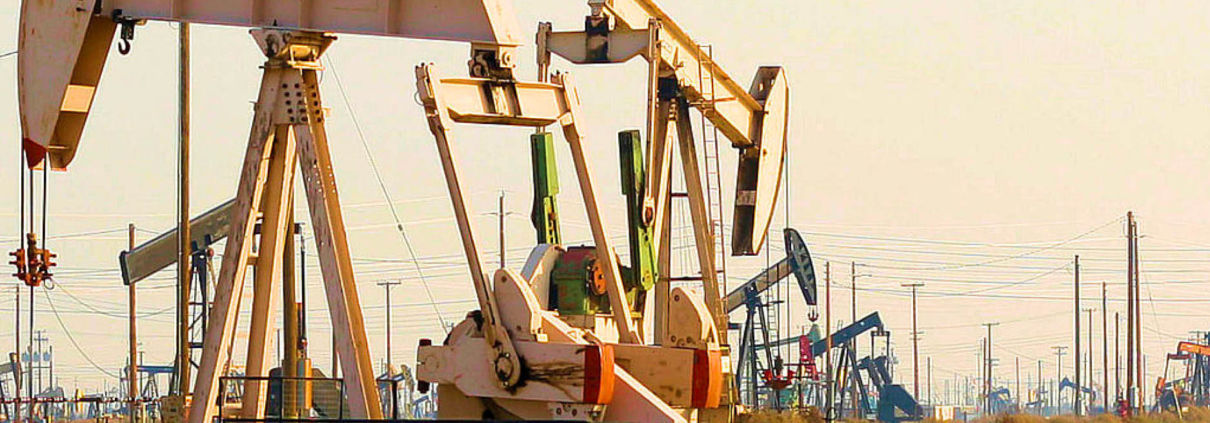

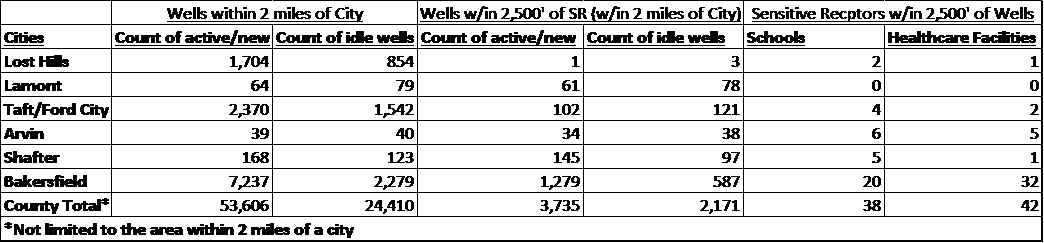
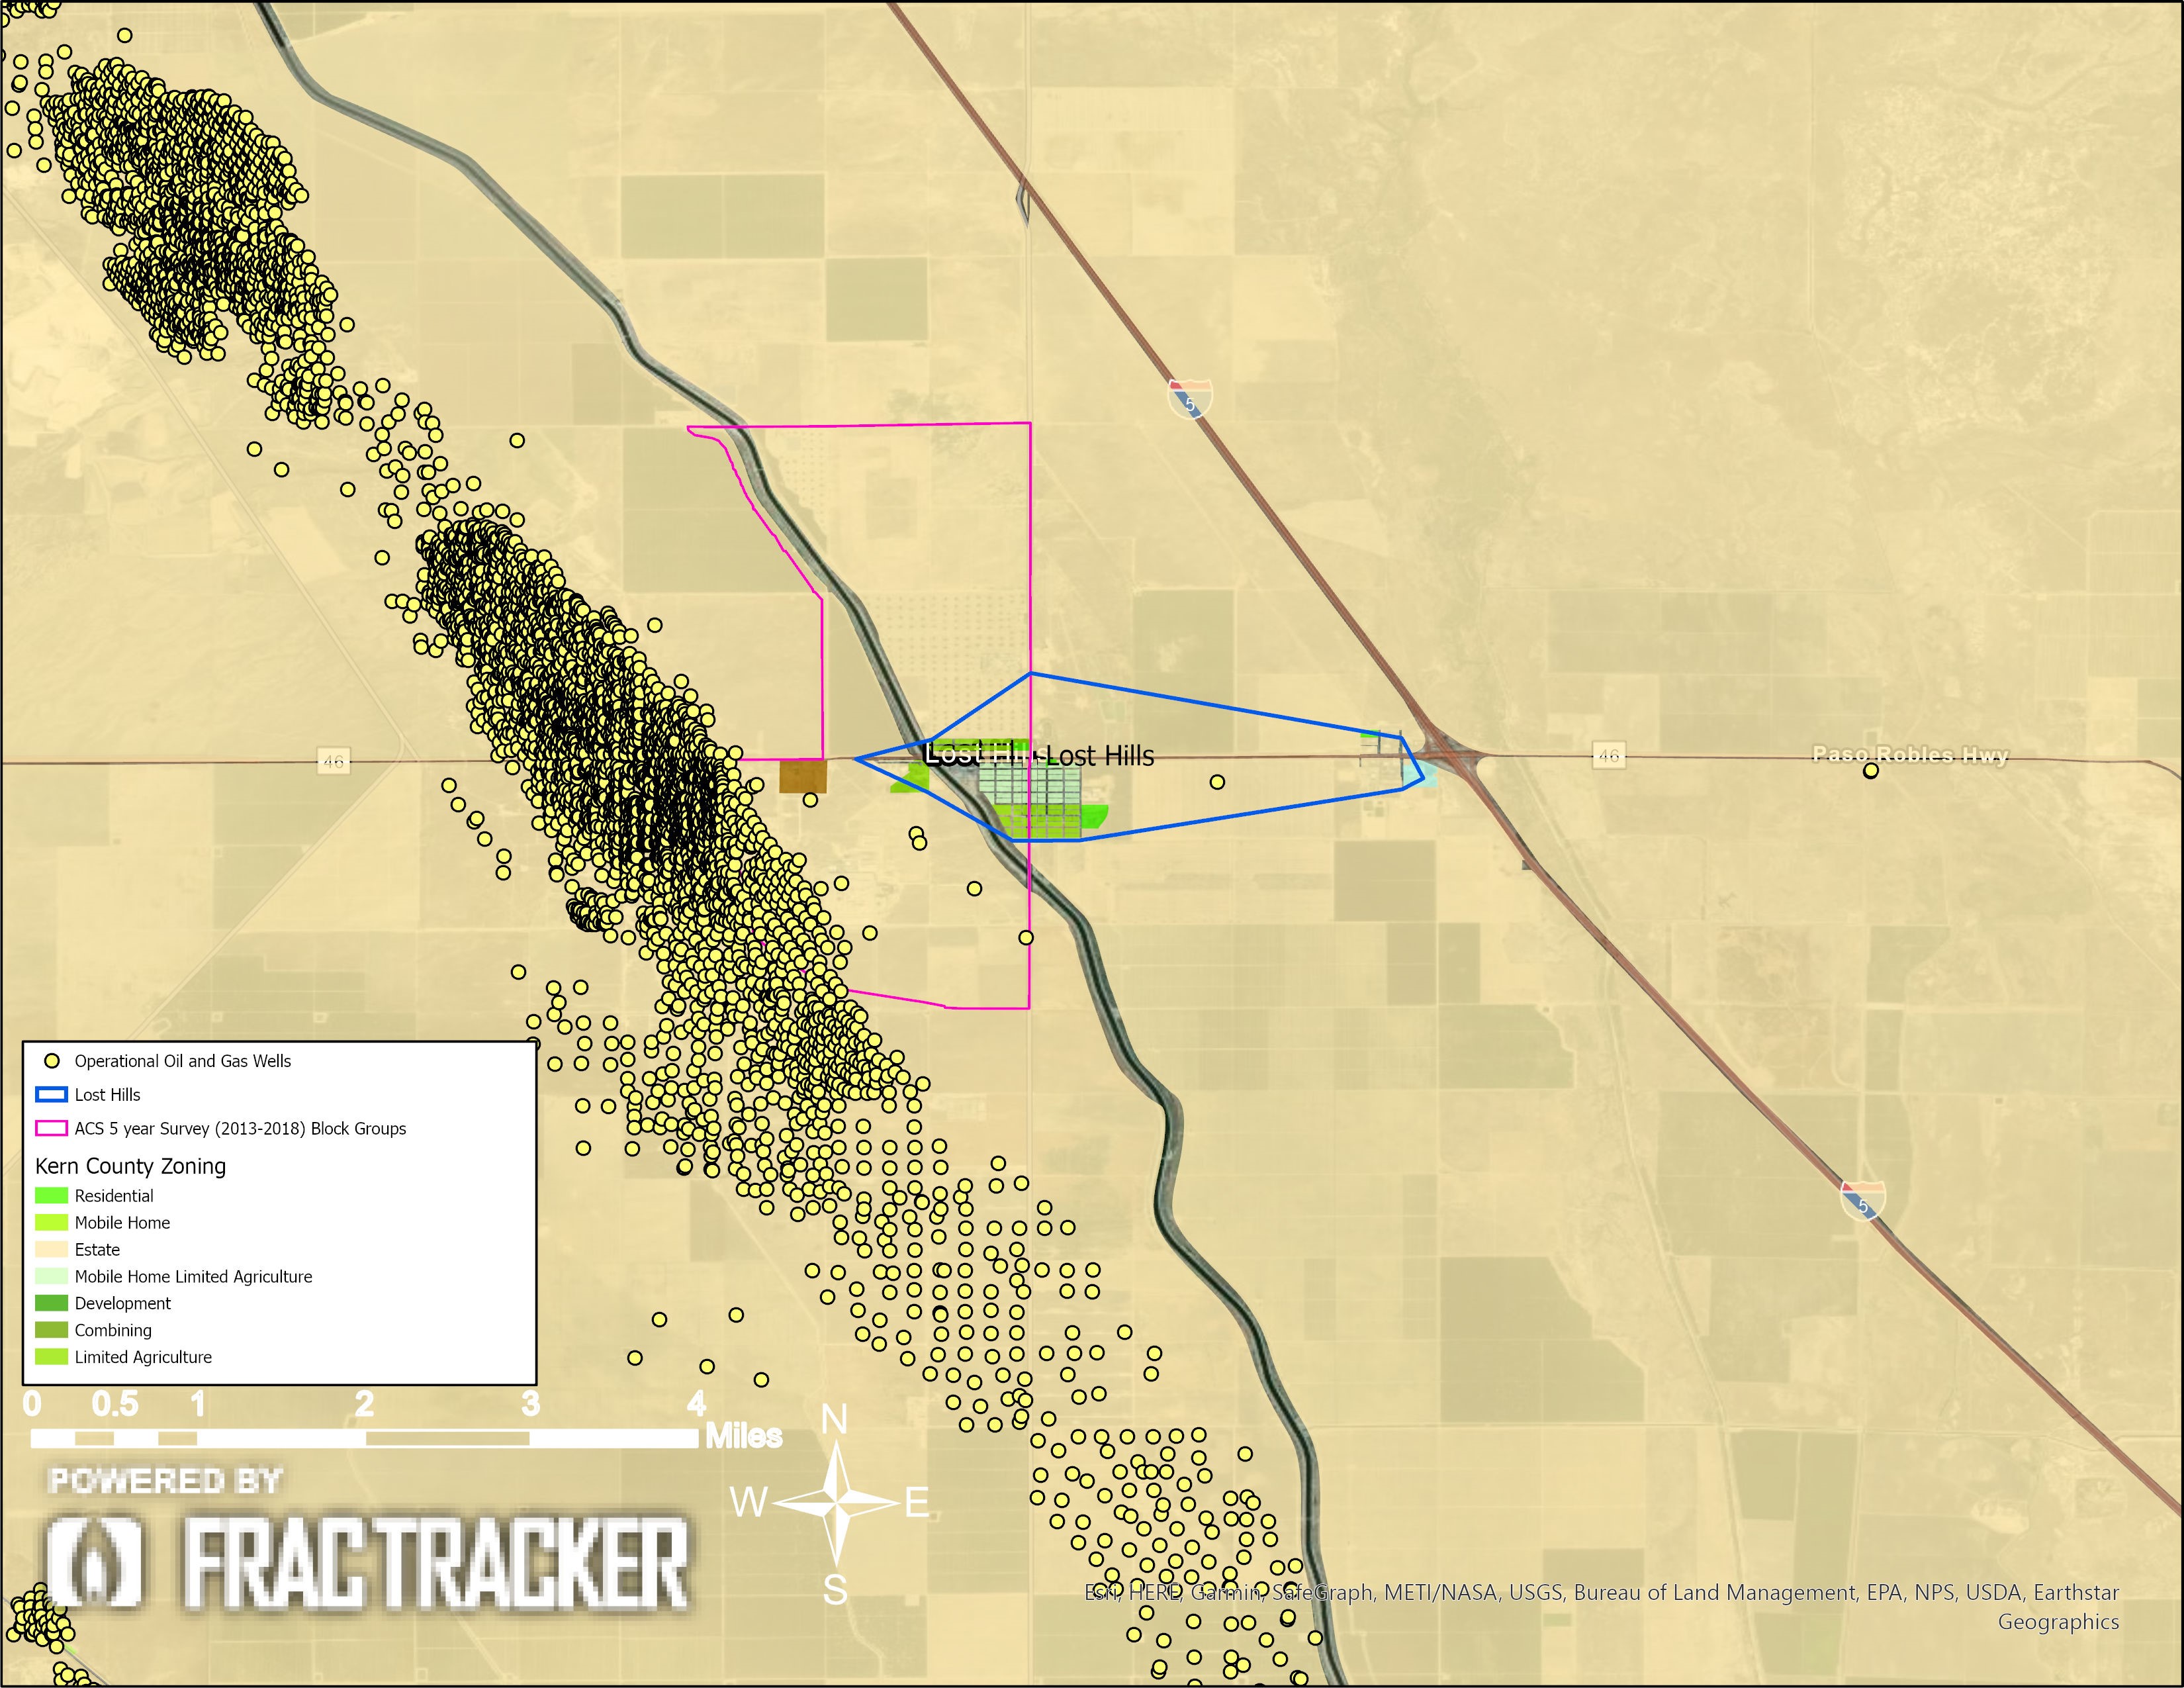
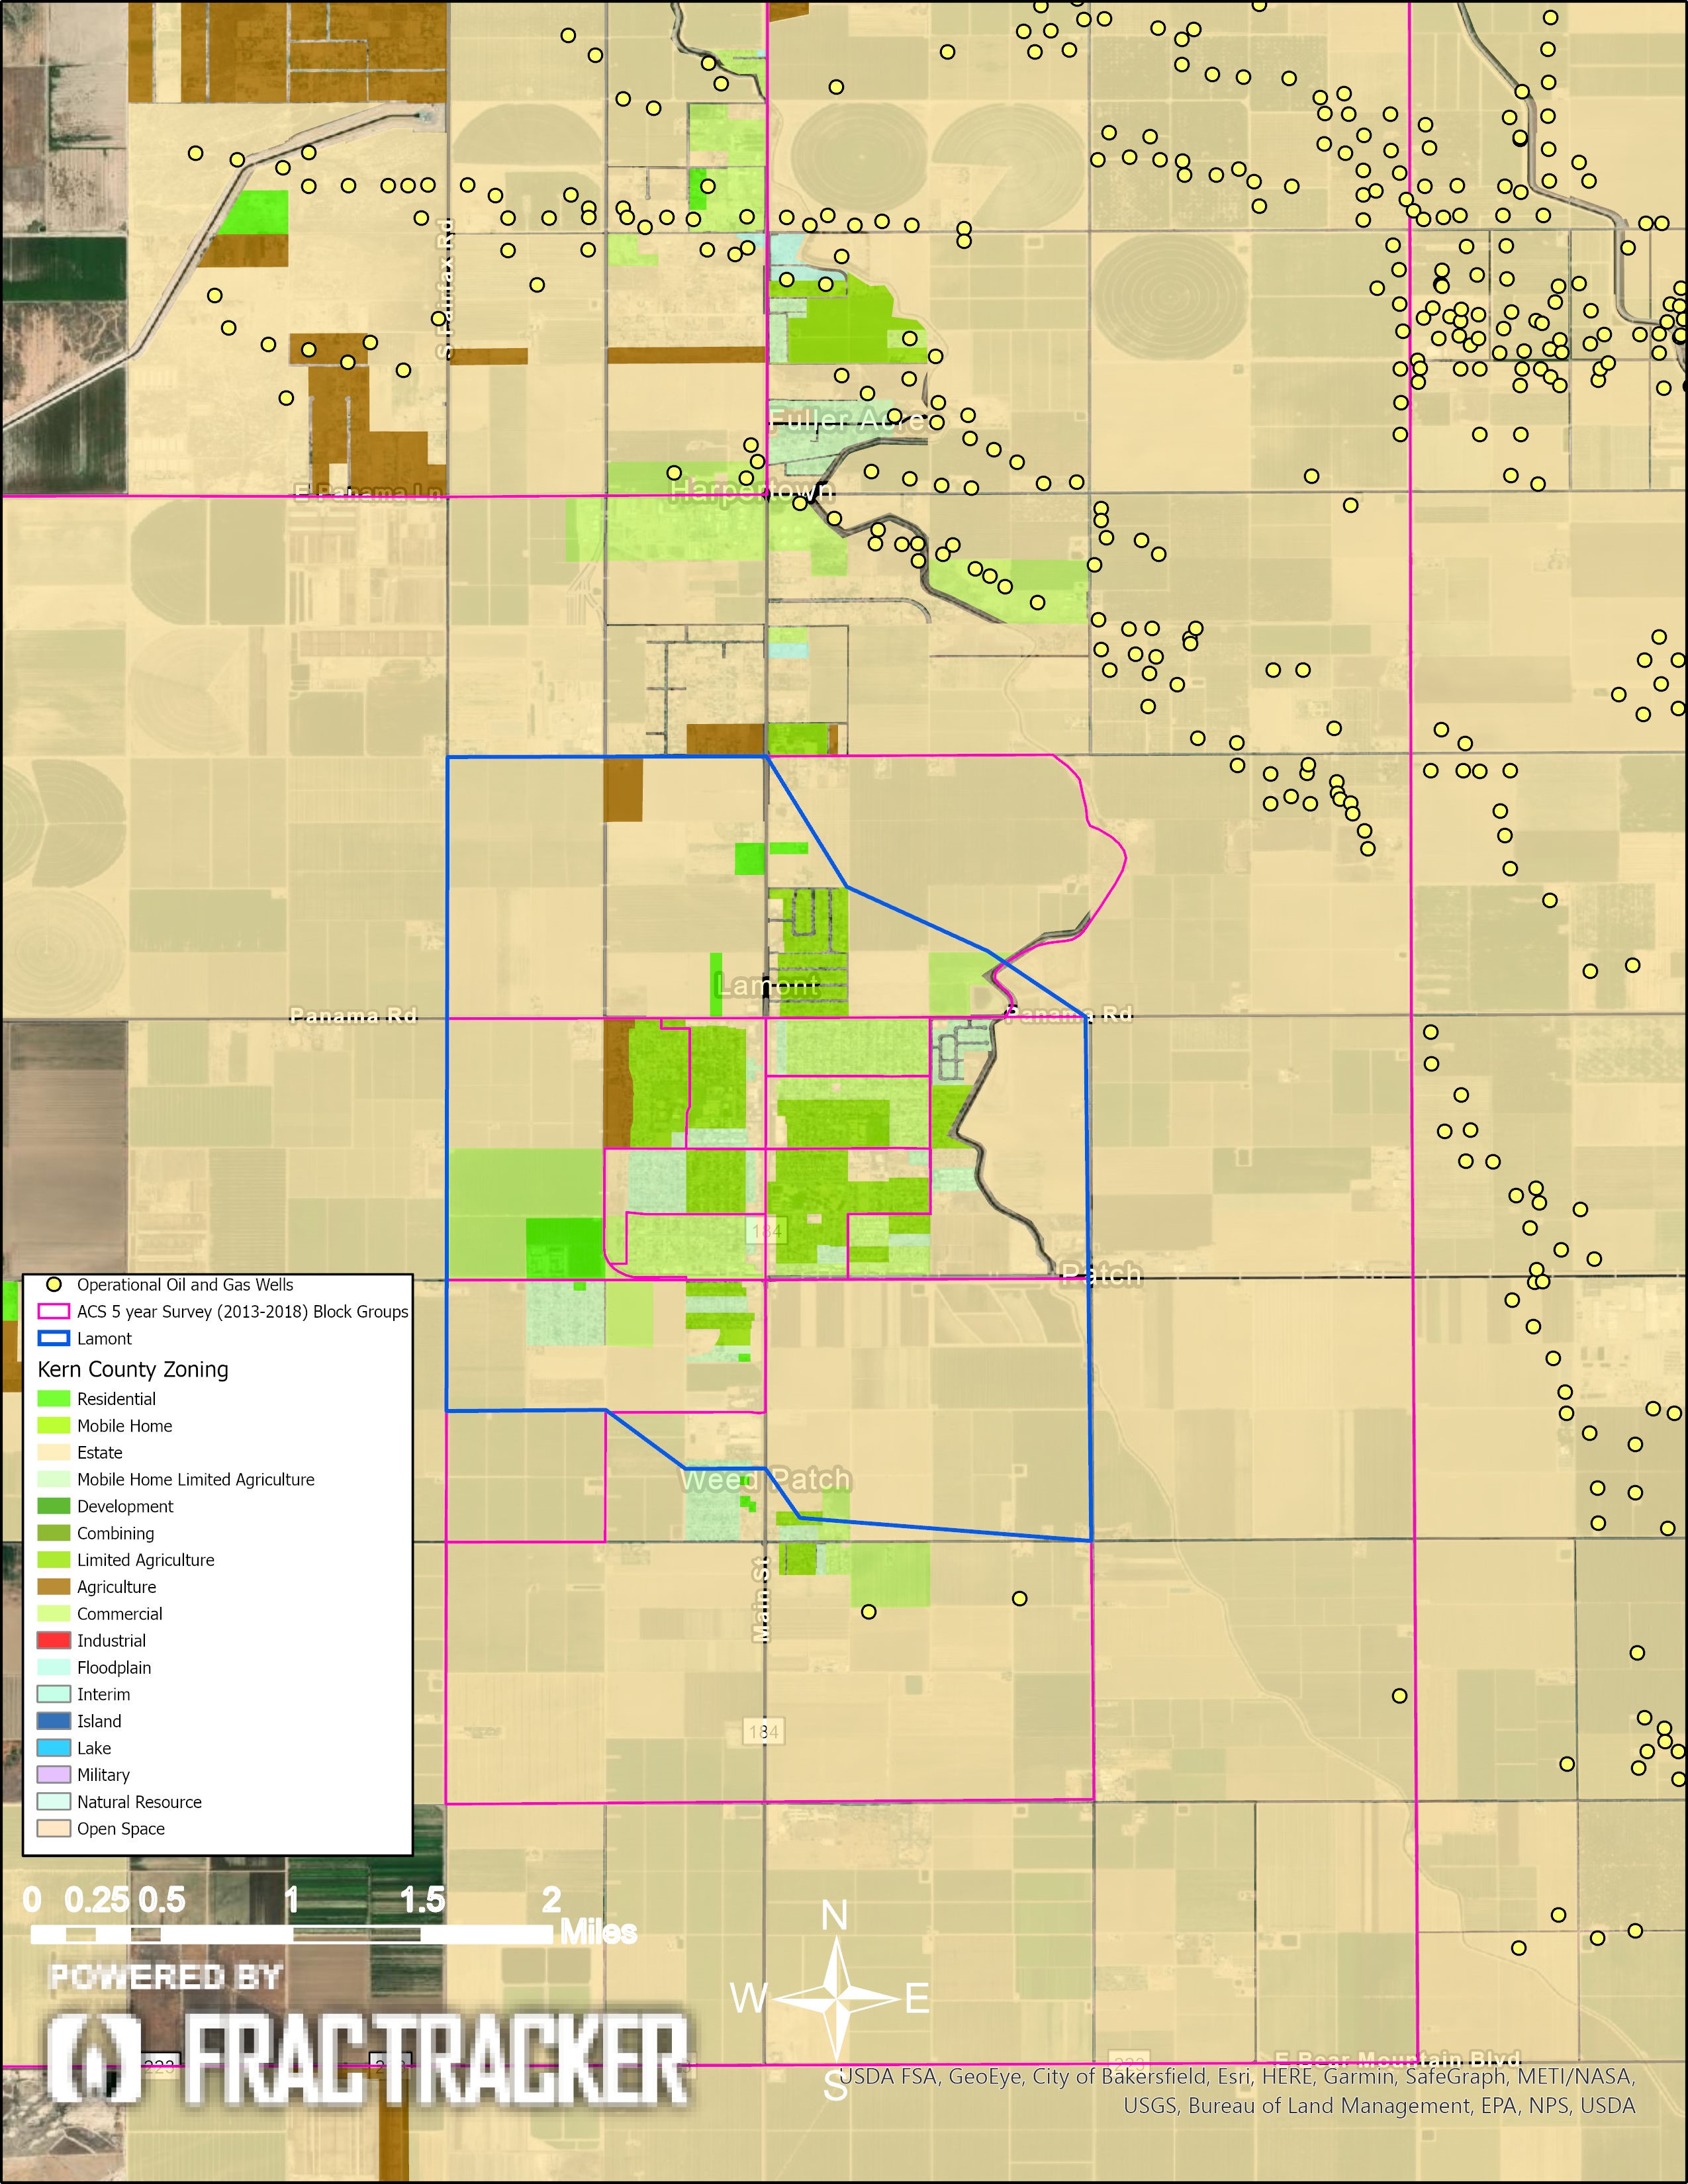
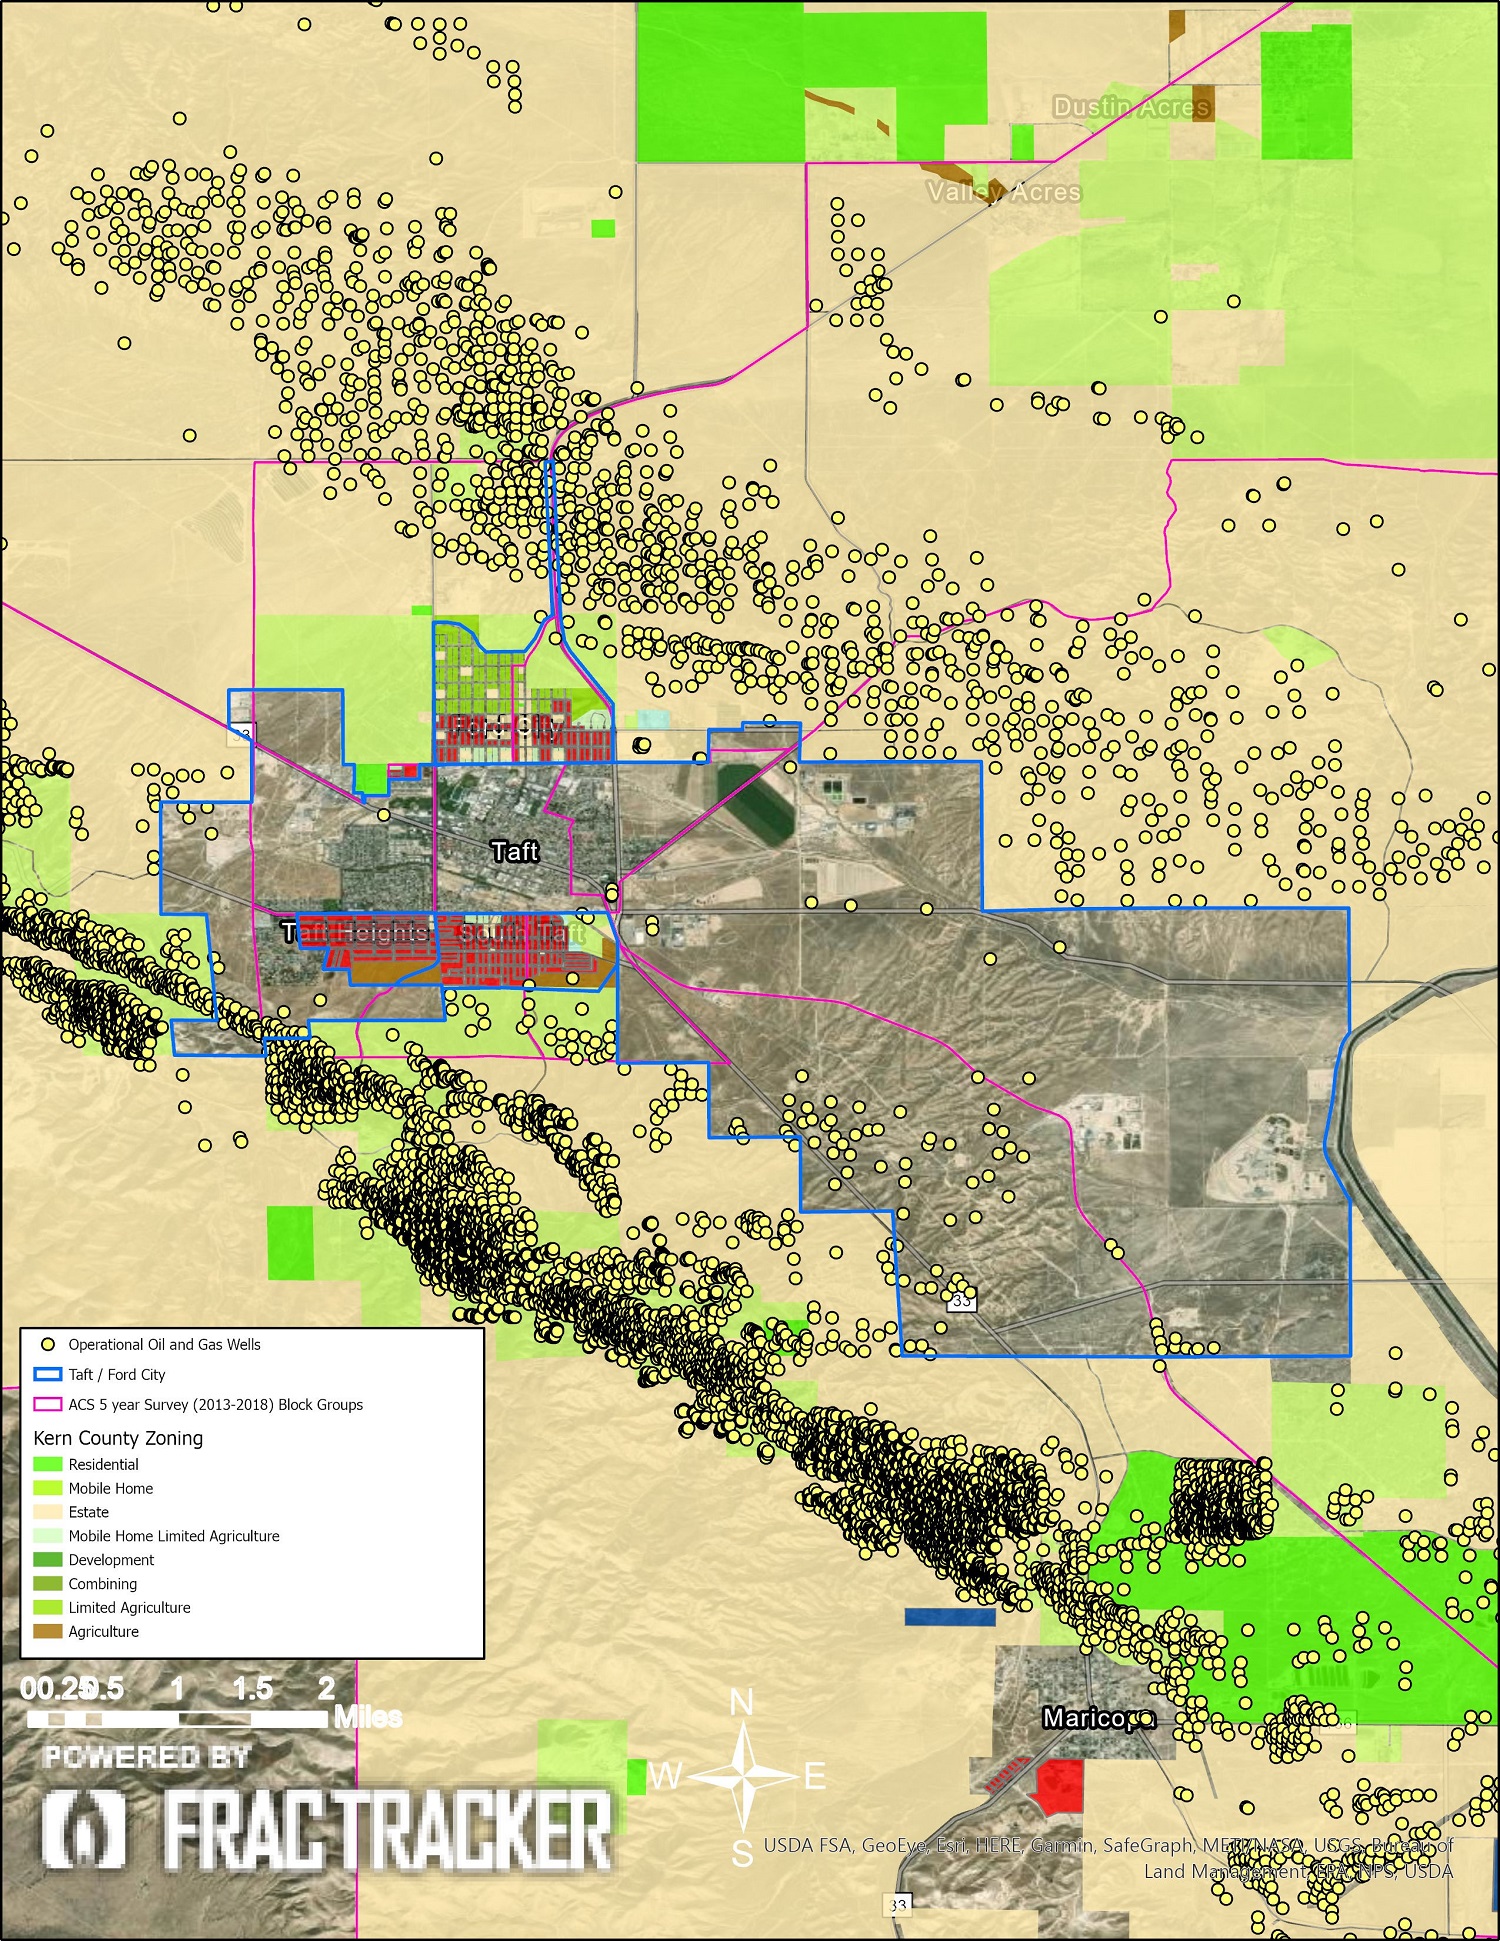
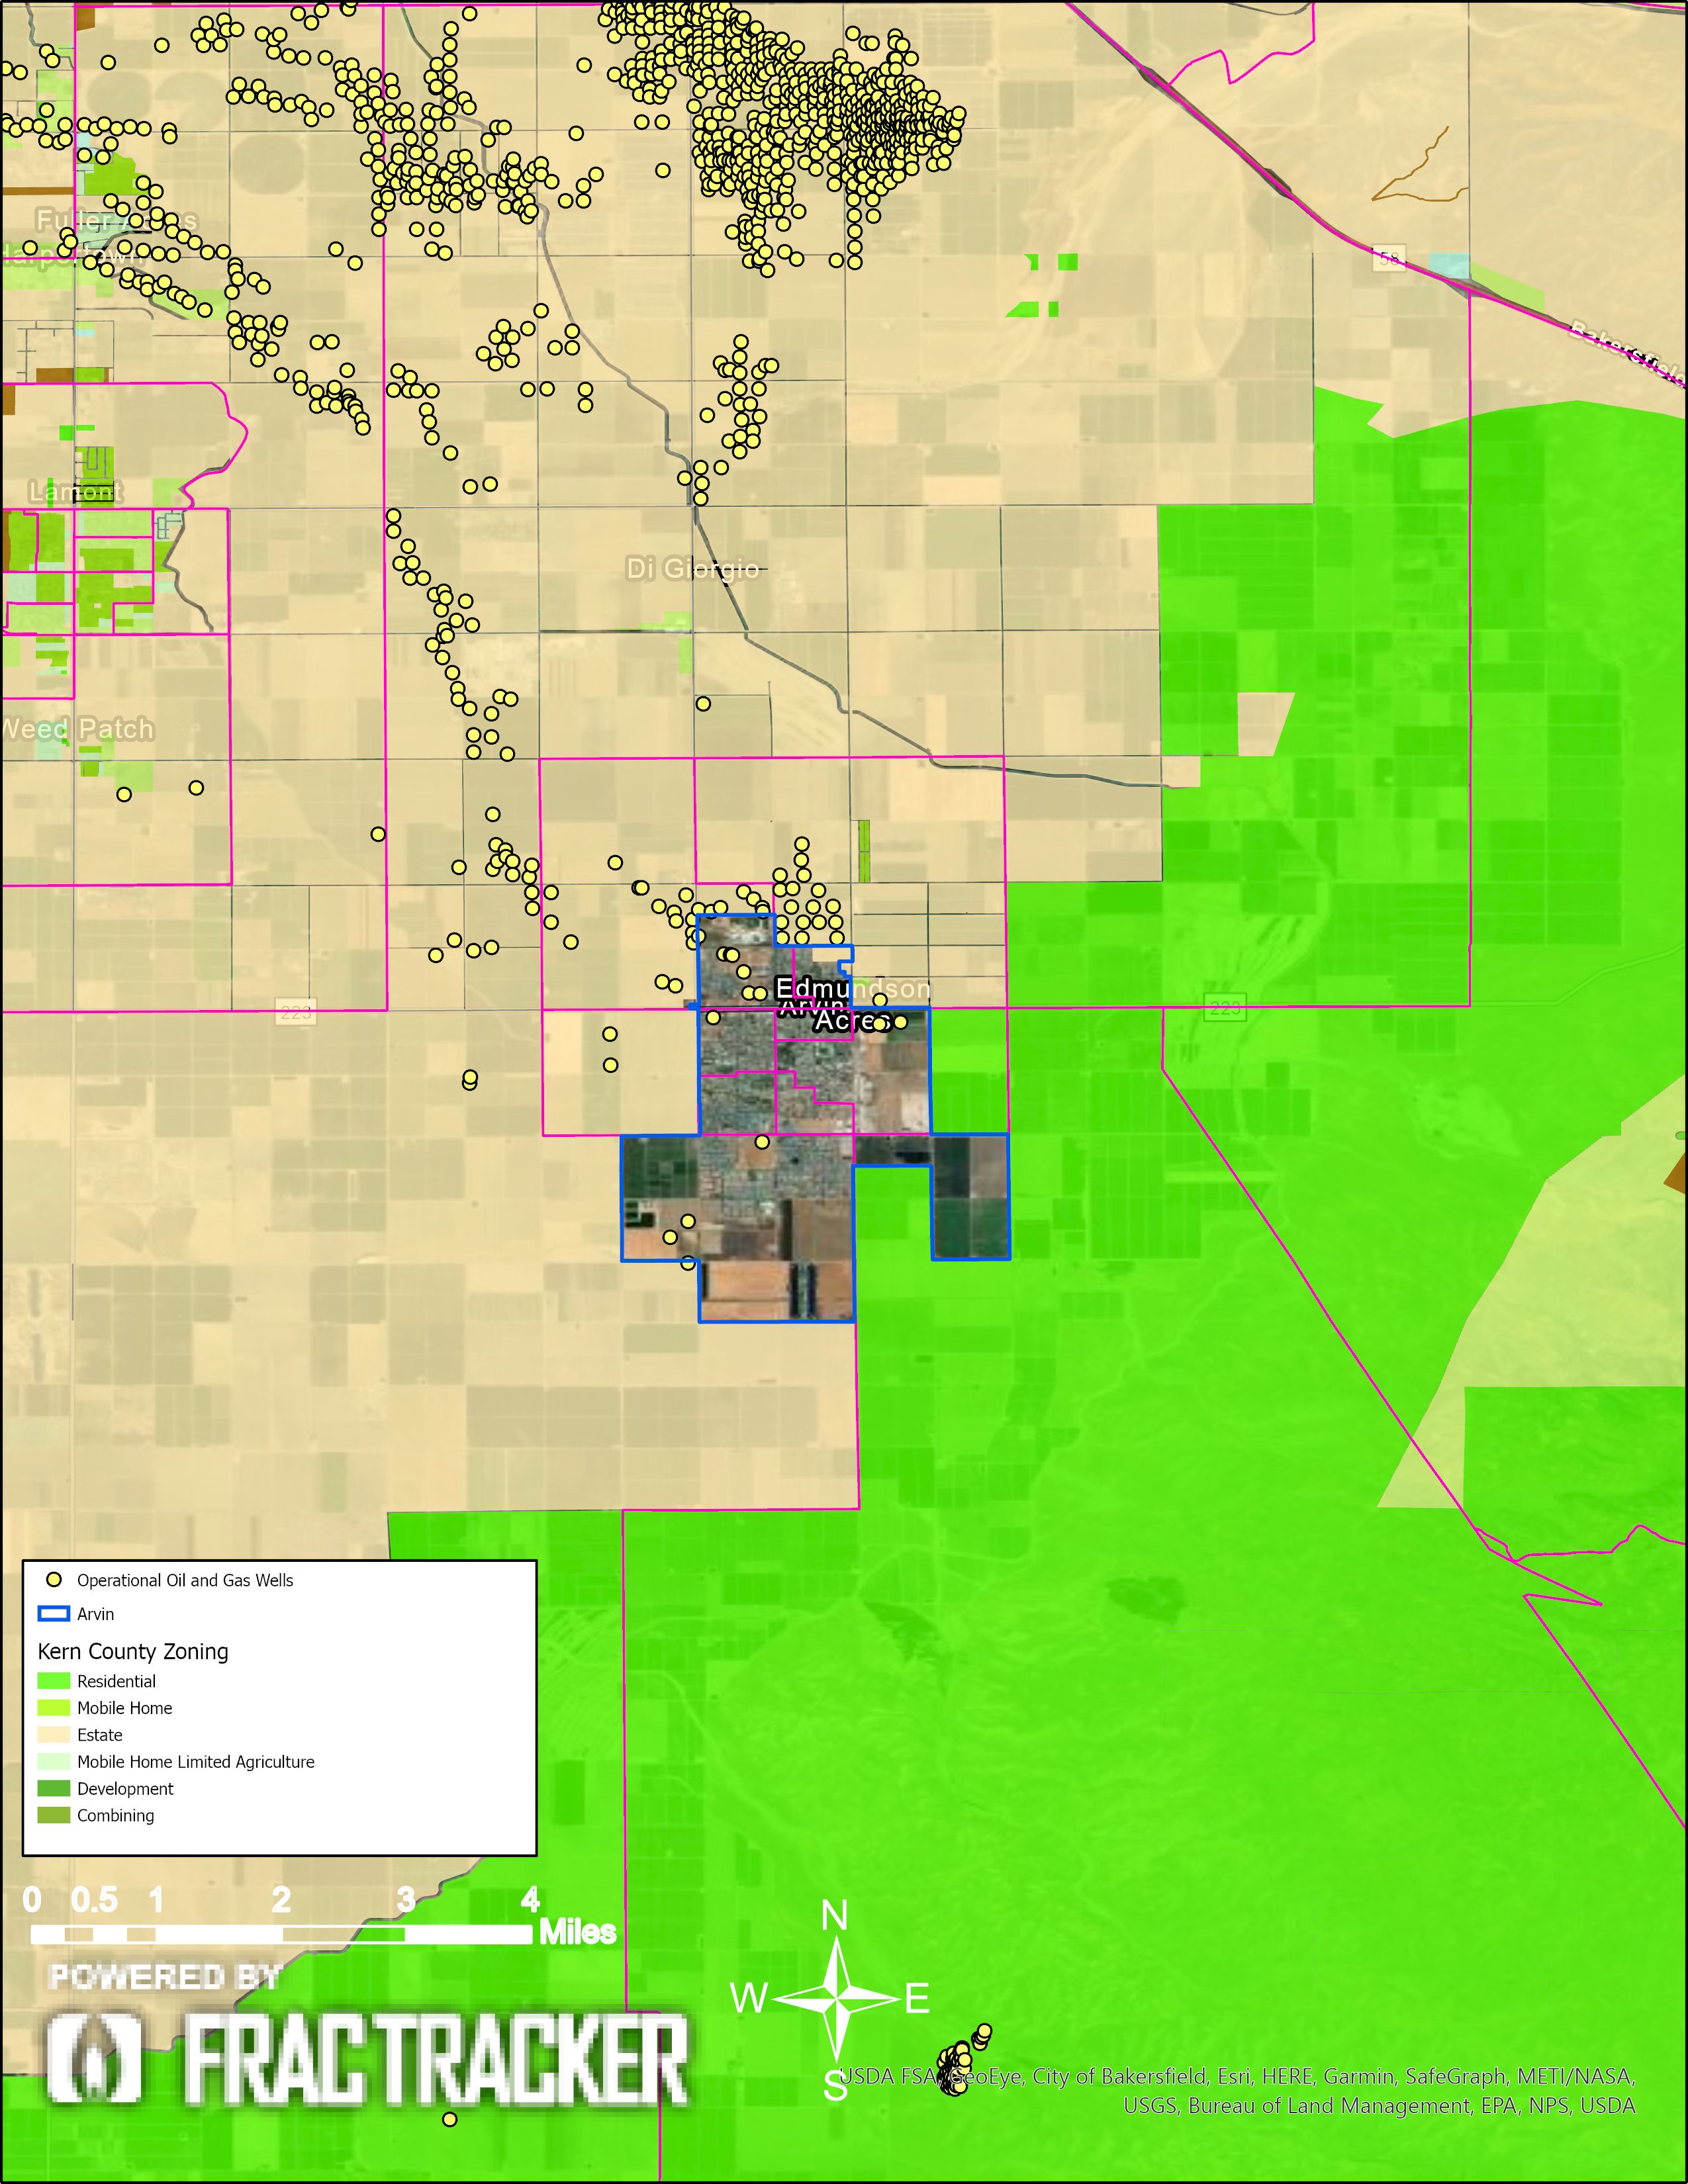
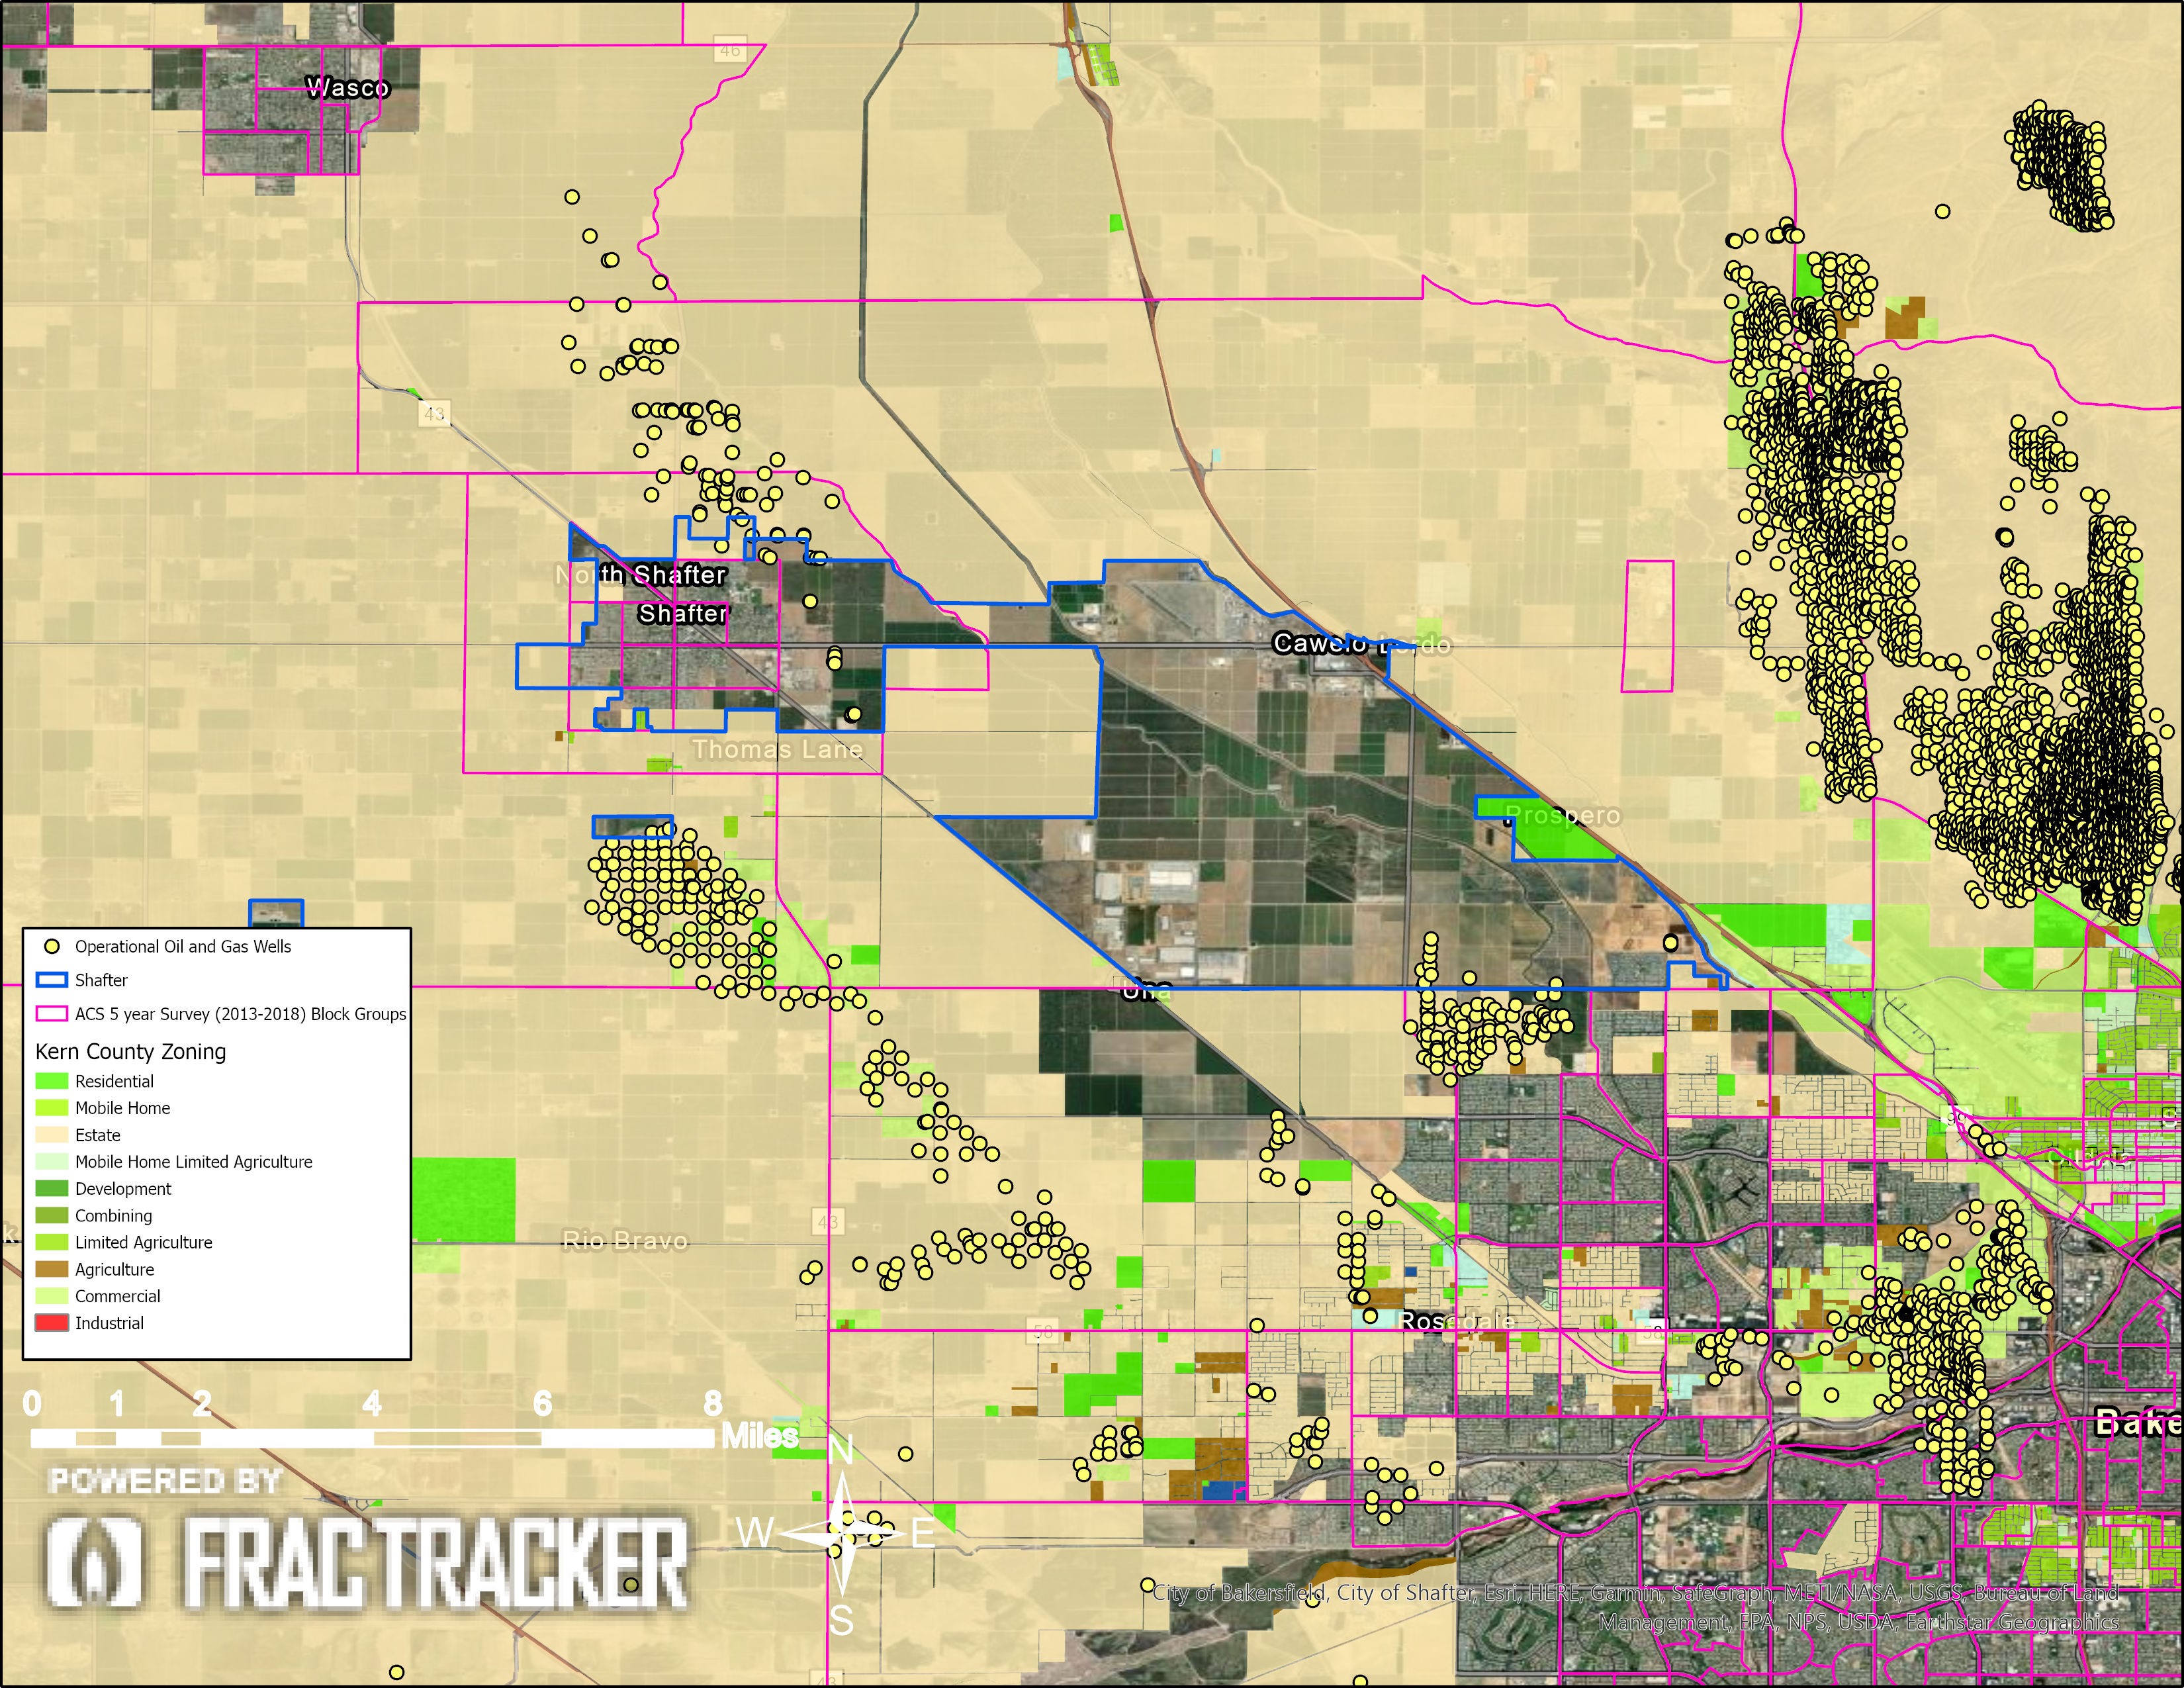
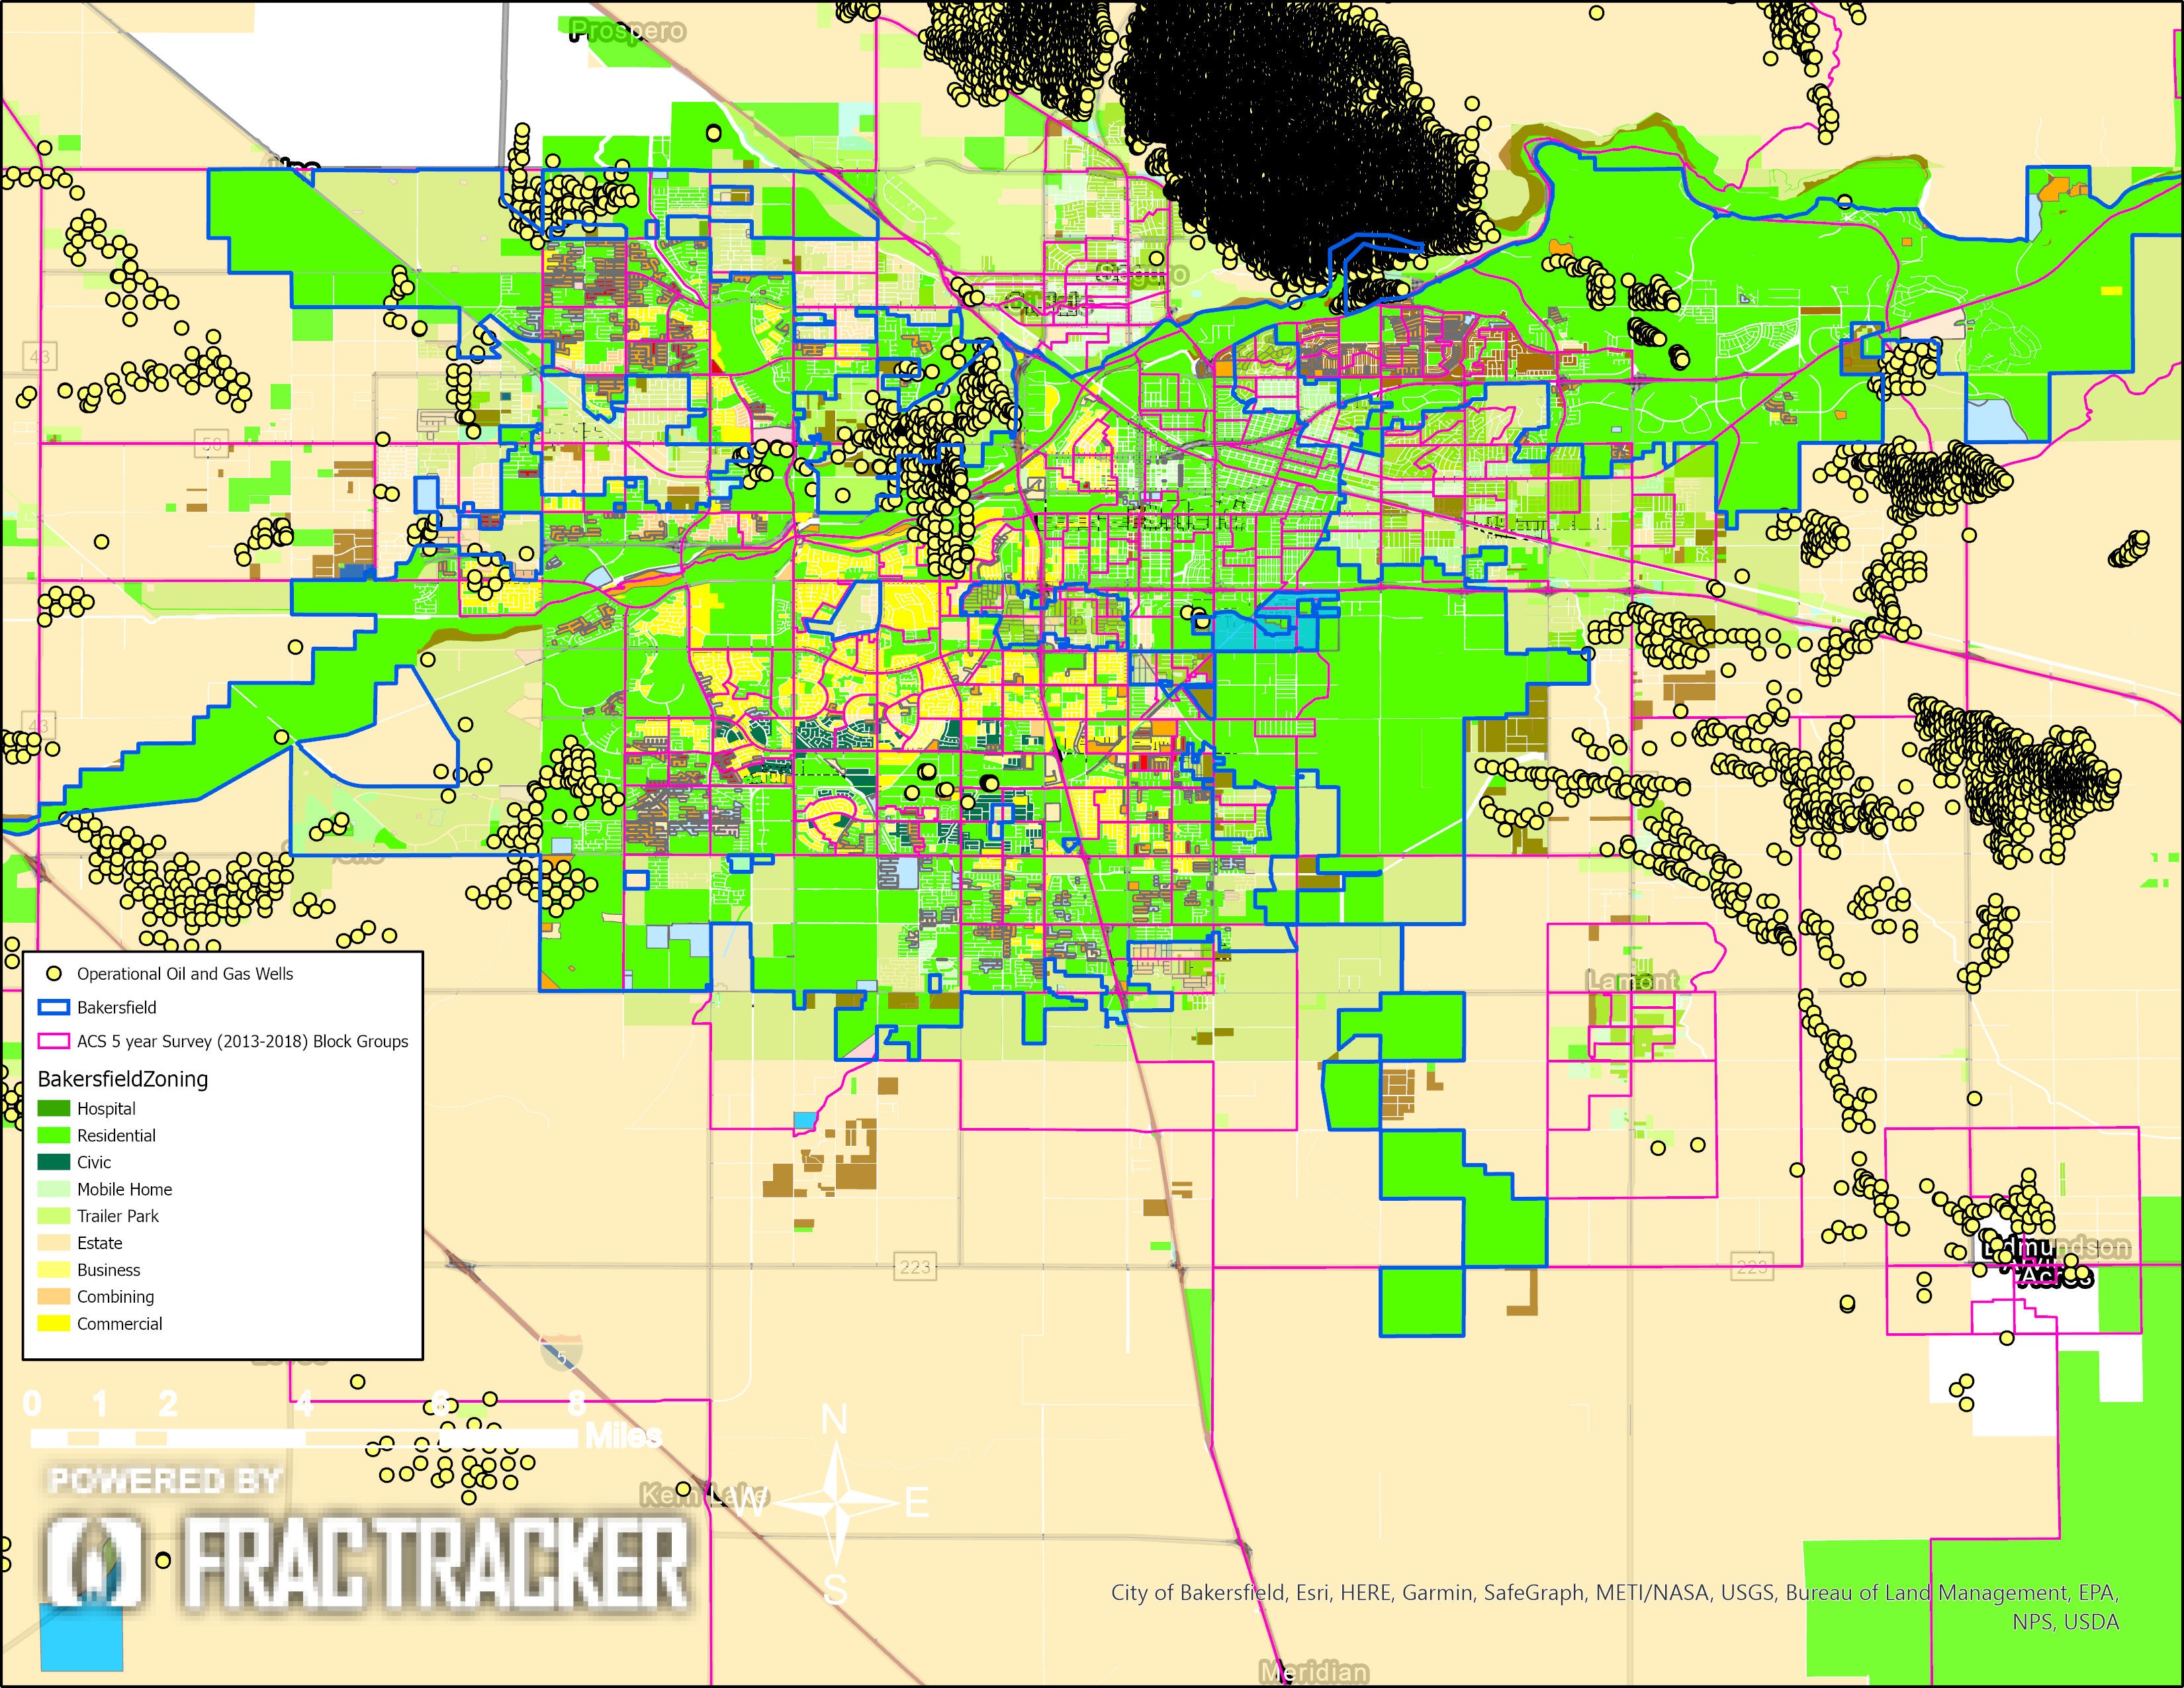

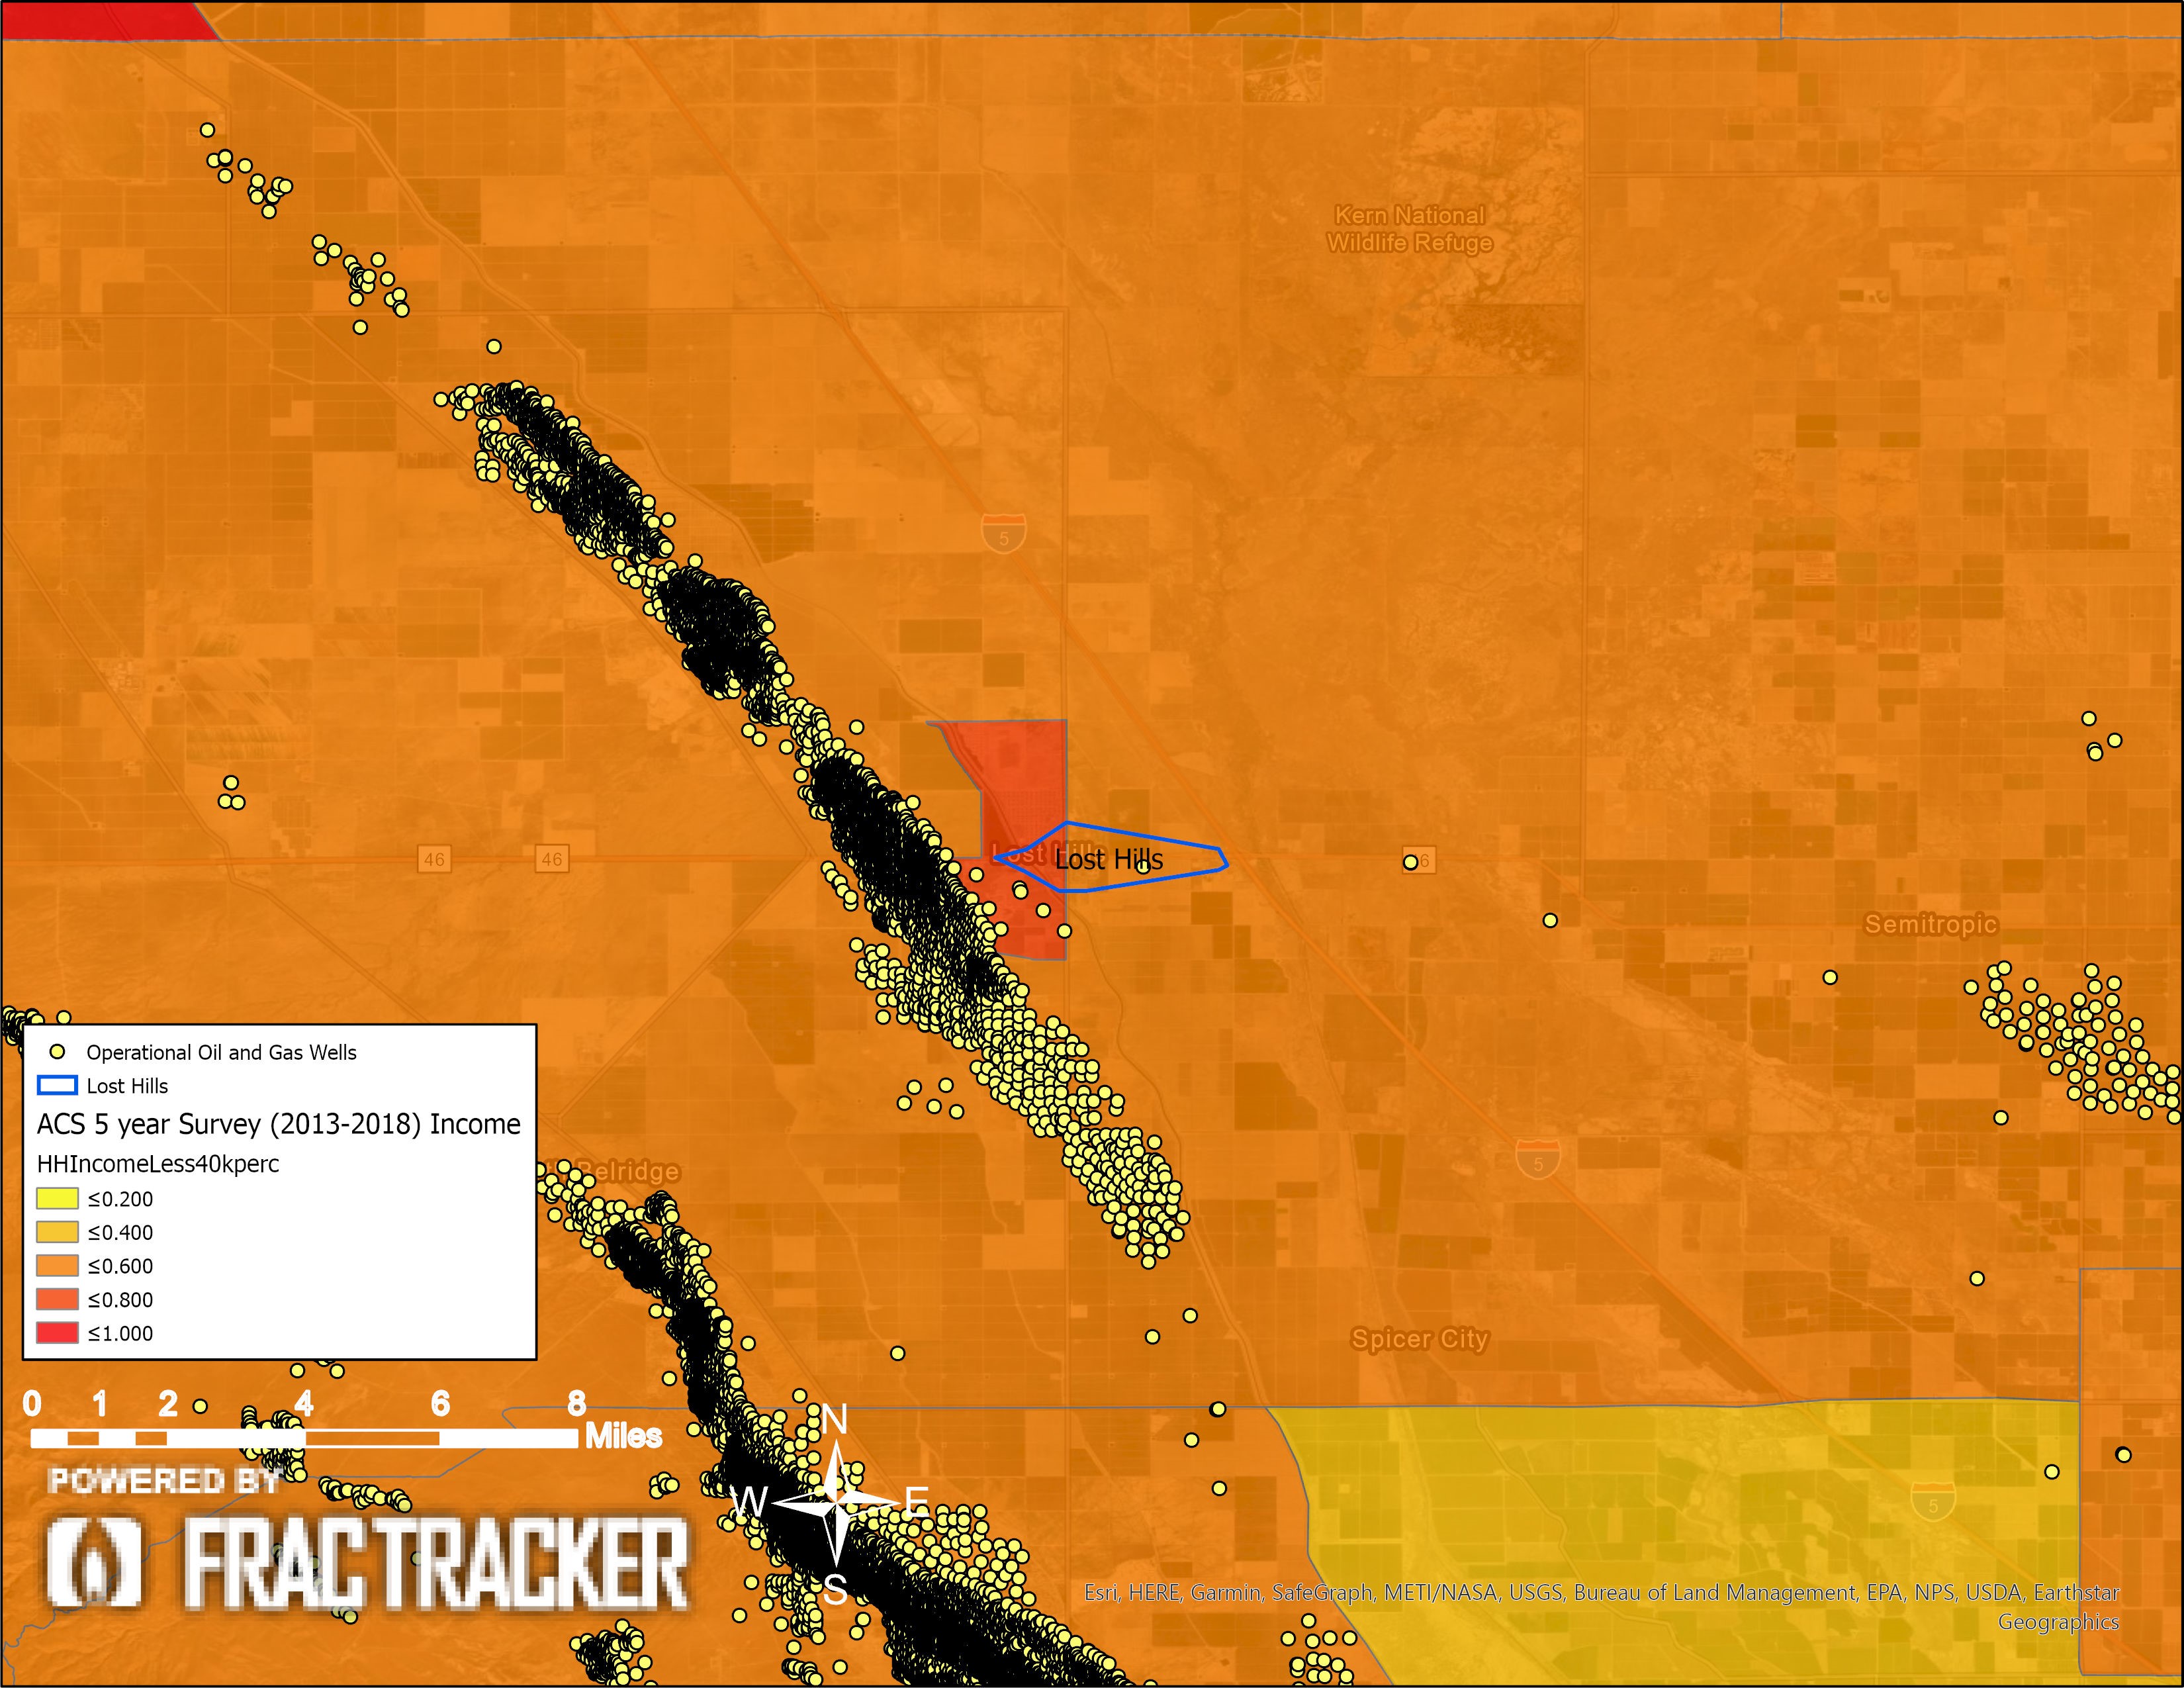
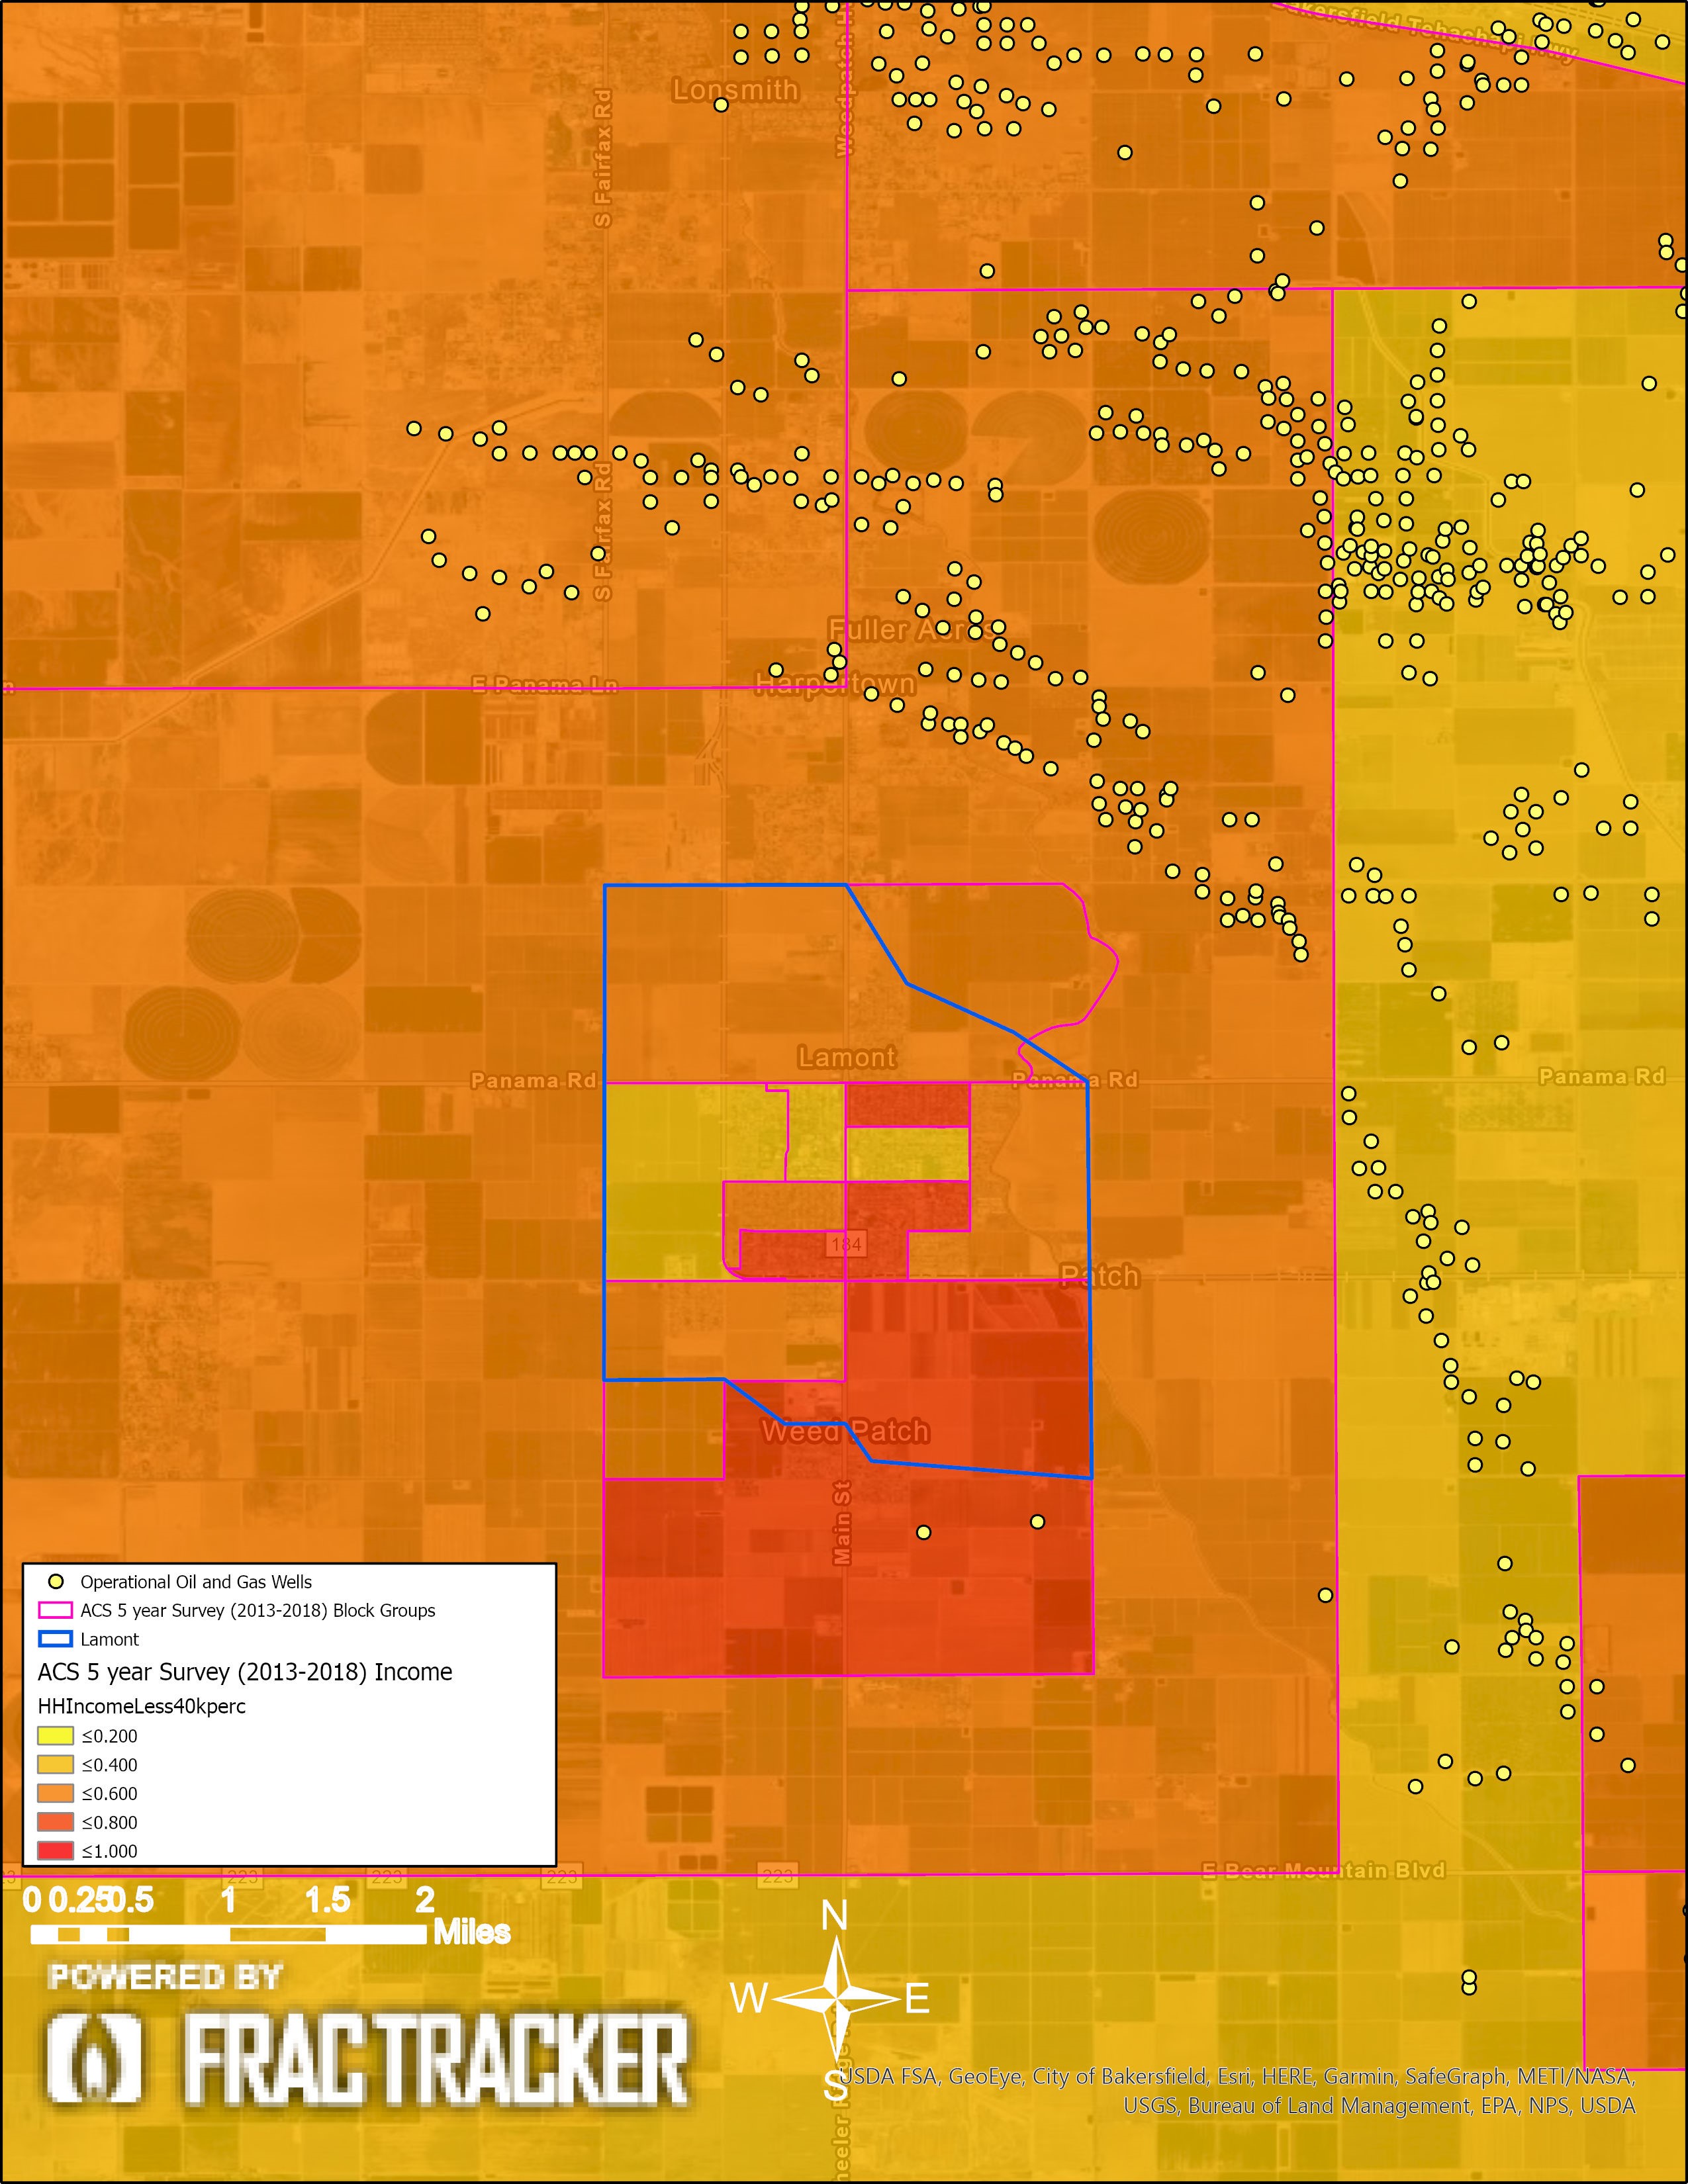
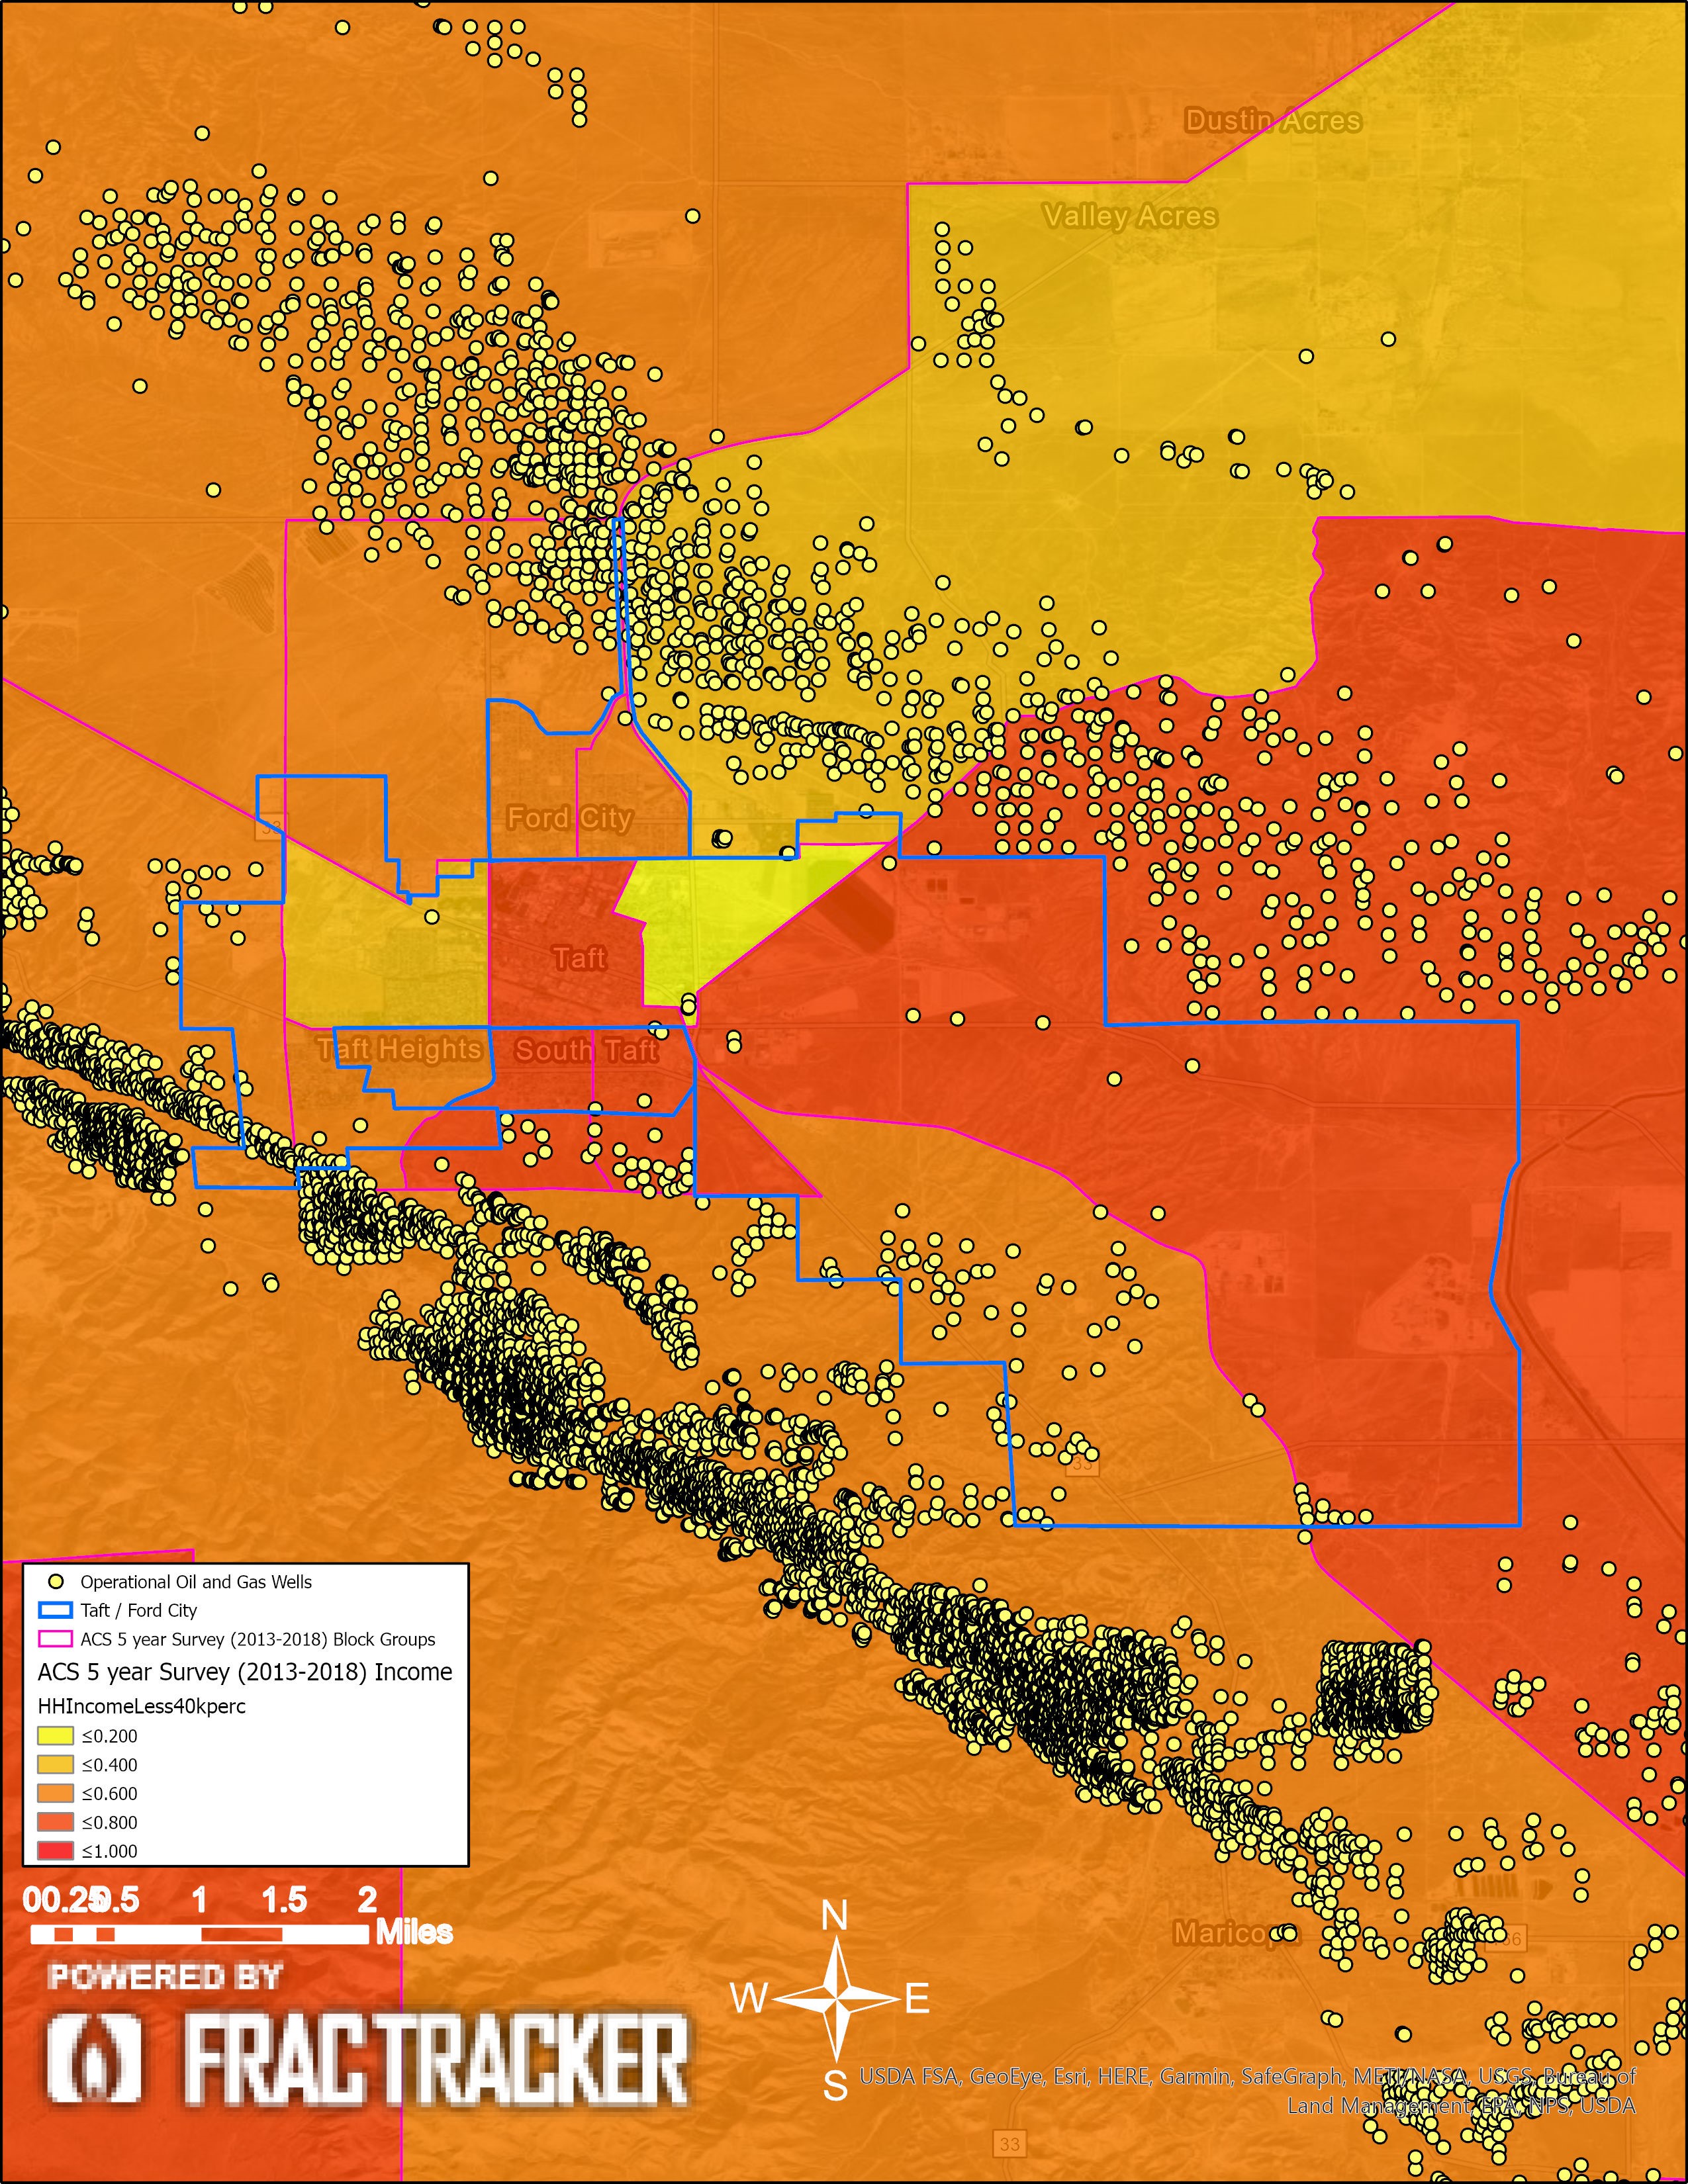
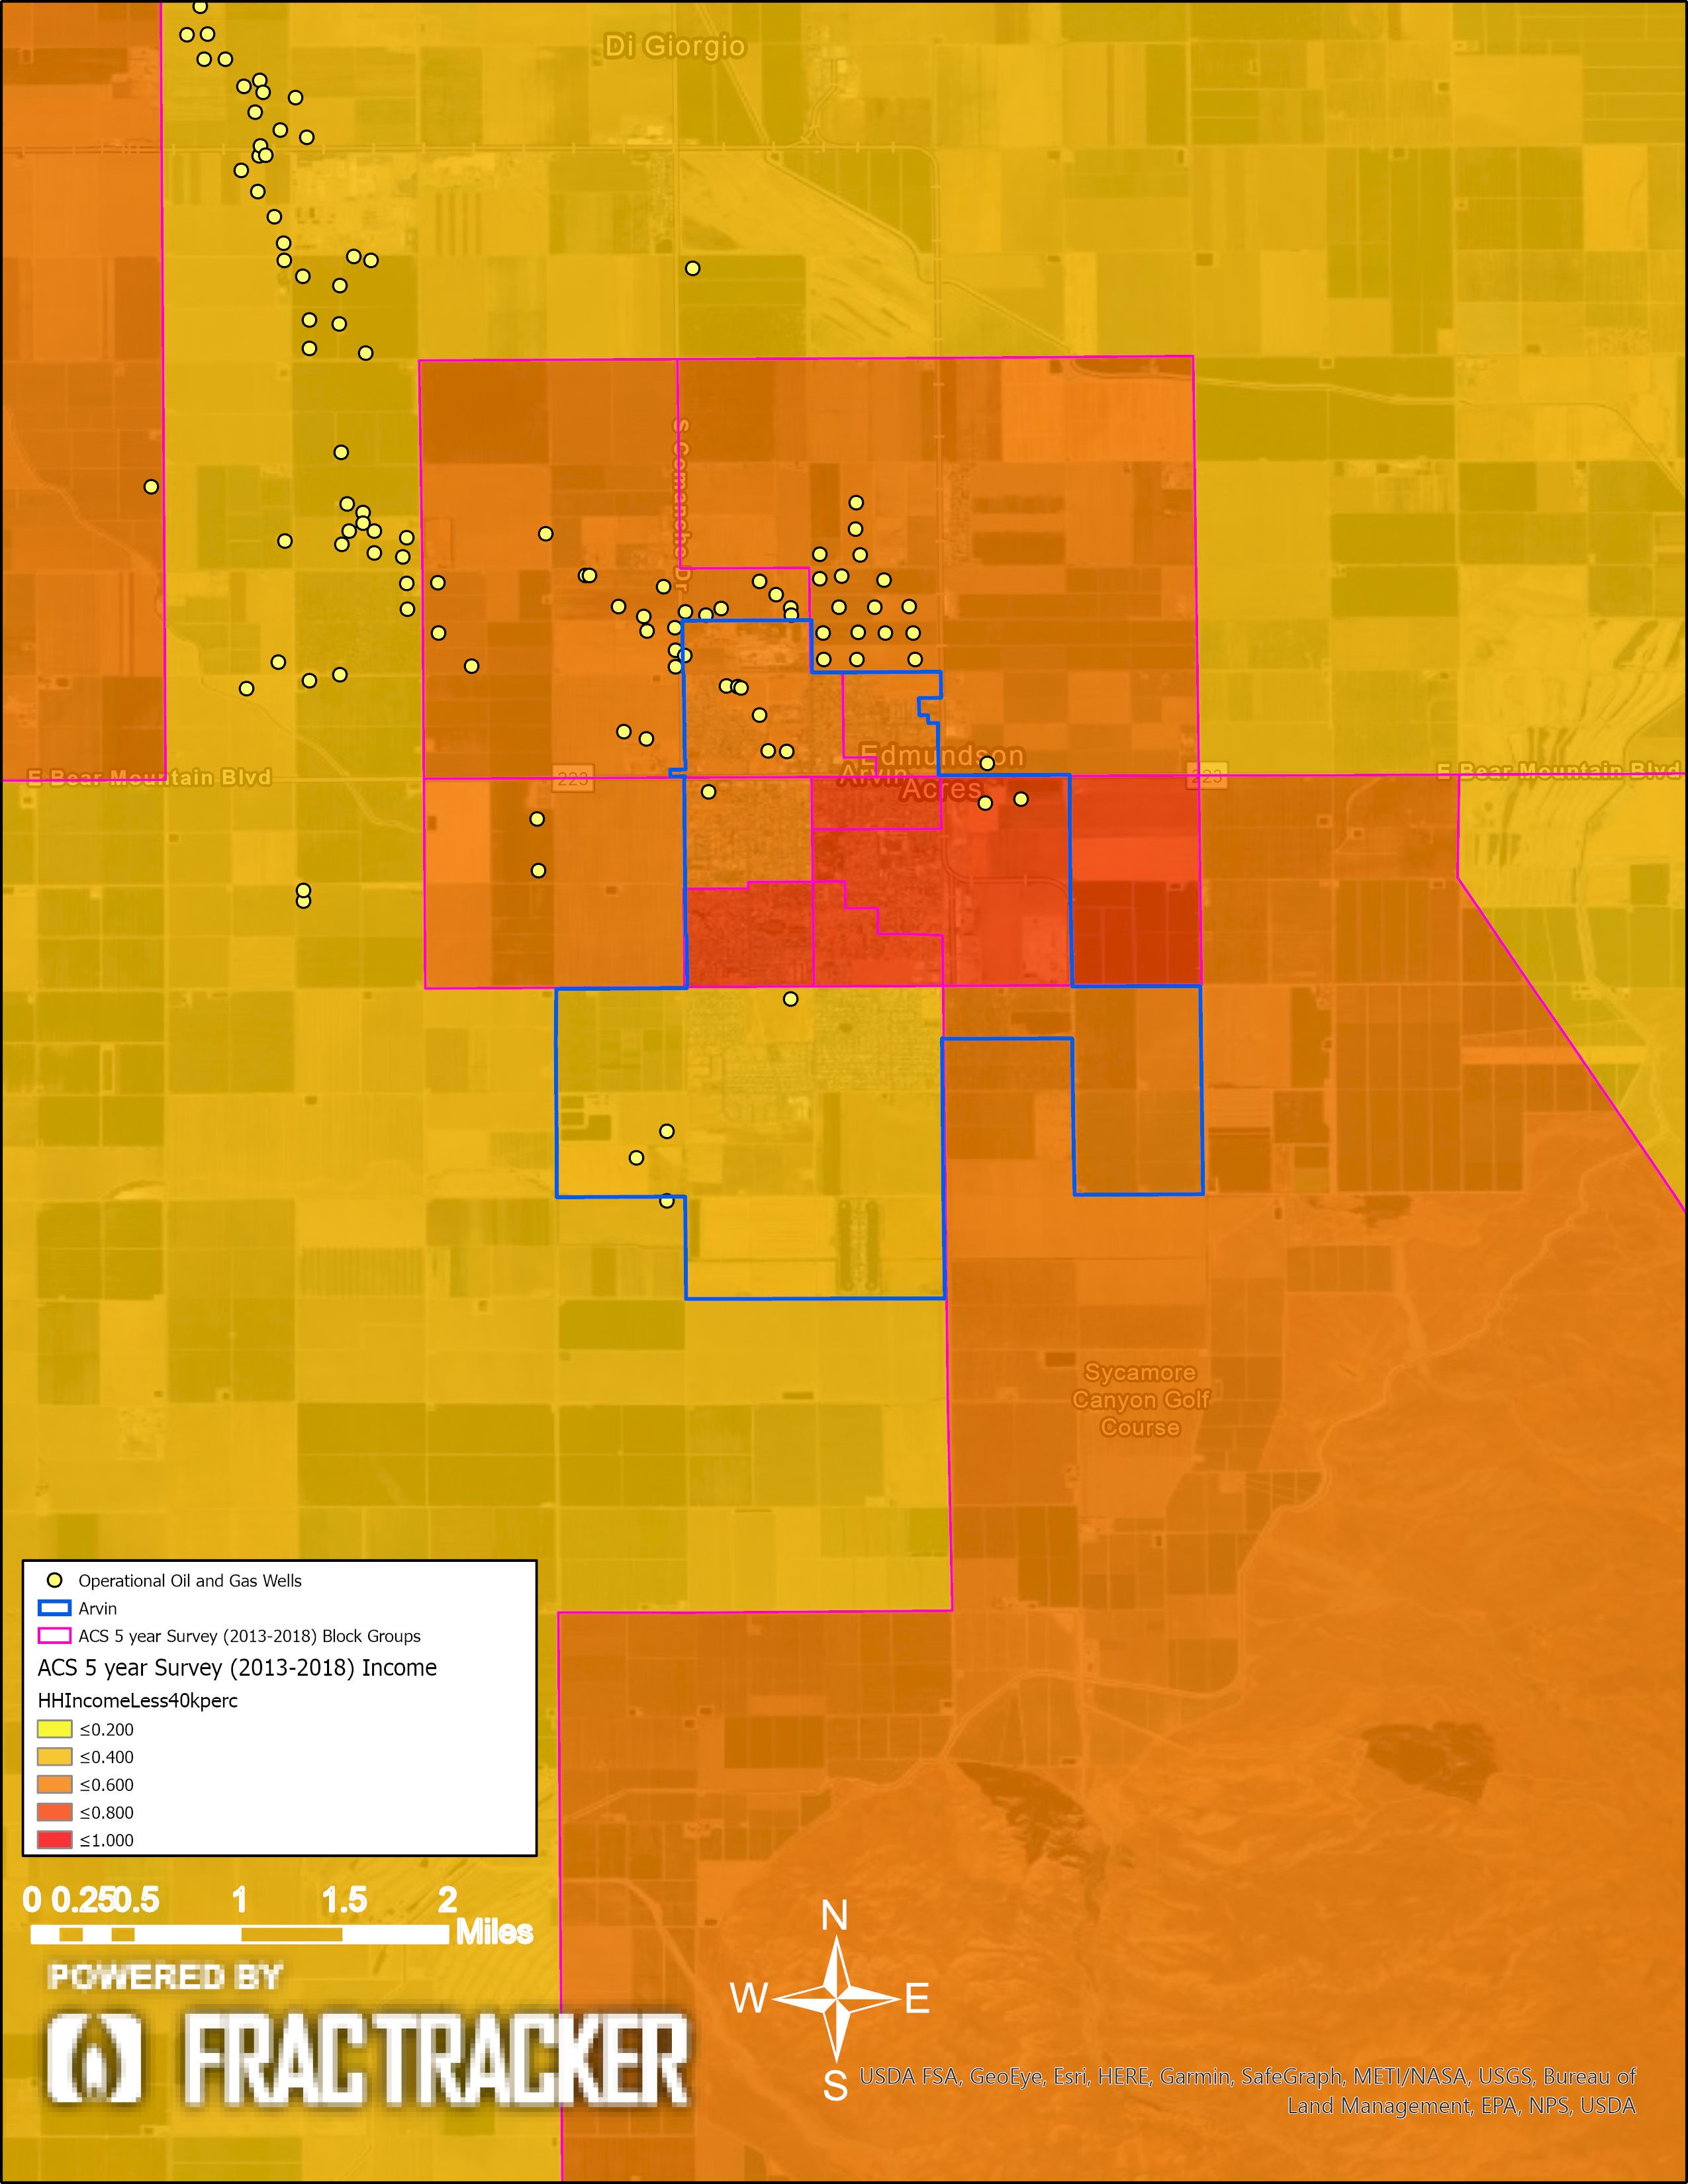
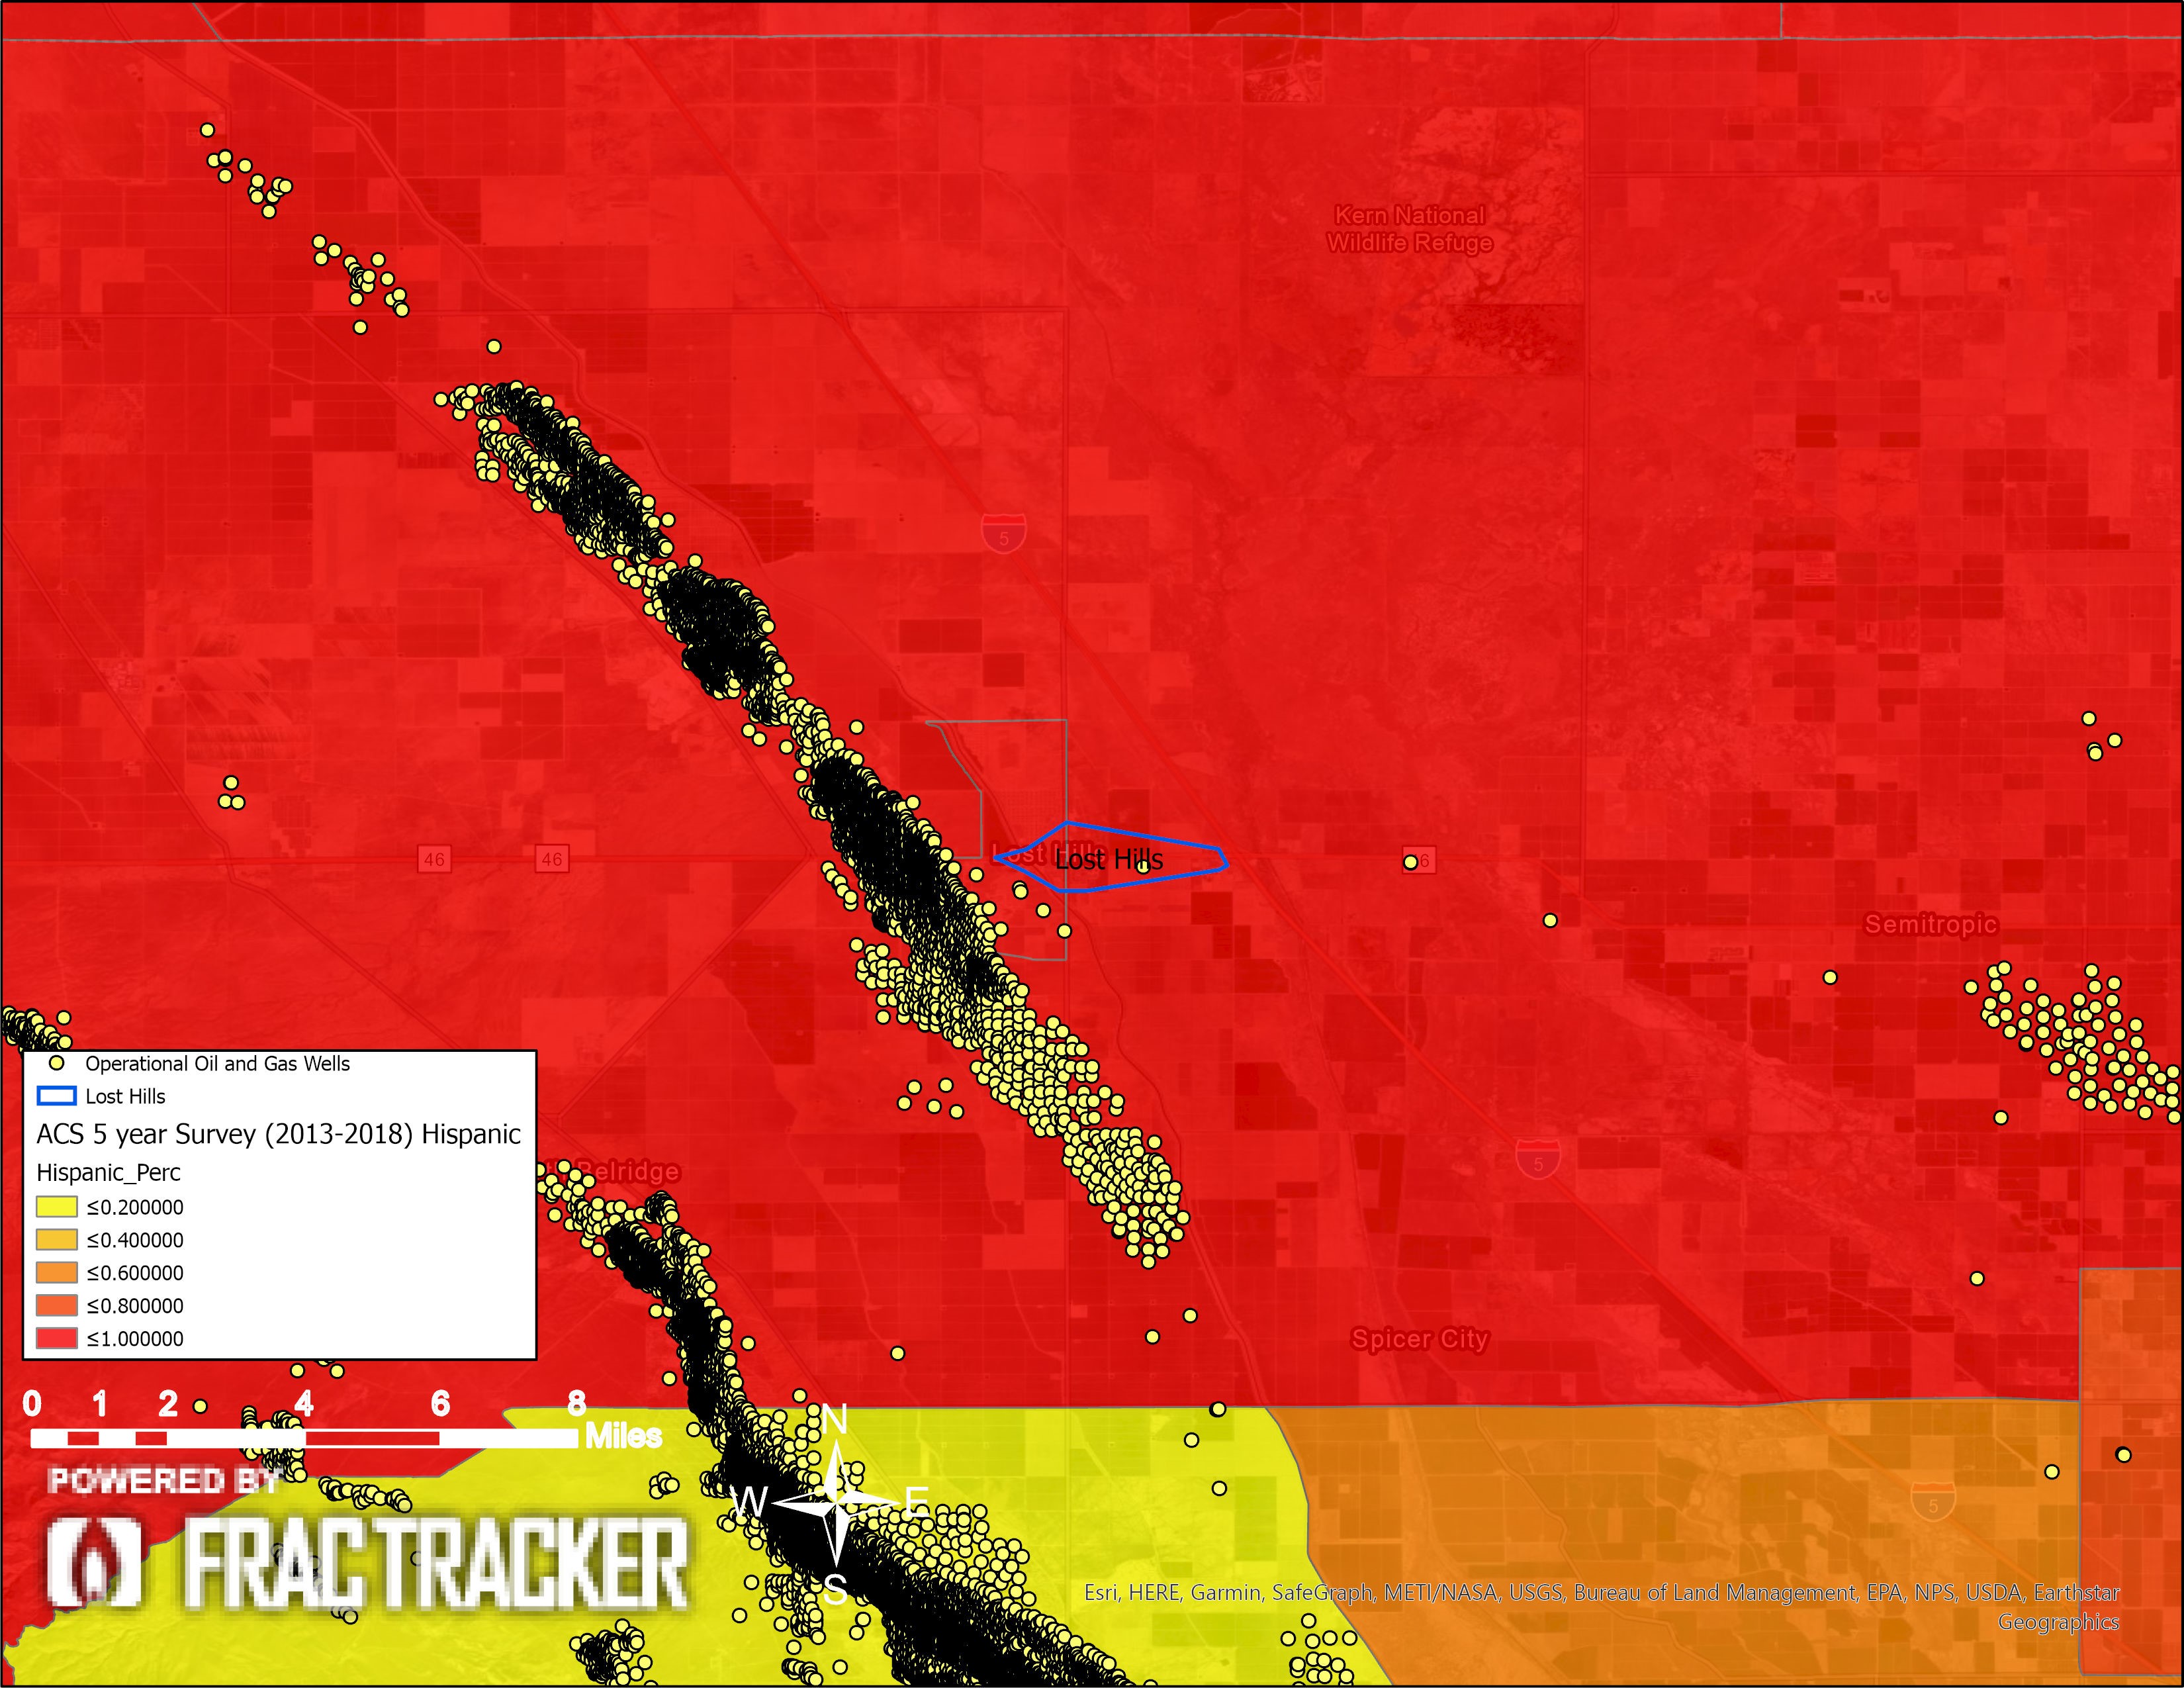
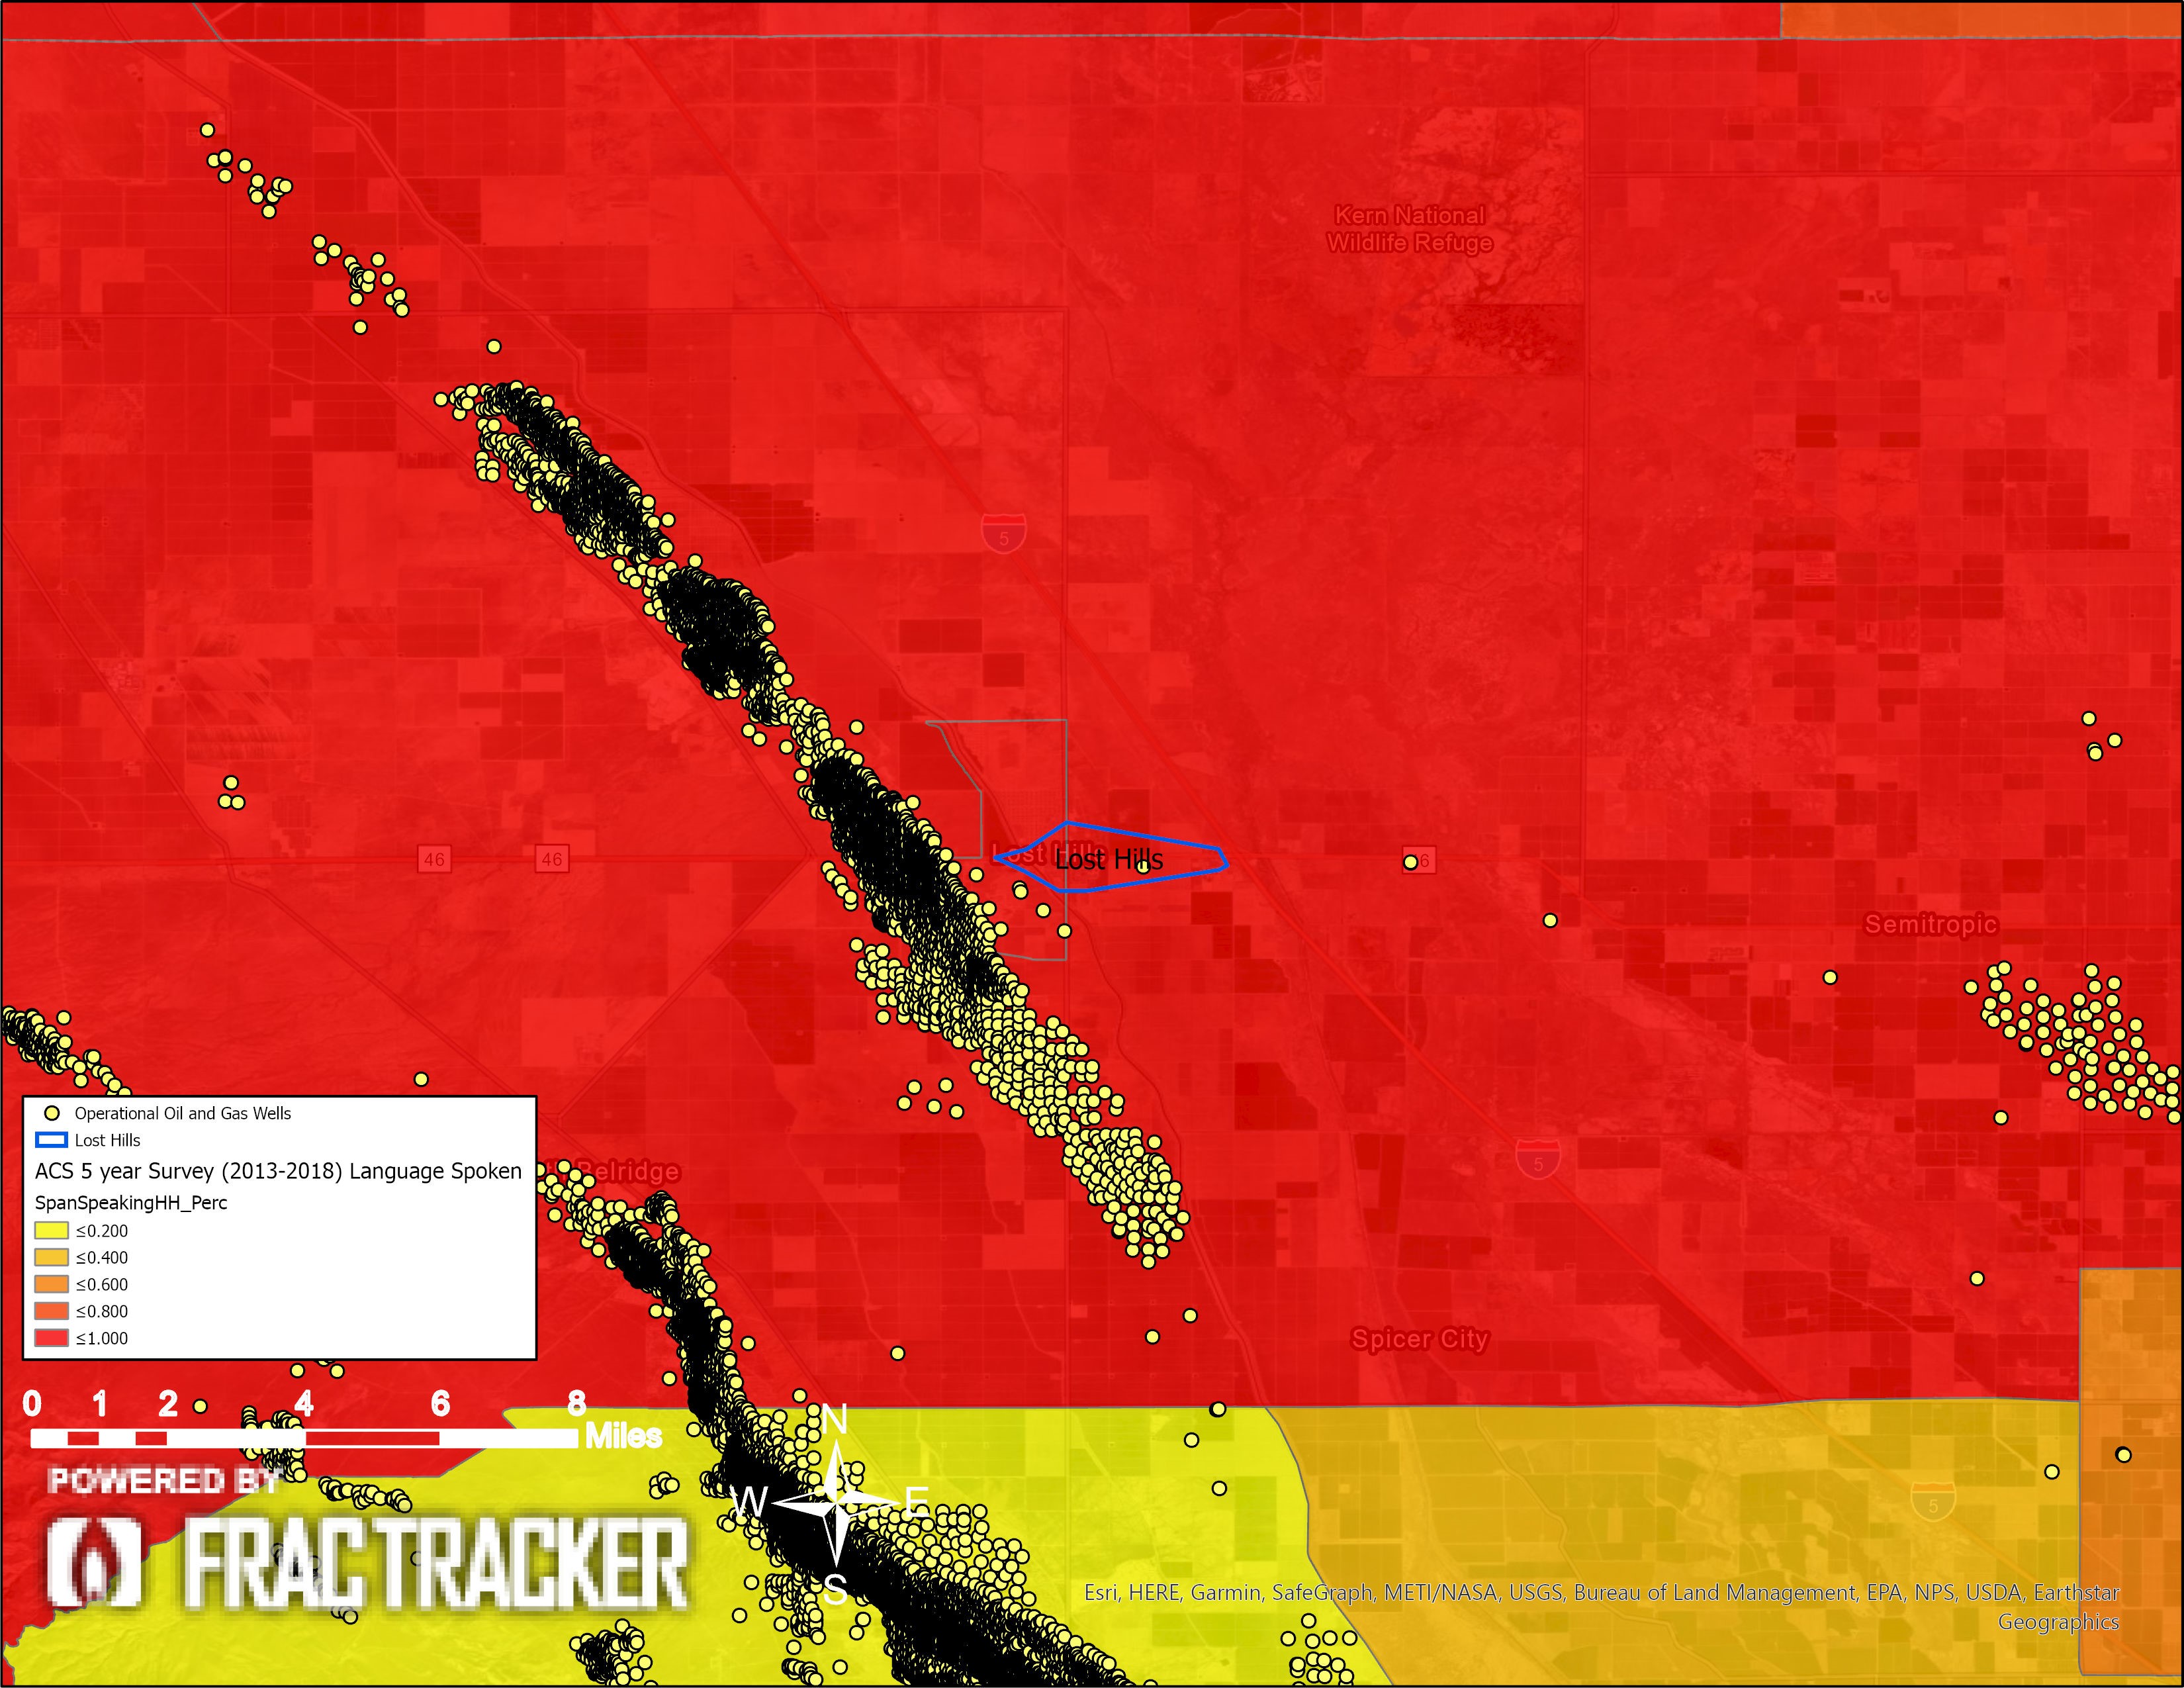
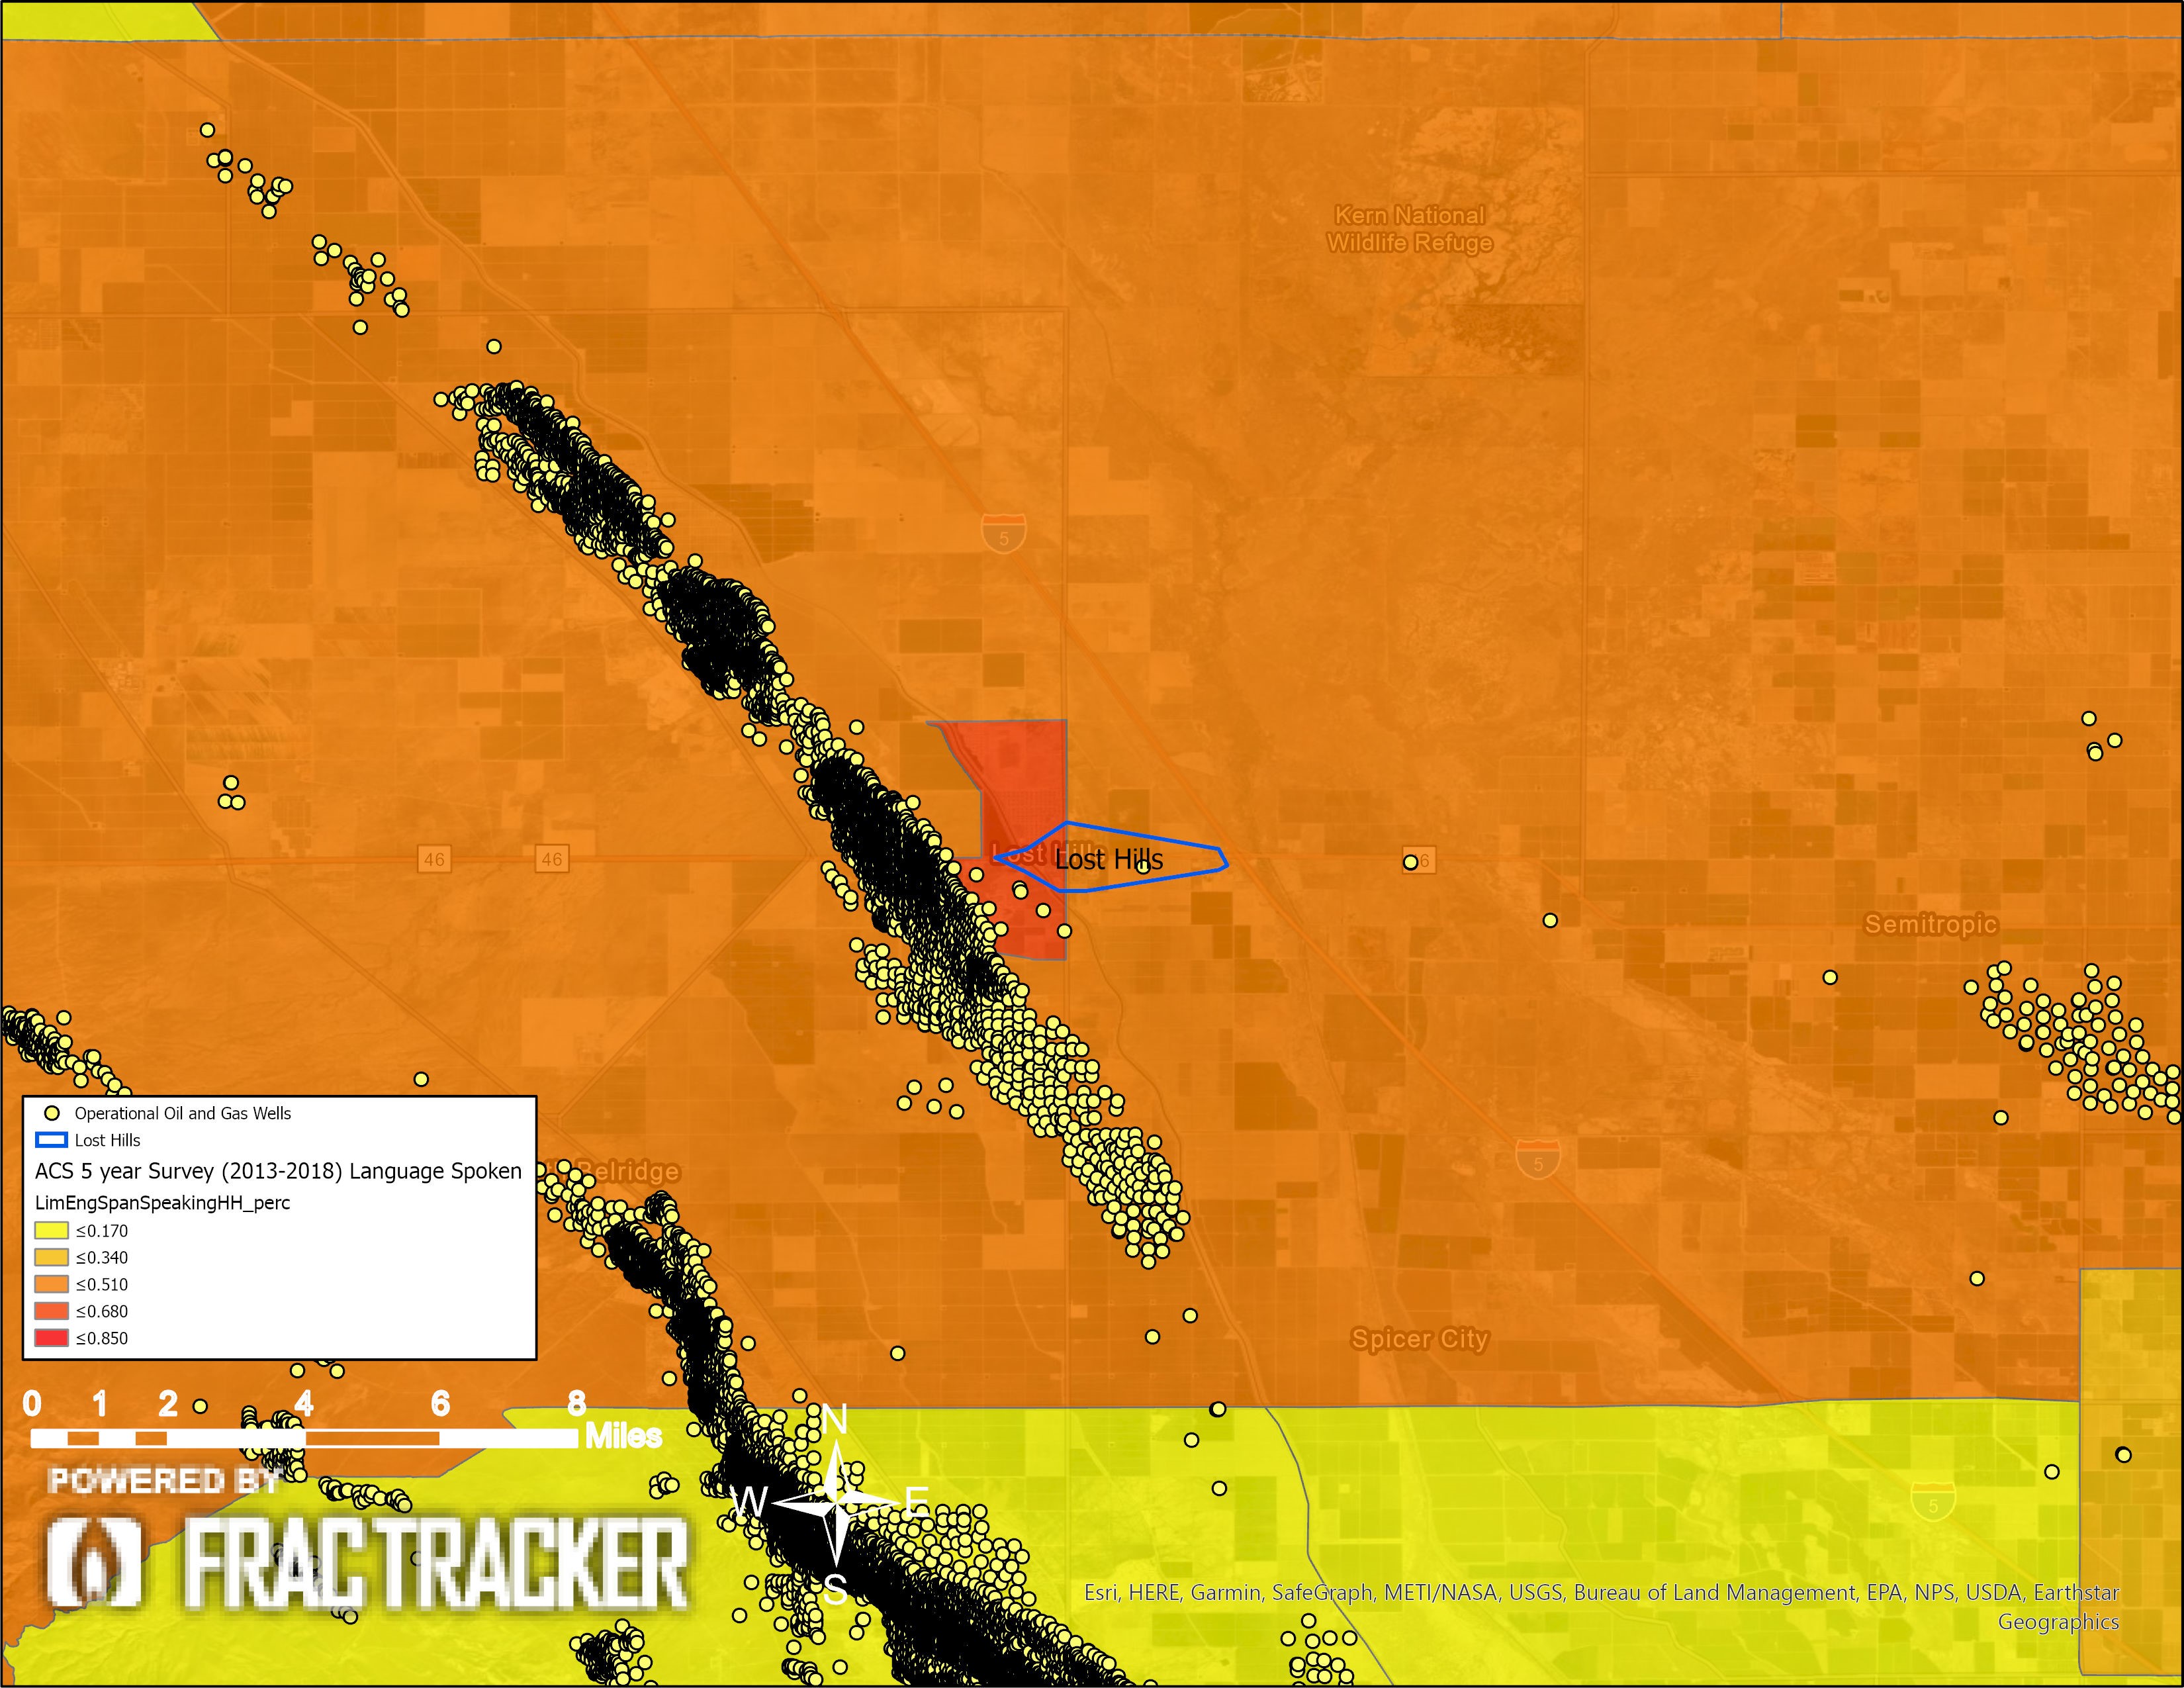
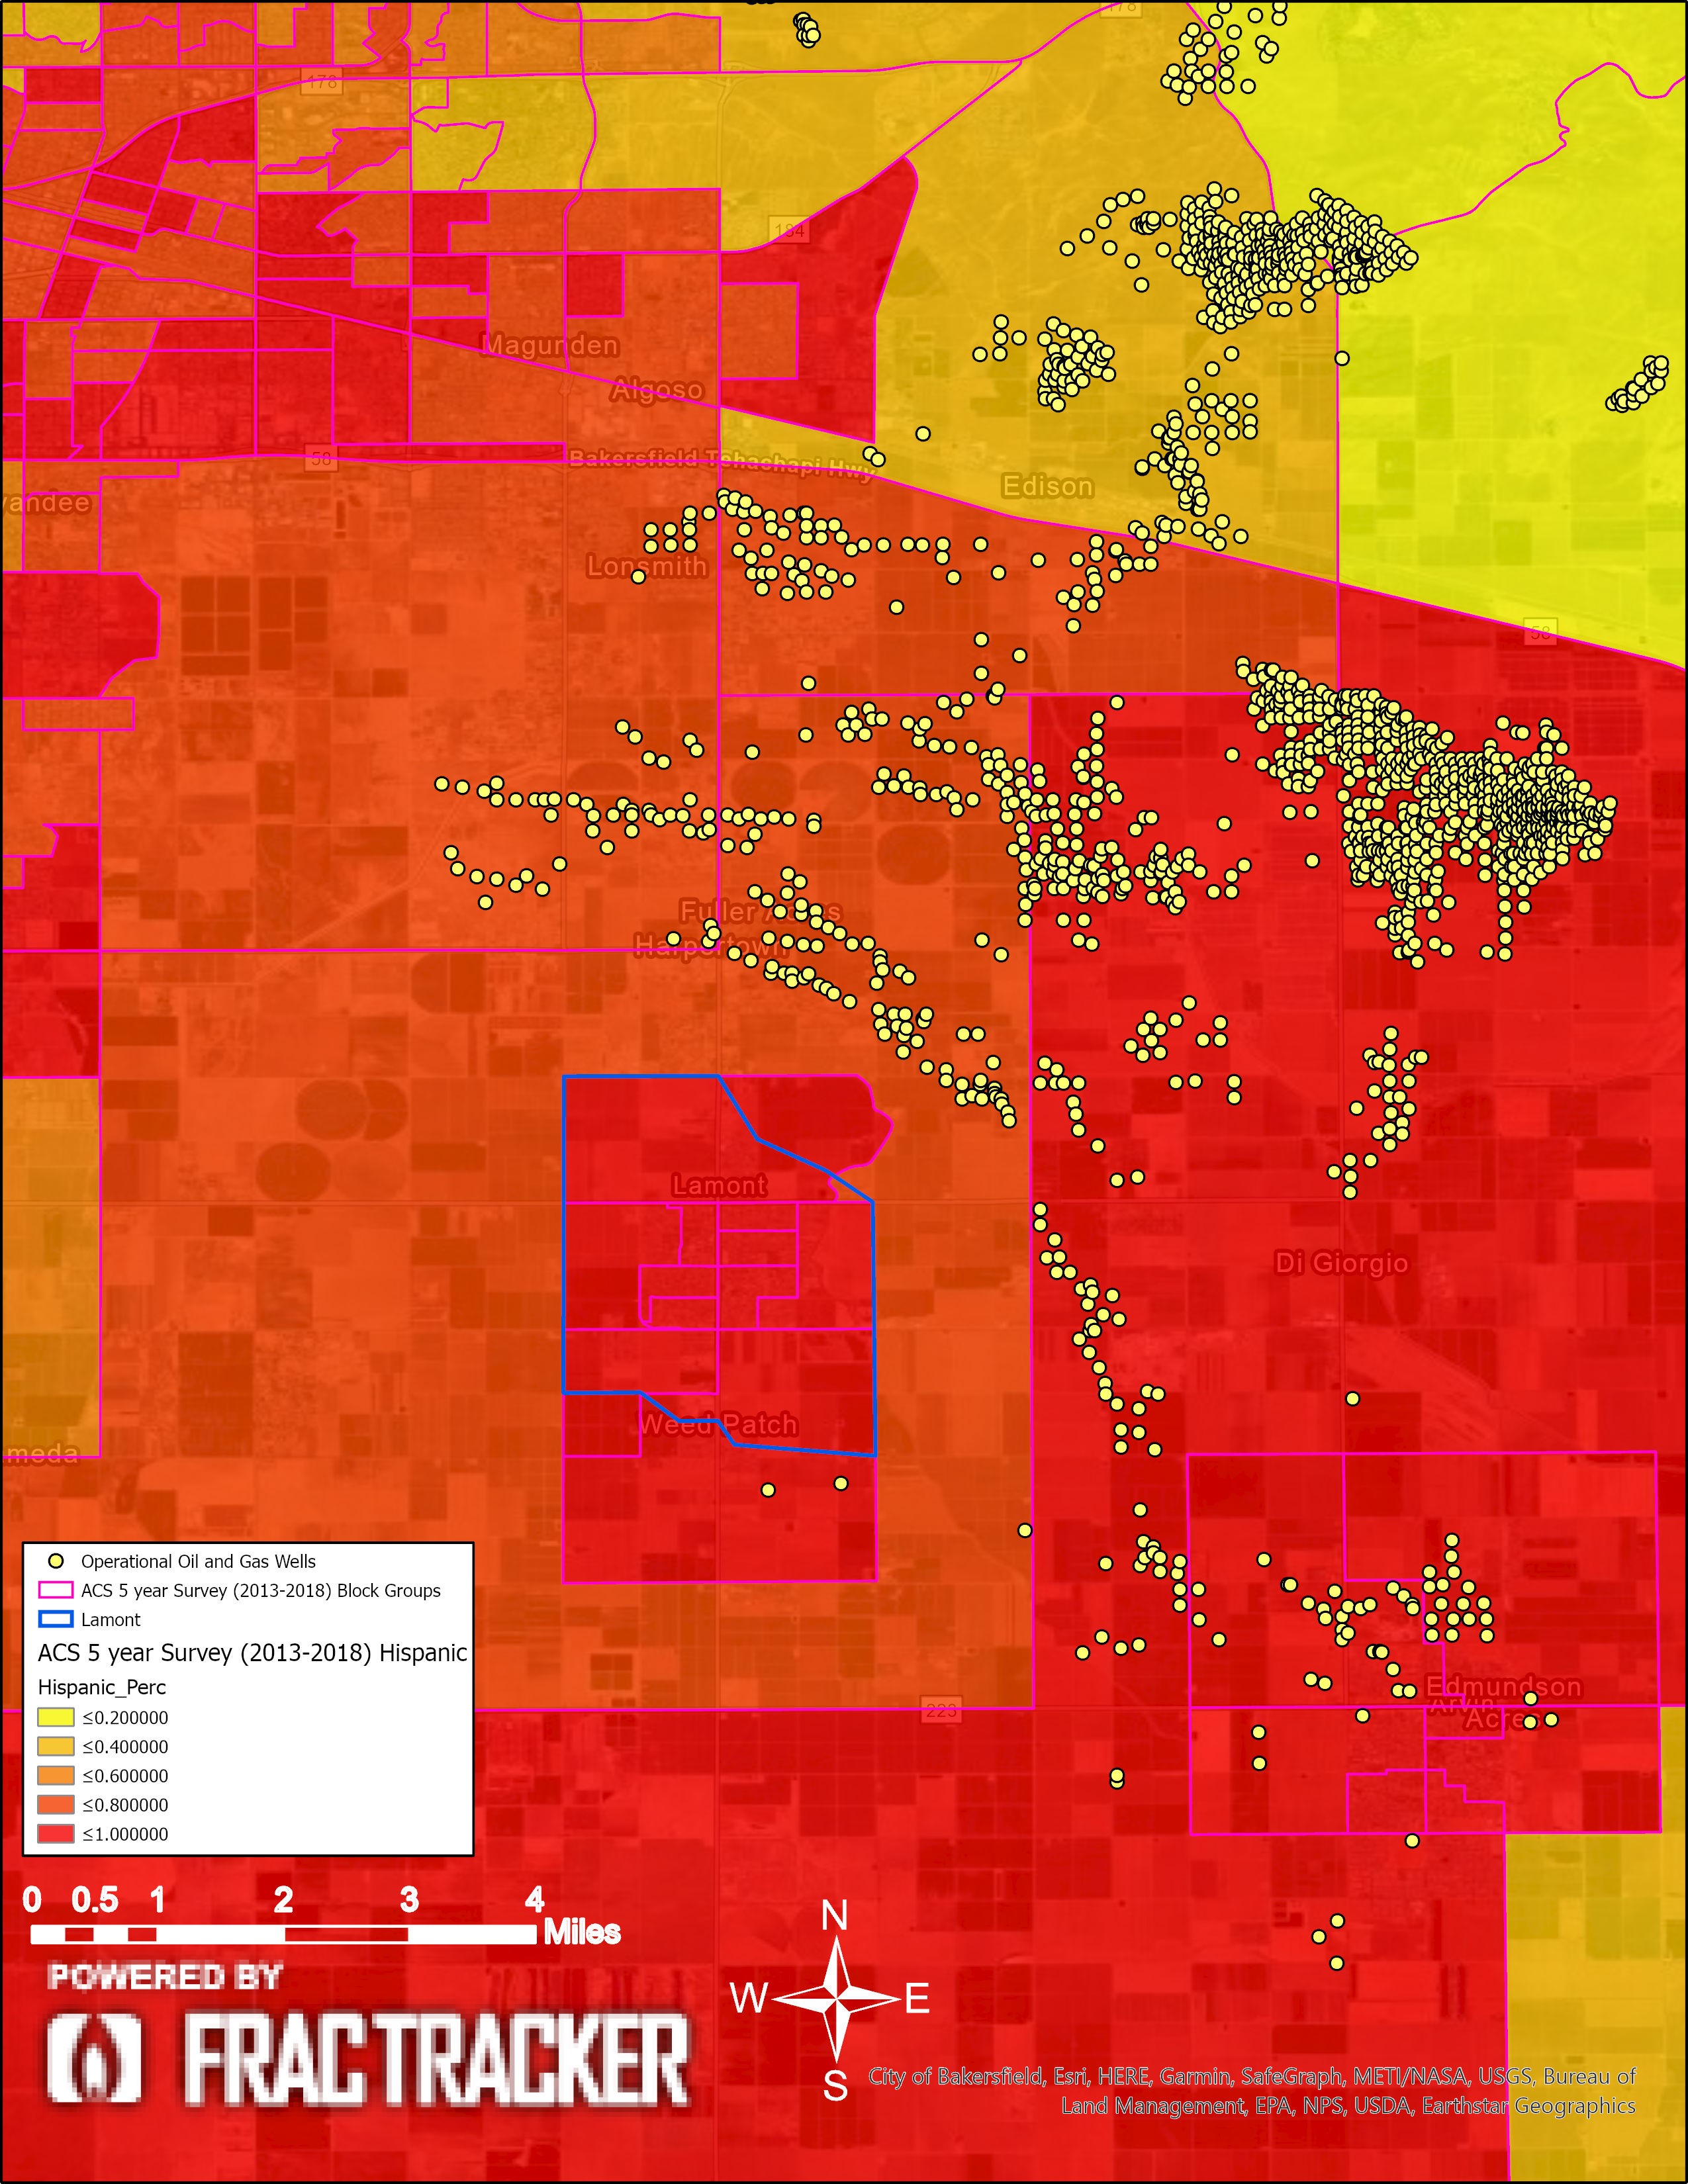
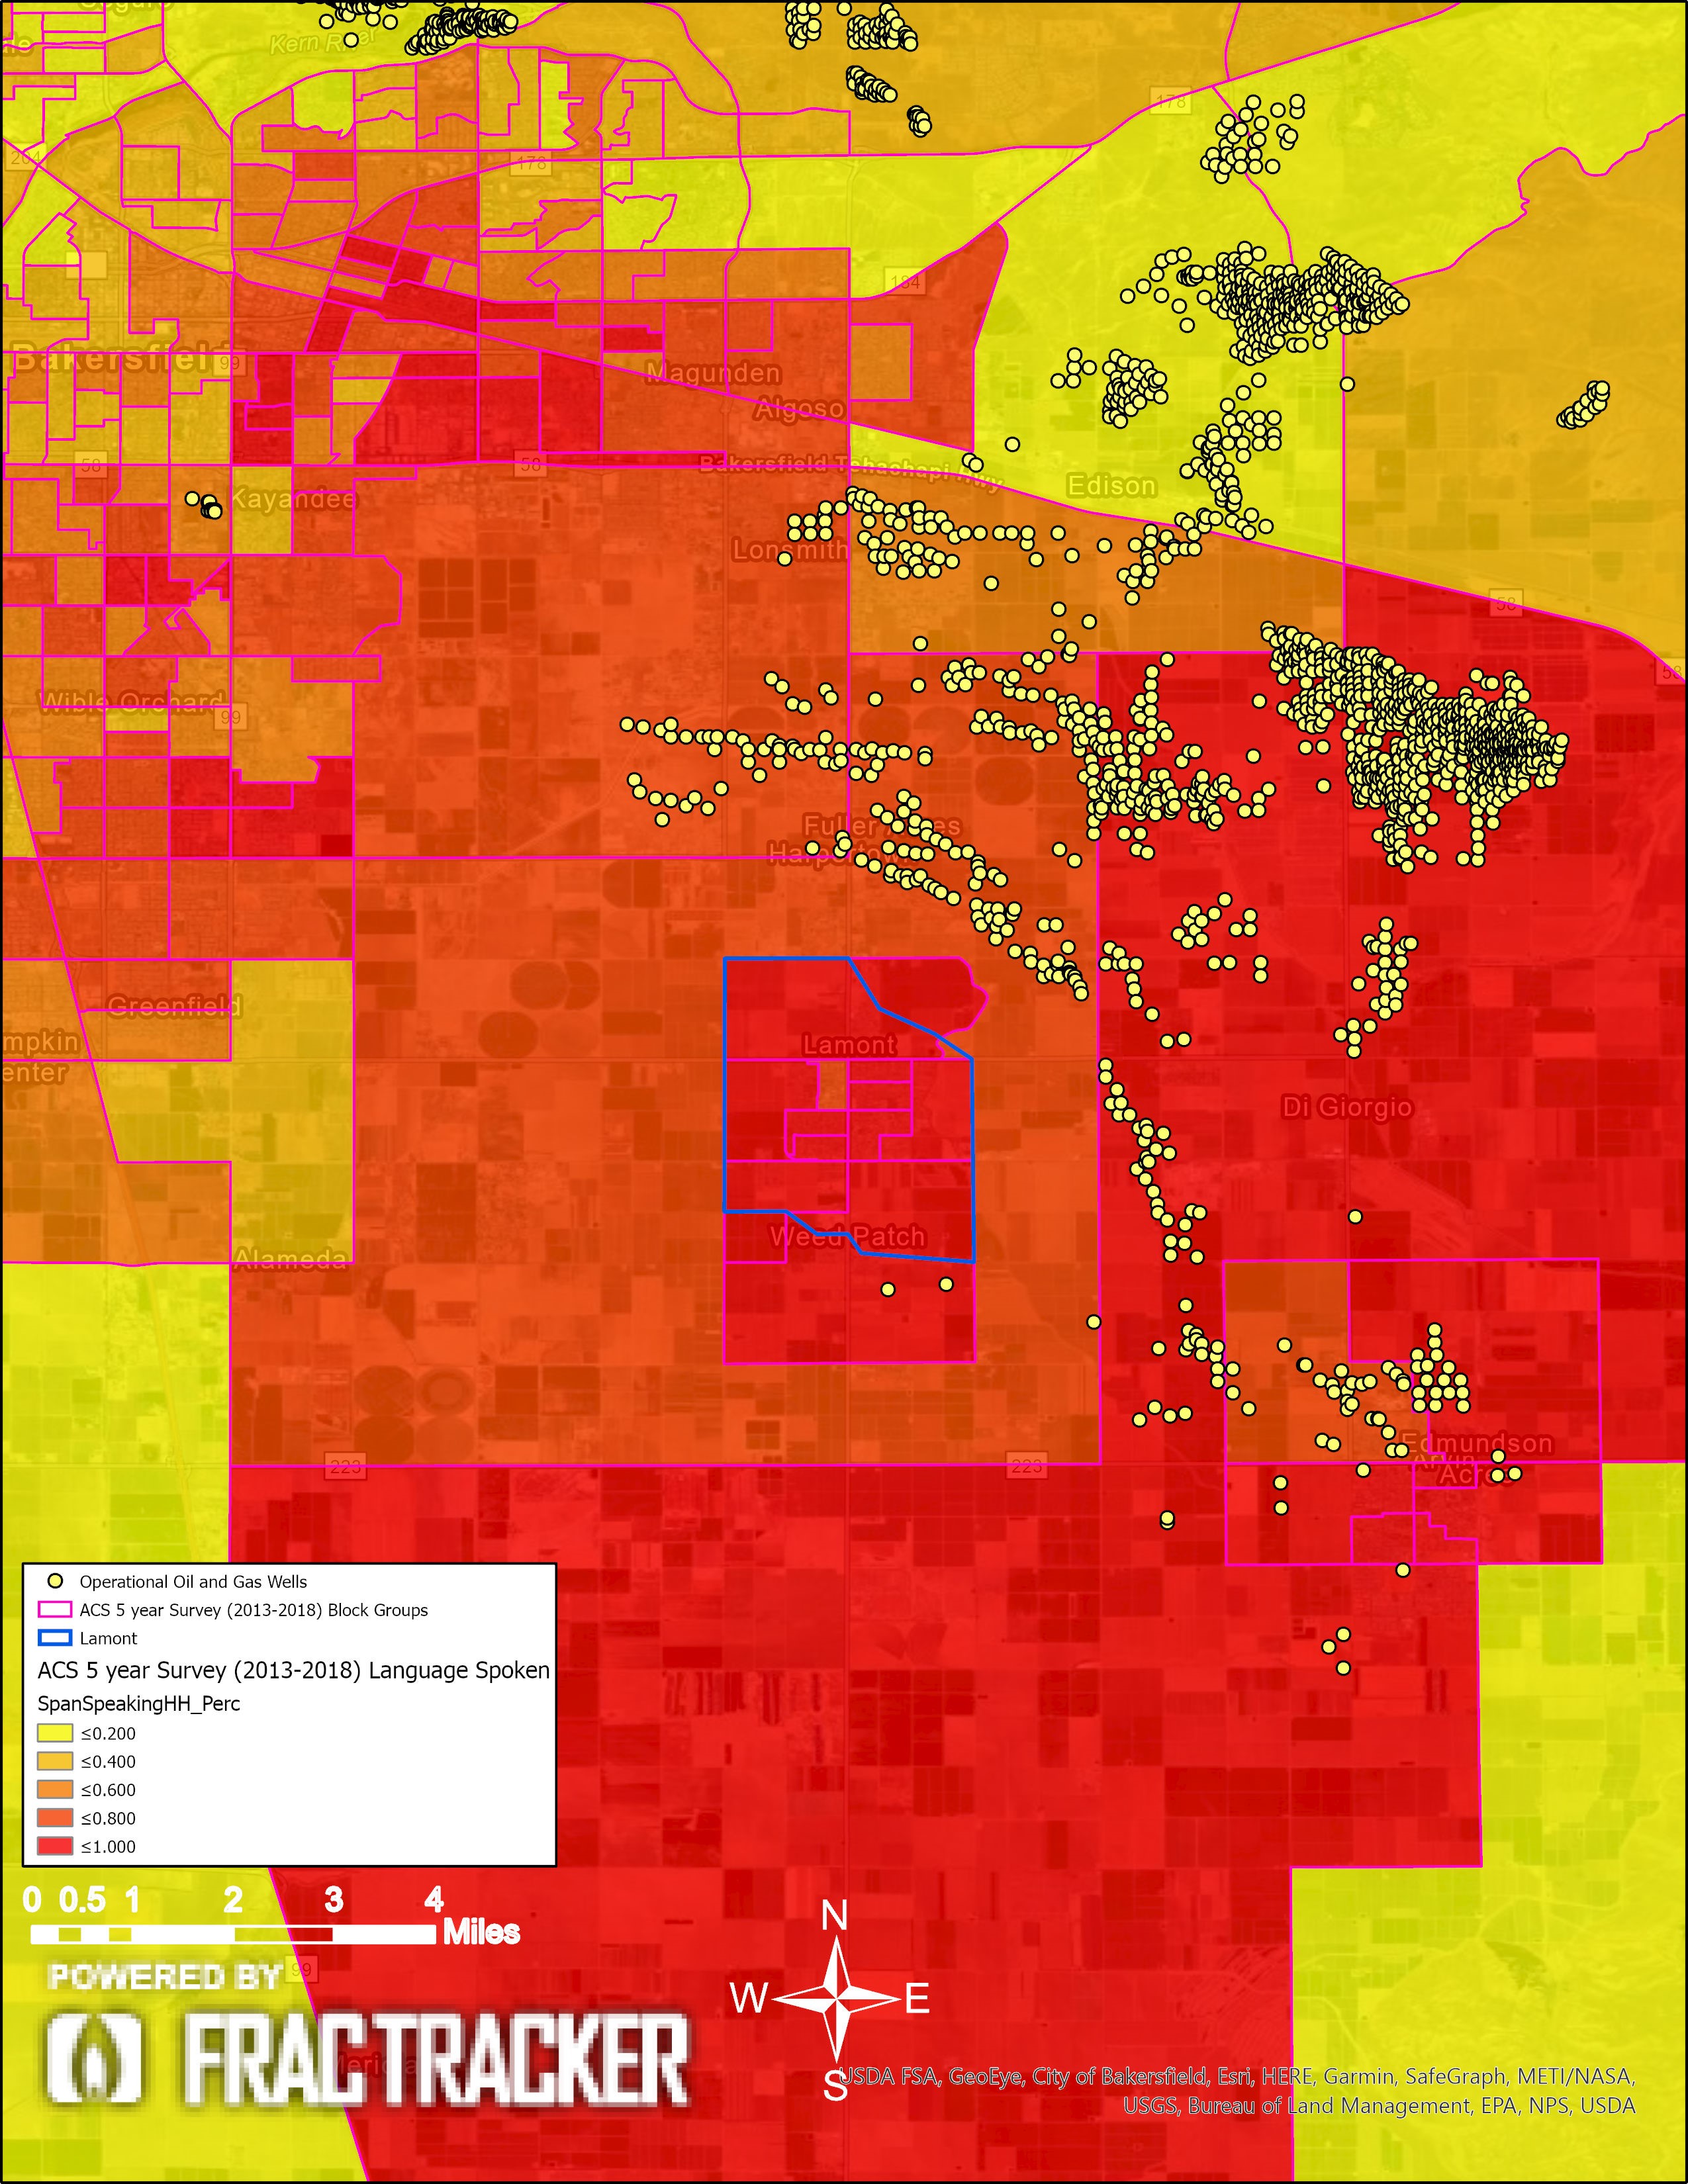
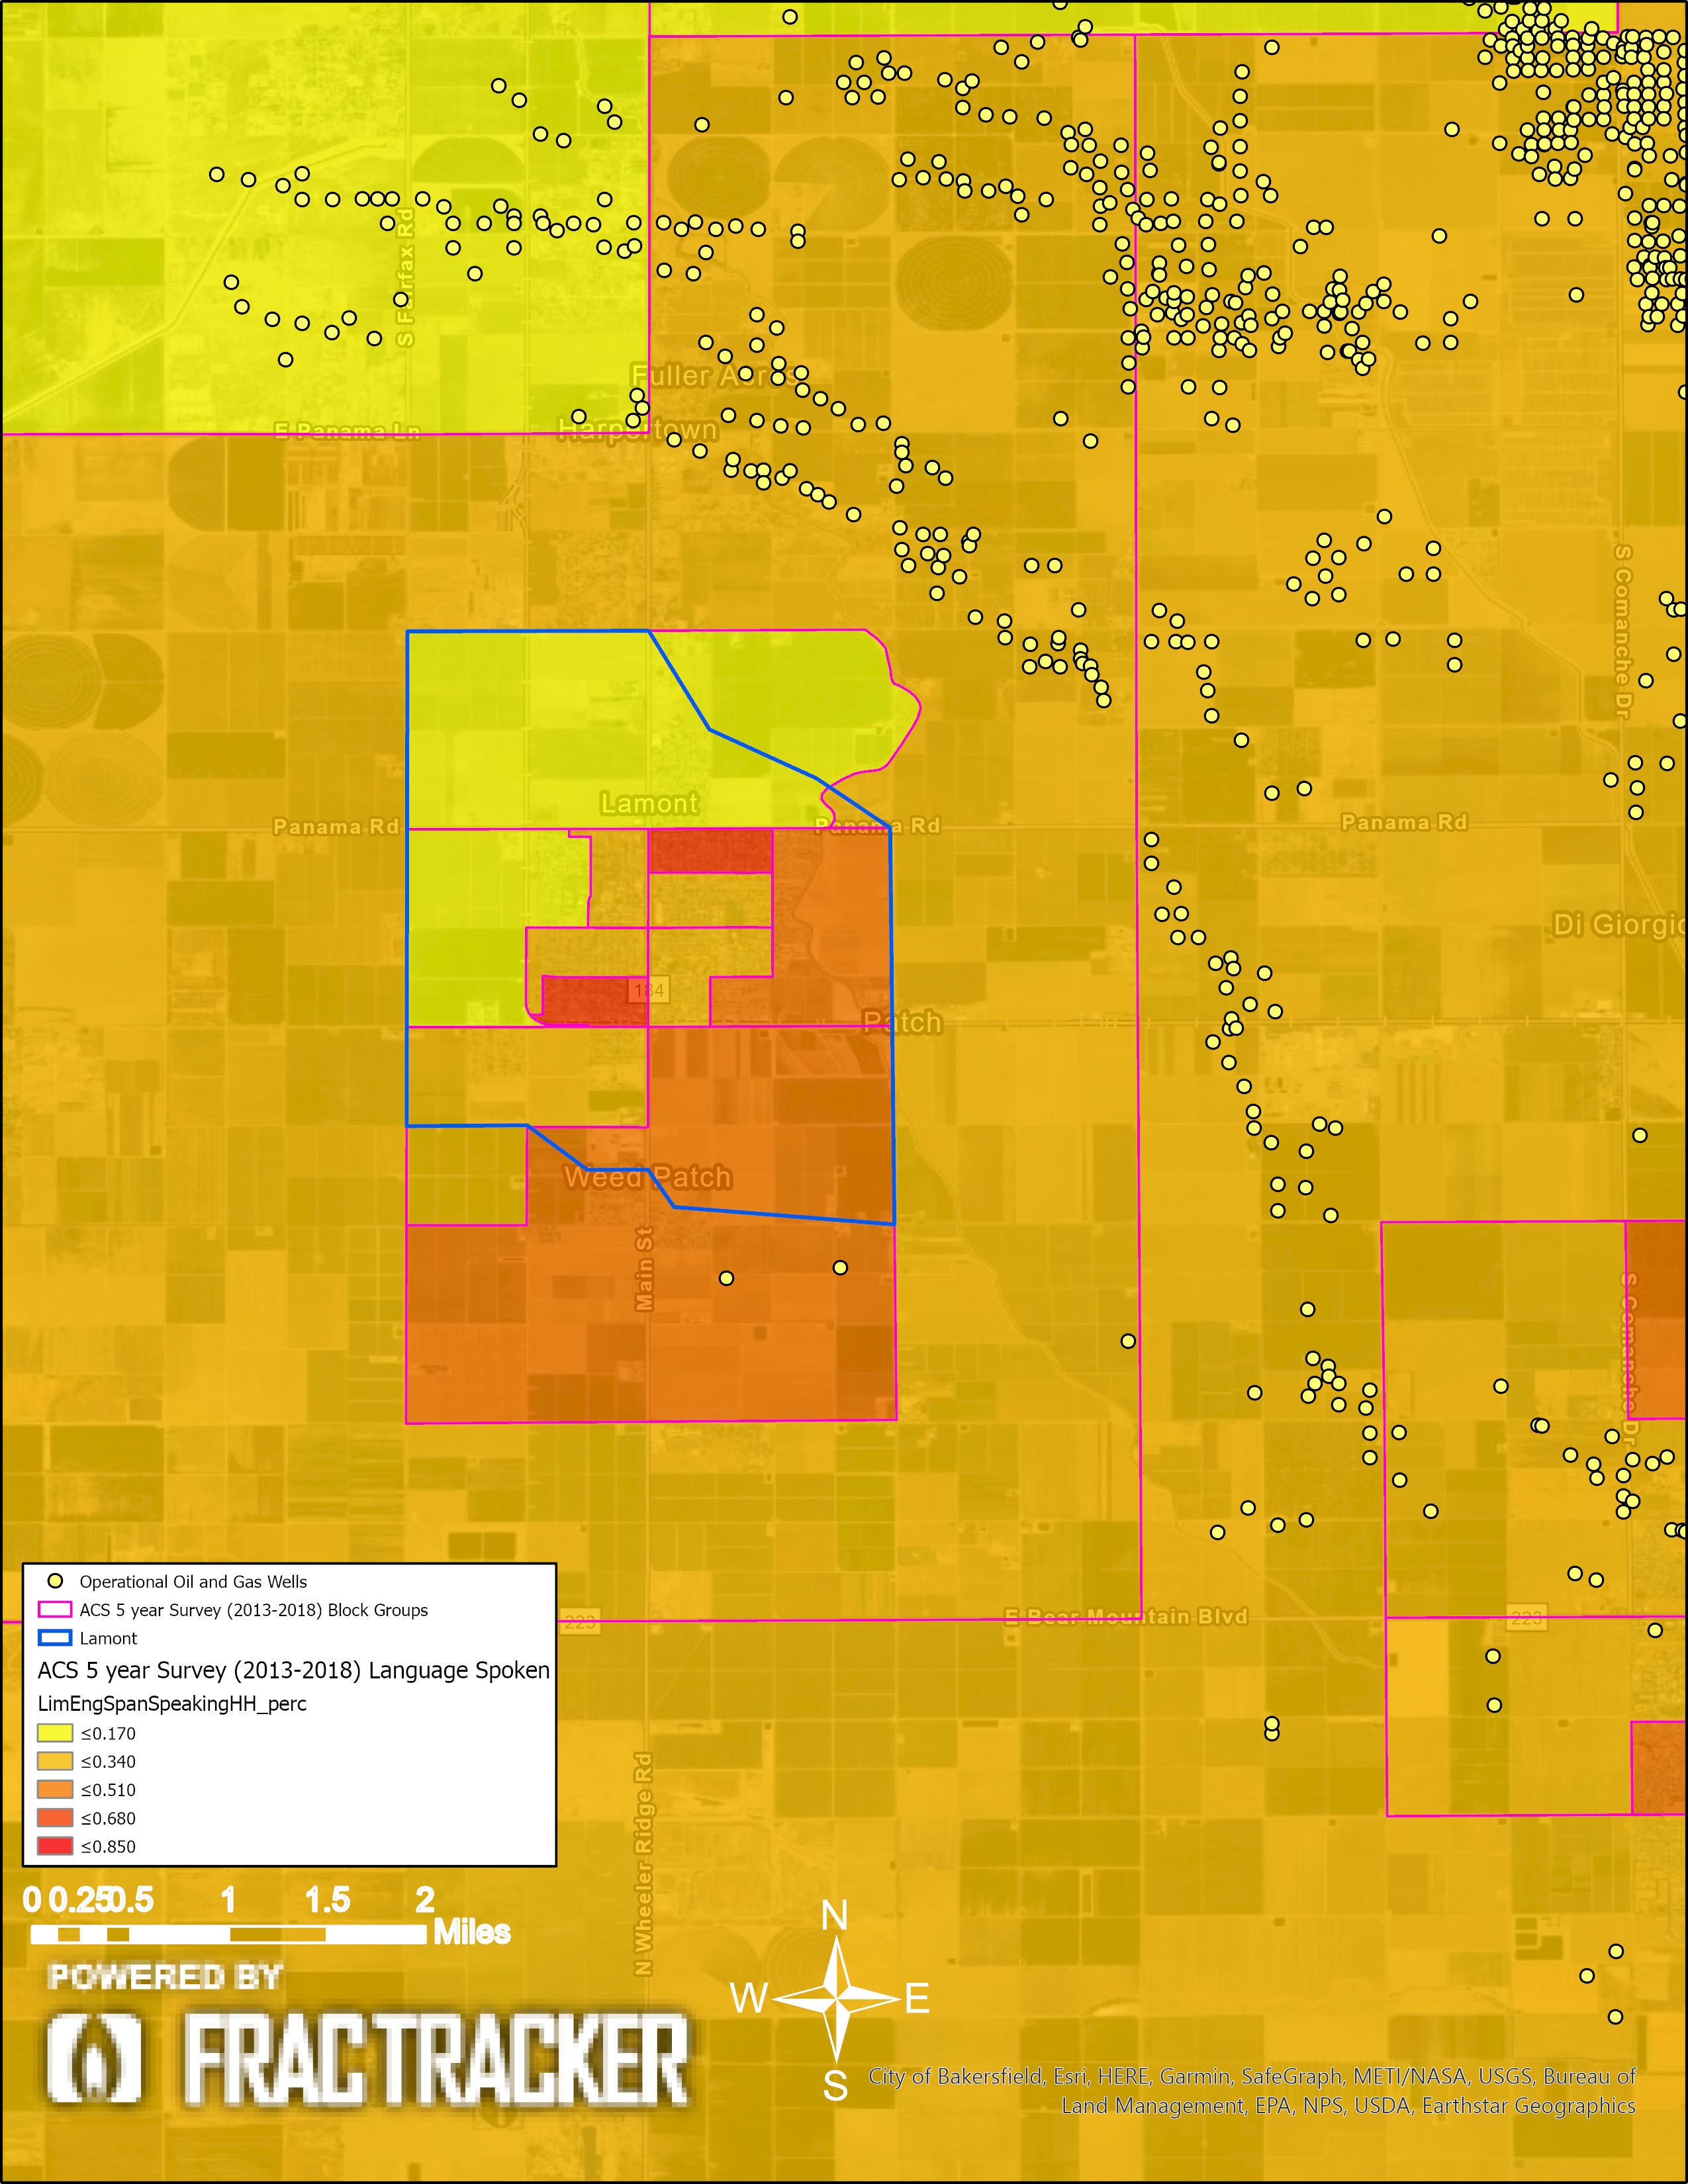
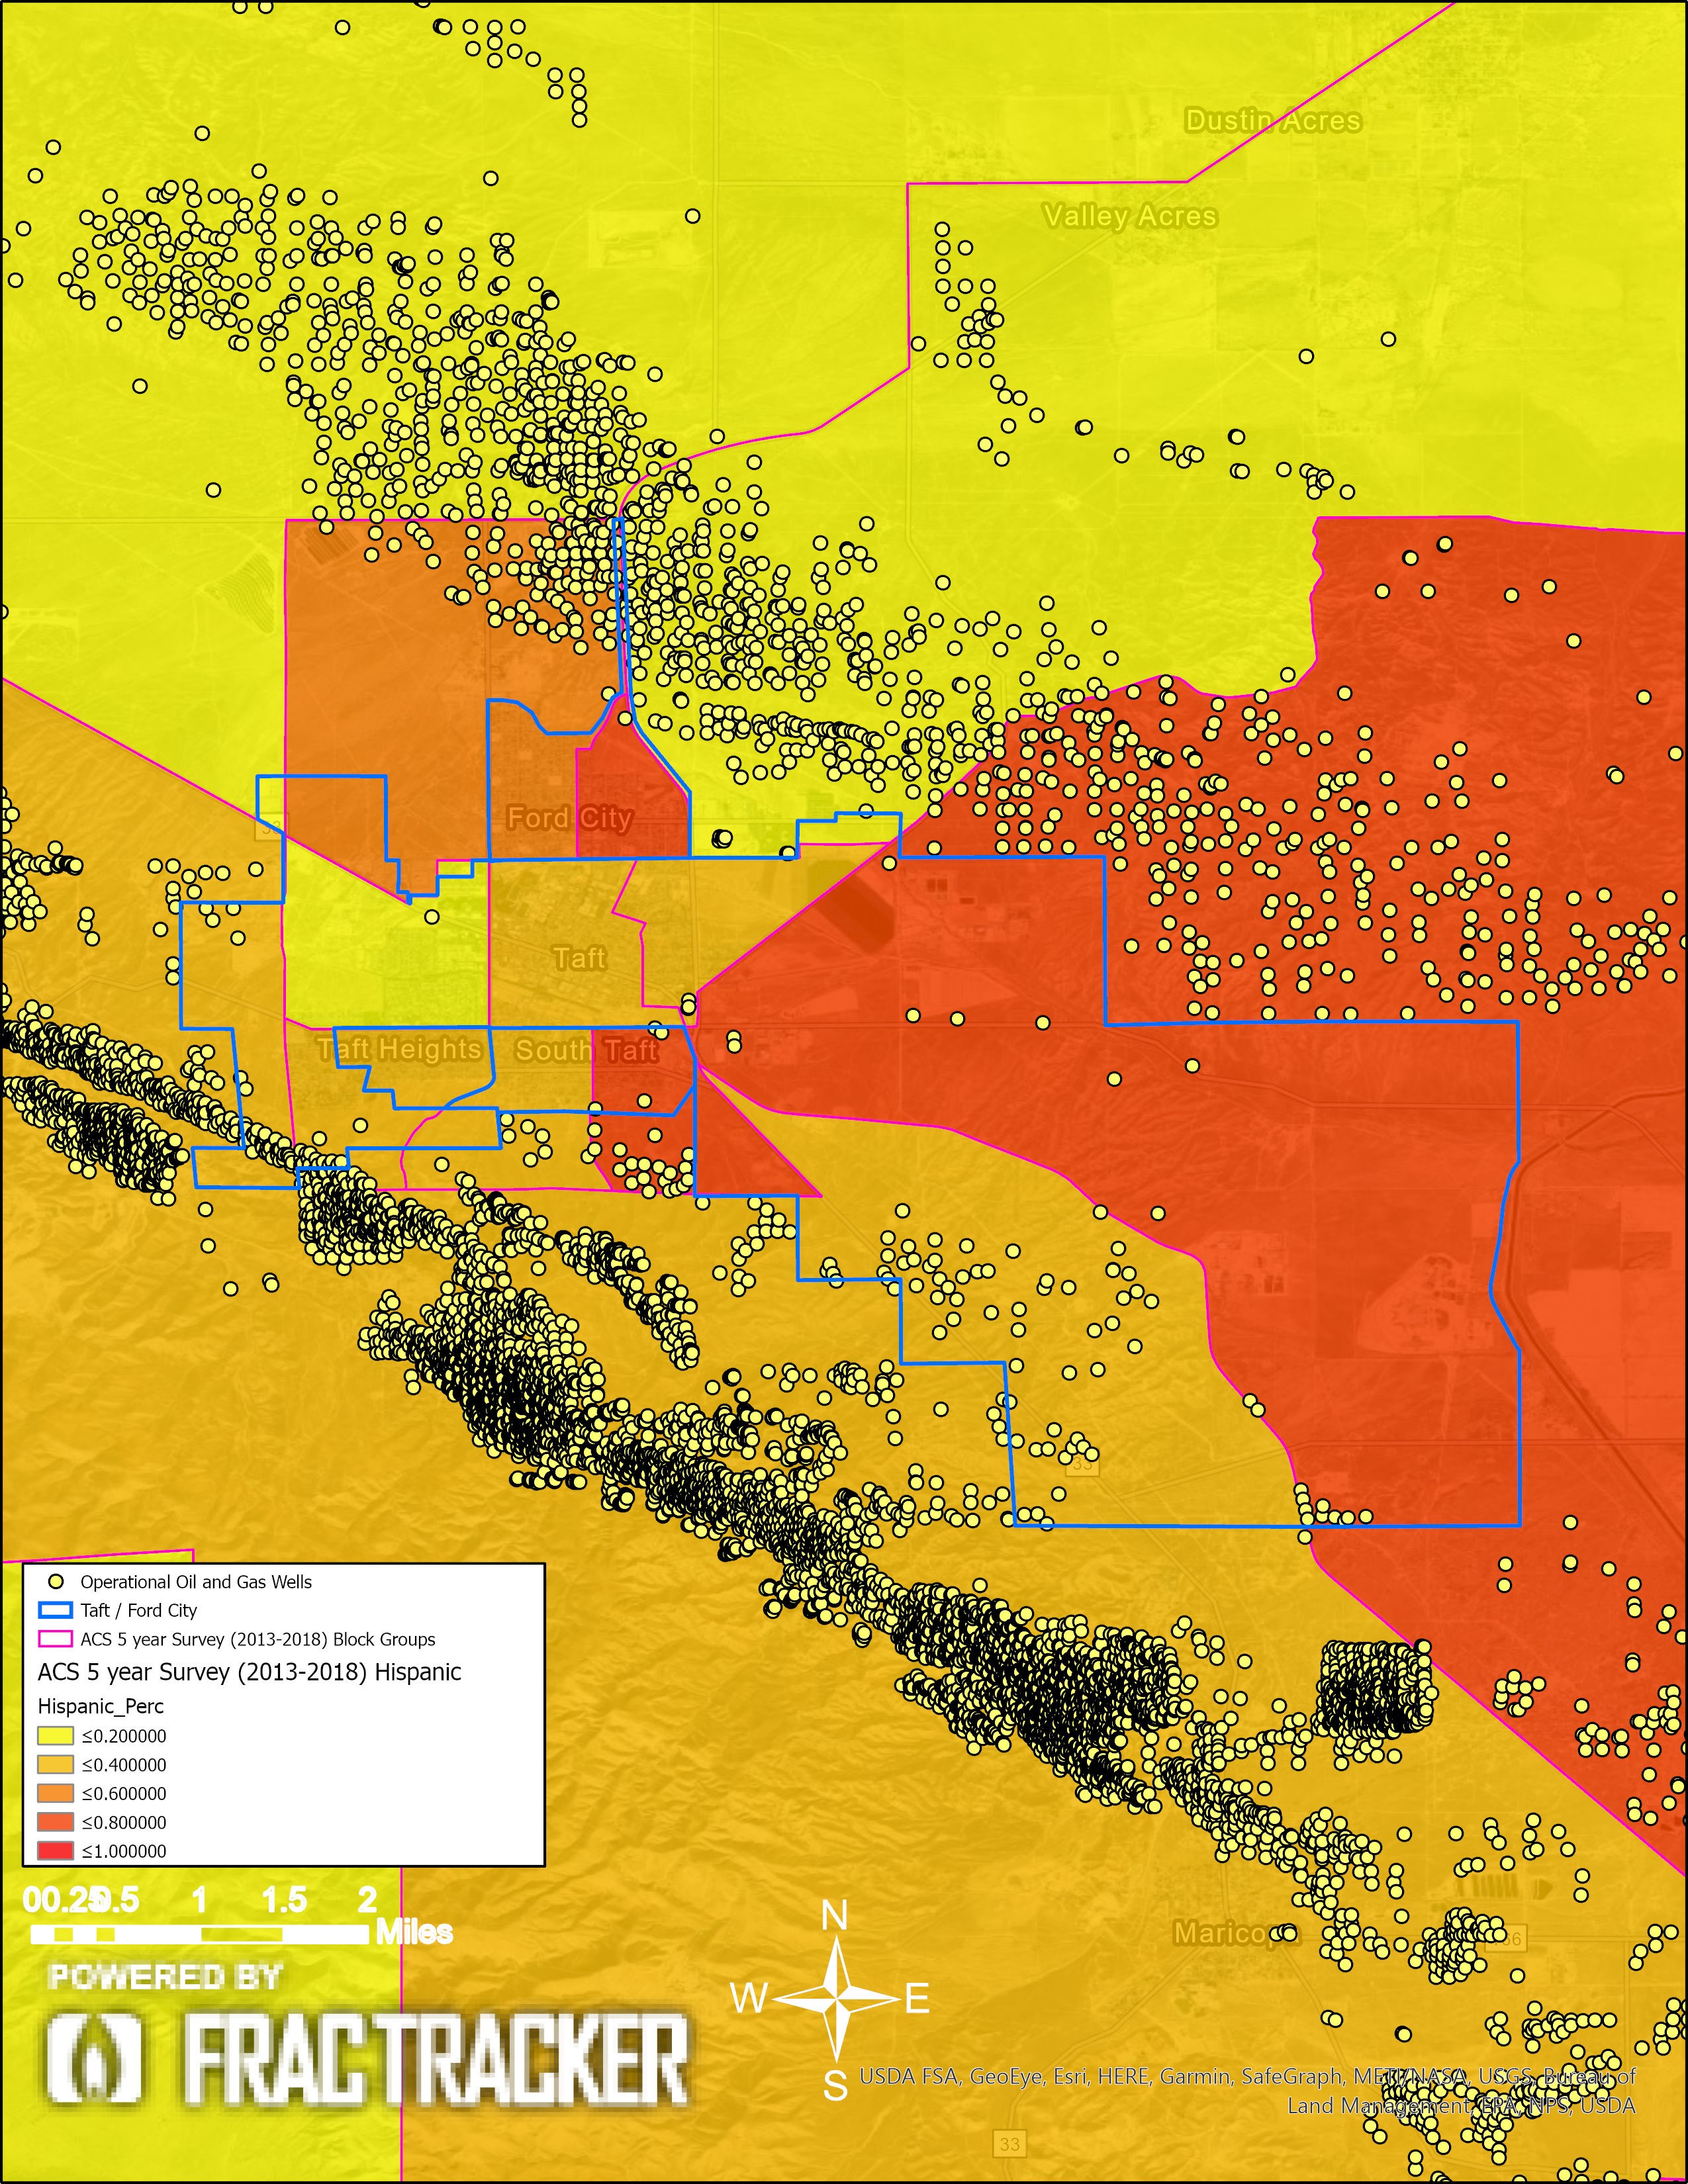
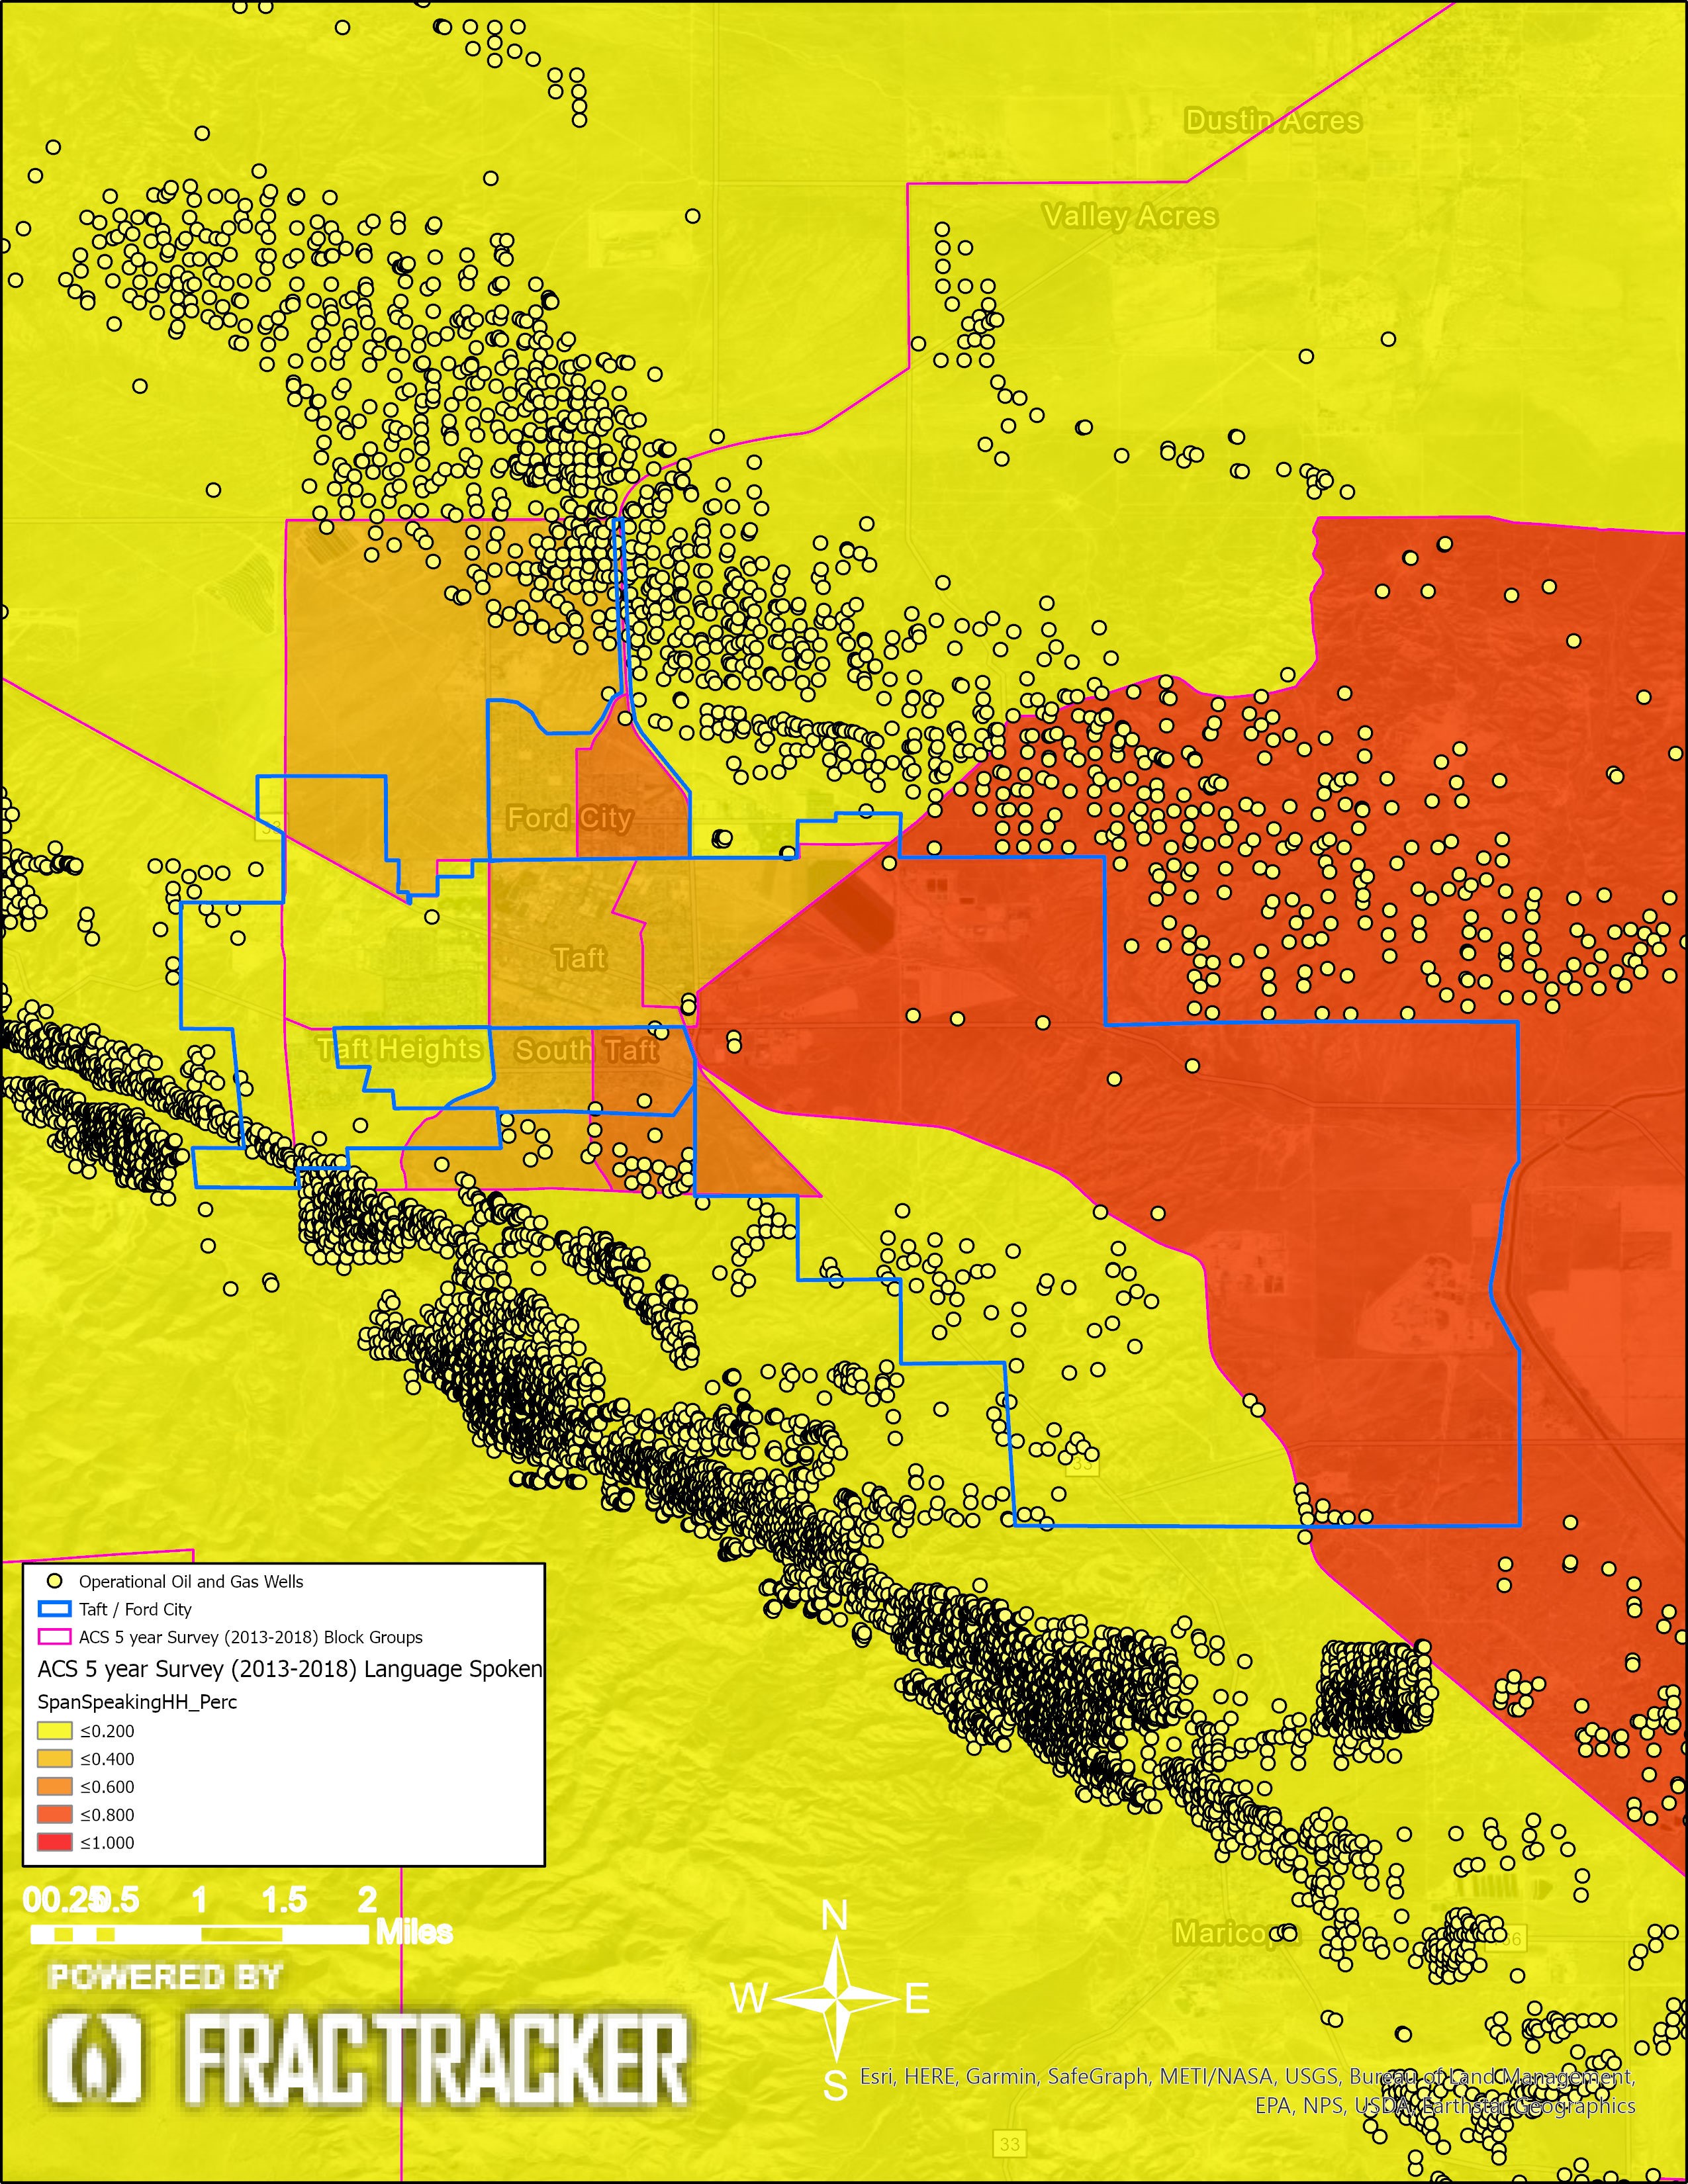
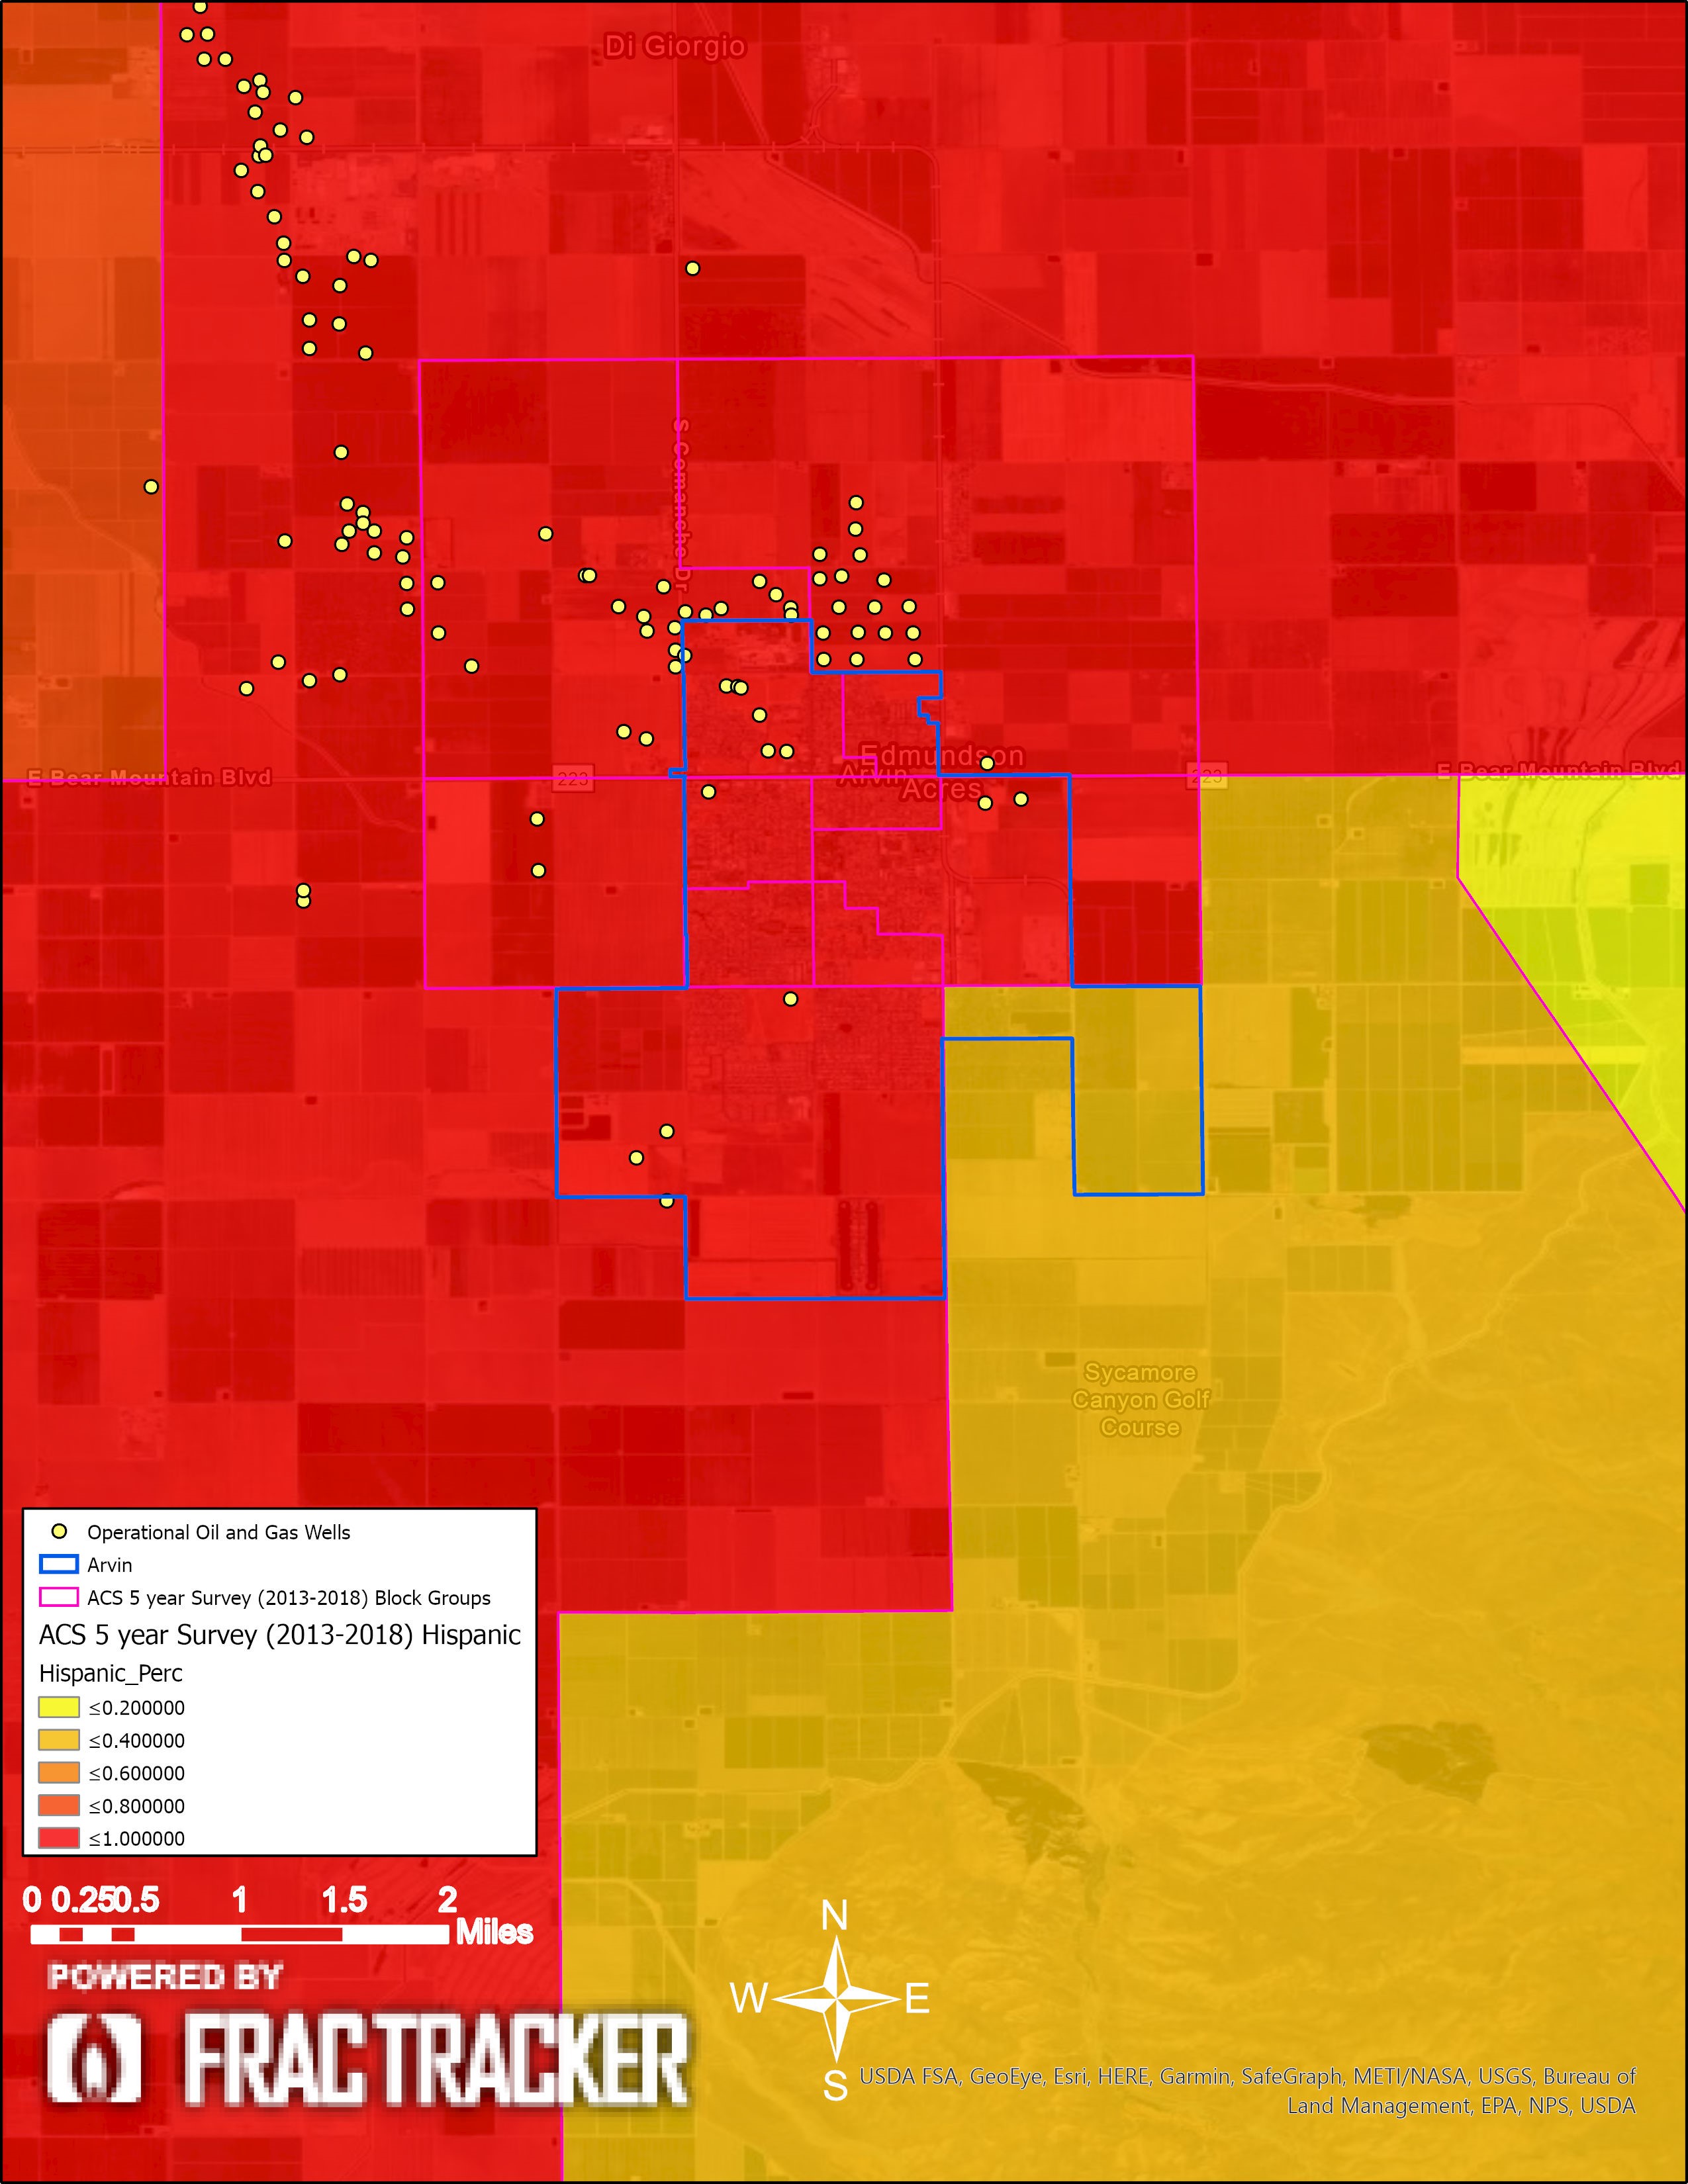
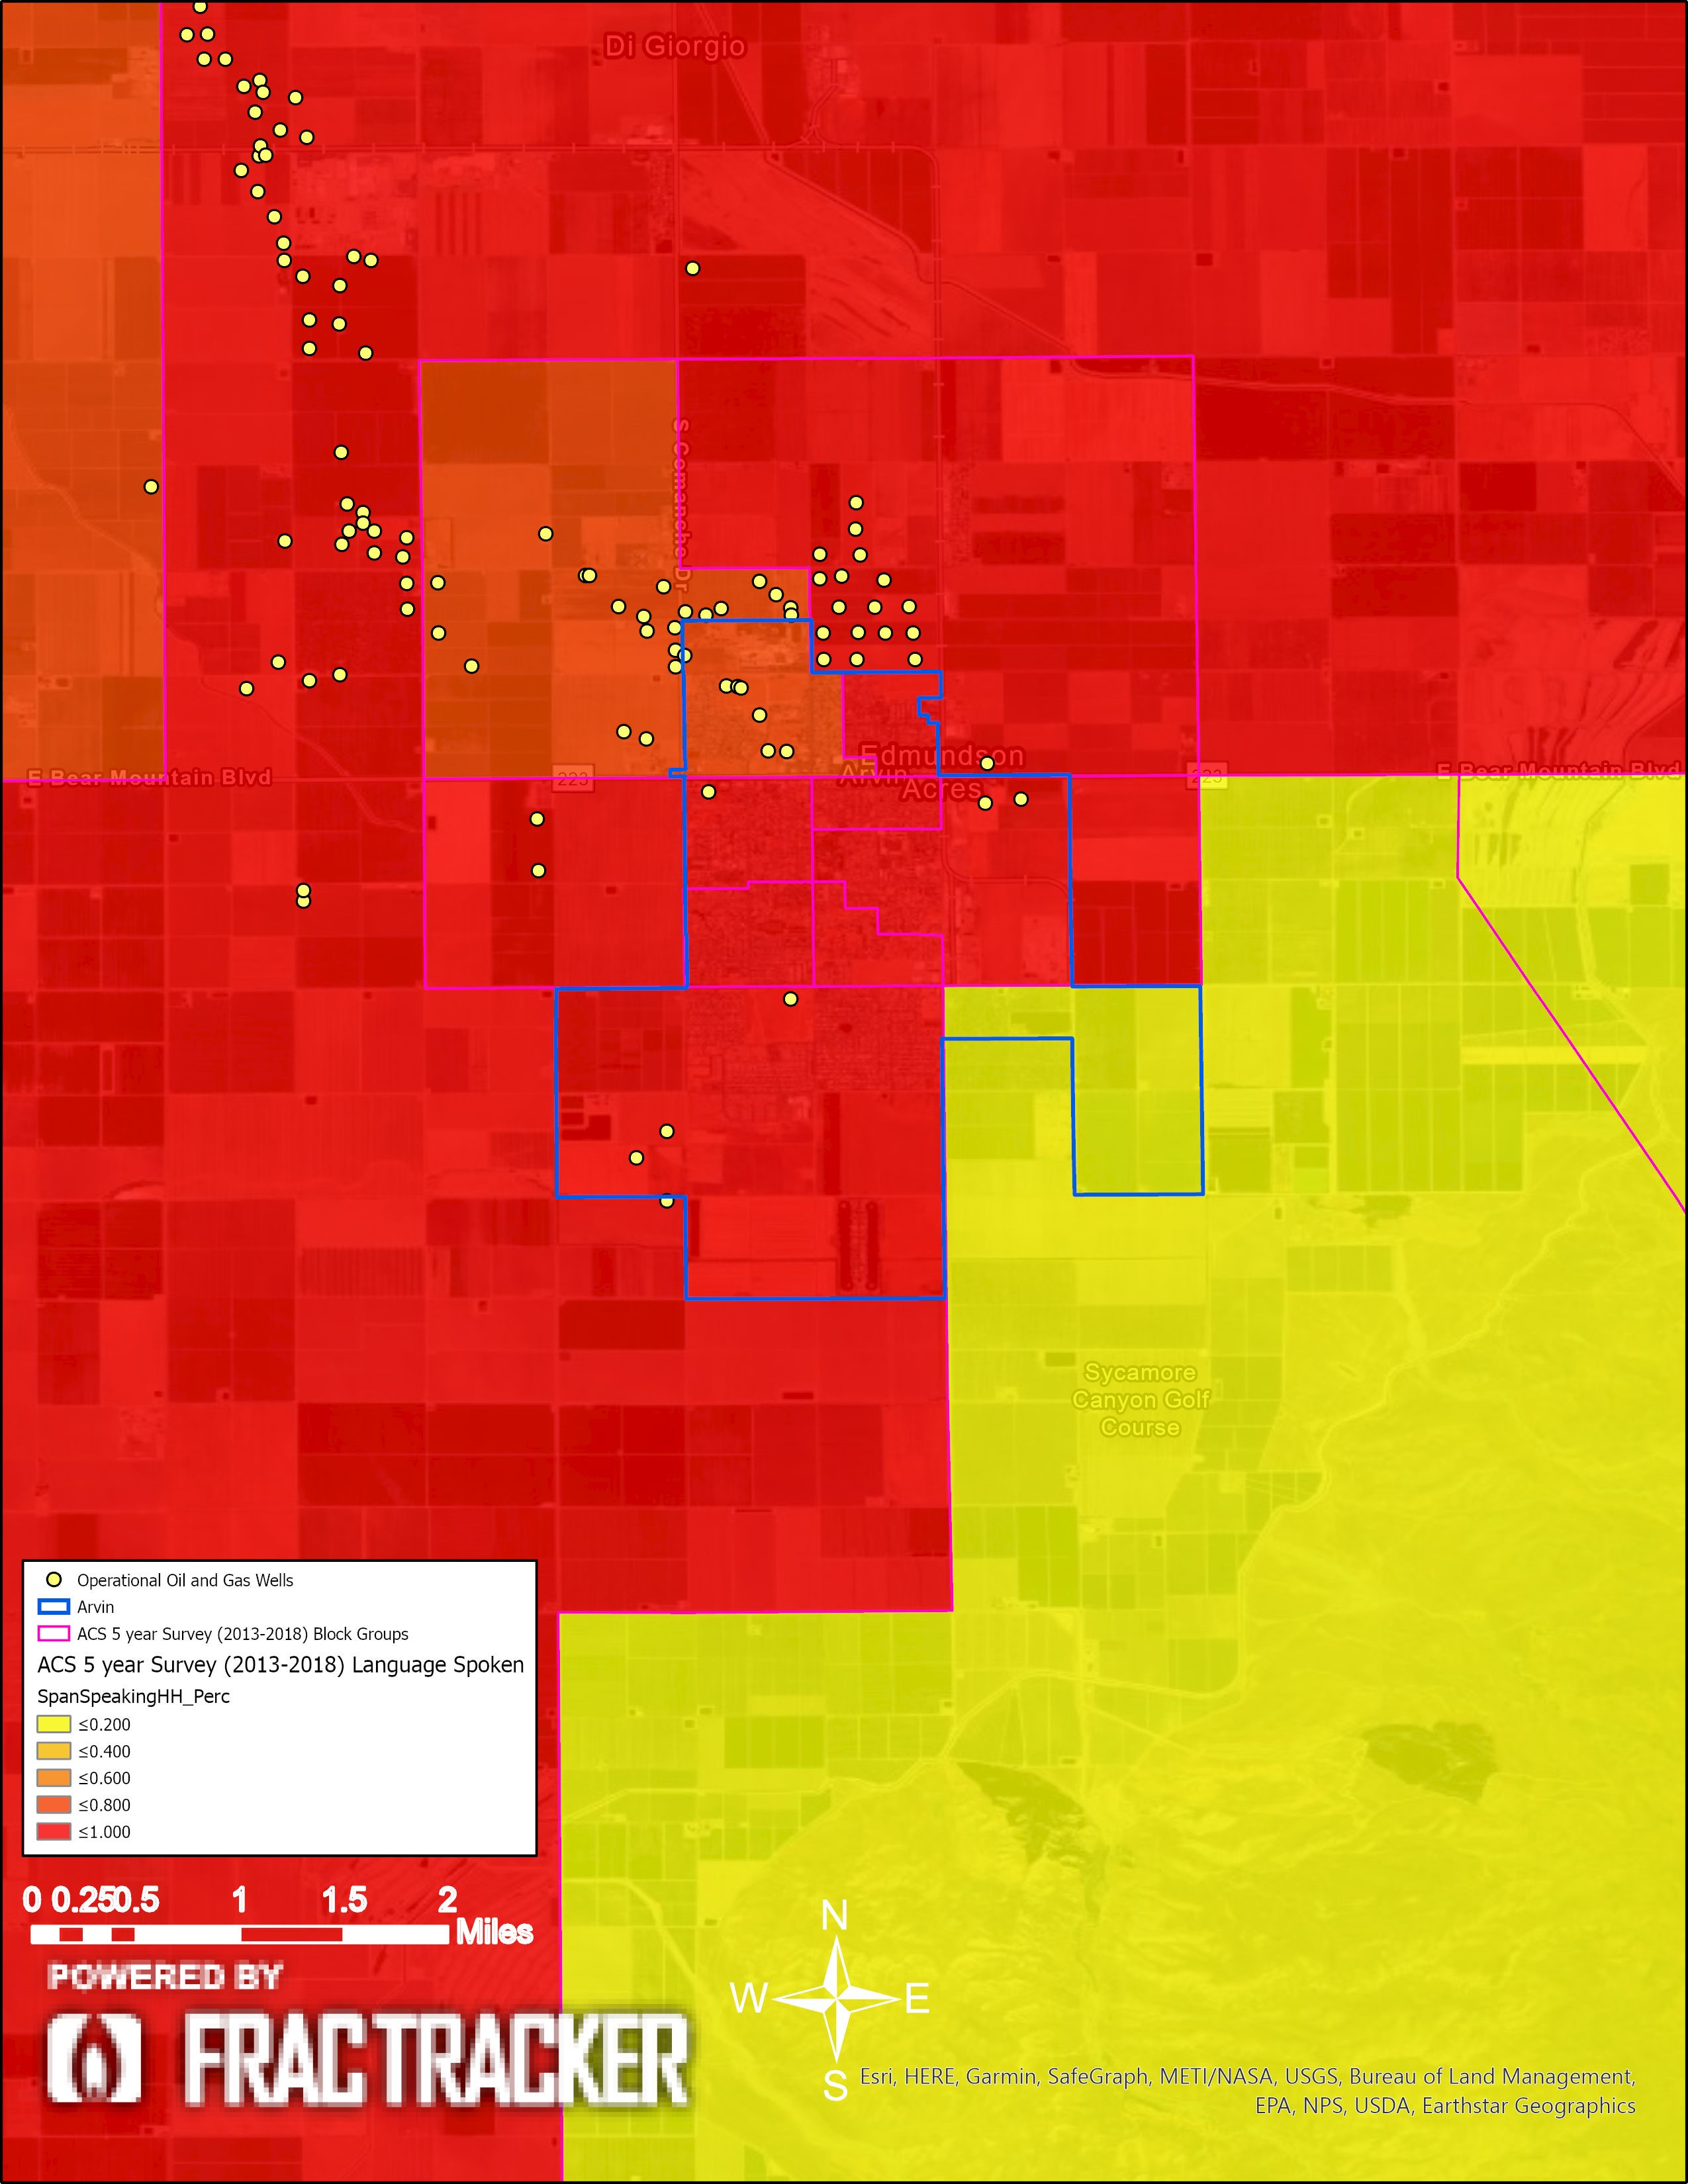
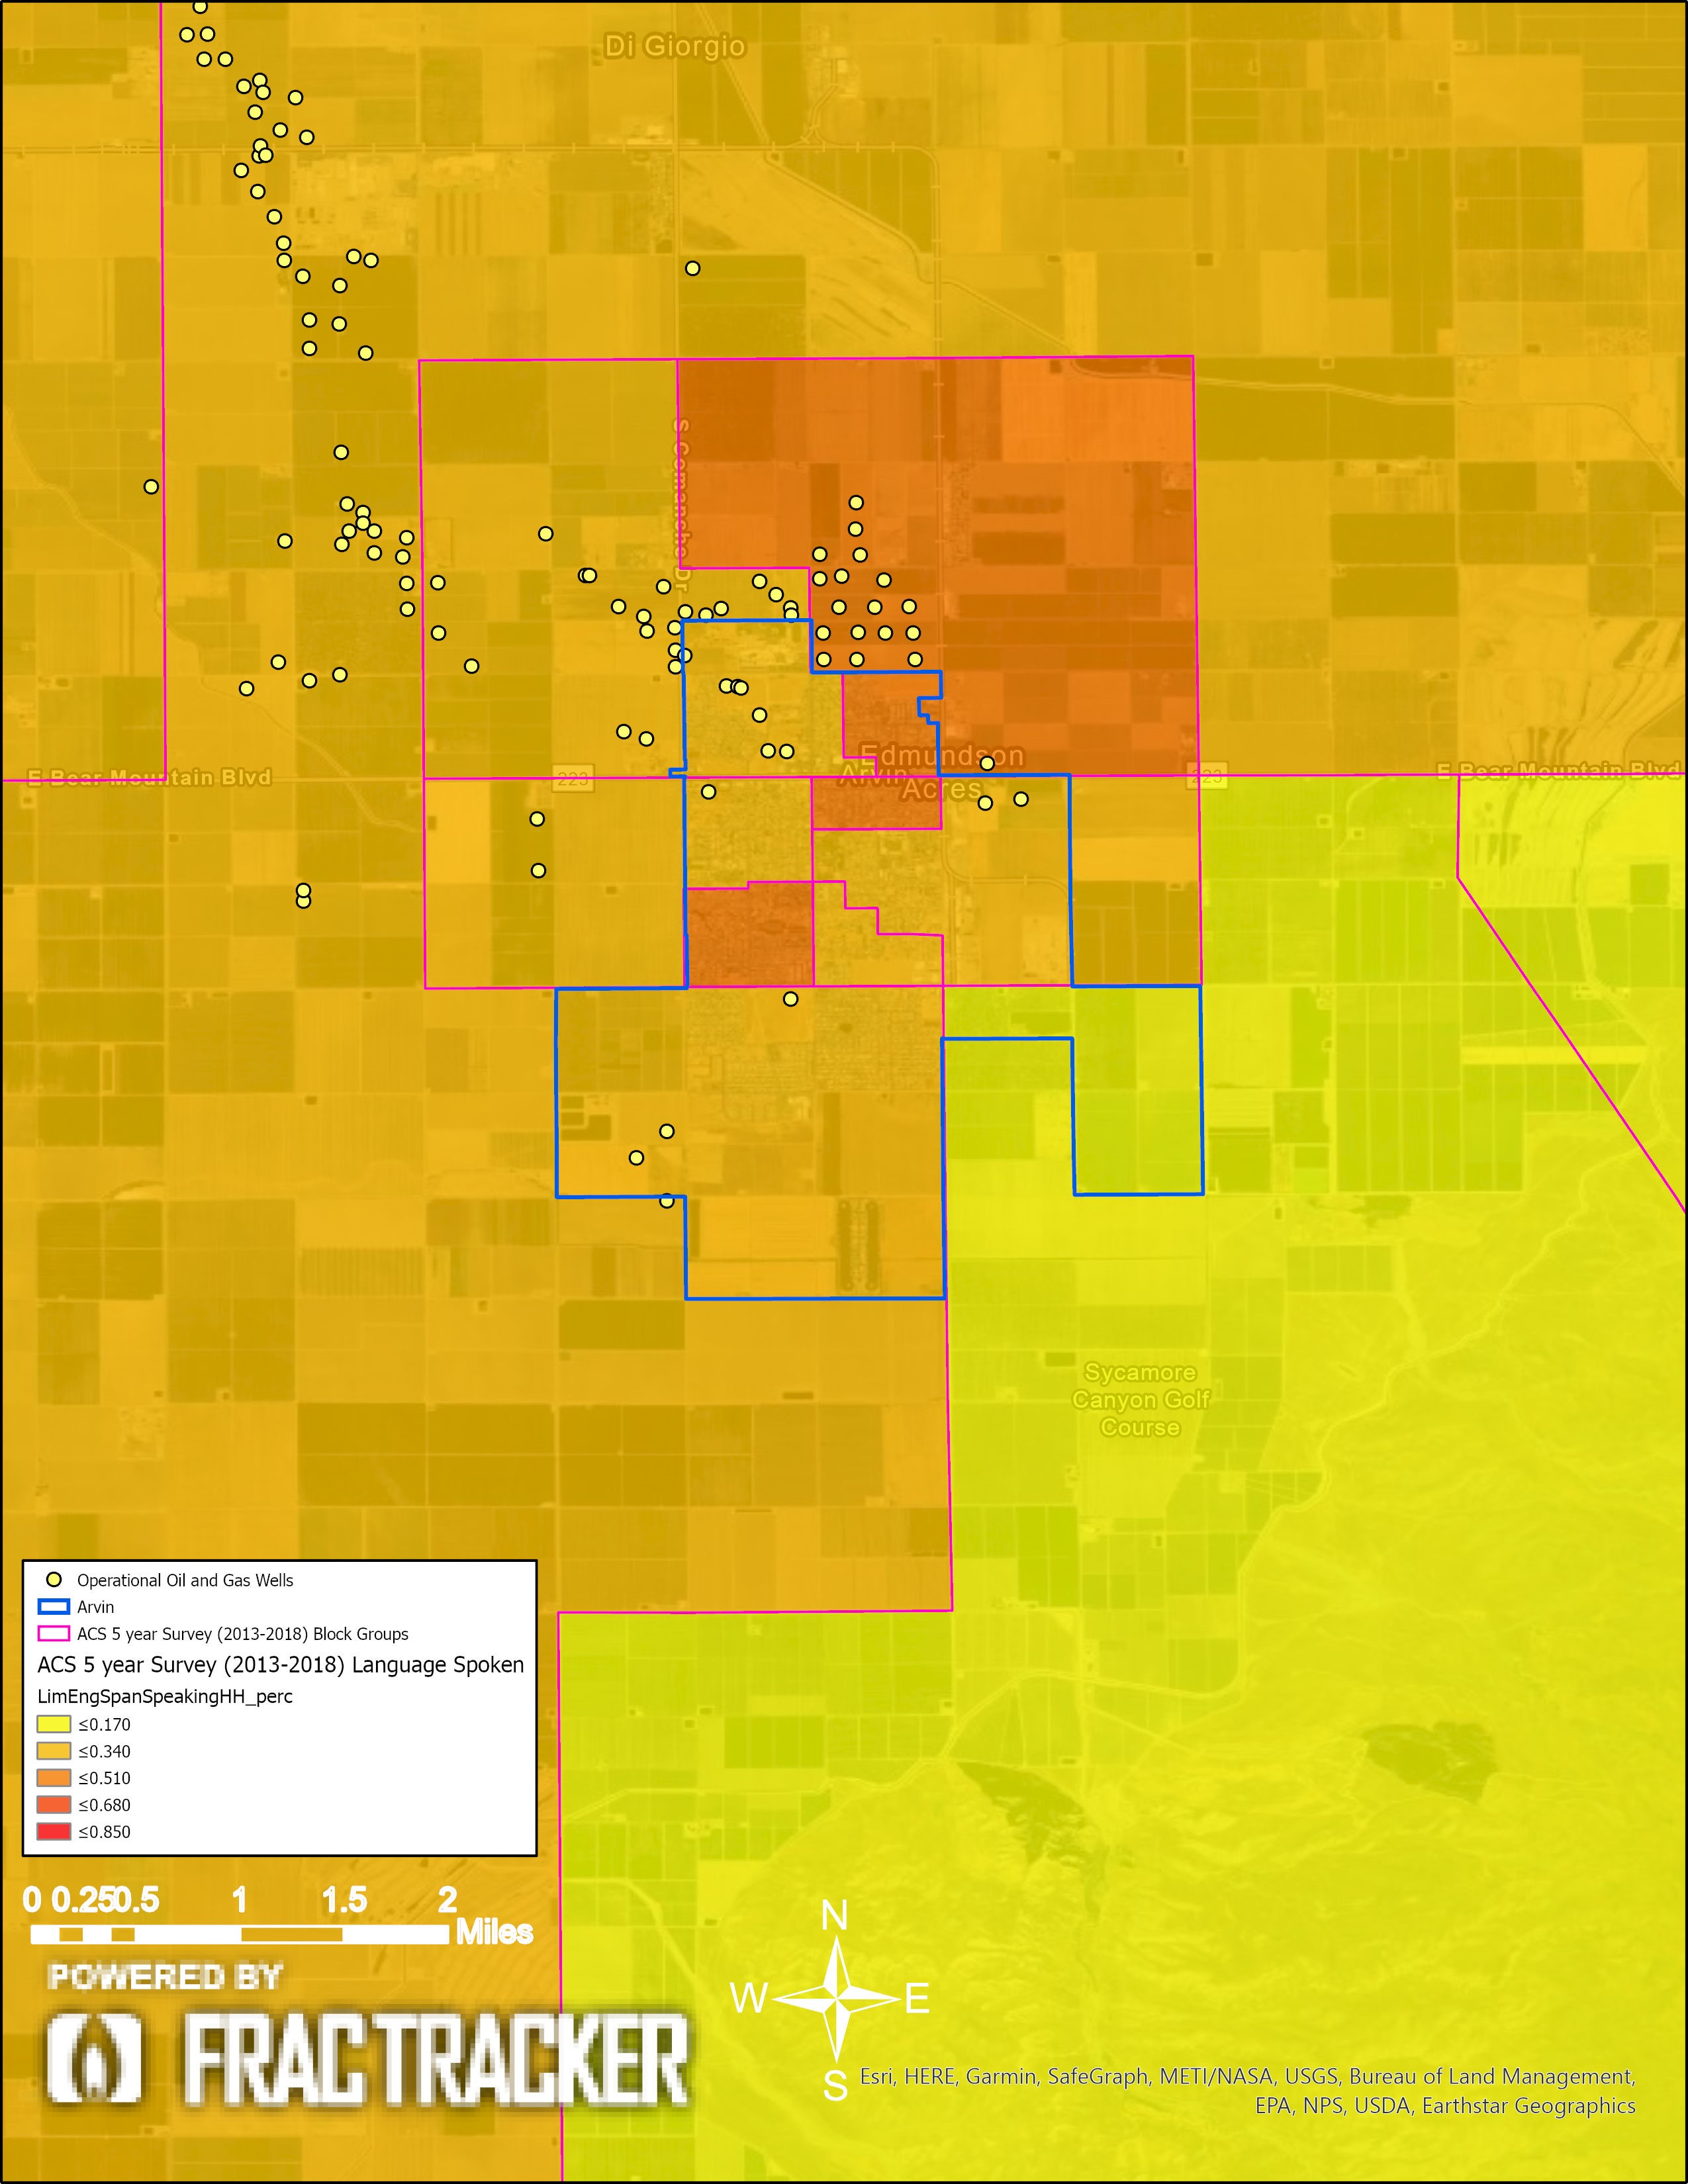
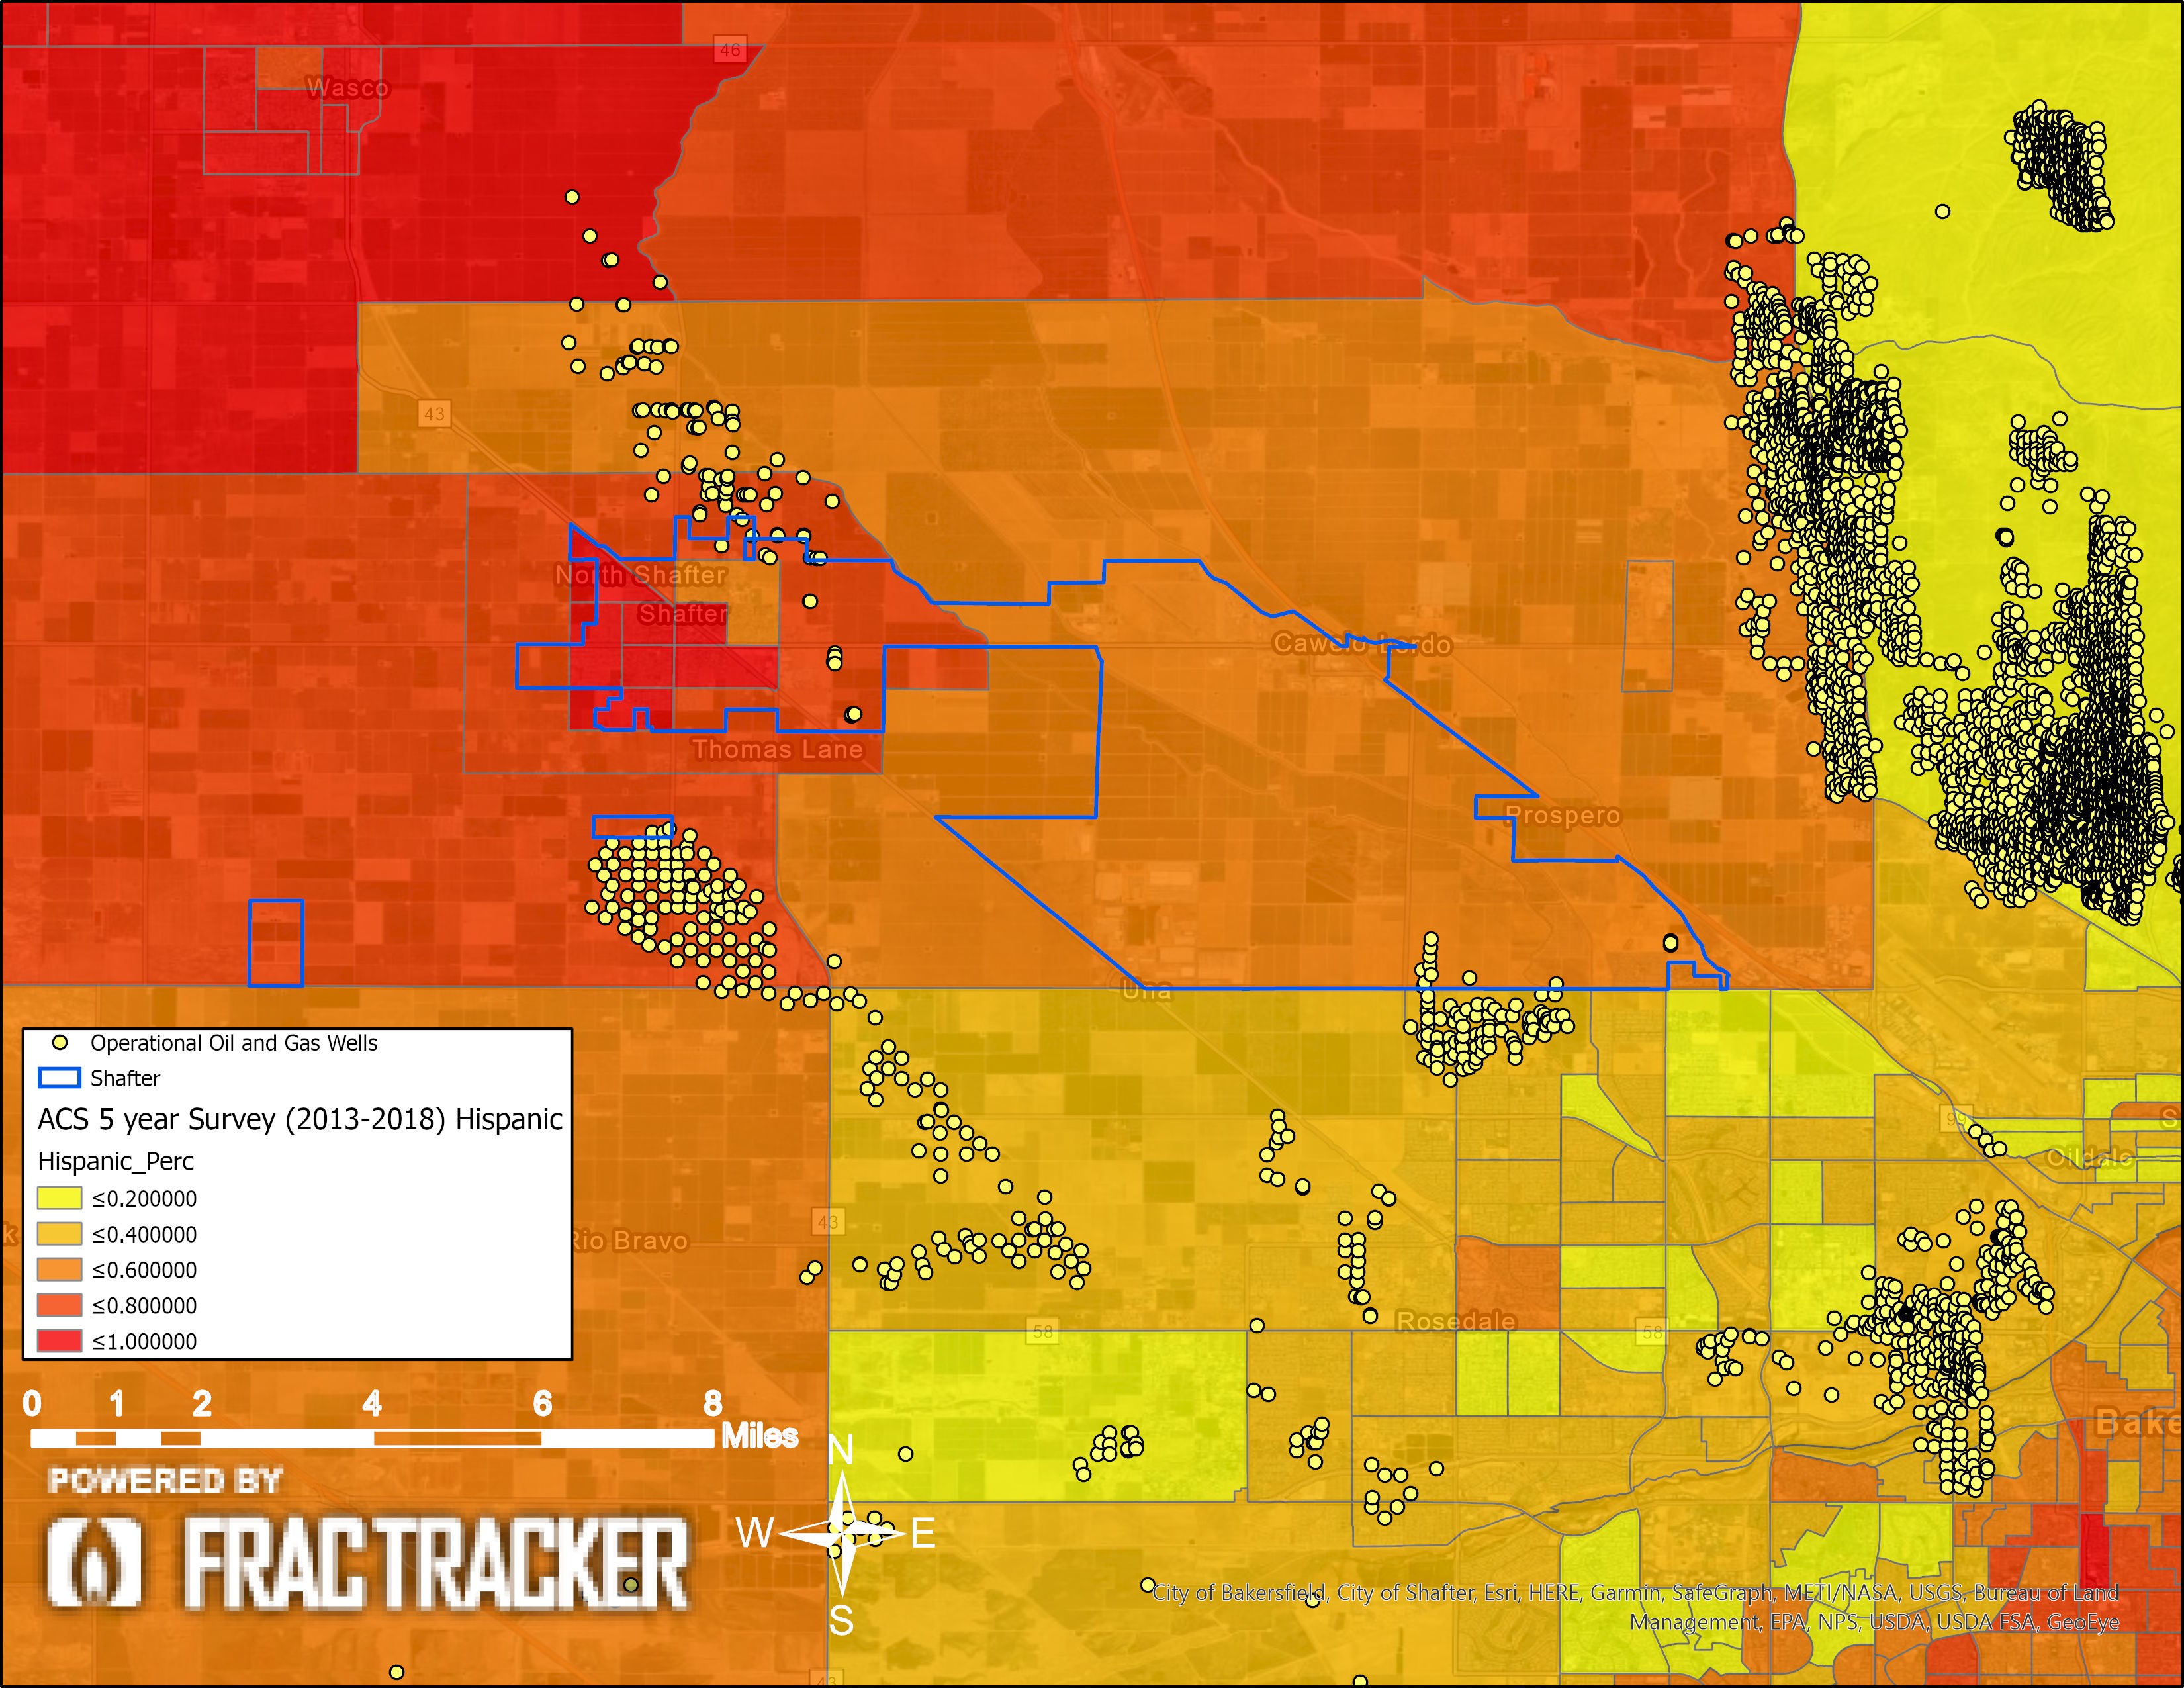
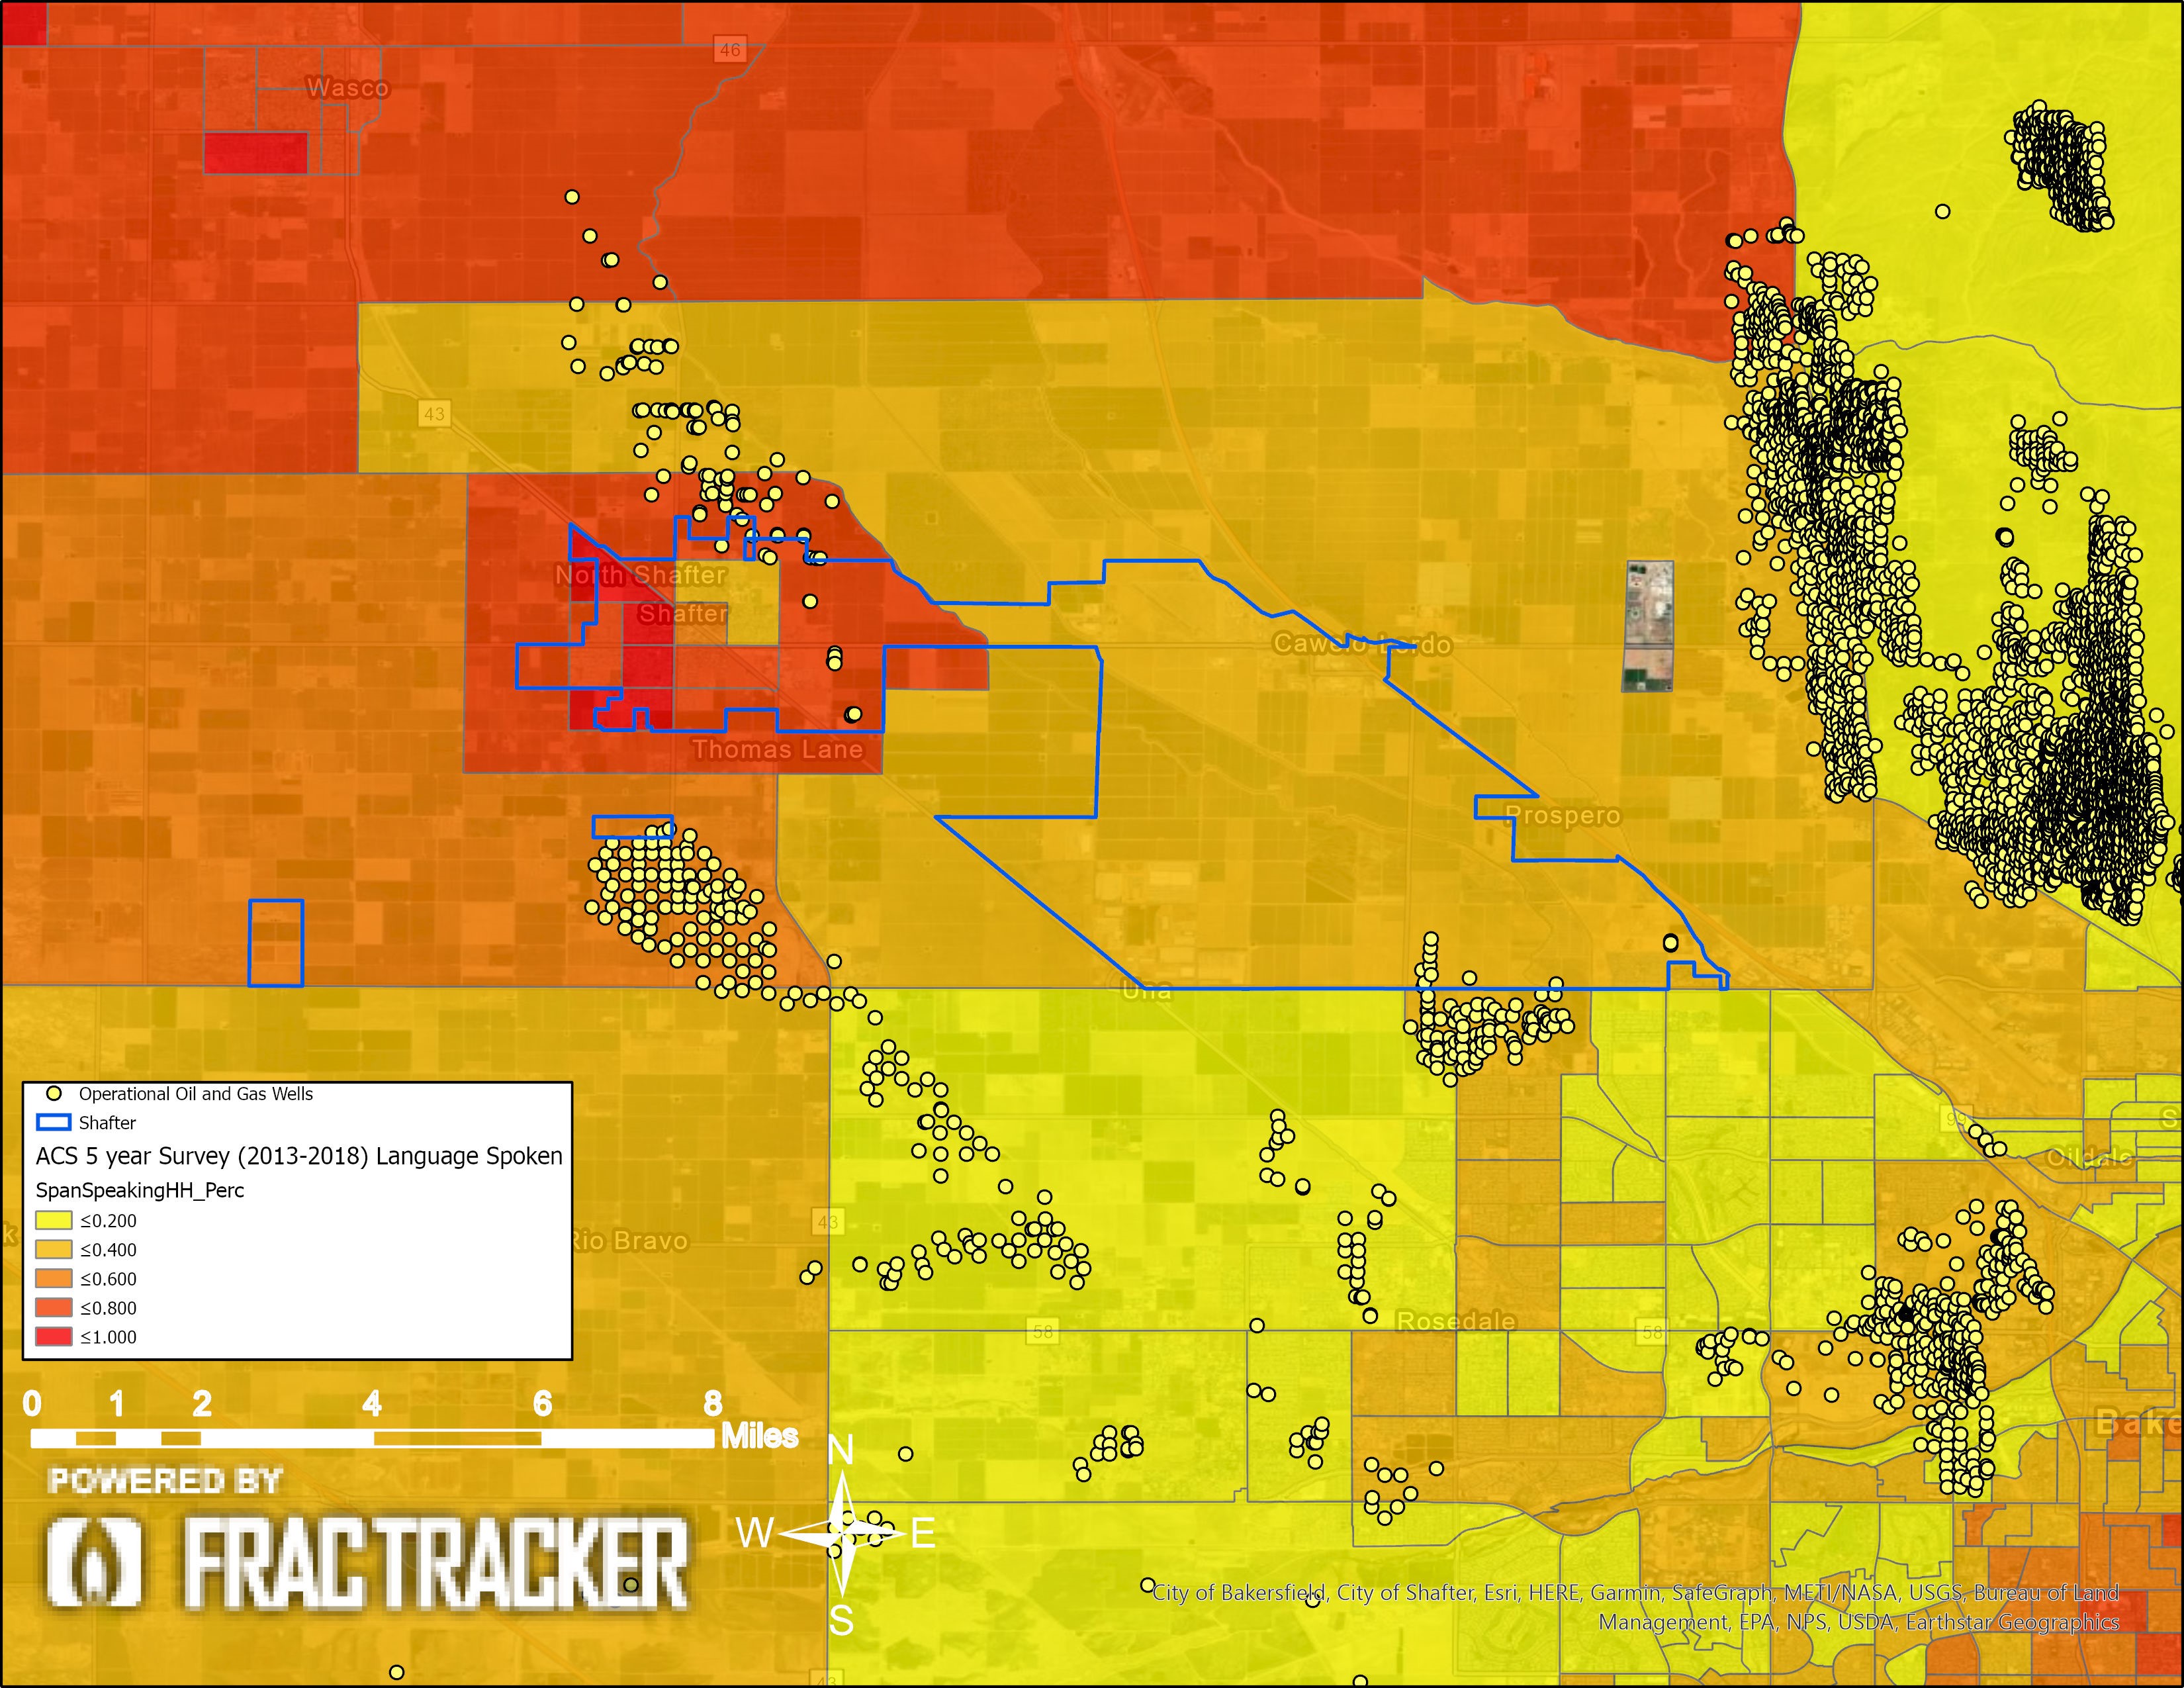
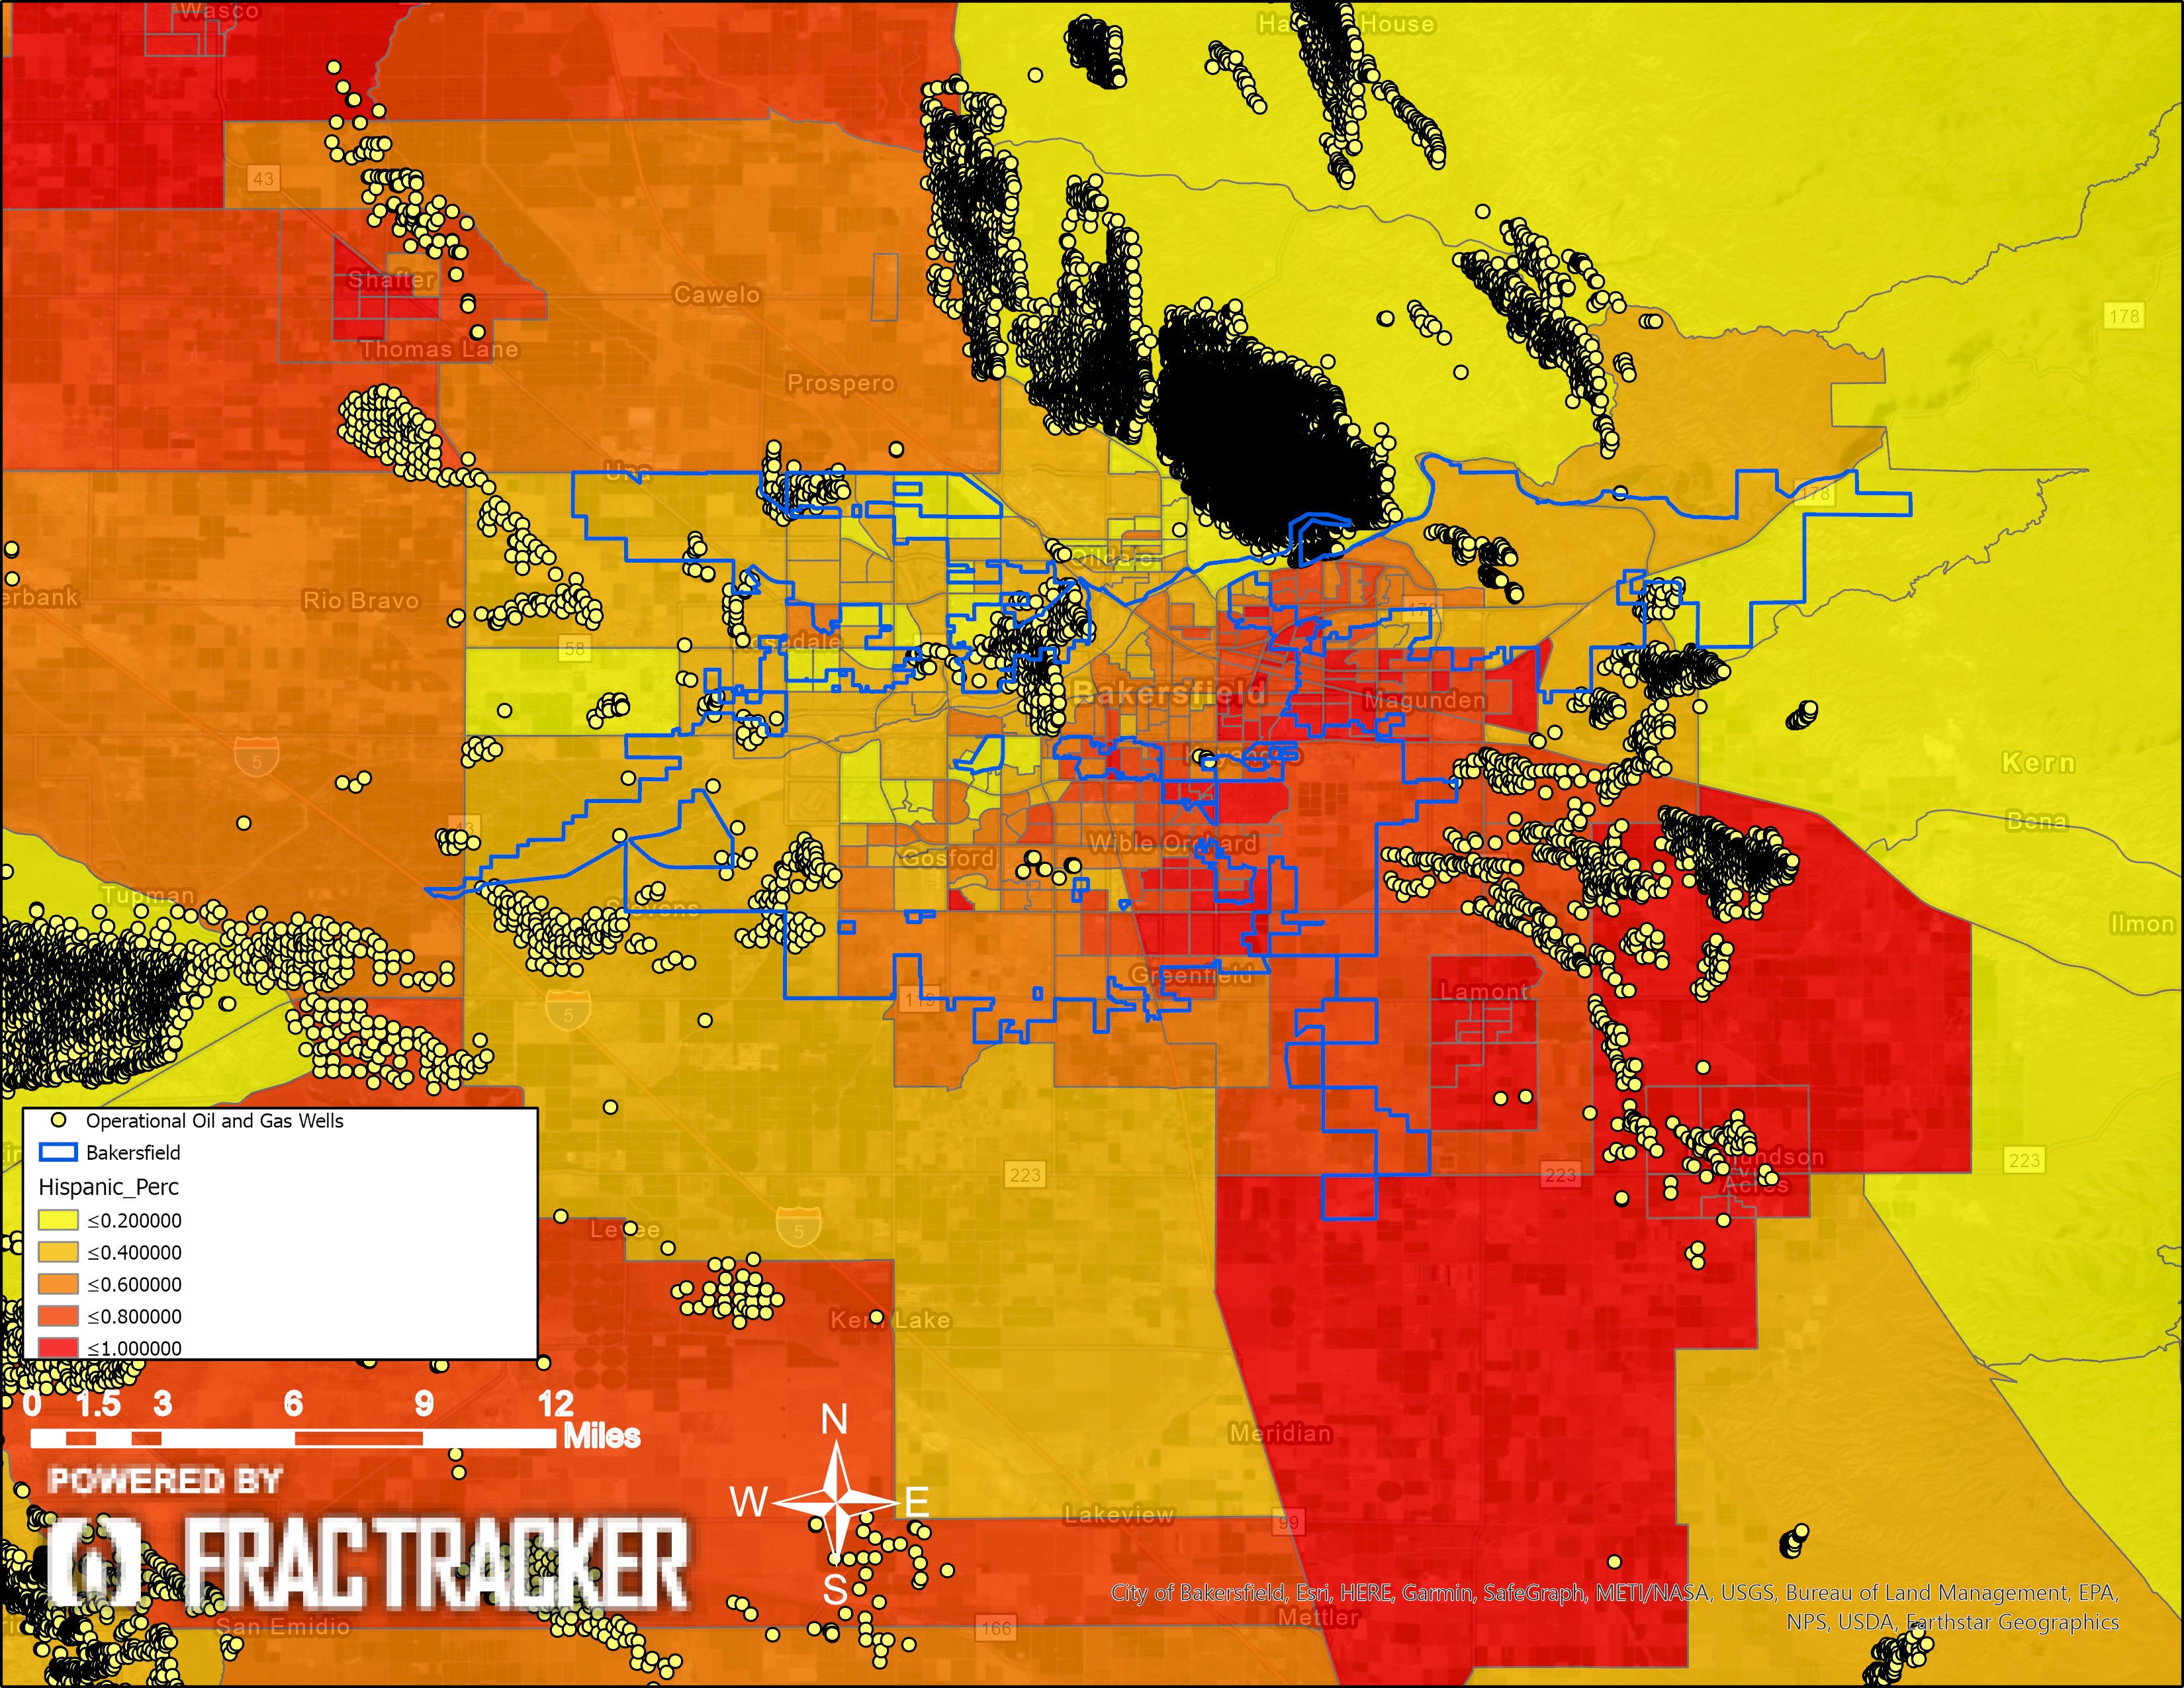
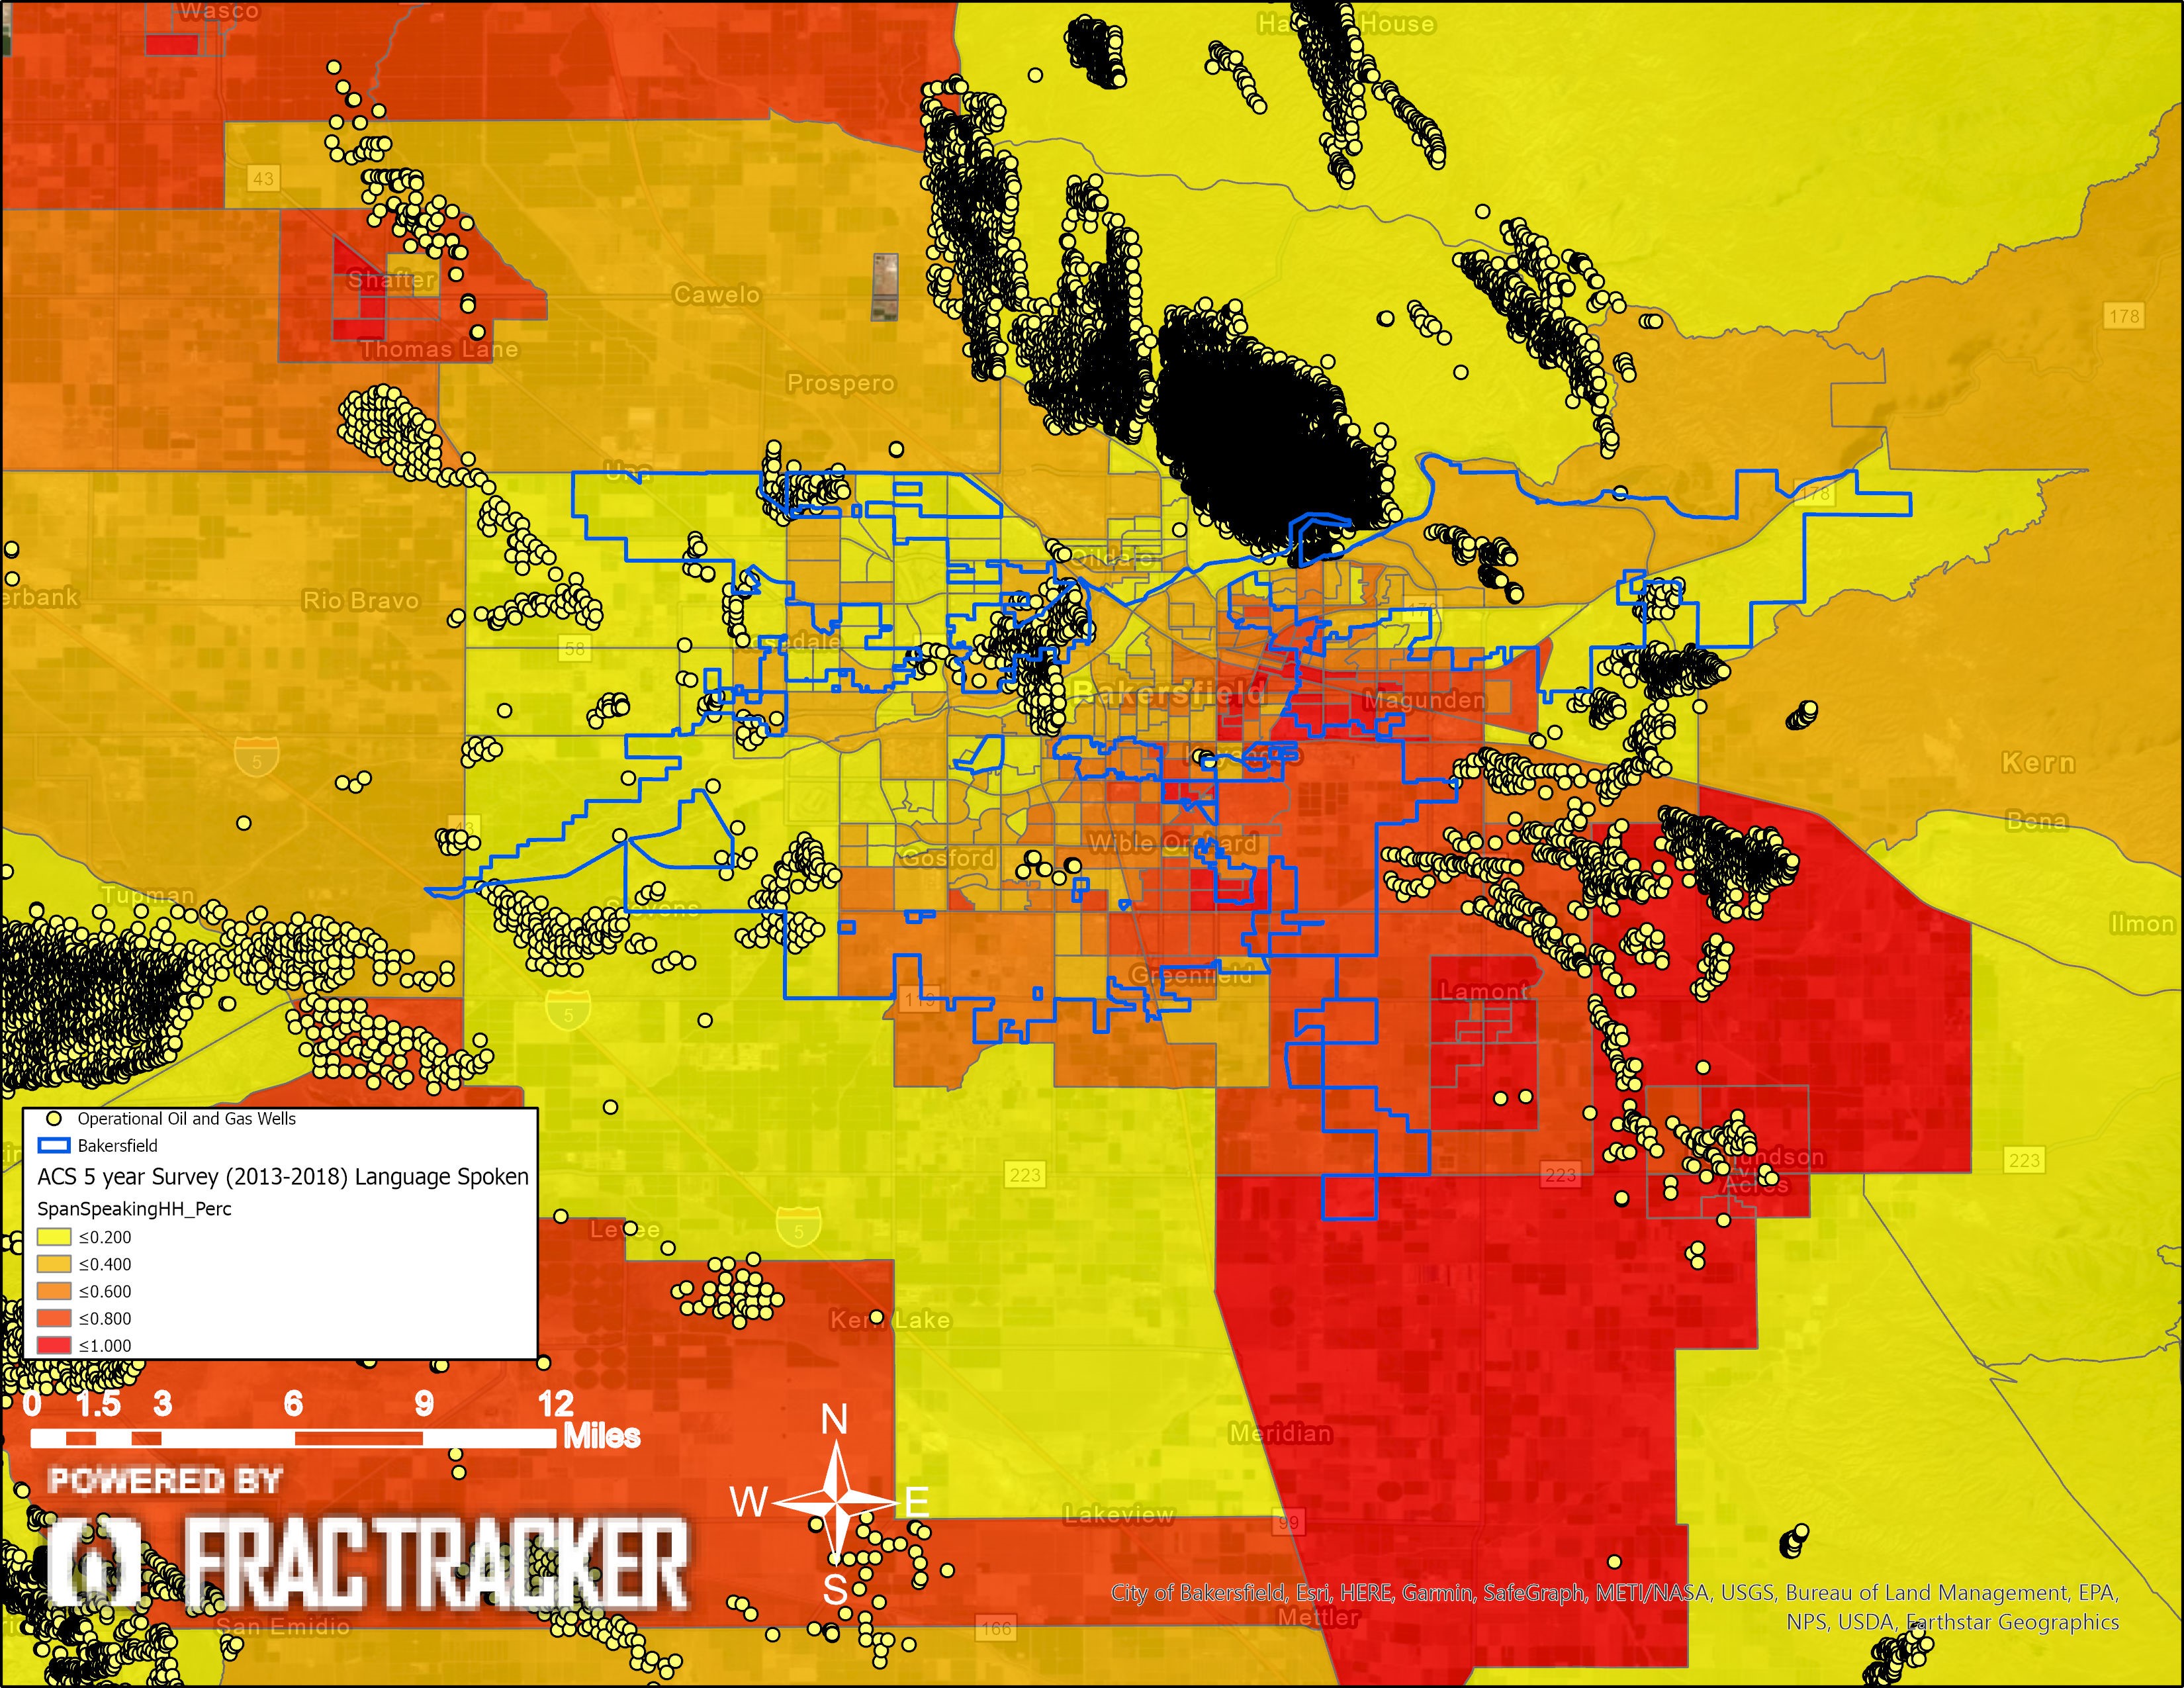
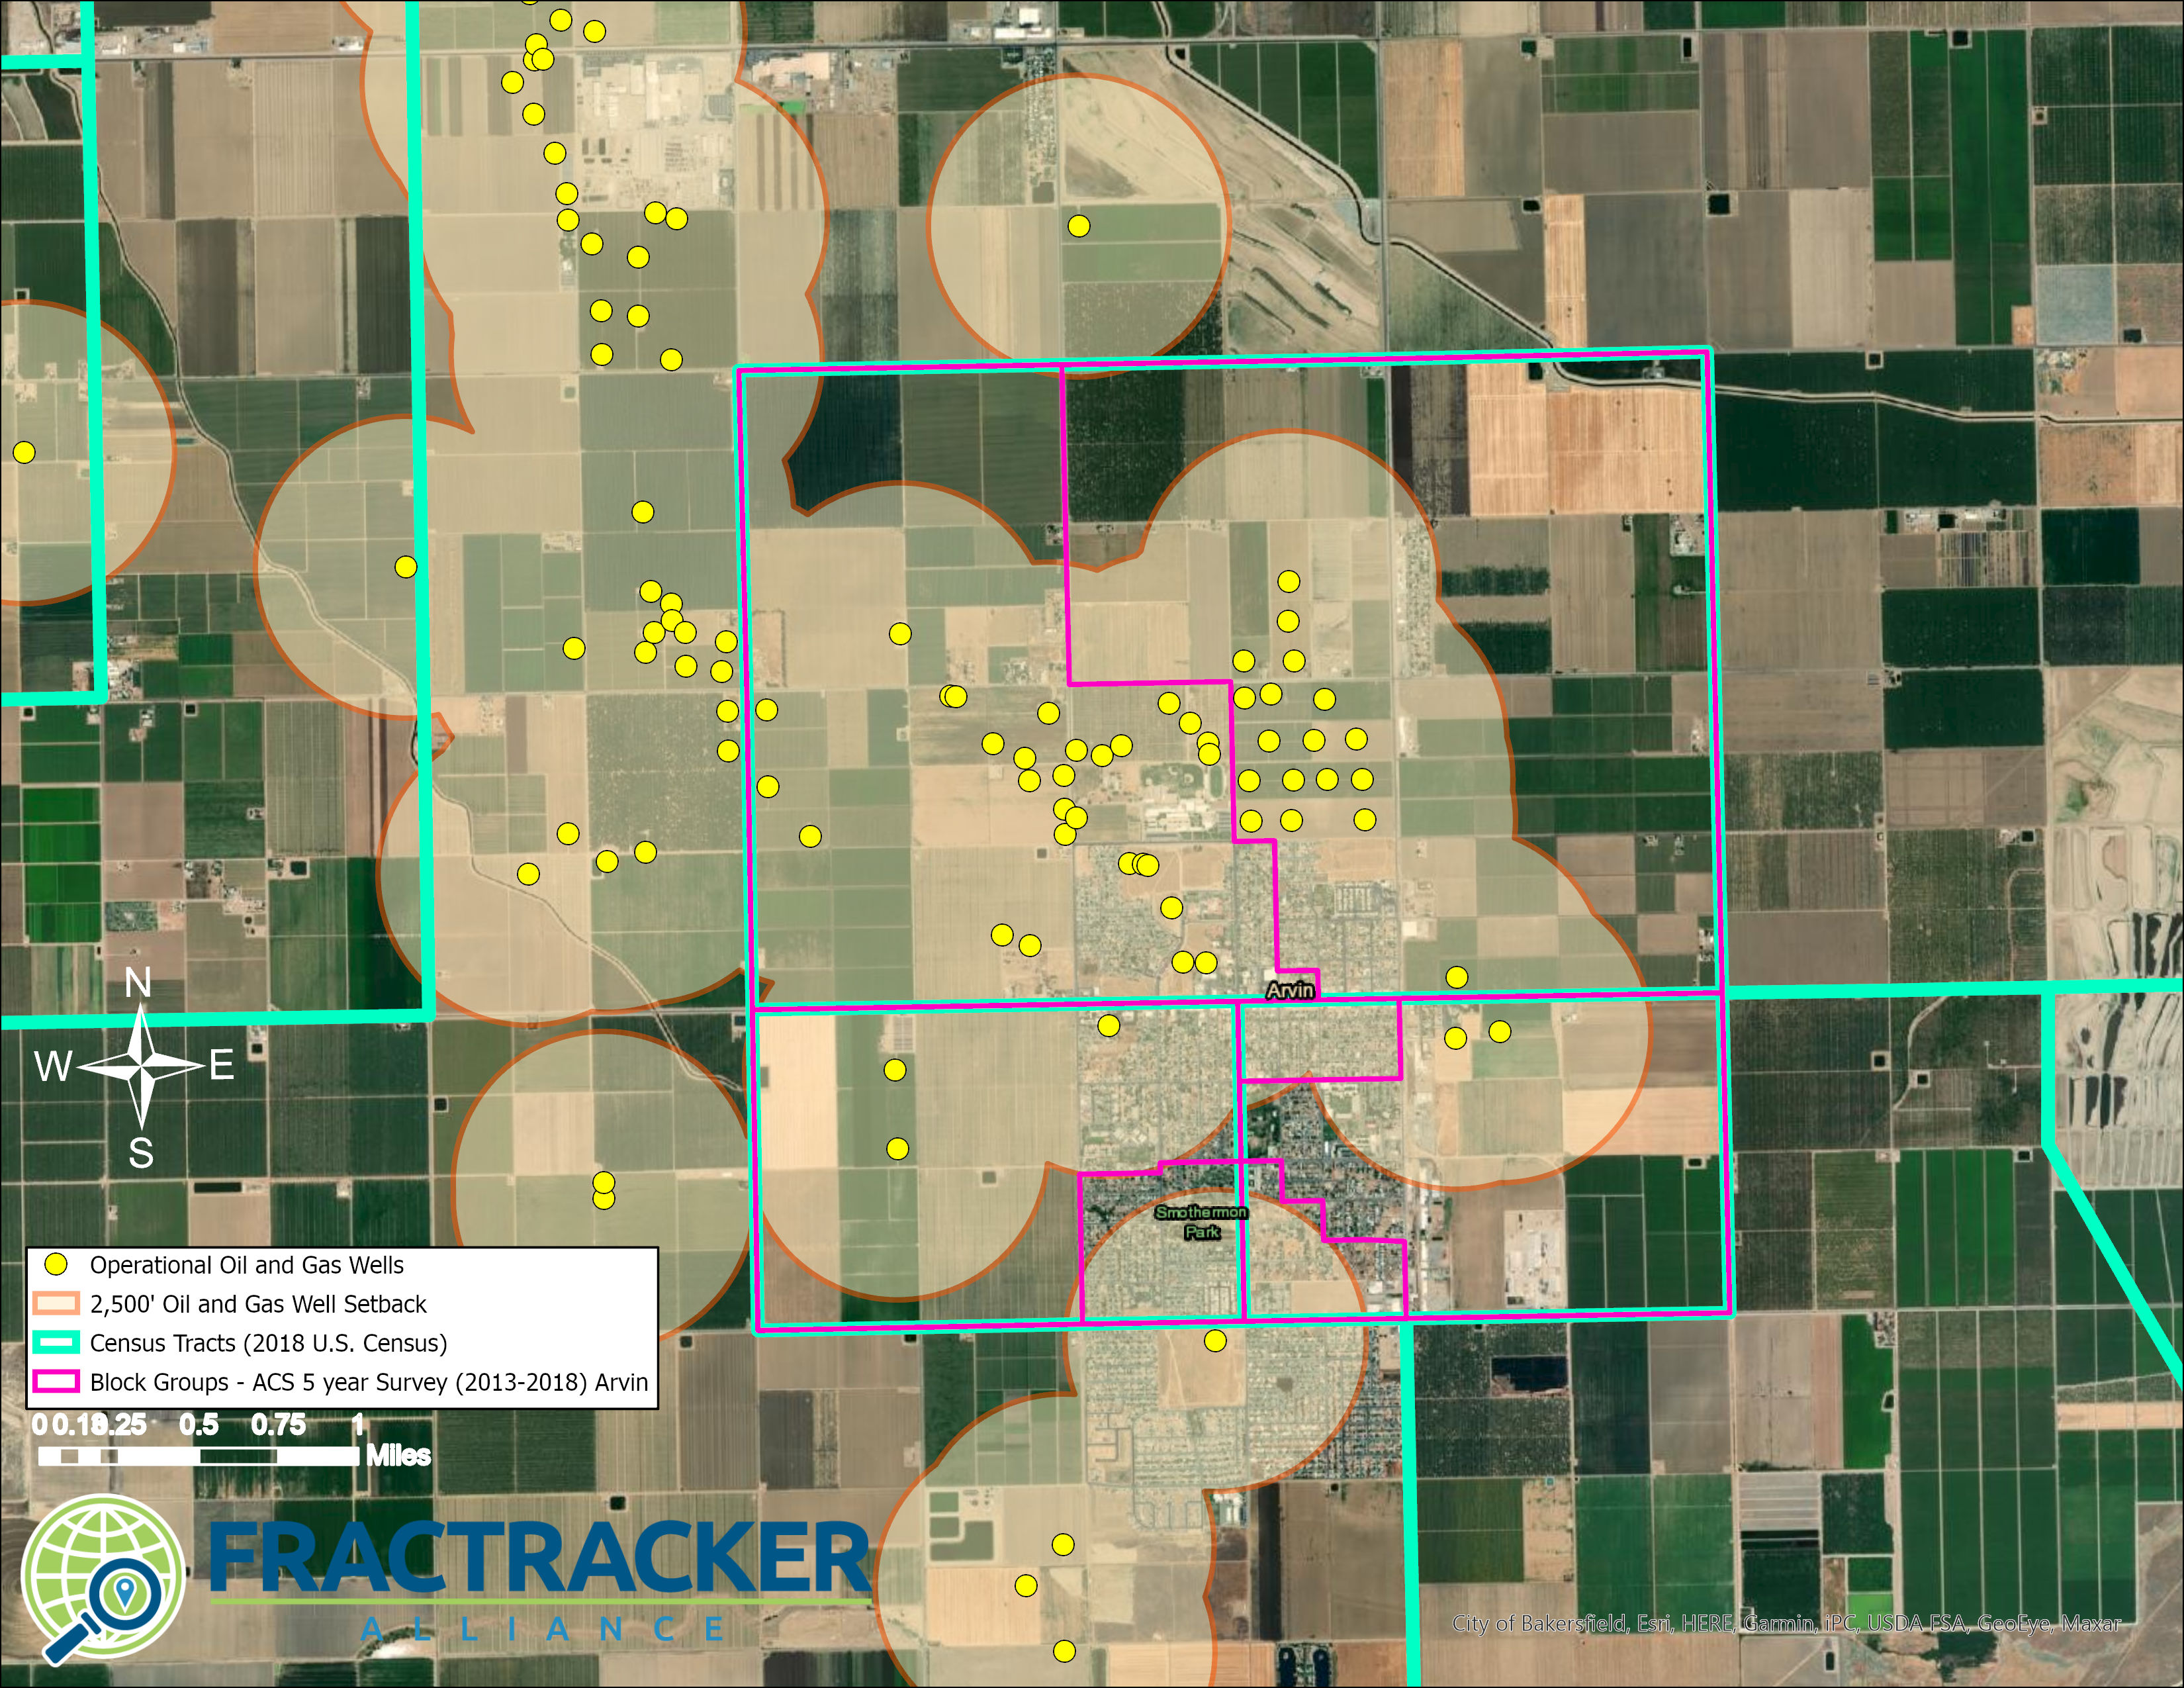
 Map A2. Shafter Census Designated Areas. The map shows the city of Shafter and includes both census tracts and census block groups for comparison. It shows operational oil and gas wells in the map, along with 2,500’ buffers. This Frontline Community would not be included in an analysis that only considers census tracts containing Tier 1 areas negatively impacted by oil and gas extraction operations. The census tract containing the North Shafter oil field forms a donut around the city of Shafter.
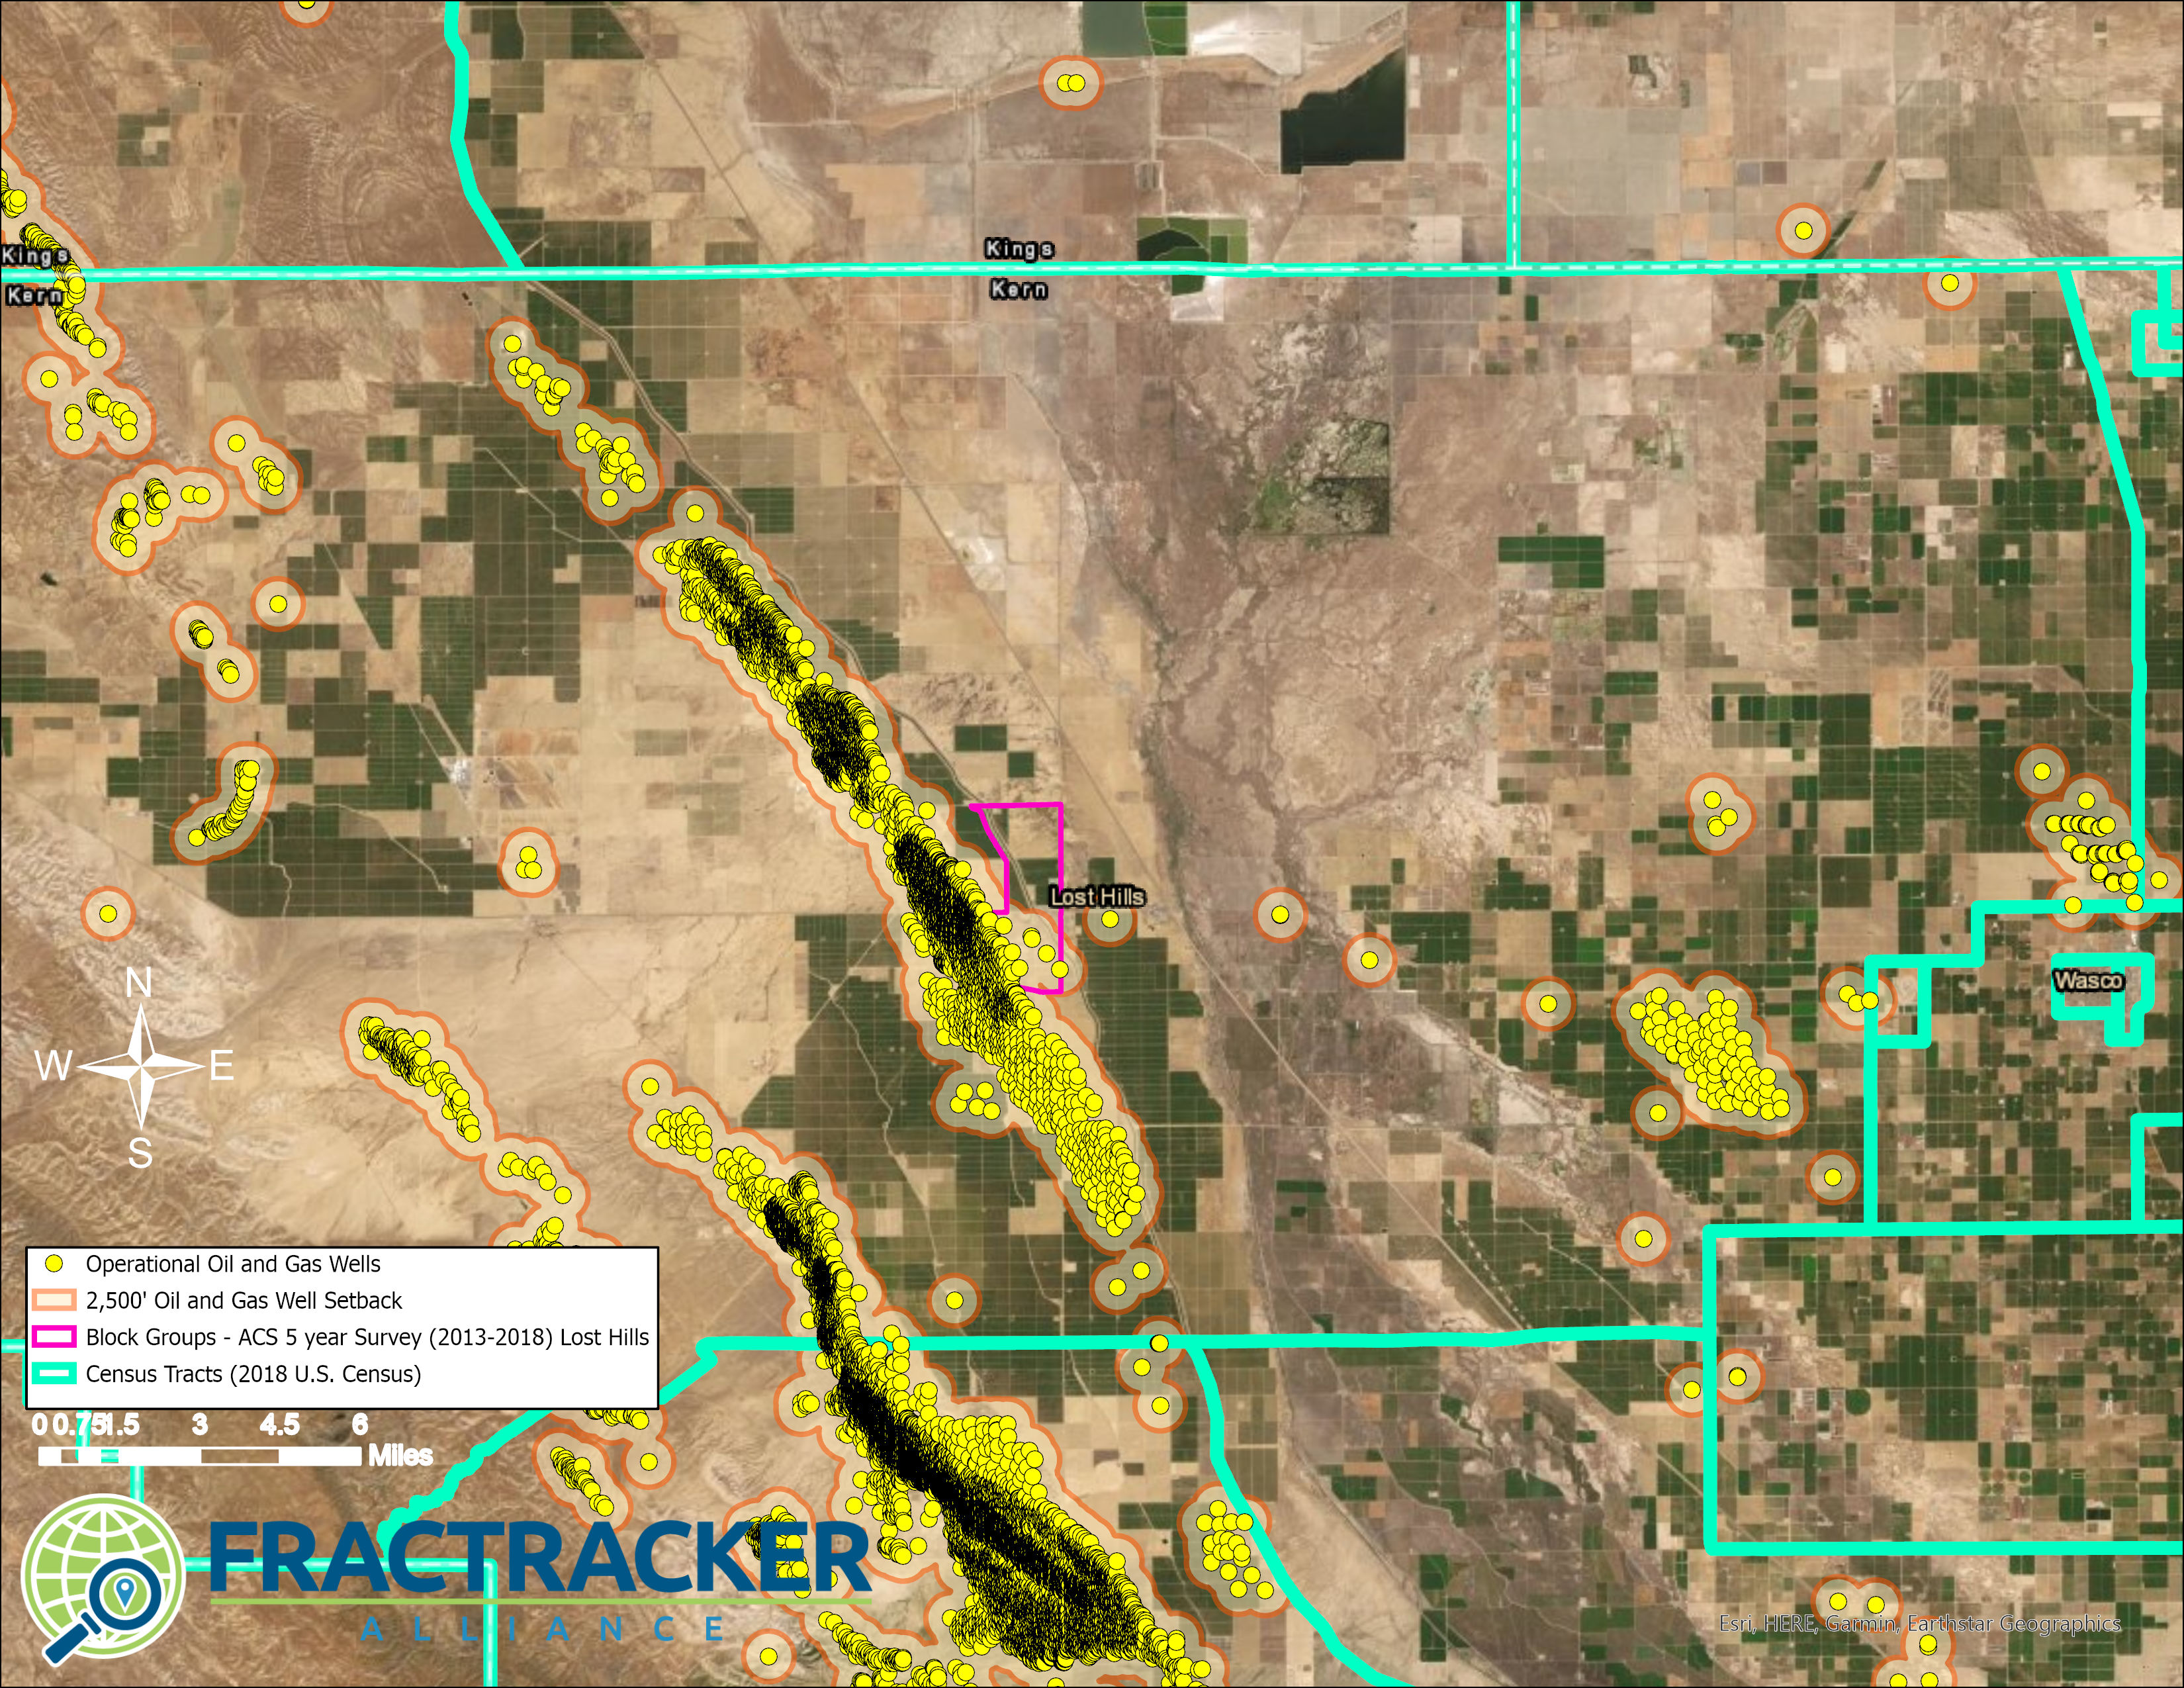
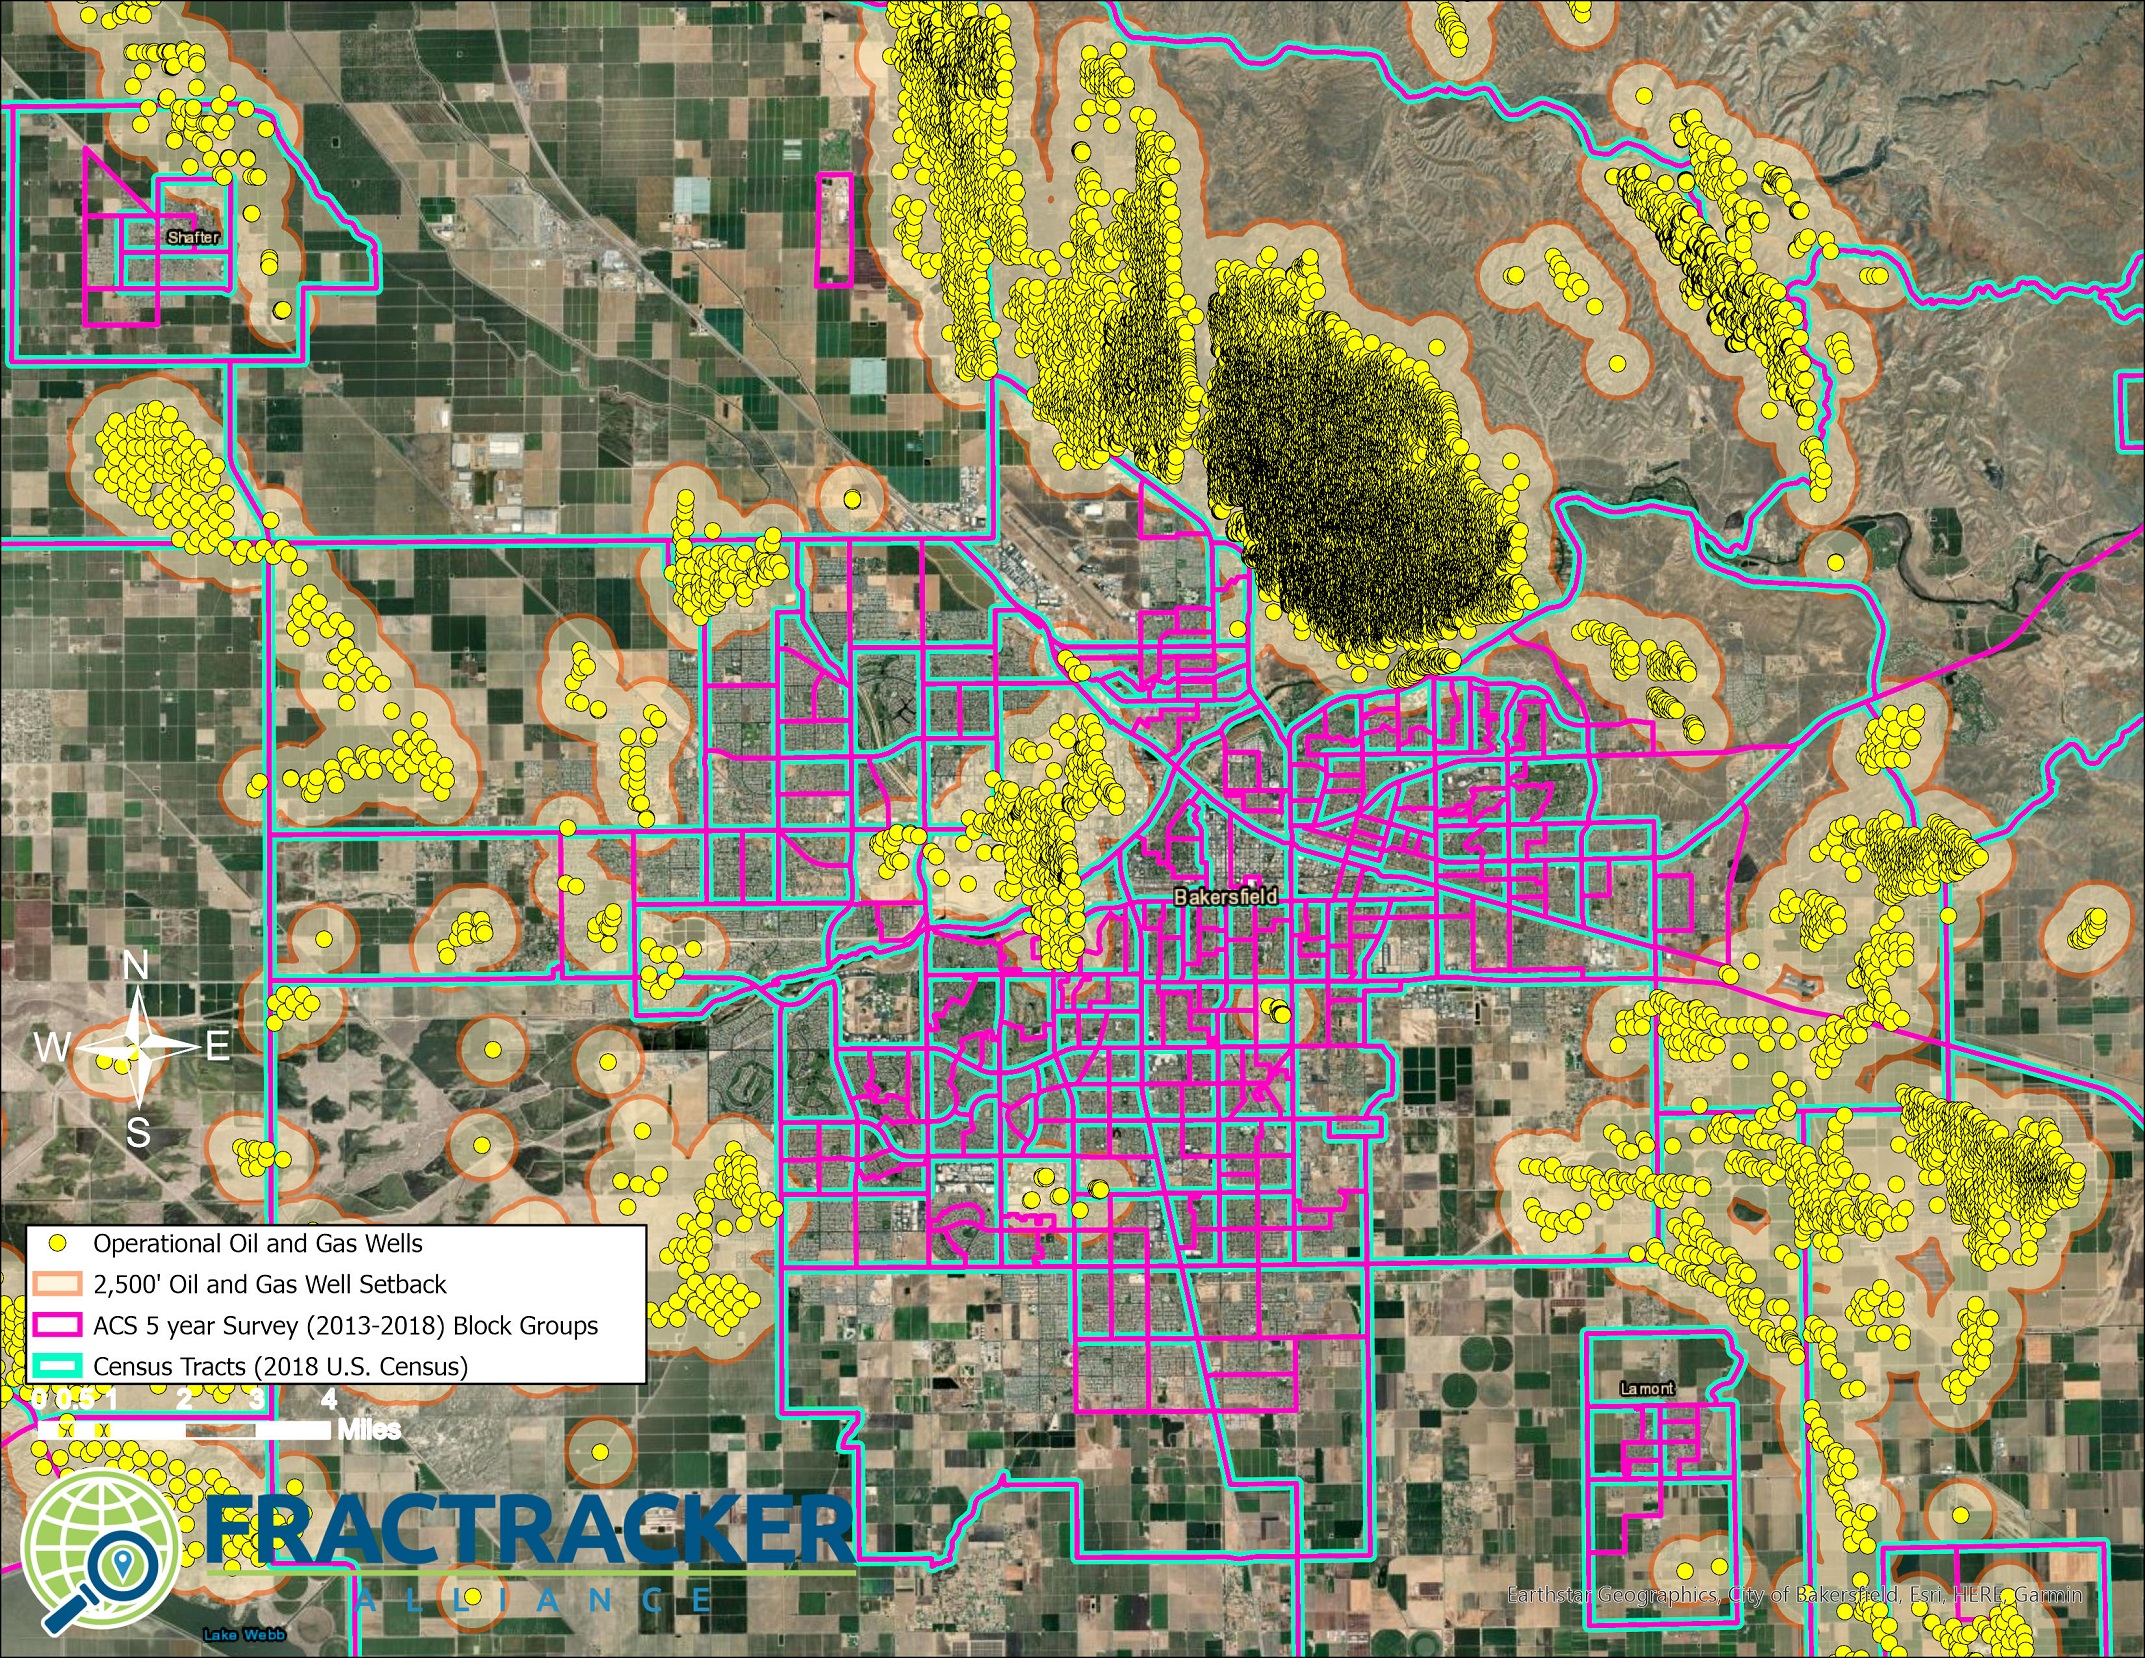
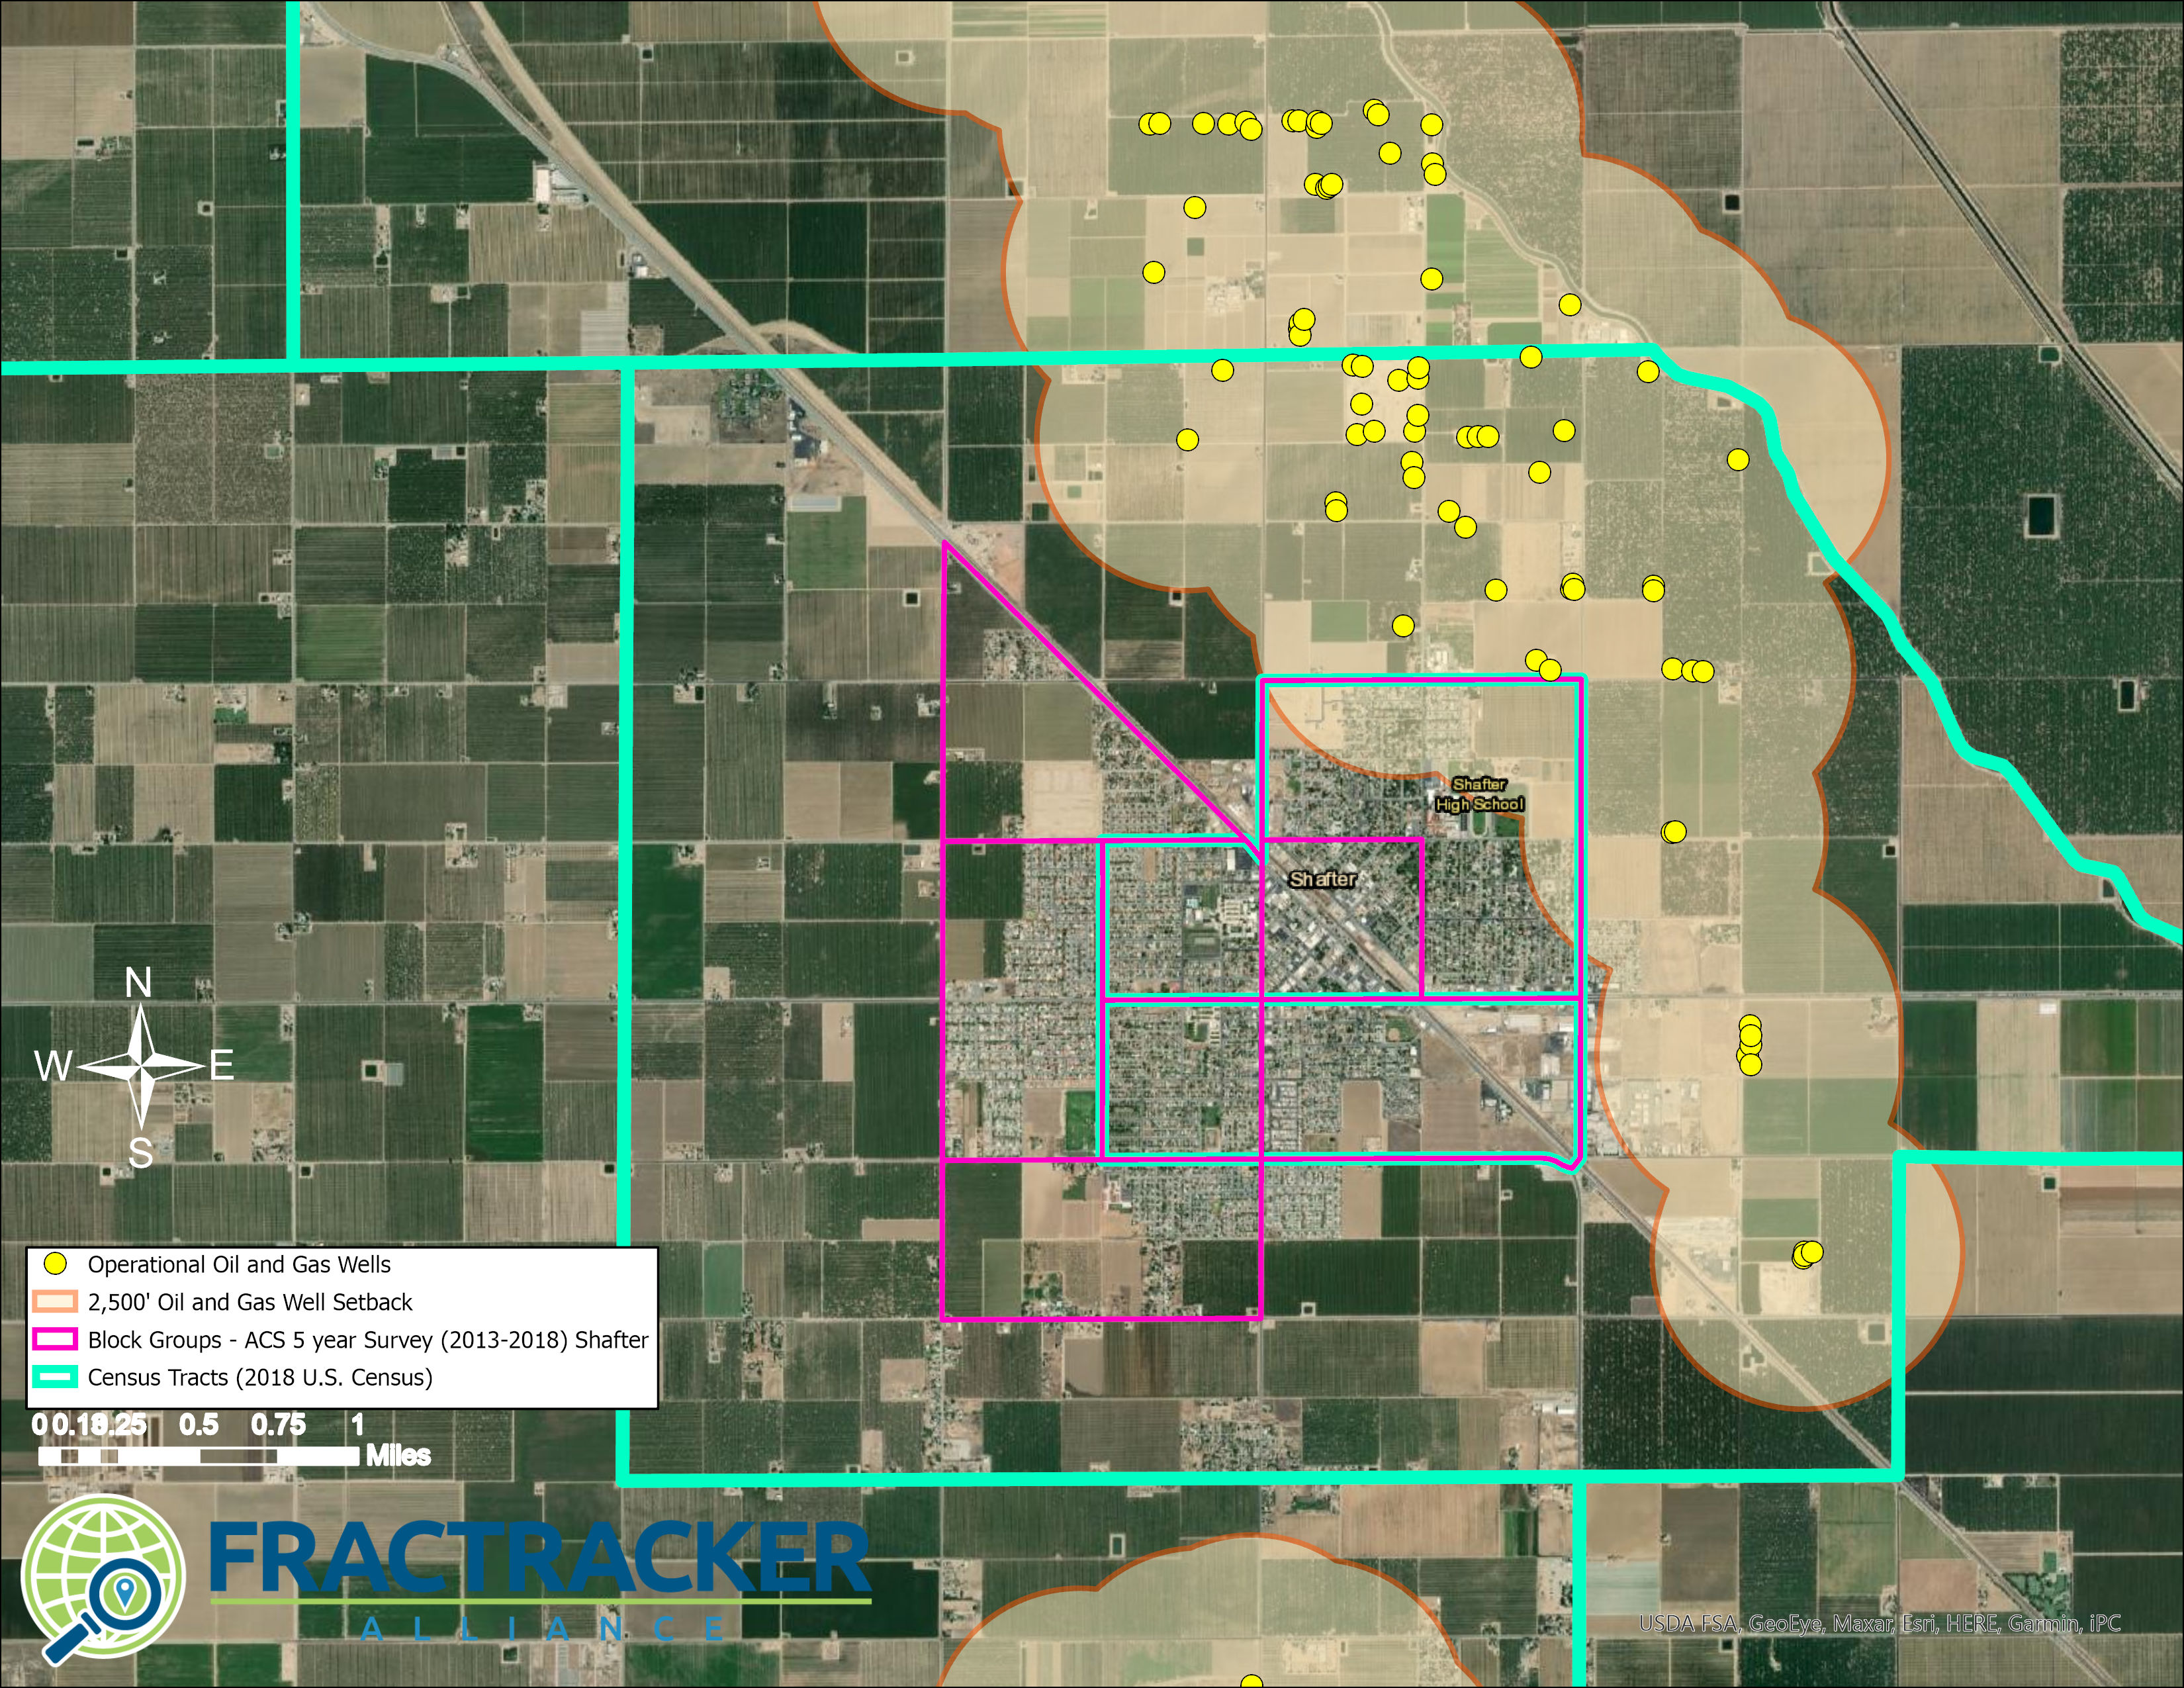
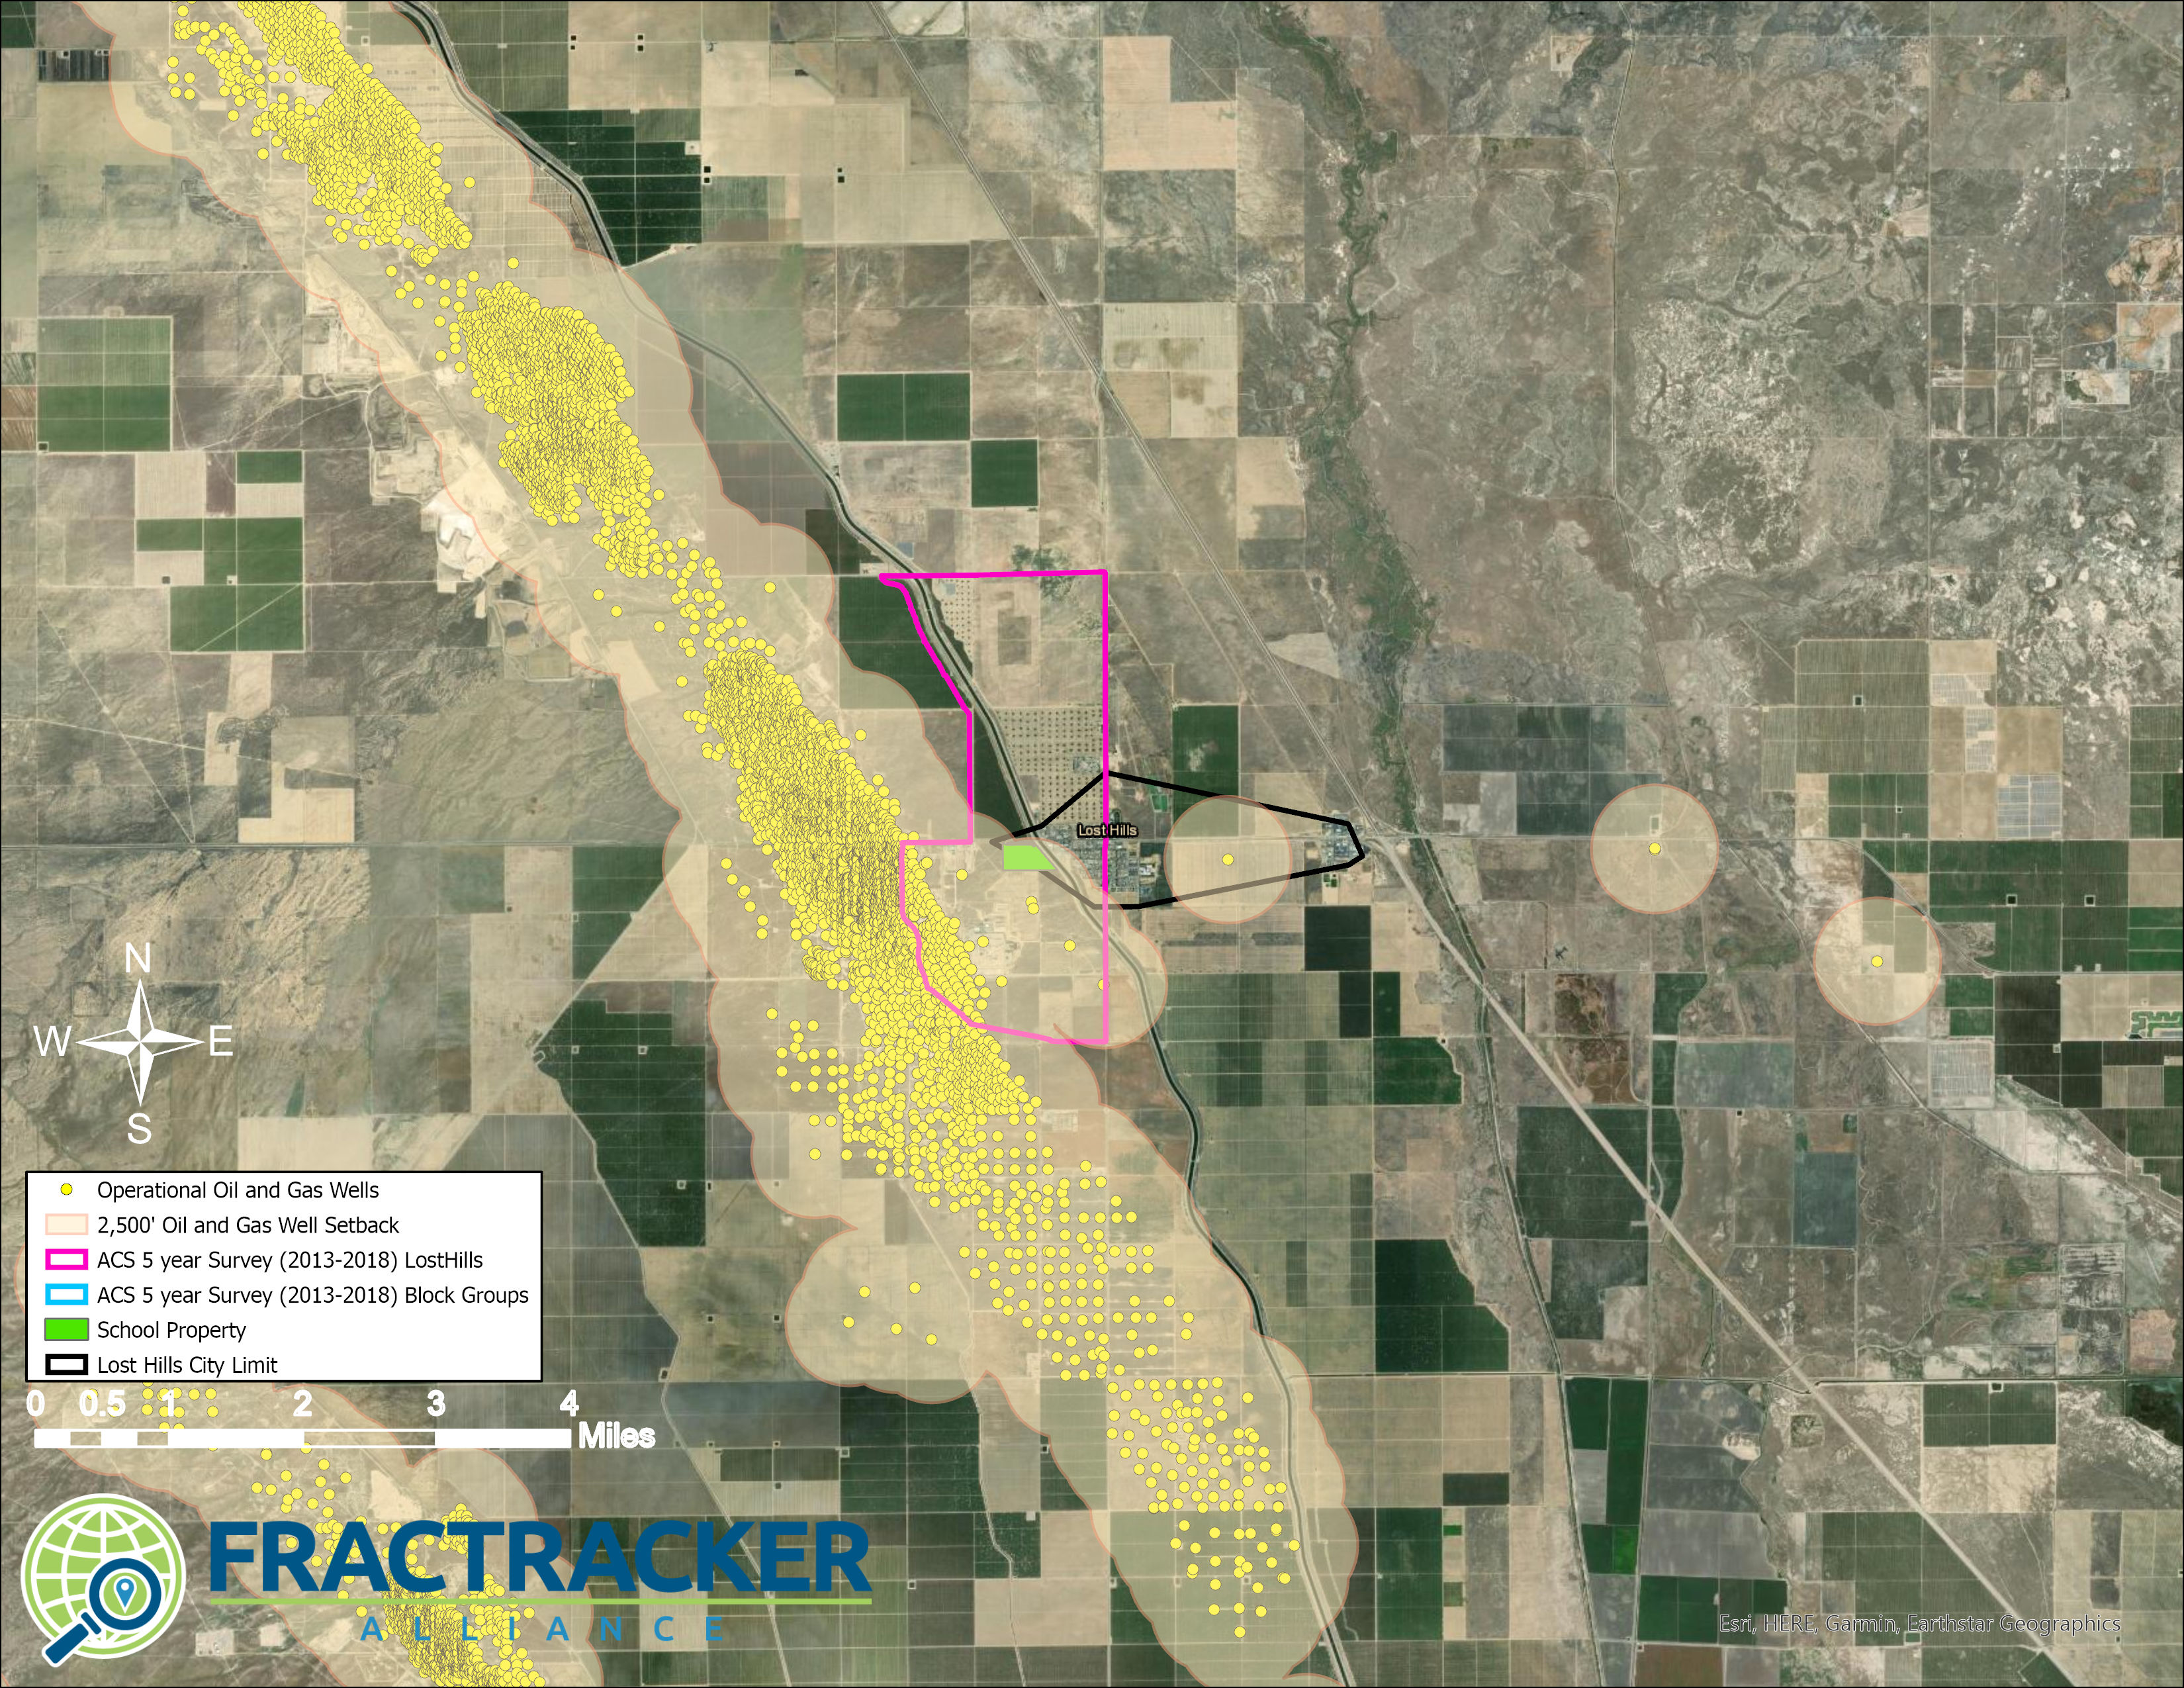
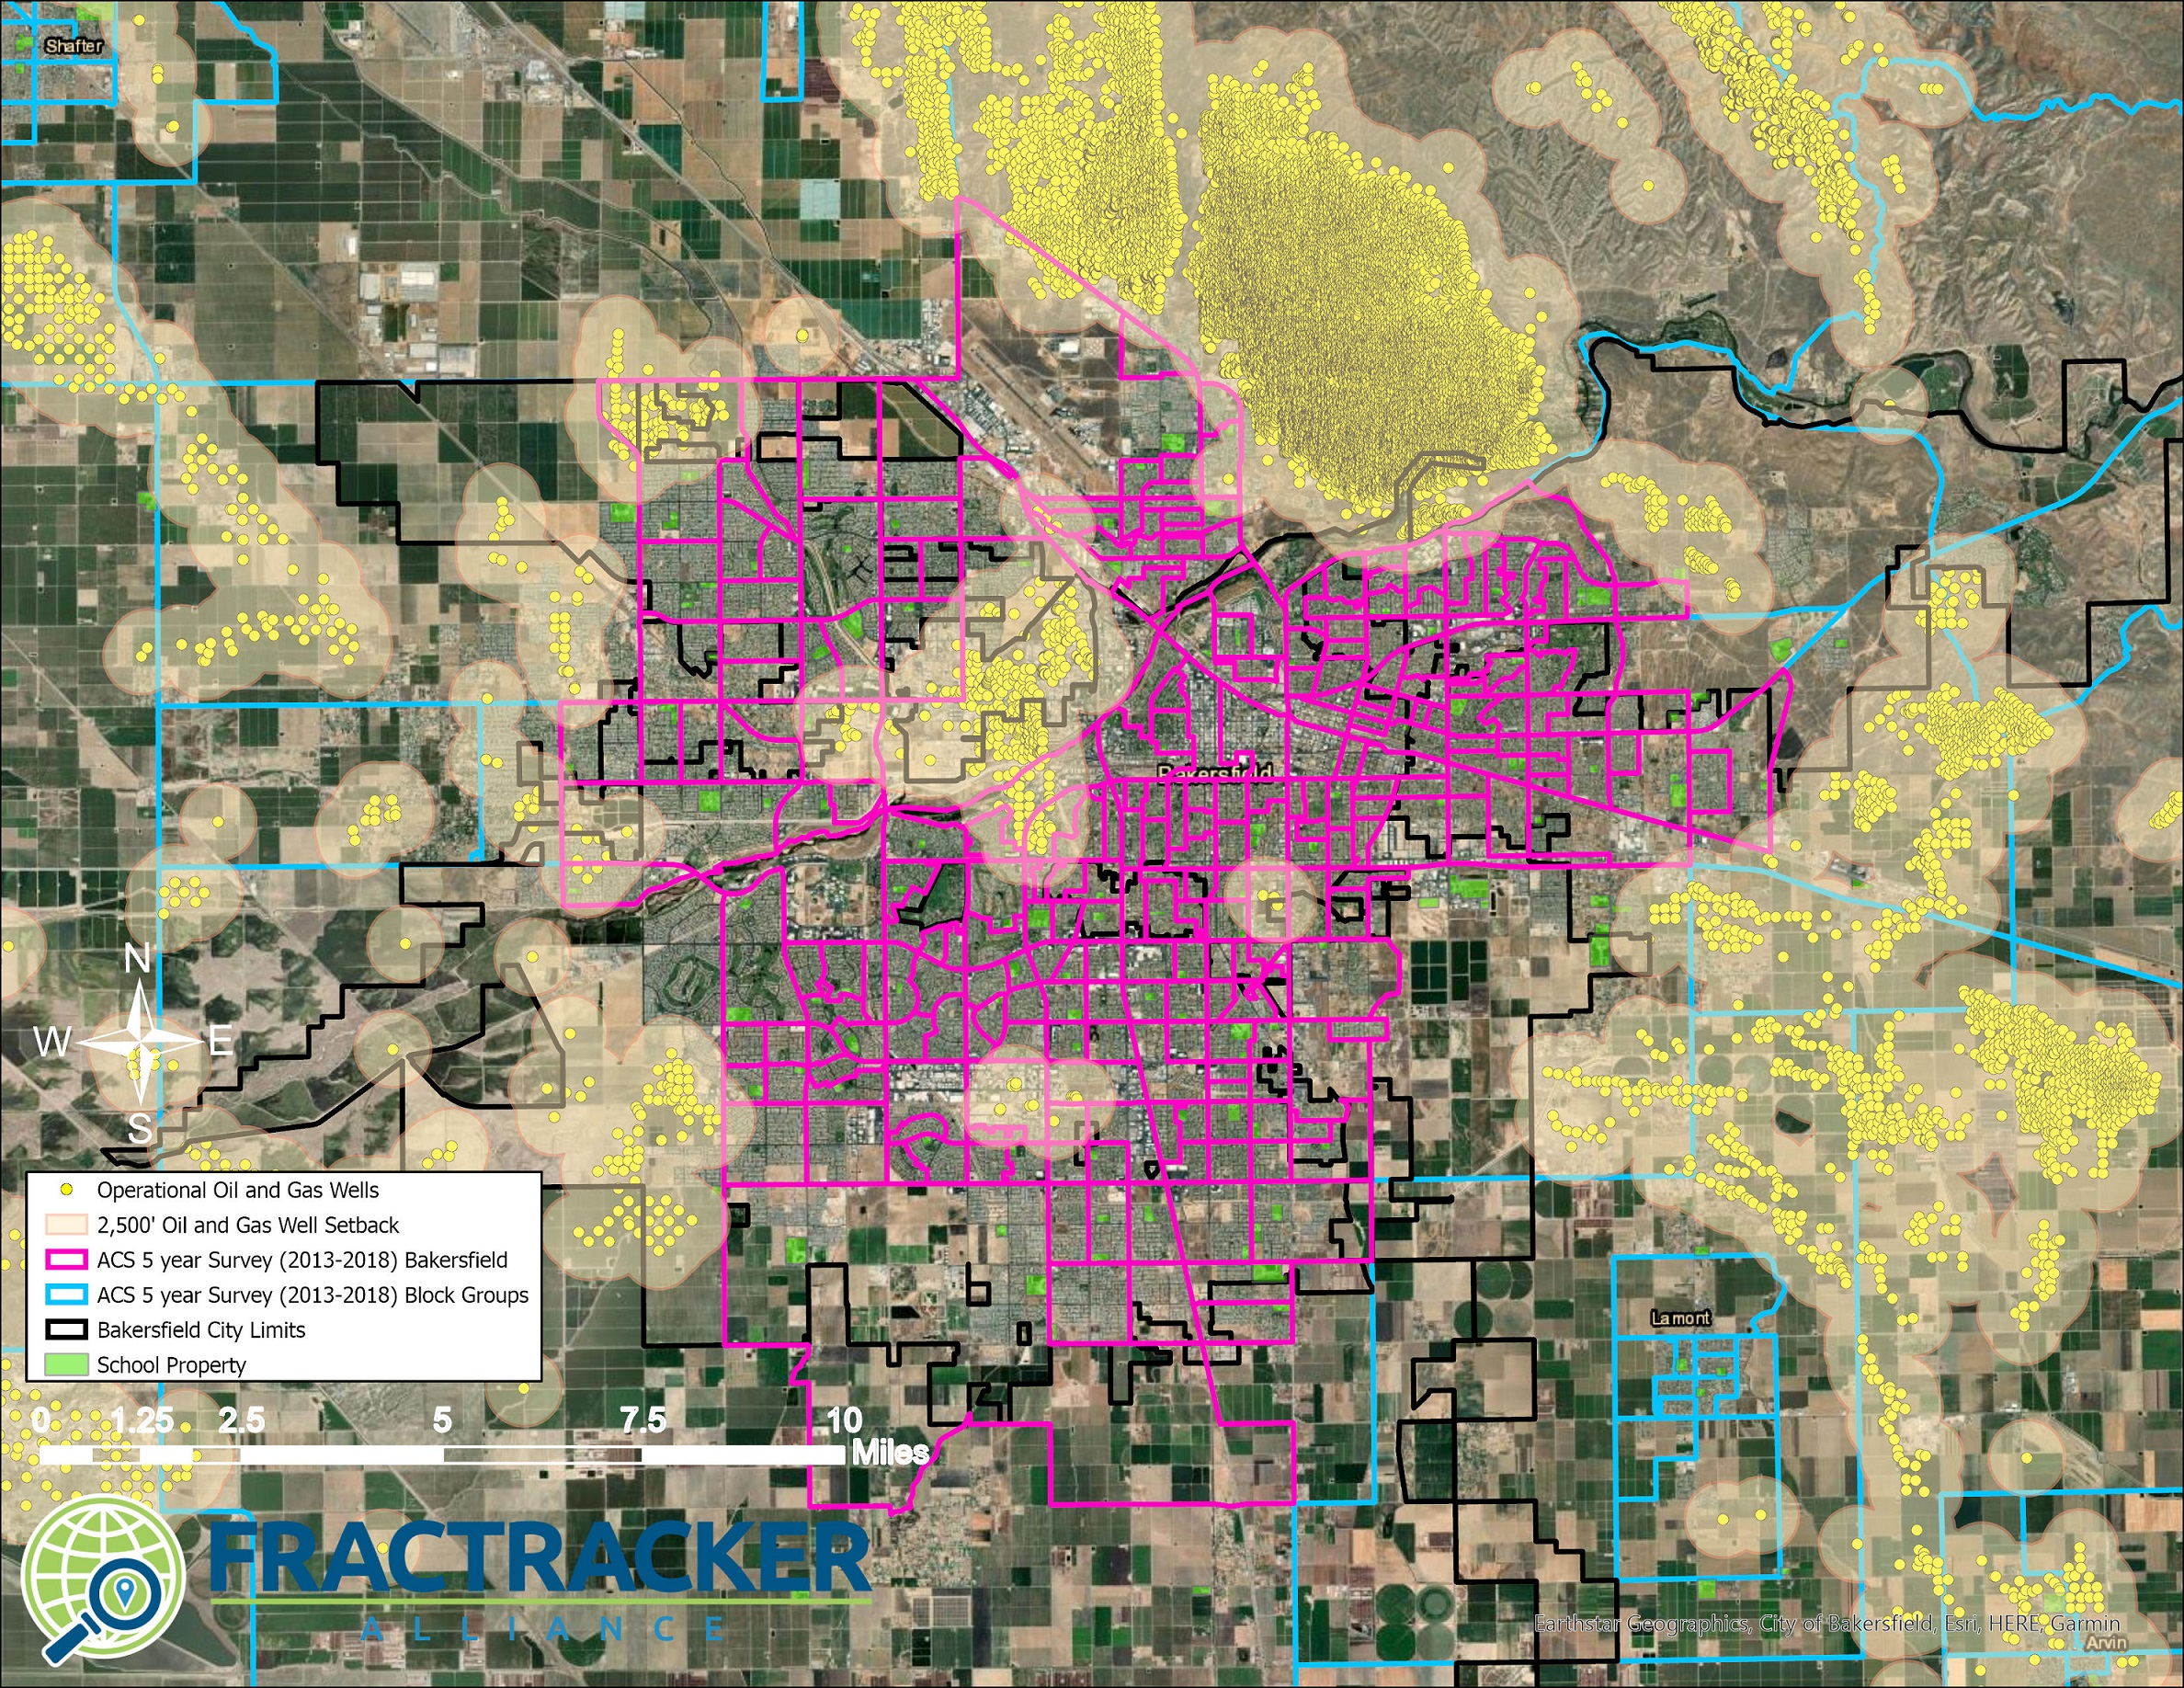
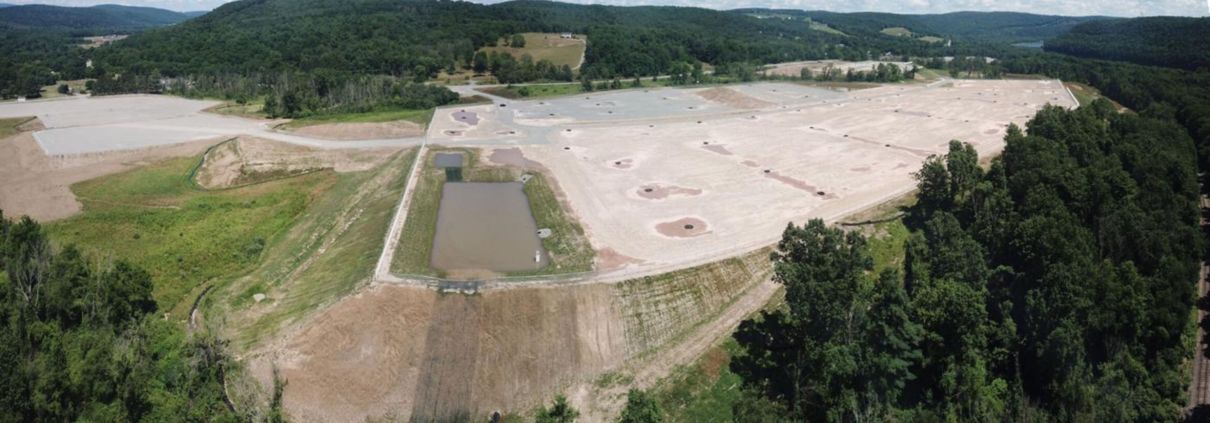

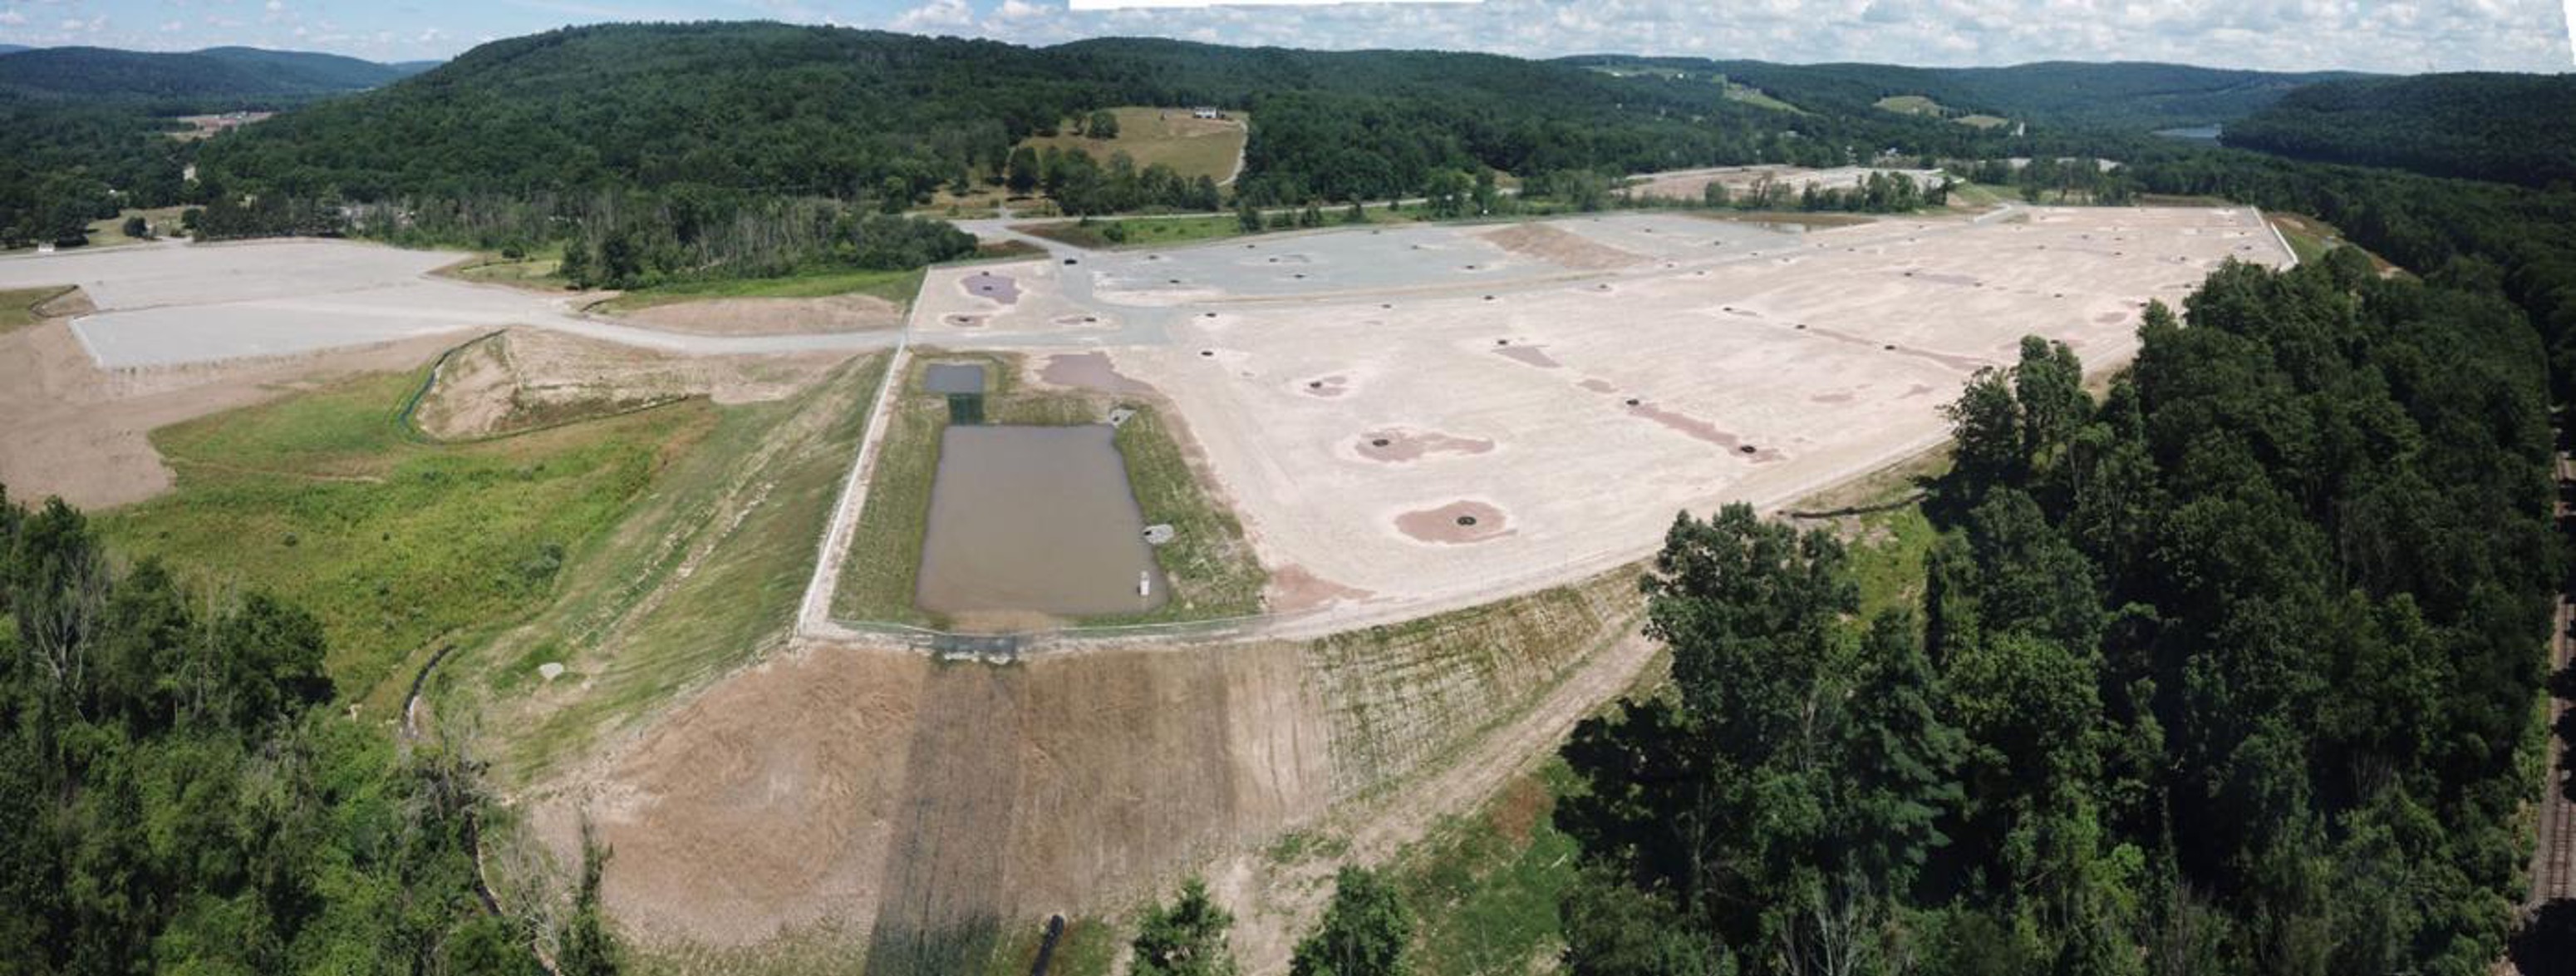
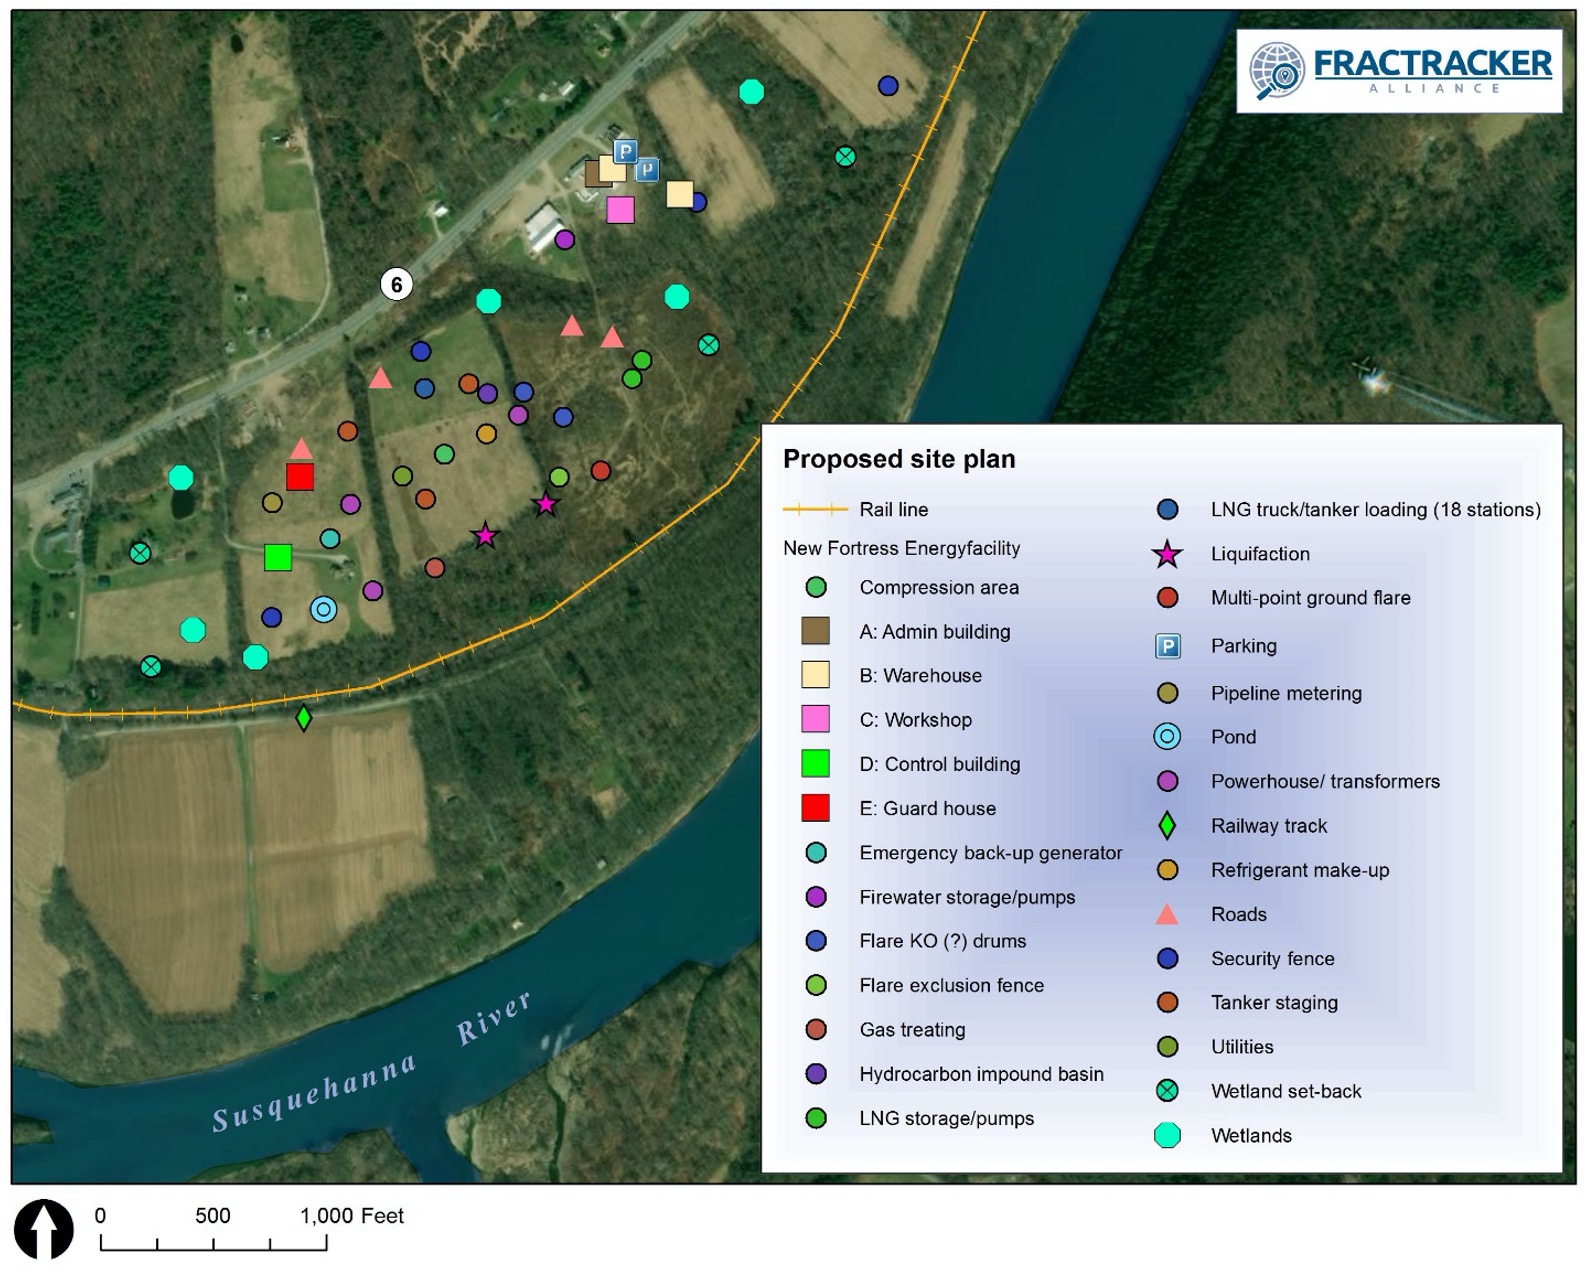
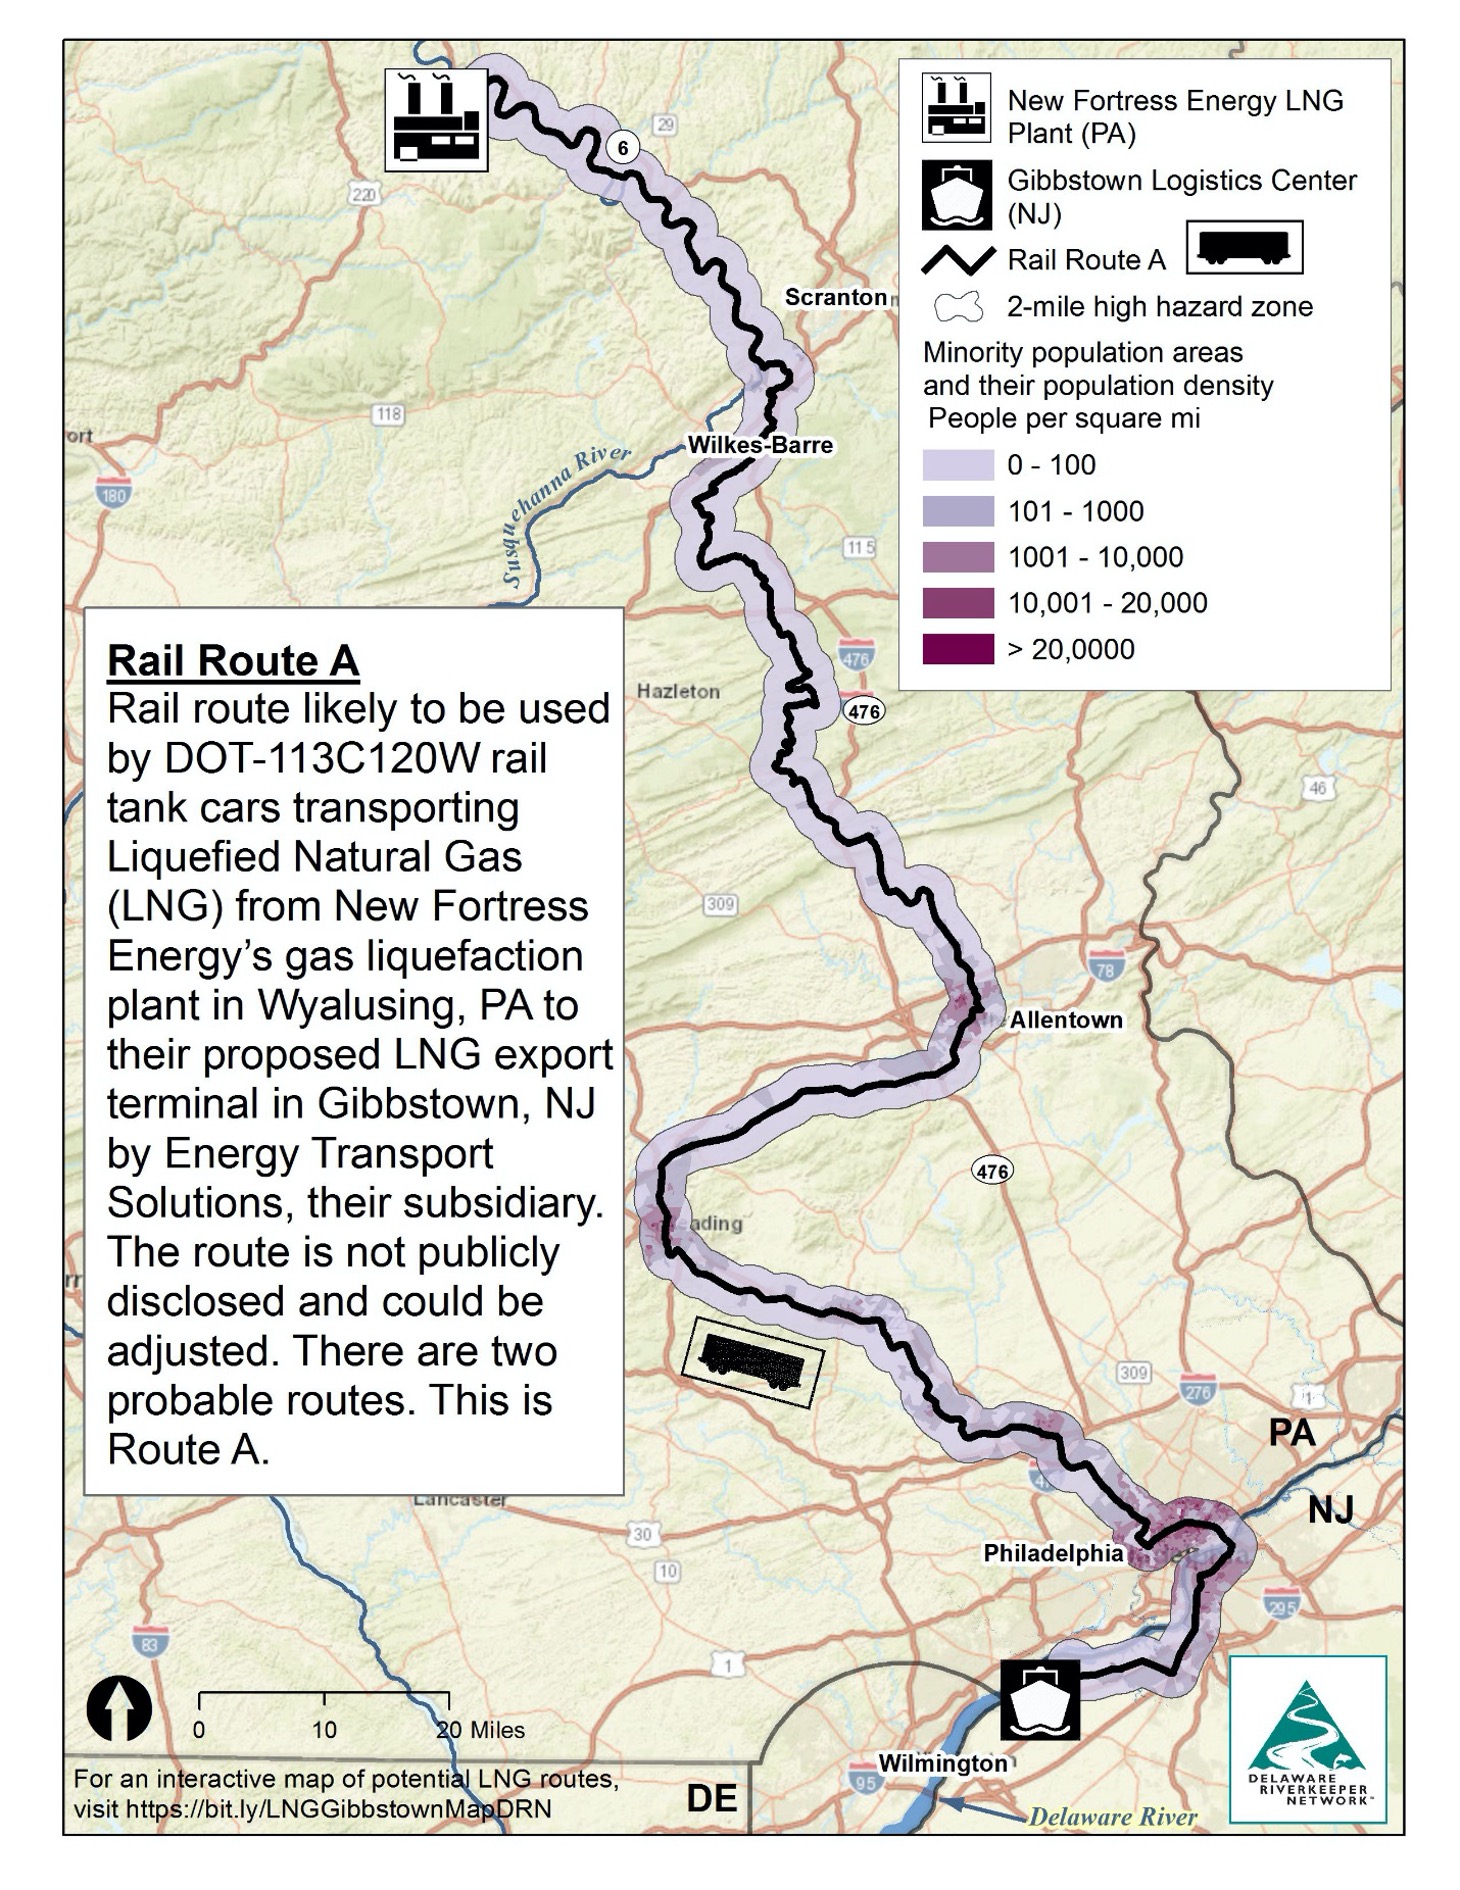
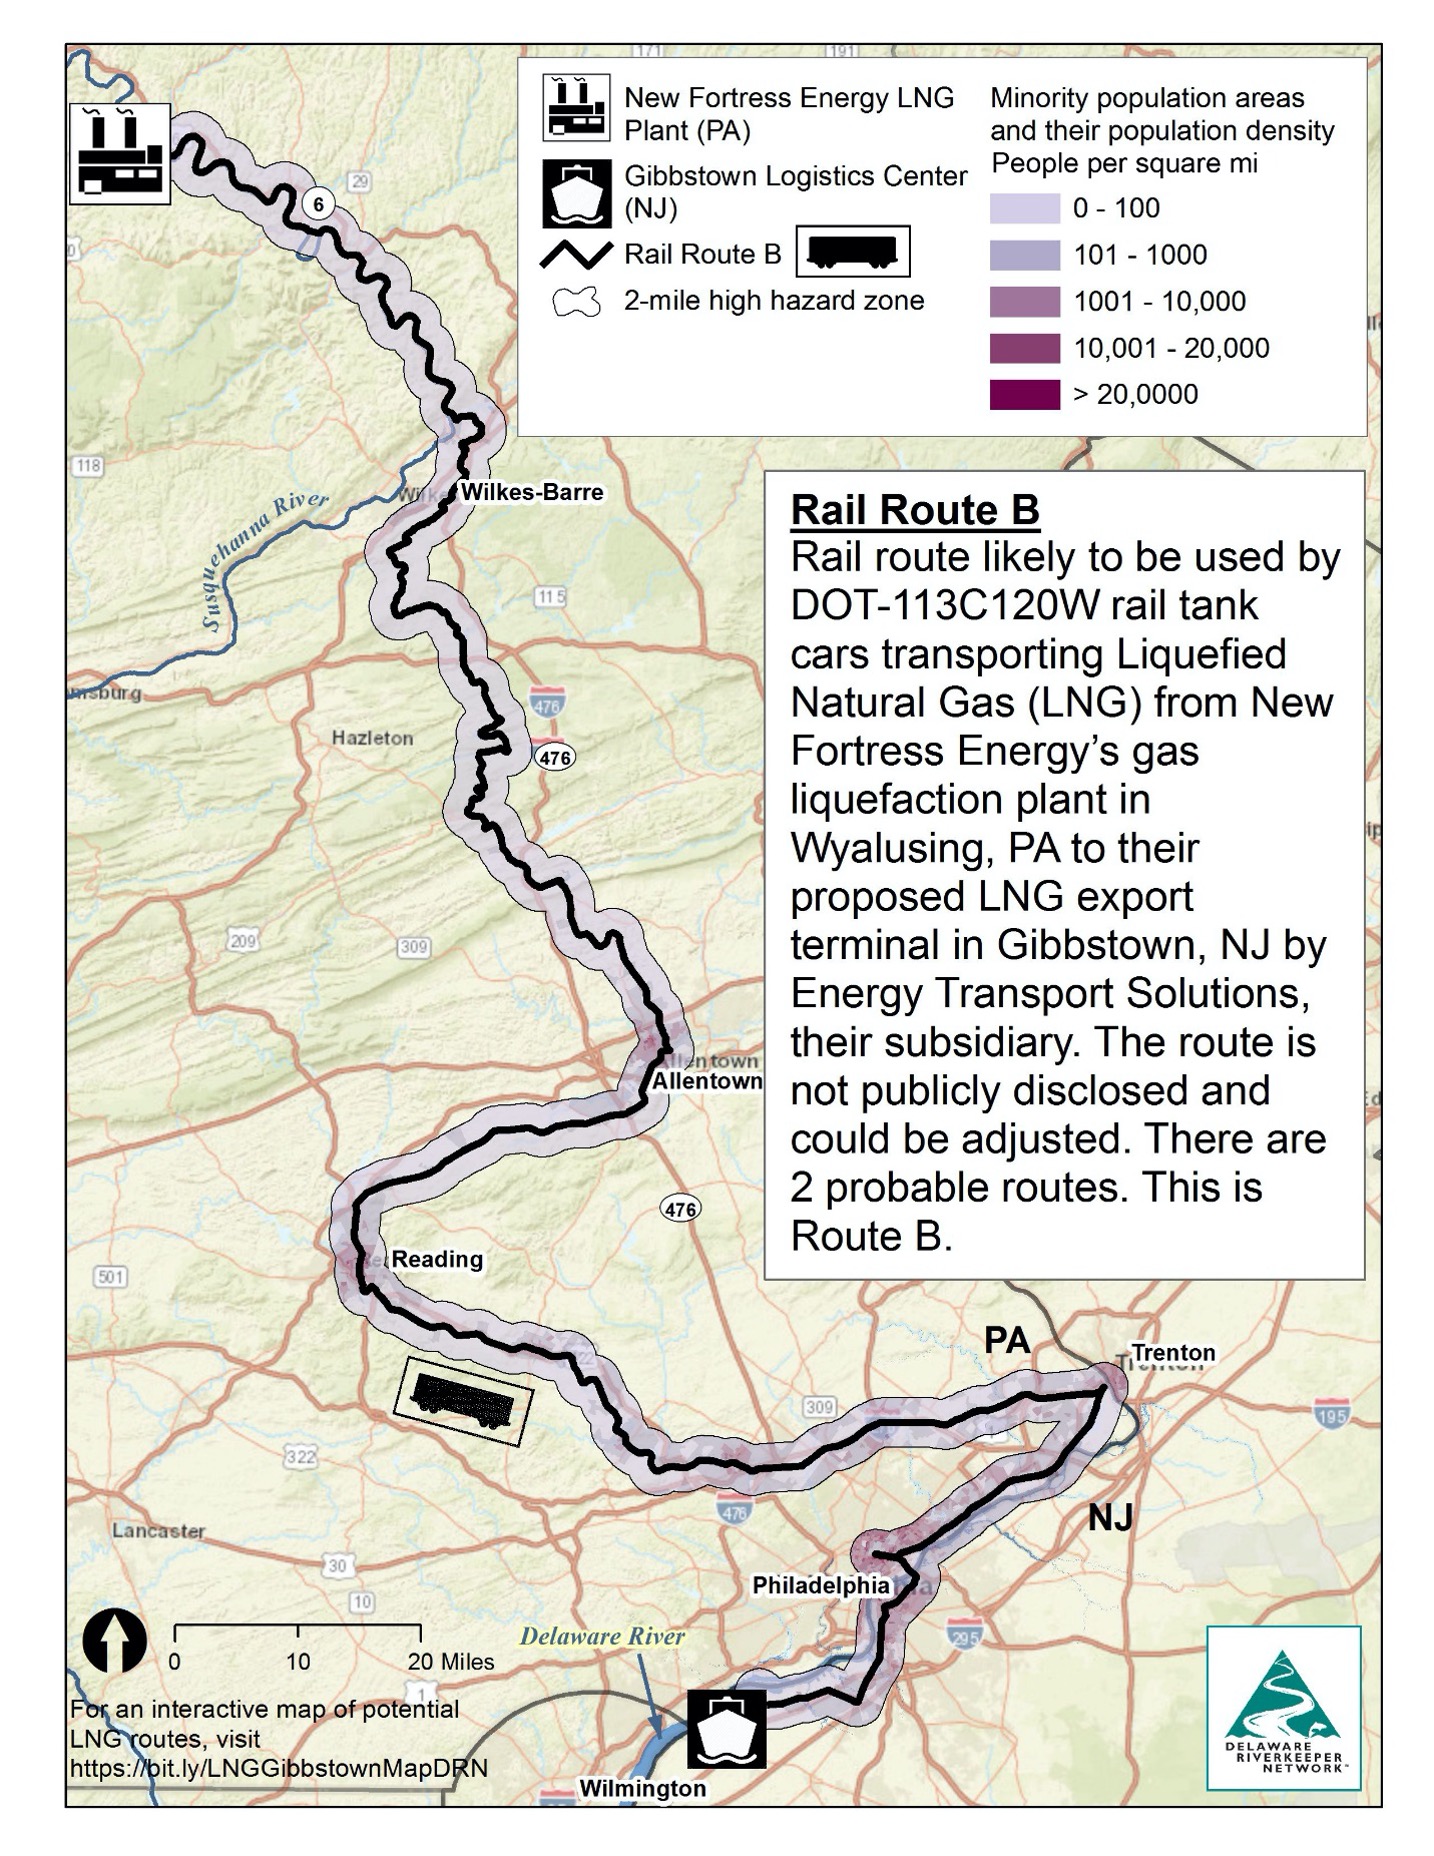
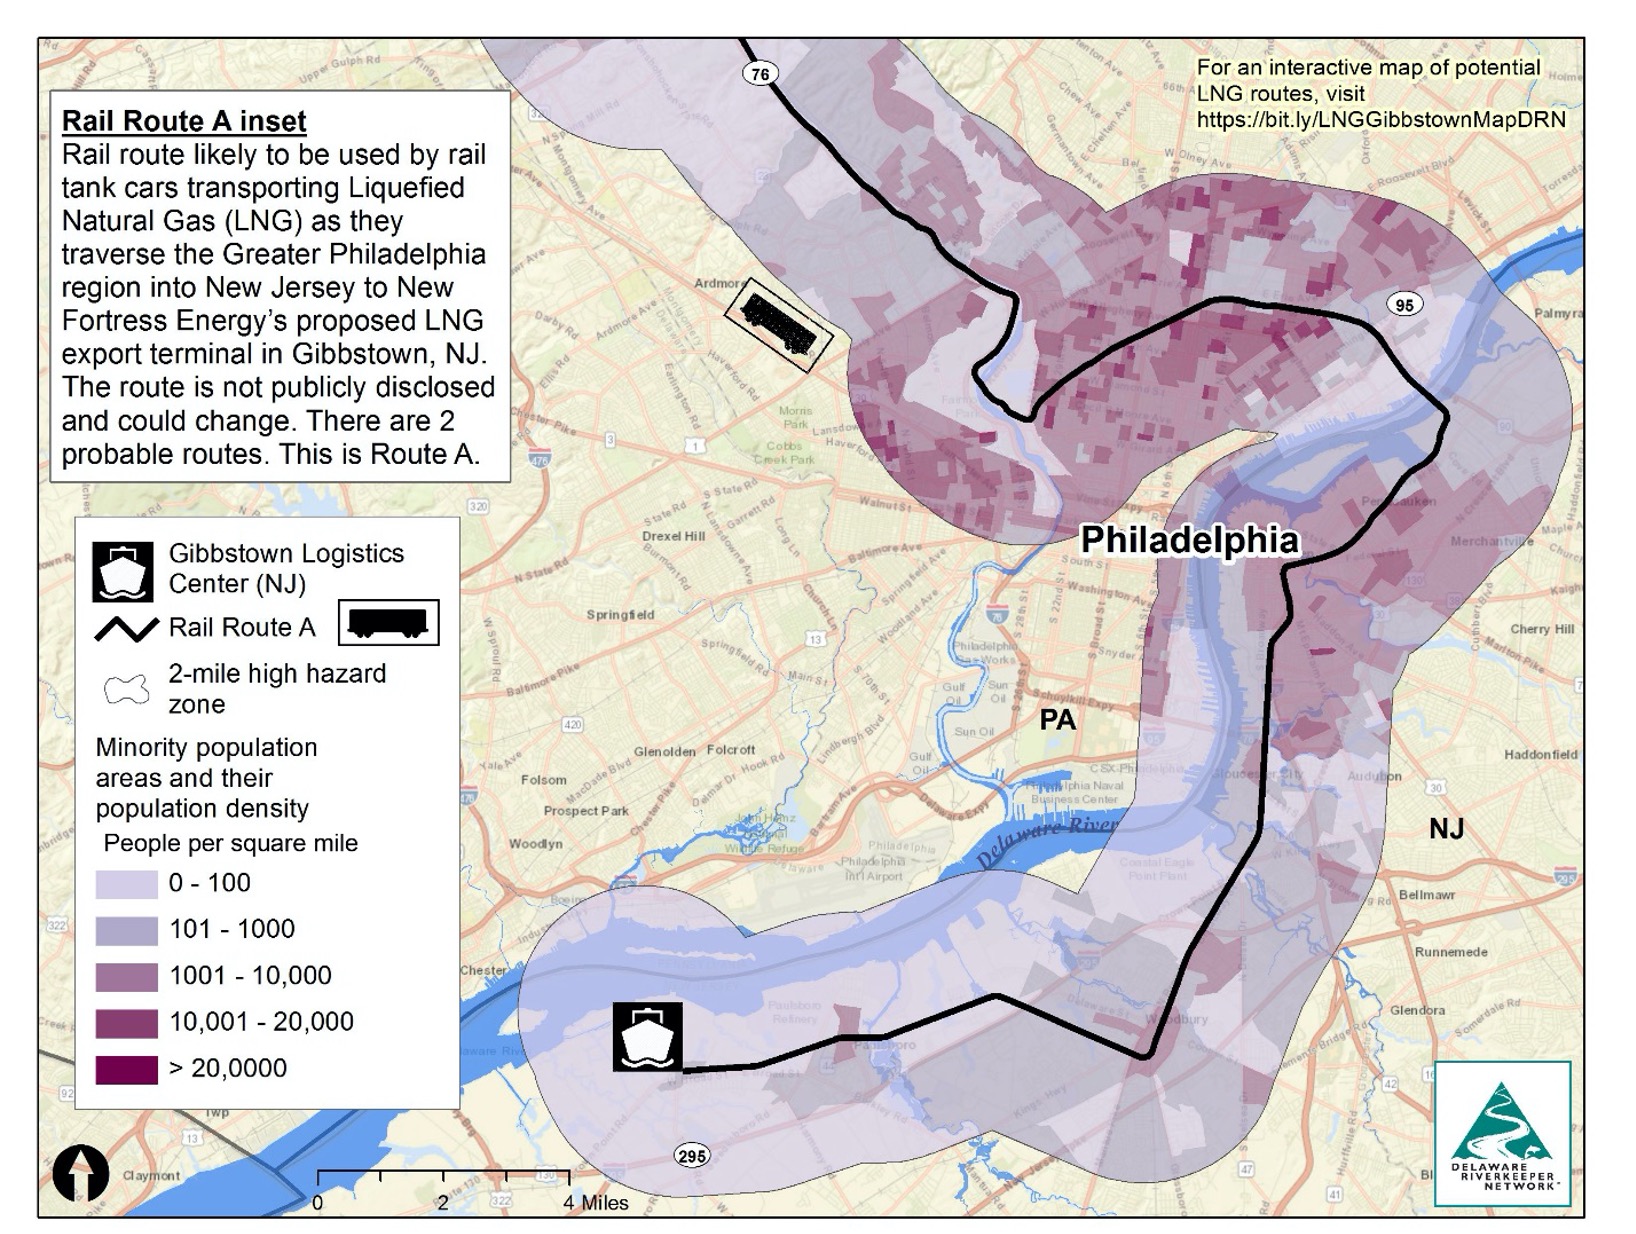
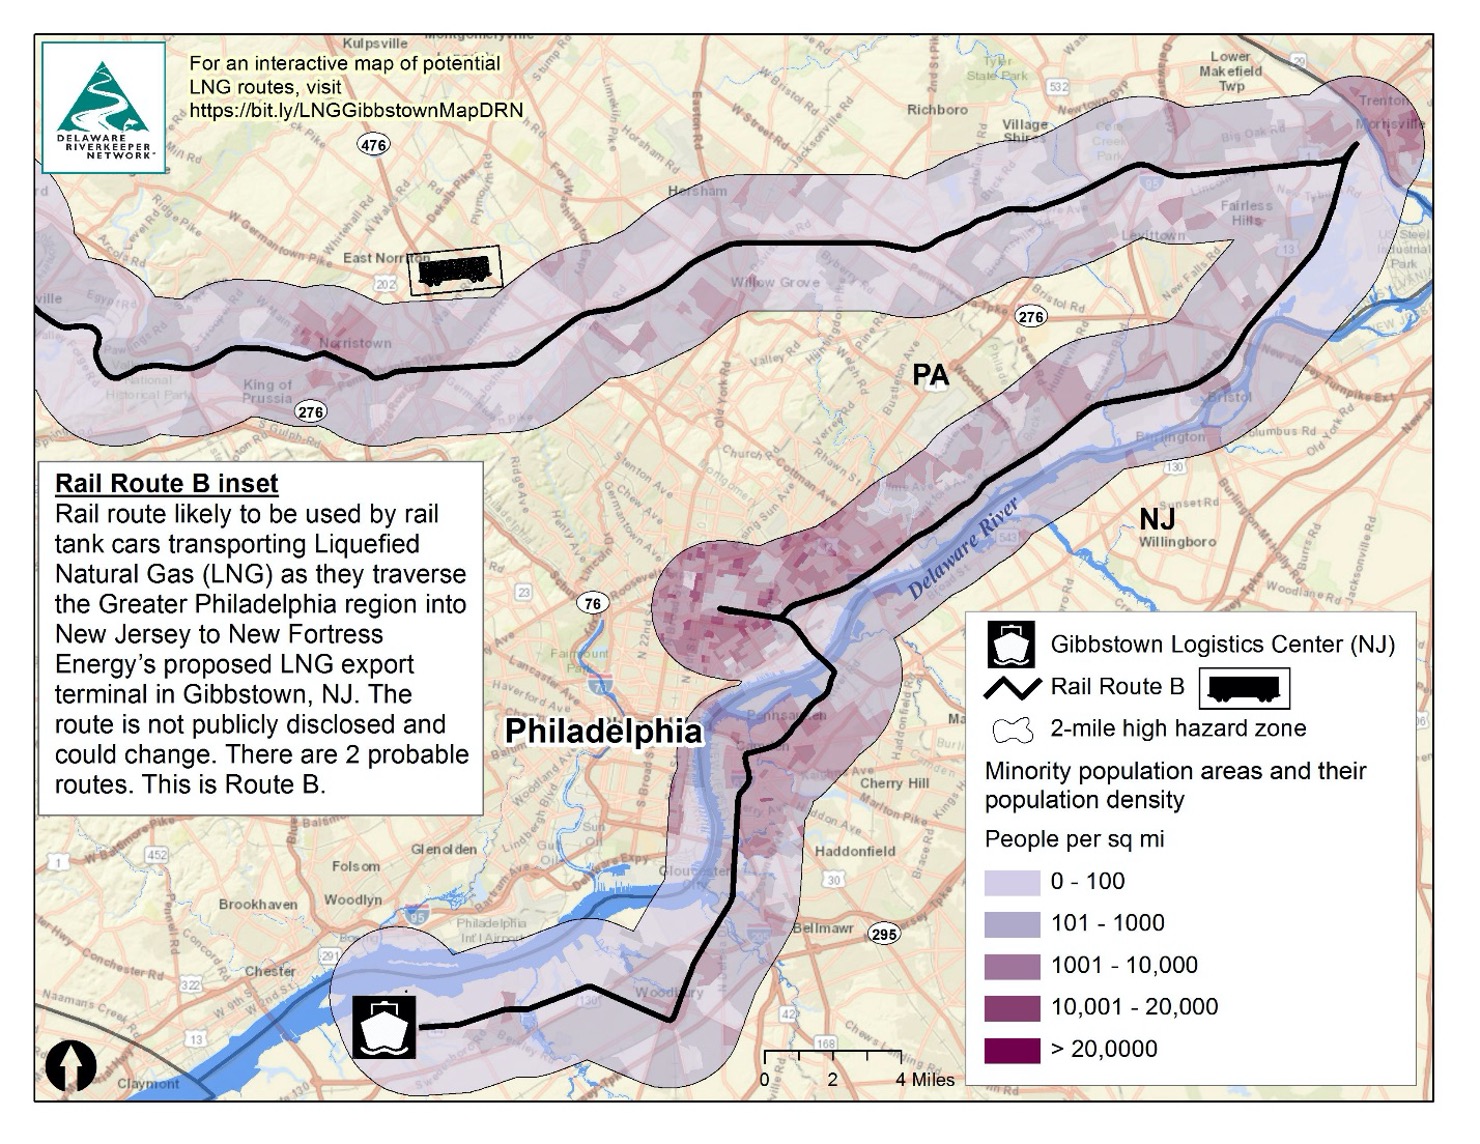
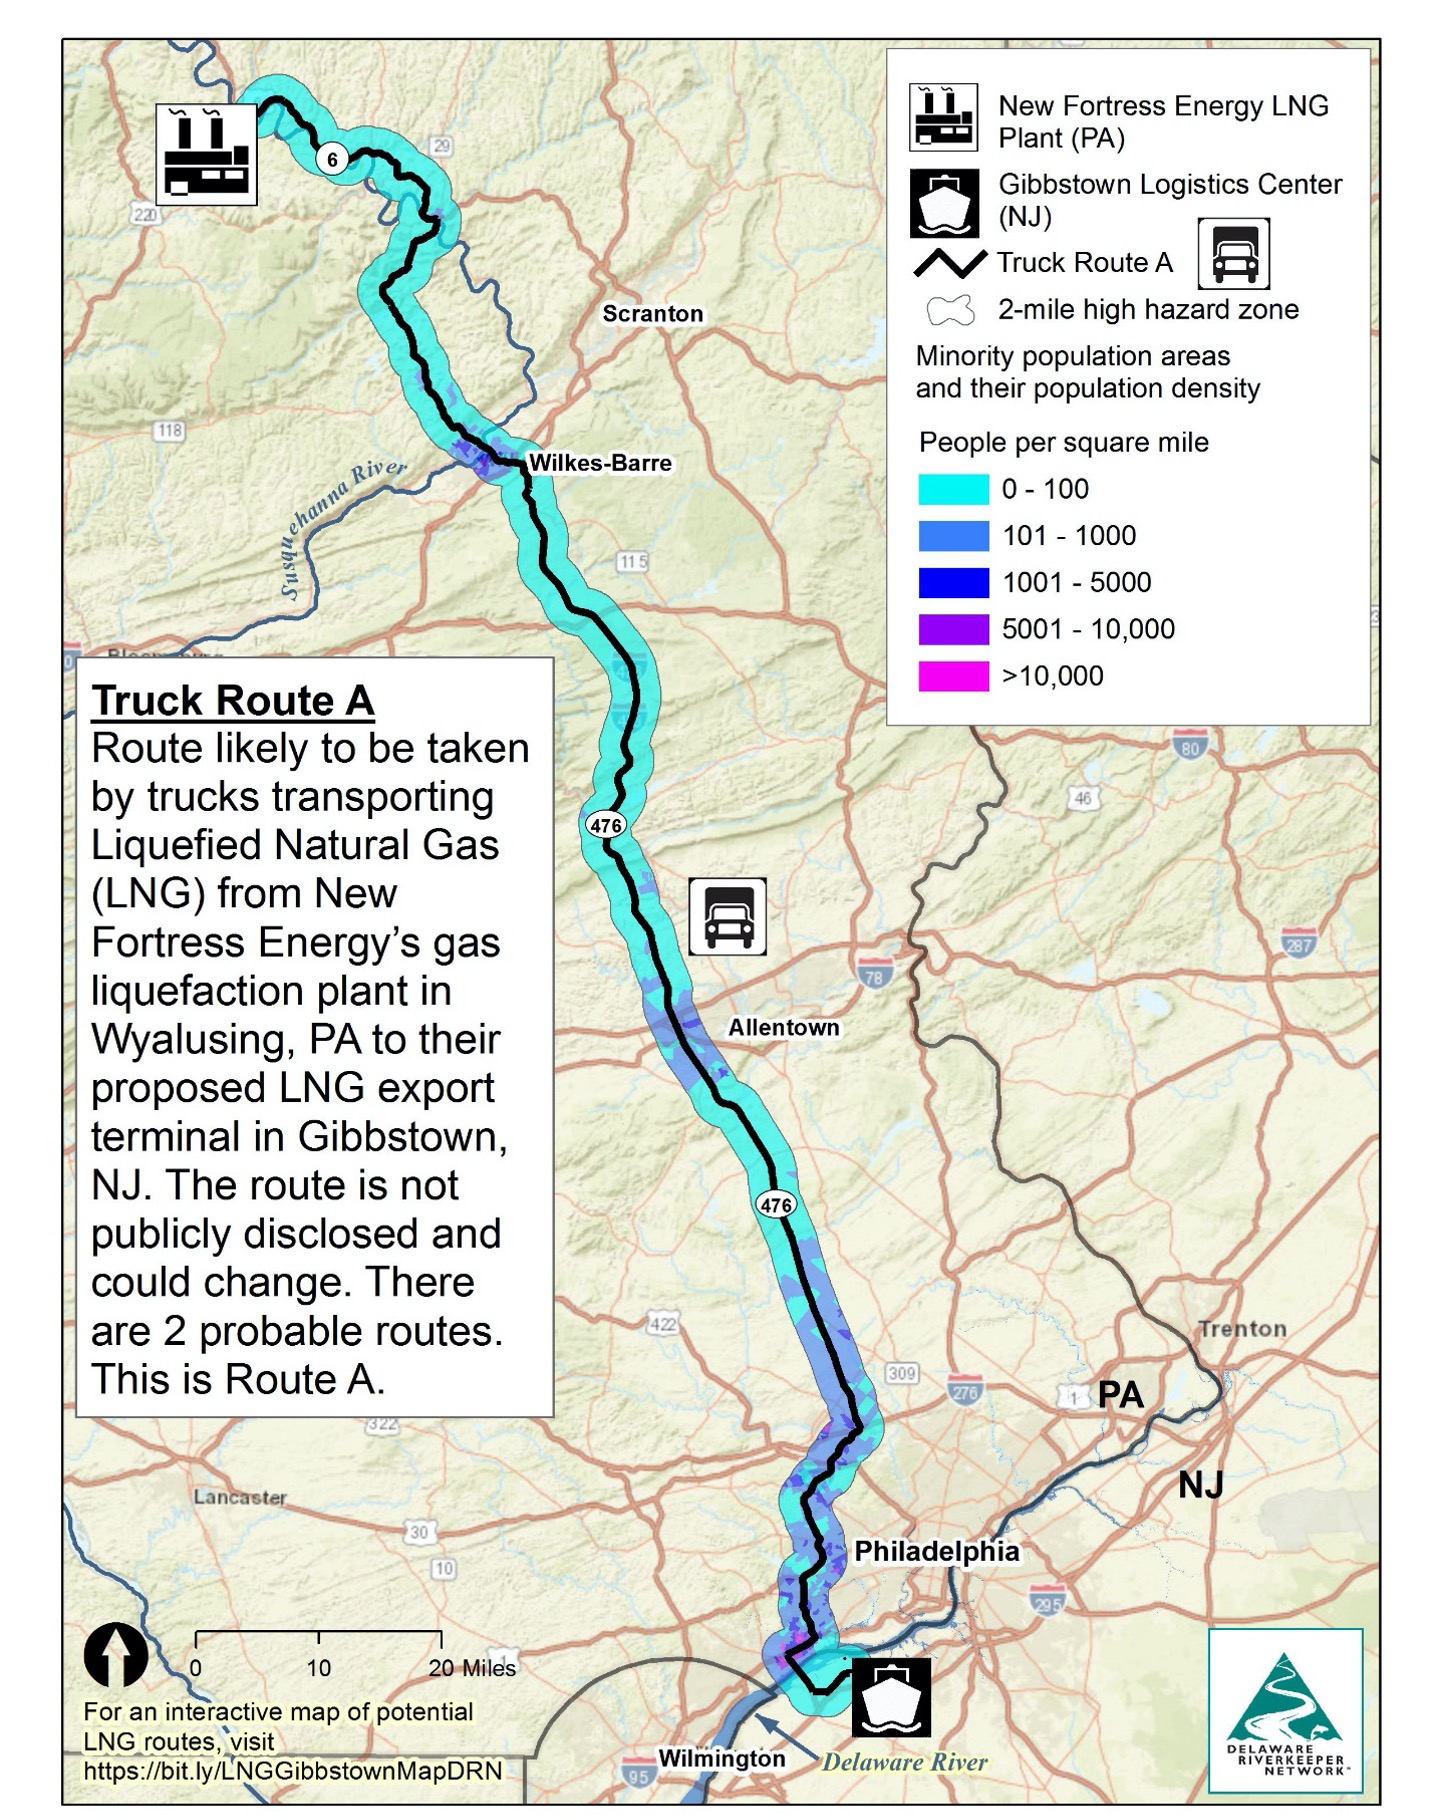
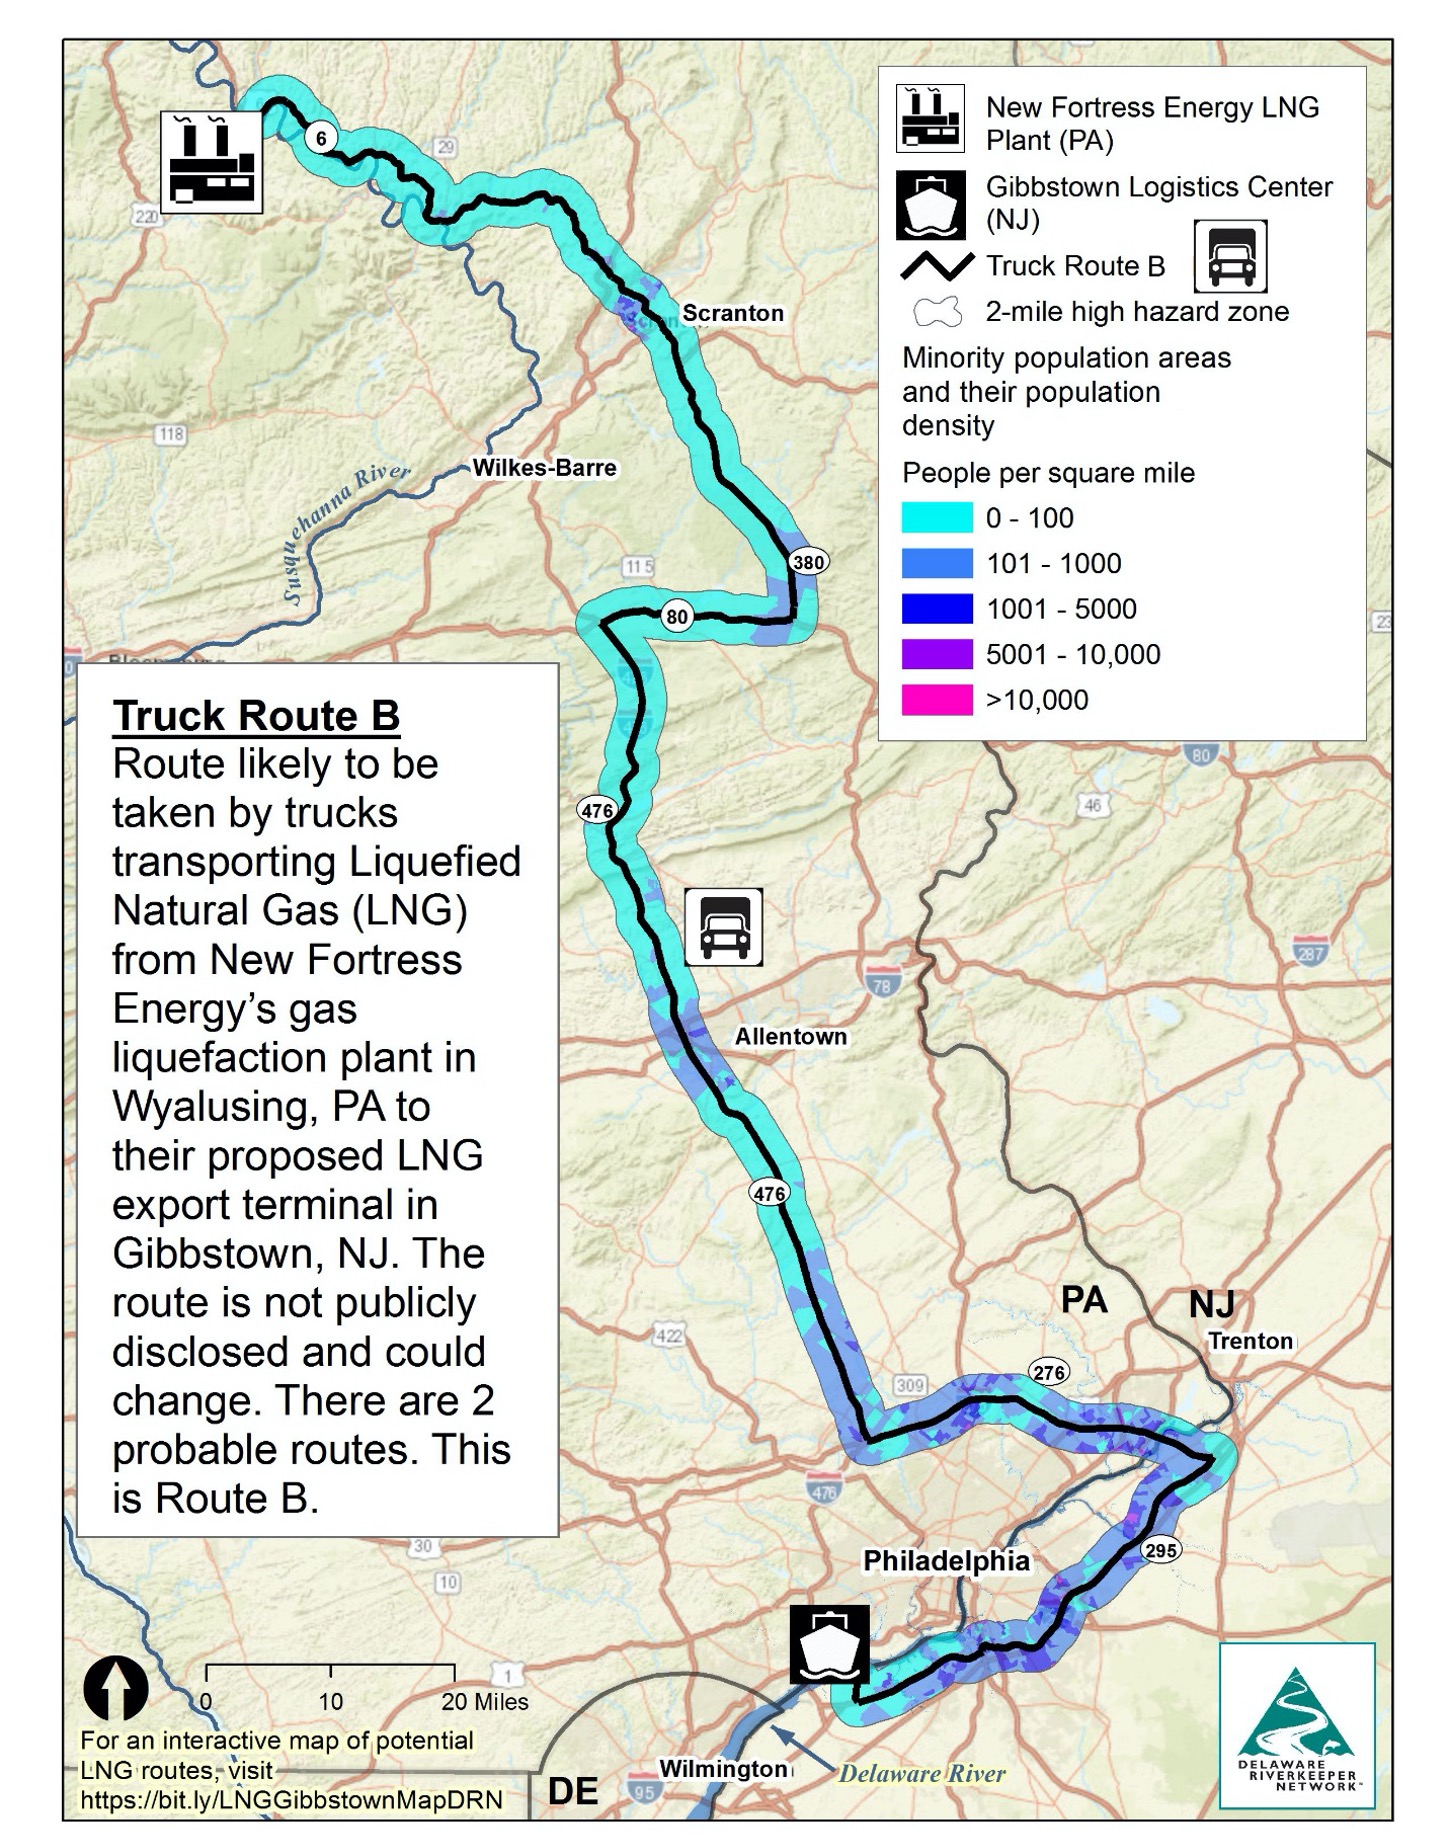
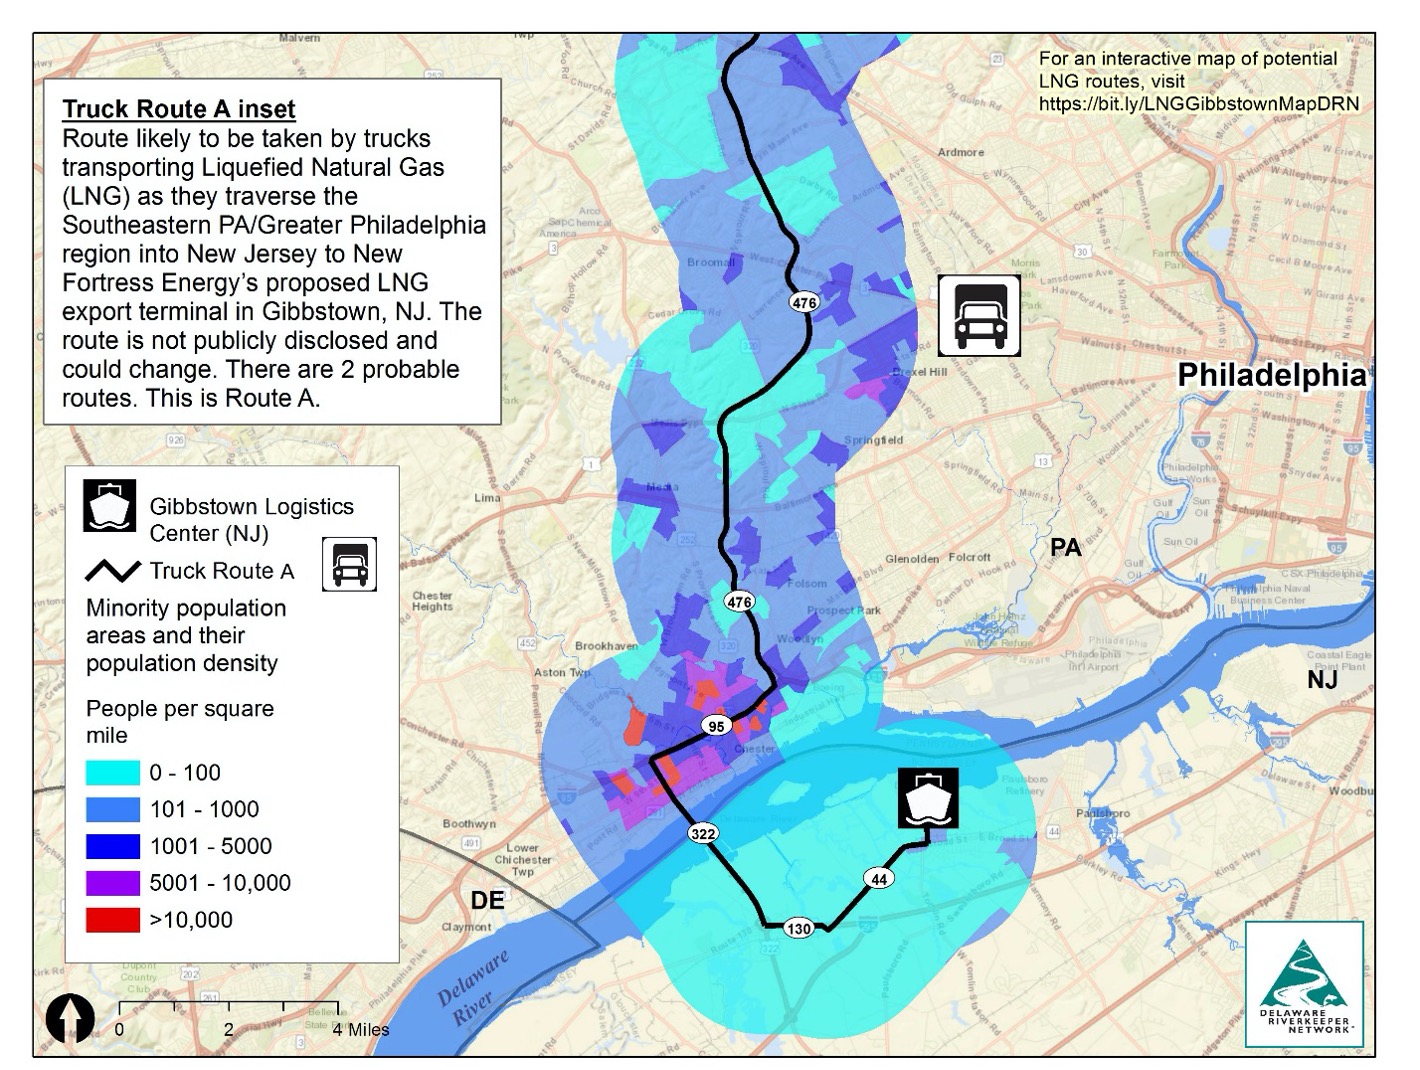
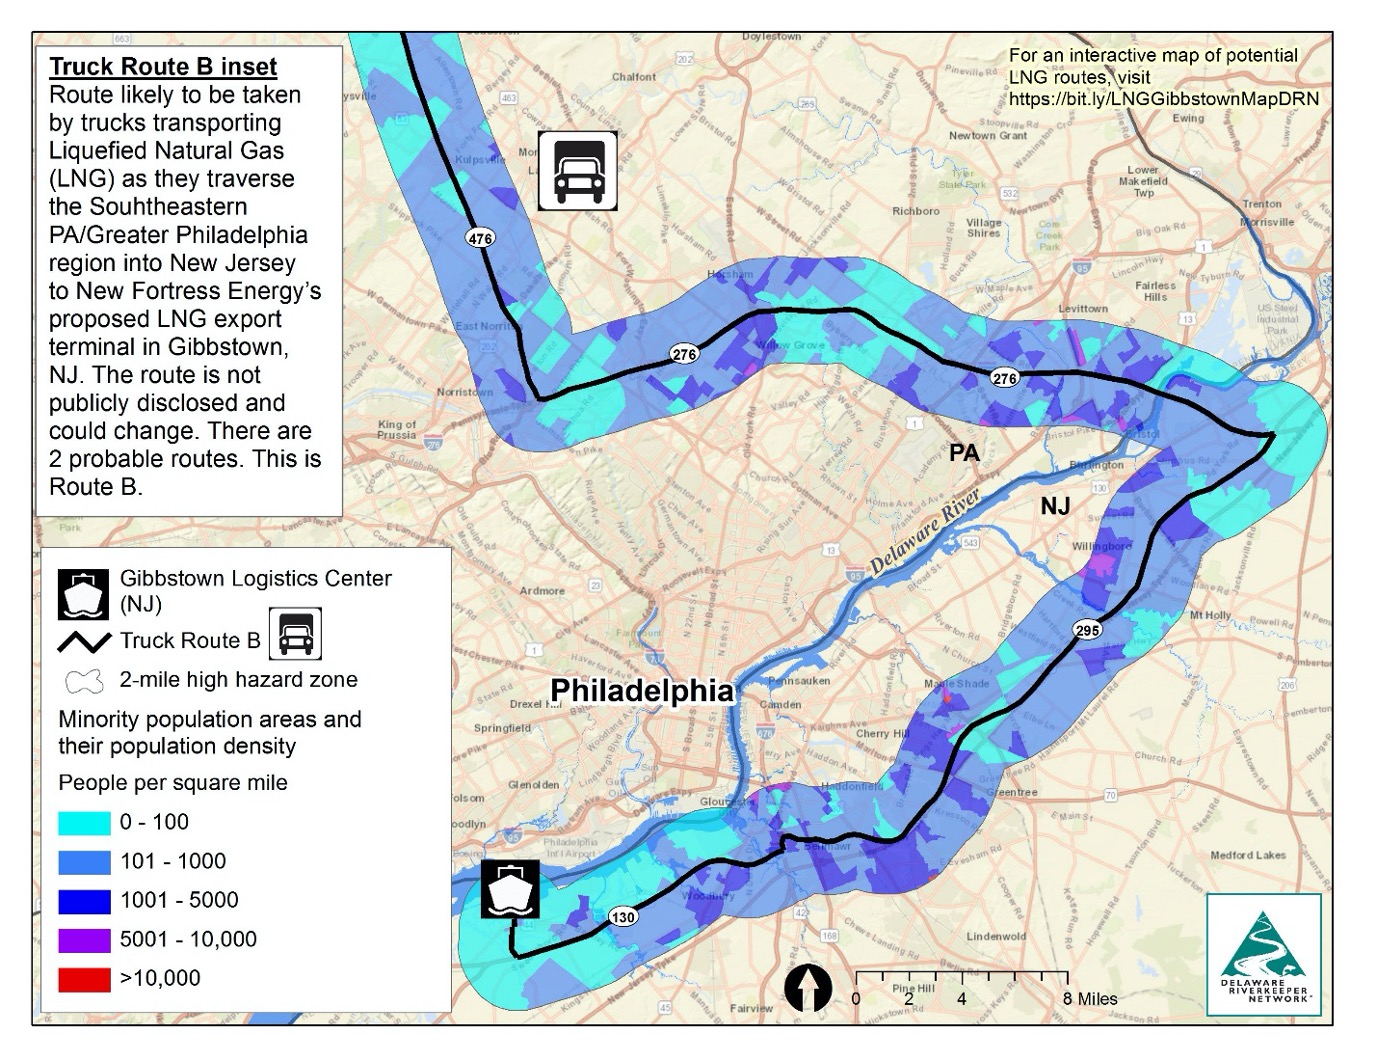
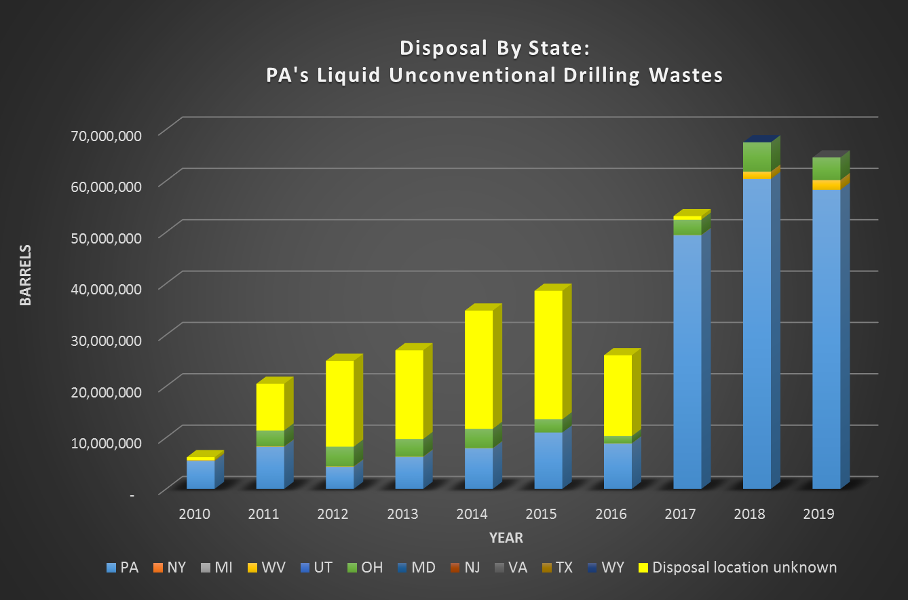
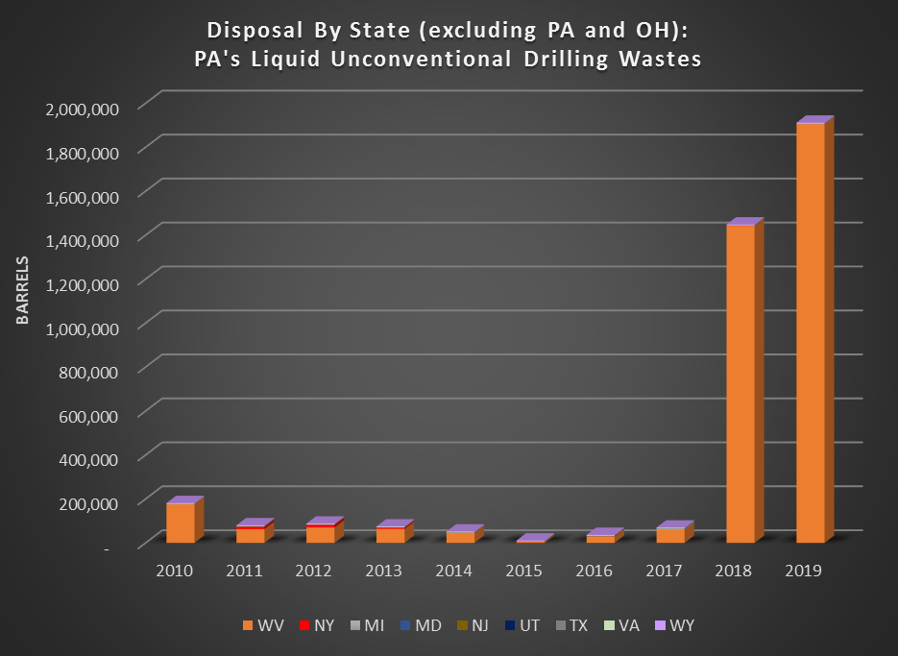
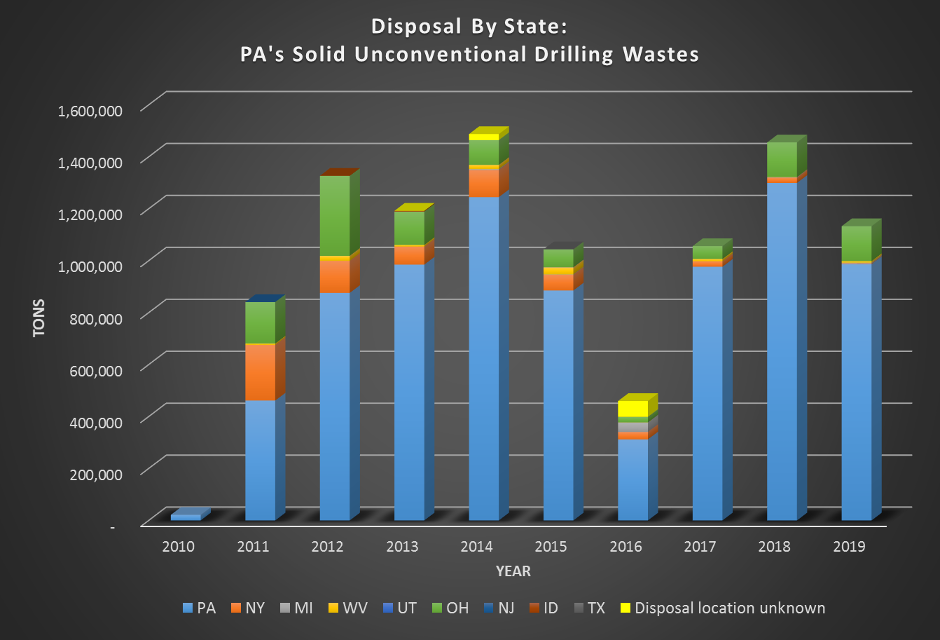
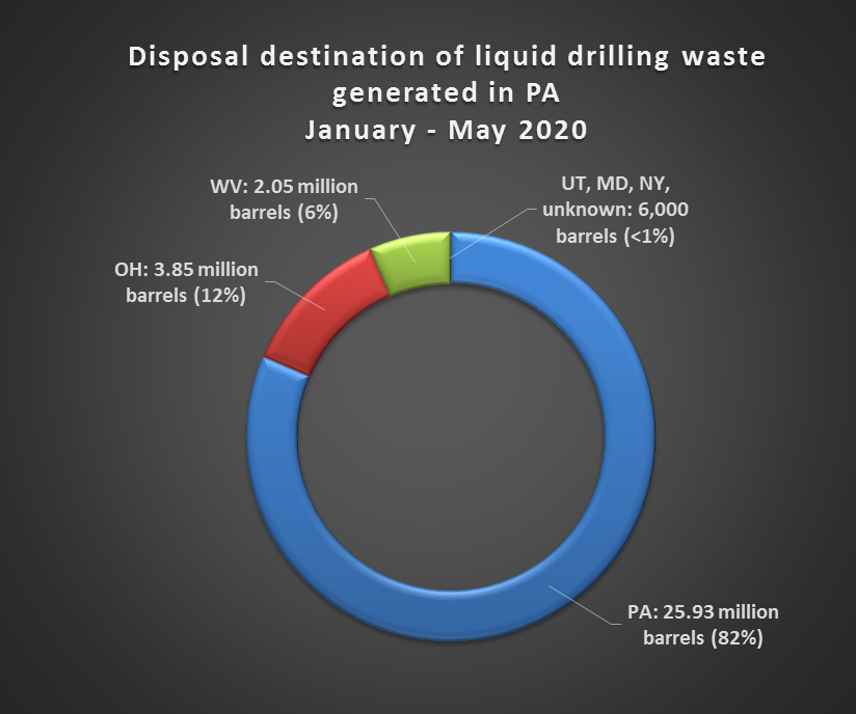
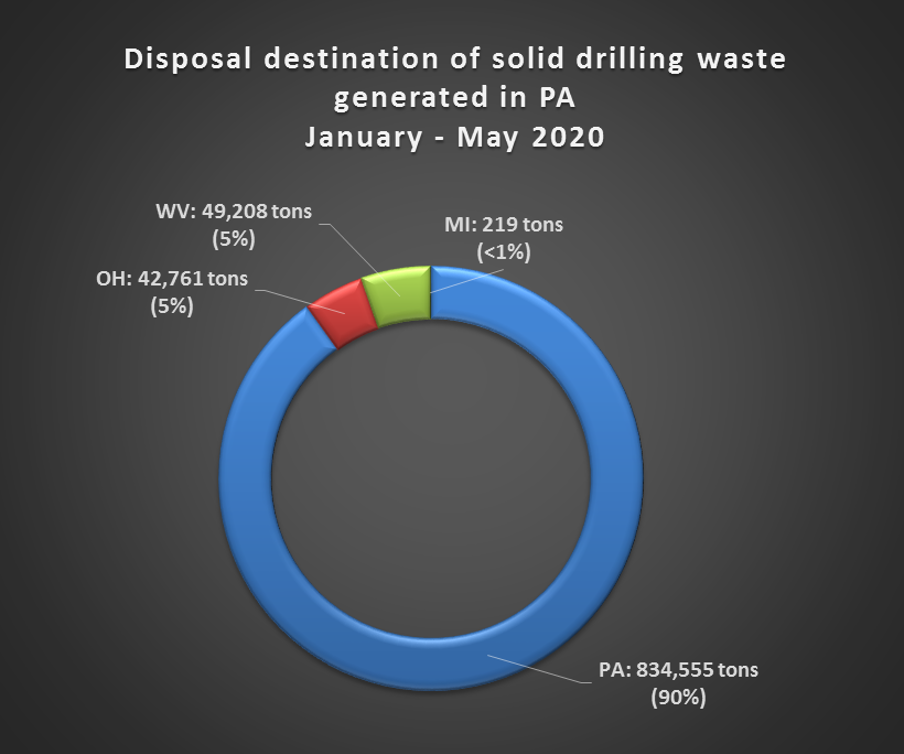
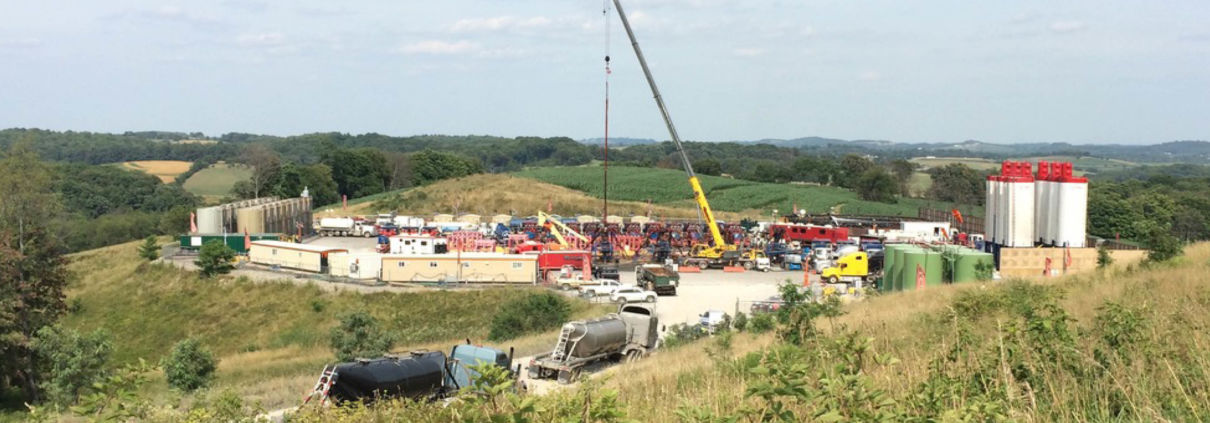 Image courtesy of Lois Bower-Bjornson from the Clean Air Council.