By: Wendy Fan, FracTracker Alliance Intern
North America consists of a vast network of inter- and intrastate pipelines that serve a vital role in transporting water, hazardous liquids, and raw materials. There is an estimated 2.6 million miles of pipelines in the nation, and it delivers trillions of cubic feet of natural gas and hundreds of billions of tons of liquid petroleum products each year. Because the pipeline network fuels the nation’s daily functions and livelihoods by delivering resources used for energy purposes, it is crucial to shed light on this transportation system. This article briefly discusses oil and gas pipelines, what they are, why they exist, their potential health and environmental impacts, proposed projects, and who oversees them.
What are pipelines, and what are they used for?

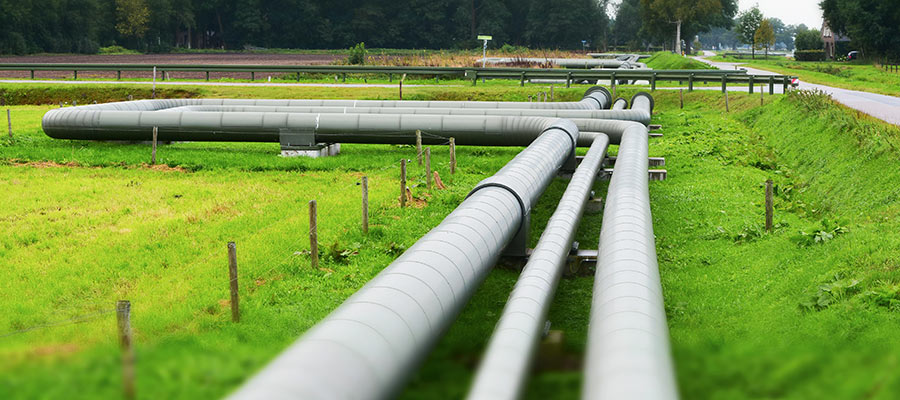
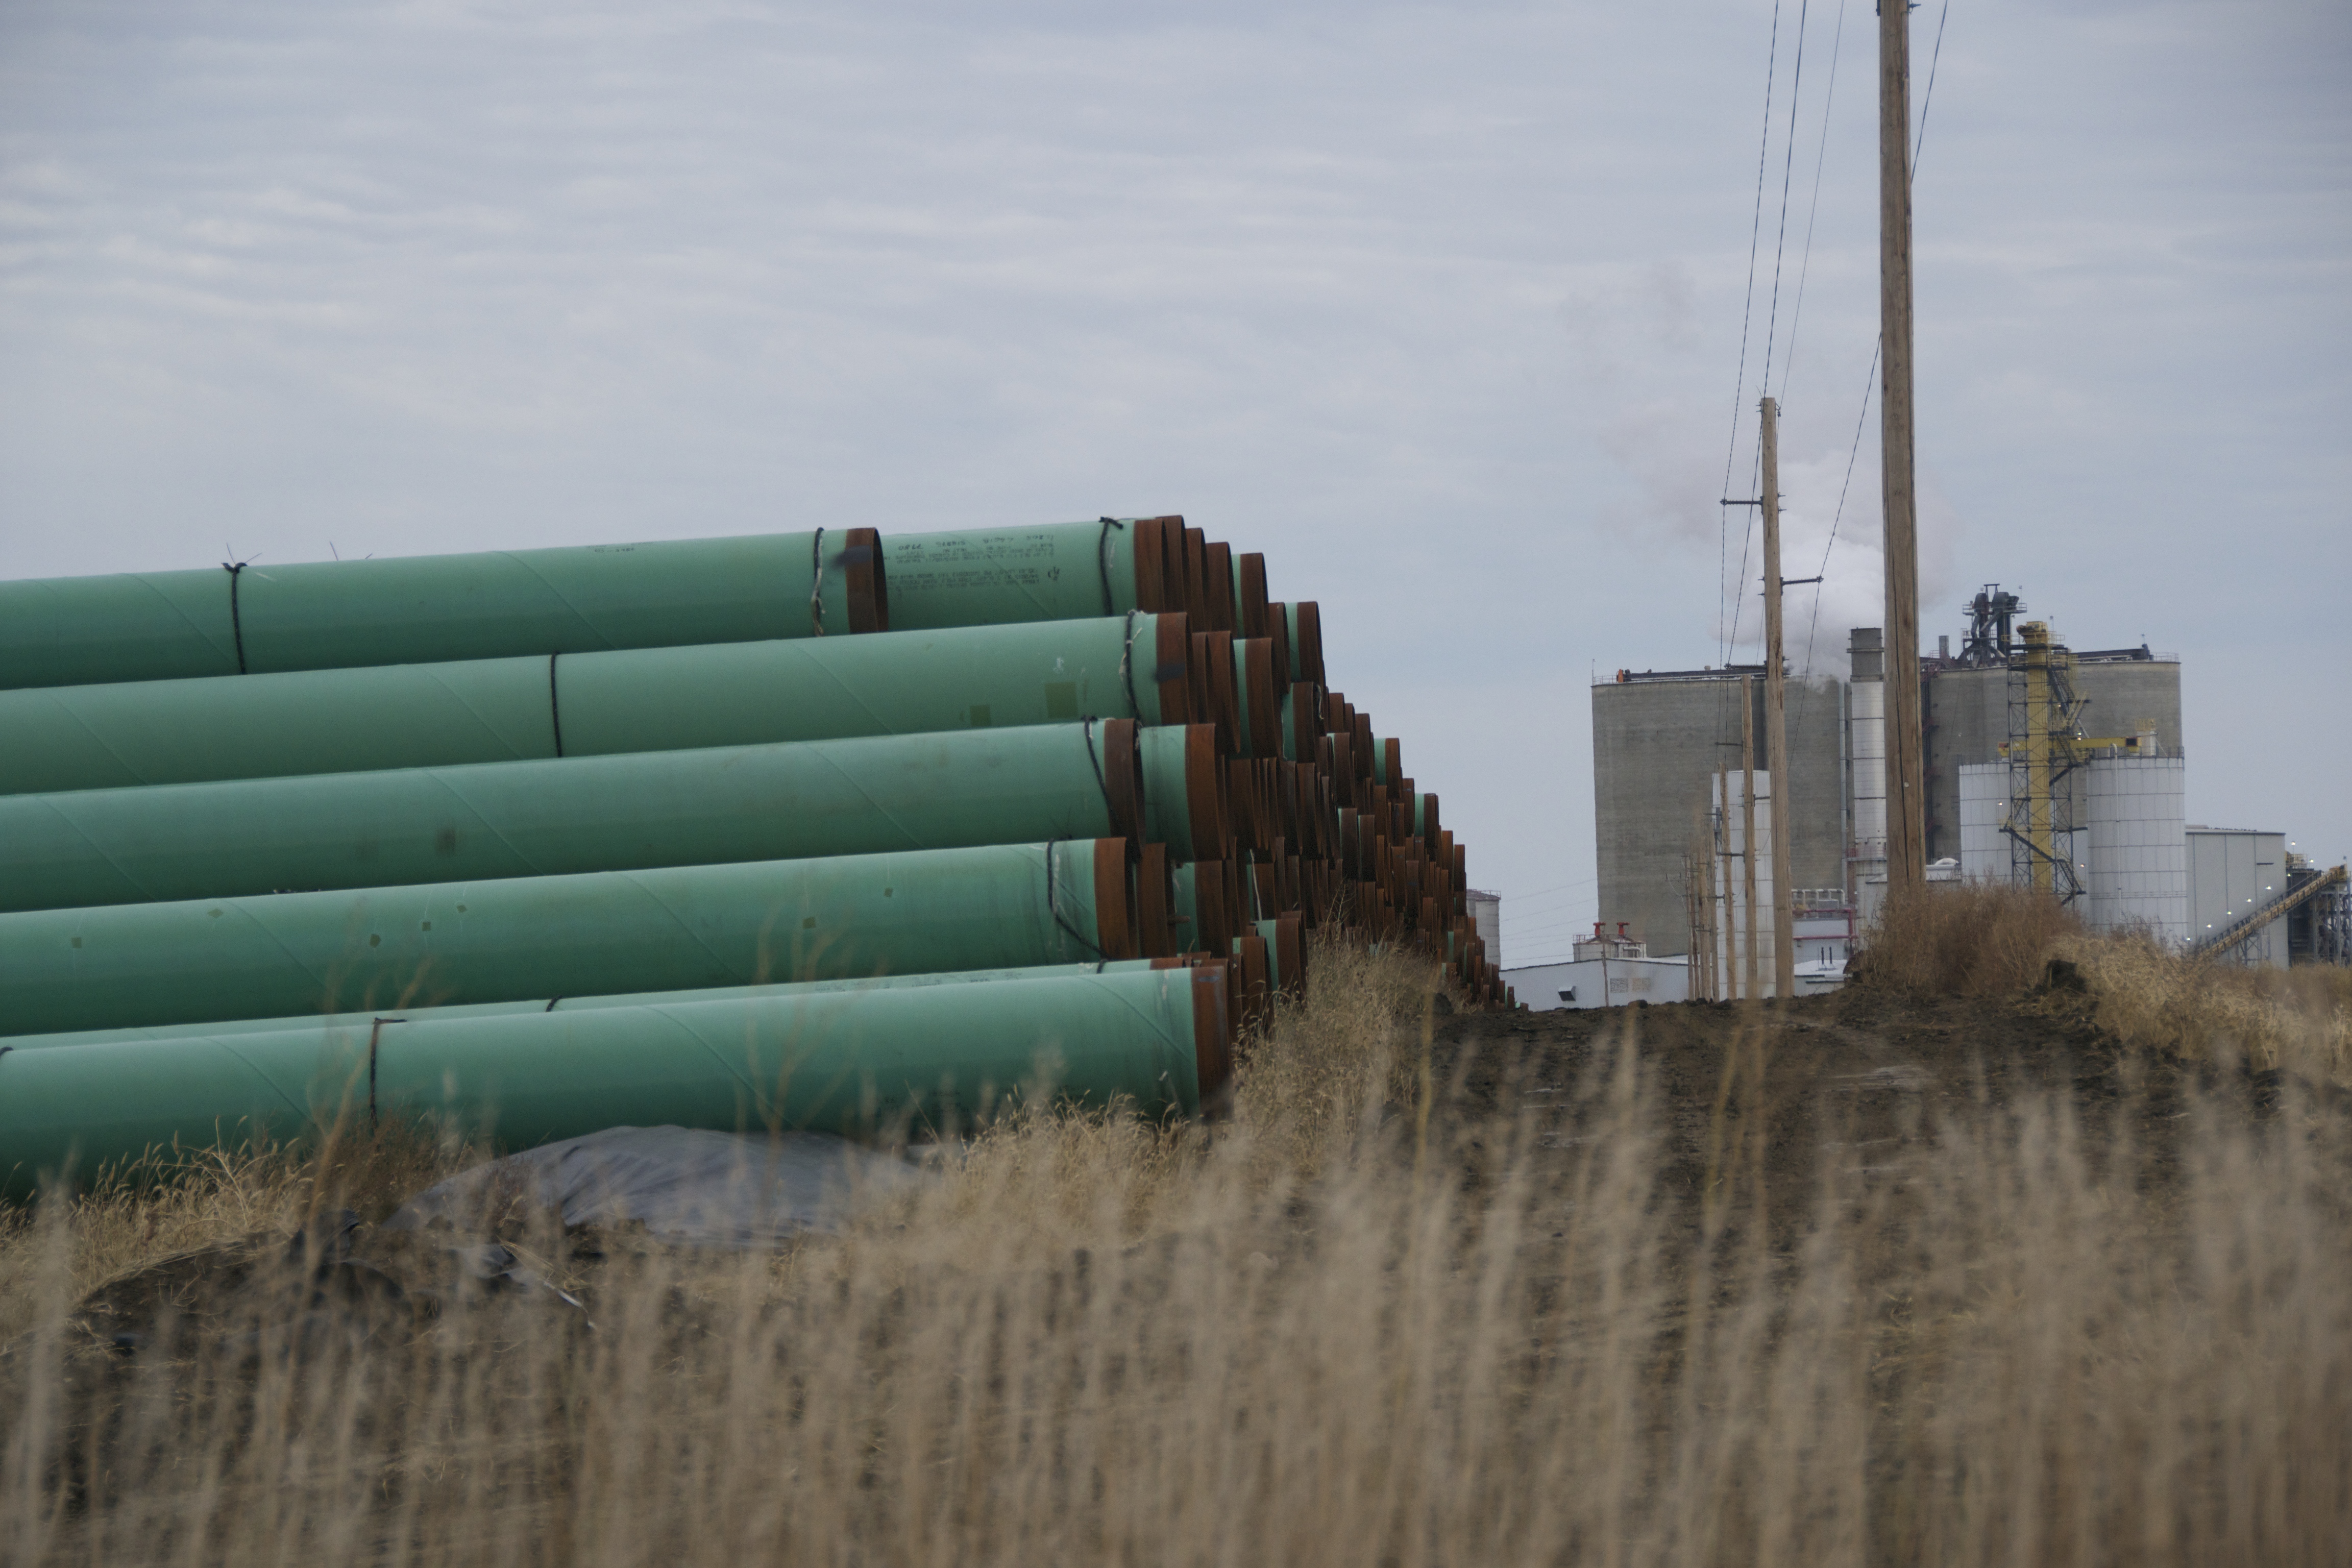
Pipelines in North Dakota. Photo credit: Kathryn Hilton
The pipeline network in the U.S. is a transportation system used to move goods and materials. Pipelines transport a variety of products such as sewage and water. However, the most common products transported are for energy purposes, which include natural gas, biofuels, and liquid petroleum. Pipelines exist throughout the country, and they vary by the goods transported, the size of the pipes, and the material used to make pipes.
While some pipelines are built above ground, the majority of pipelines in the U.S. are buried underground. Because oil and gas pipelines are well concealed from the public, most individuals are unaware of the existence of the vast network of pipelines.
Extent of U.S. Pipeline System
The United States has the most miles of pipelines than any other country, with 1,984,321 km (1,232,999 miles) in natural gas transport and 240,711 km (149,570 miles) in petroleum products. The country with the second most miles of pipelines is Russia with 163,872 km (101,825 miles), and then Canada with 100,000 km (62,137 miles).
Types of Oil and Gas Pipelines
There are two main categories of pipelines used to transport energy products: petroleum pipelines and natural gas pipelines.
- Petroleum pipelines transport crude oil or natural gas liquids, and there are three main types of petroleum pipelines involved in this process: gathering systems, crude oil pipeline systems, and refined products pipelines systems. The gathering pipeline systems gather the crude oil or natural gas liquid from the production wells. It is then transported with the crude oil pipeline system to a refinery. Once the petroleum is refined into products such as gasoline or kerosene, it is transported via the refined products pipeline systems to storage or distribution stations.
- Natural gas pipelines transport natural gas from stationary facilities such as gas wells or import/export facilities, and deliver to a variety of locations, such as homes or directly to other export facilities. This process also involves three different types of pipelines: gathering systems, transmission systems, and distribution systems. Similar to the petroleum gathering systems, the natural gas gathering pipeline system gathers the raw material from production wells. It is then transported with large lines of transmission pipelines that move natural gas from facilities to ports, refiners, and cities across the country. Lastly, the distribution systems consist of a network that distributes the product to homes and businesses. The two types of distribution systems are the main distribution line, which are larger lines that move products close to cities, and the service distribution lines, which are smaller lines that connect main lines into homes and businesses.
Right-of-Way (ROW)
Before pursuing plans to build new pipelines, a ROW needs to be secured from private and public landowners, which pipeline companies usually will pay for. ROW are easements that must be agreed and signed upon by both the landowner and pipeline company, and permits pipeline operators to go forth with installing and maintaining pipelines on that land. Pipeline operators can obtain ROW by purchasing the property or through a court-ordered procedure. ROW can be permanent or temporary acquisitions, and needs approval from FERC.
Regulatory Oversight
Depending on the type of pipeline, what it is transferring, what it is made of, and where it runs, there are various federal or state agencies that have jurisdiction over its regulatory affairs.
A. Federal Energy Regulatory Commission (FERC)
Interstate pipelines, those that either physically cross state boundaries or carry product that will cross state boundaries, are all permitted by the Federal Energy Regulatory Commission (FERC). The FERC is an independent organization within the U.S. Department of Energy that permits interstate electricity and natural gas infrastructure. The FERC’s authority lies within various acts of energy legislation, beginning with the Natural Gas Act of 1938 to the more recent Energy Policy Act of 2005. The U.S. President appoints its four commissioners. Other agencies such as the Dept. of Transportation, regional authorities such as the River Basin Commissions, and the Army Corps of Engineers may also be involved. FERC approves the location, construction, operation, and abandonment of interstate pipelines. They do not have jurisdiction over the siting of intrastate natural gas pipelines nor hazardous liquids.
B. Pipeline and Hazardous Materials Administration (PHMSA)
Under the U.S. Department of Transportation, the PHMSA oversees, develops, and enforces regulations to ensure the safe and environmentally sound pipeline transportation system. There are two offices within the PHMSA that fulfill these goals. The Office of Hazardous Materials Safety develops regulations and standards for classifying, handling, and packaging hazardous materials. The Office of Pipeline Safety develops regulations and risk management approaches to assure safe pipeline transportation, and ensures safety in the design, construction, operation and maintenance, and spill response of hazardous liquid and natural gas pipeline transportation. Below are some regulations enforced by PHMSA:
1. Pipeline Safety, Regulatory Certainty, and Job Creation Act of 2011 or Pipeline Safety Act 2011
This act reauthorizes PHMSA to continue with the examination and improvement of the pipeline safety regulations. It allows PHMSA to:
- Provide the regulatory certainty necessary for pipeline owners and operators to plan infrastructure investments and create jobs
- Improve pipeline transportation by strengthening enforcement of current laws and improving existing laws where necessary
- Ensure a balanced regulatory approach to improving safety that applies cost-benefit principles
- Protect and preserve Congressional authority by ensuring certain key rule-makings are not finalized until Congress has an opportunity to act
2. Federal Pipeline Safety Regulations: Public Awareness Programs
- Enforced by PHMSA, the Public Awareness Program mandates that pipeline companies and operators to develop and implement public awareness programs that follow guidance provided by the American Petroleum Institute.
- Under this regulation, pipeline operators must provide the public with information on how to recognize, respond, and report to pipeline emergencies.
3. Natural Gas Pipeline Safety Act of 1968
- This act authorizes the Department of Transportation to regulate pipeline transportation of flammable, toxic, or corrosive natural gas, or other gases, as well as transportation and storage of liquefied natural gas.
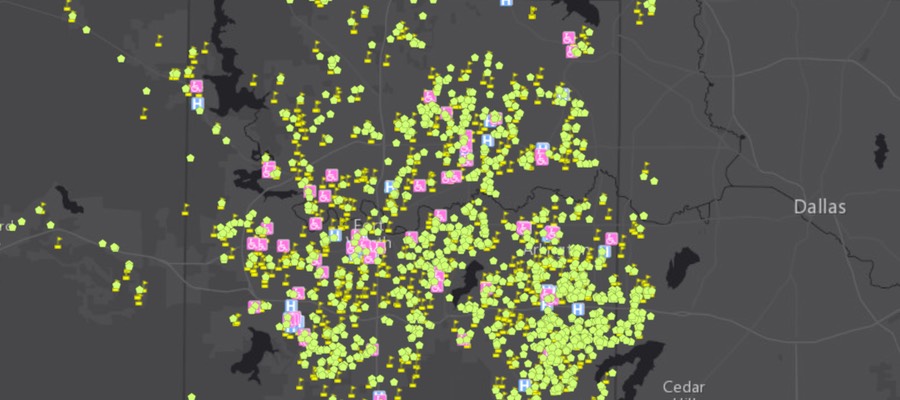
The PHMSA also designed an interactive national pipeline mapping system for the public to access and utilize. However, the map can only be viewed one county at a time, it does not include distribution or gathering lines, and when you zoom in too far, the pipelines disappear. In fact, the site warns that the map should not be used to determine accurate locations of pipelines, stating that the locations can be incorrect by up to 500 ft. PHMSA argues that these restrictions exist in the interest of national security.
C. United States Army Corps of Engineers
Permits must be obtained from the U.S. Army Corps of Engineers if a pipeline is to be constructed through navigable bodies of water, including wetlands. State environmental regulatory agencies, such as PA’s Department of Environmental Protection, are also involved in the approval process of pipeline construction through waterways and wetlands.
Environmental Health and Safety Risks
Although pipeline transportation of natural gas and petroleum is considered safer and cheaper than ground transportation, pipeline failures, failing infrastructure, human error, and natural disasters can result in major pipeline disasters. As such, previous incidents have been shown to cause detrimental effects to the environment and the public’s safety.
A. Land Use and Forest Fragmentation

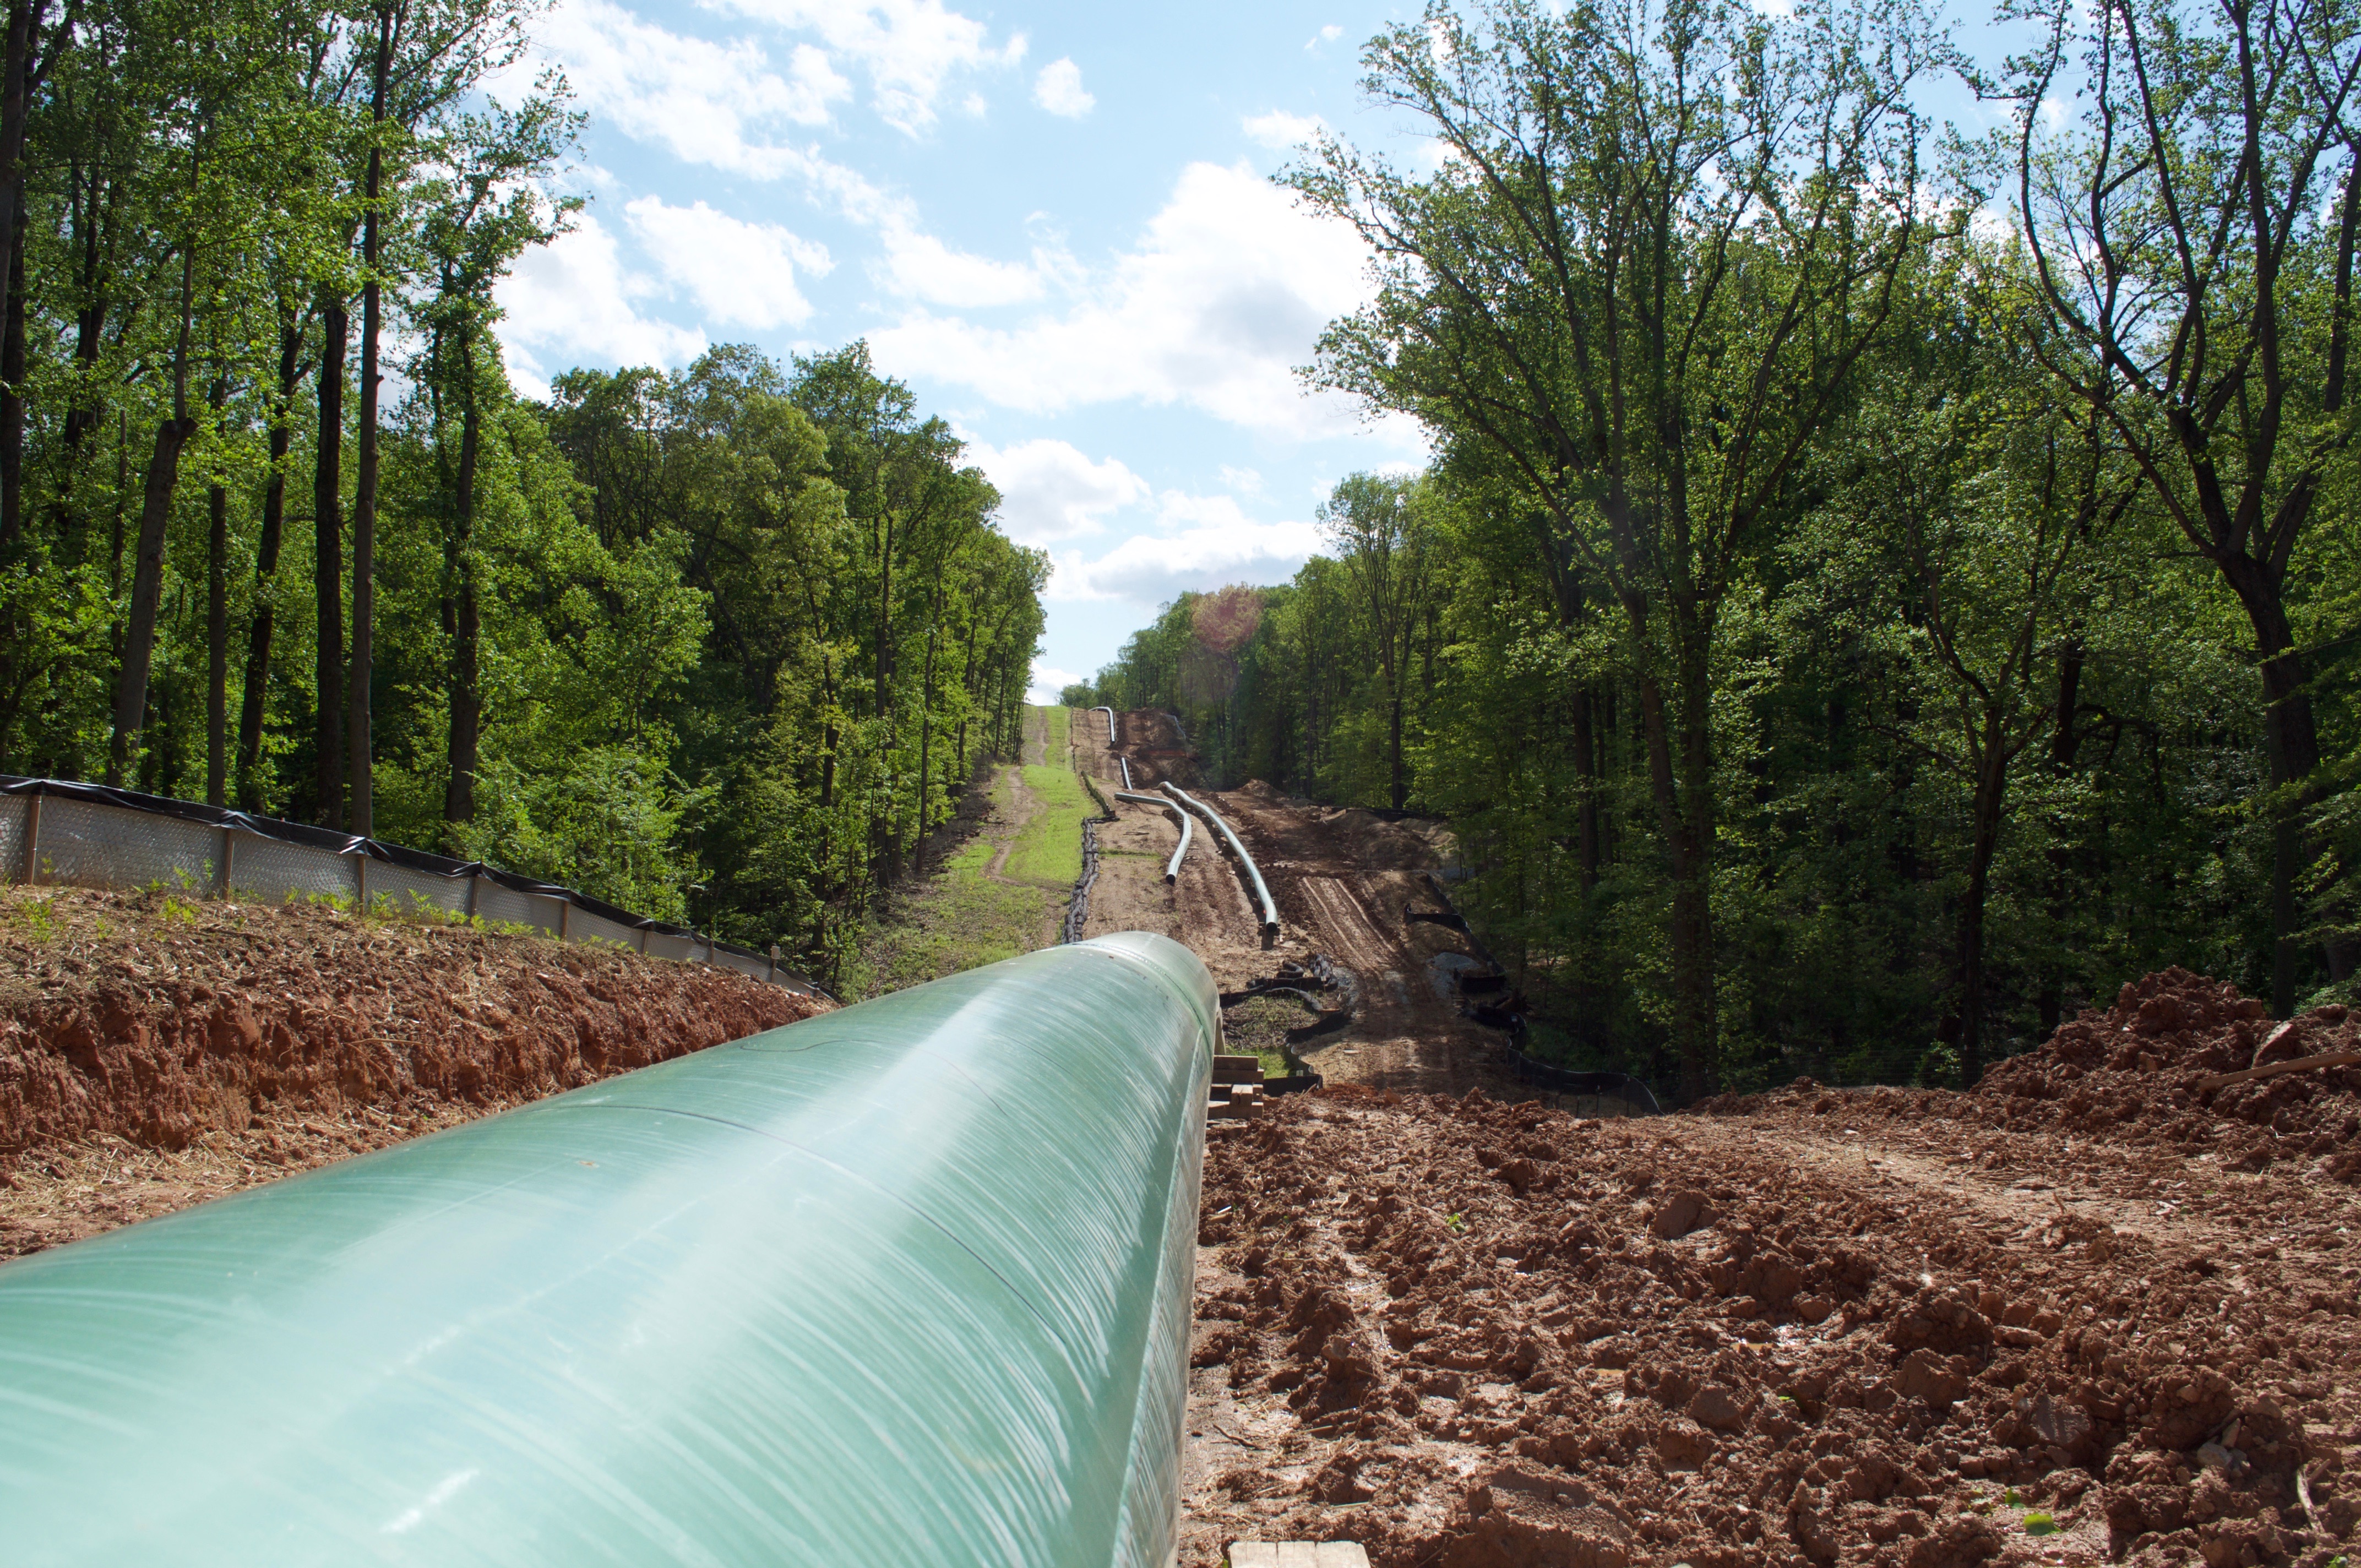
Construction staging area and the right-of-way of Columbia’s 26″ Pipeline. Photo credit: Sierra Shamer
In order to bury pipelines underground, an extensive amount of forest and land is cleared out to meet the pipe’s size capacity. States, such as Pennsylvania, that consist of rich ecosystem due to their abundance of forests, are at critical risk of diminishing habitats for plant species, and are at risk of the eradication of certain animal species. The U.S. Geological Survey (USGS) aimed to quantify the amount of land disturbance in Bradford and Washington counties in PA as a result of oil and gas activity including pipeline implementation. The USGS report concluded that pipeline construction was one of the highest sources of increasing forest patch numbers. Bradford County, PA had an increase of 306 patches, in which 235 were attributable to pipeline construction. Washington County increased by 1,000 patches, in which half was attributable to pipeline construction.
B. Compressor Stations
Compressor stations play an important role in processing and transporting the materials that pass through the pipeline. However, compressor stations present significant environmental health hazards. Even when the process of drilling and fracking is completed, compressor stations remain in the area to keep the gas in pipelines continually flowing. The stationary nature of this air pollution source means that a combination of pollutants such as volatile organic compounds (VOCs), nitrogen oxides (NOx), formaldehyde, and greenhouse gases are continually being released into the atmosphere. These pollutants are known to produce deleterious health impacts to the respiratory system, nervous system, or lung damage. In addition to pollutants emitted, the noise level generated by compressor stations can reach up to 100 decibels. The Center of Disease Control and Prevention (CDC) reports hearing loss can occur by listening to sounds at or above 85 decibels over an extended period of time.
C. Erosion and Sedimentation
Heavy rainfall or storms can lead to excessive soil disruption, in turn increasing opportunities for erosion and sedimentation to occur. Erosion can uncover pipelines buried underground, and rainfall of more than 5 inches (13 cm) can move or erode berms, and also disrupt mounds of soil used to protect against flooding. Soil erosion increases underground pipelines’ vulnerability to damage from scouring or washouts, and damage from debris, vehicles, or boats.
D. Eminent Domain
Eminent domain allows state or federal government bodies to exercise their power to take private property from residents or citizens for public use and development. In some cases, private companies have exercised power to seize land for their own profit. Owners of the property are then given a compensation in exchange for their land. However, landowners may end up spending more than they receive. In order to receive compensation, owners must hire their own appraiser and lawyer, and they are also not usually compensated for the full value of the land. Furthermore, property values decrease once pipelines are established on their land, making it more difficult to sell their home in the future.
E. Spills and Leaks
Poorly maintained and faulty pipelines that transport liquefied natural gas or crude oil may pose high health and environmental risks should the fluids spill or leak into the soil. Crude oil can contain more than 1,000 chemicals that are known carcinogen to humans, such as benzene. The release of the potentially toxic chemical or oil can infiltrate into the soil, exposing communities to fumes in the atmosphere as well as contaminating groundwater and surface water. Not only are the incidents costly to control and clean up, the chemical or oil spills can also have long lasting impacts to the environment and the public. A ruptured pipeline that leaked 33,000 gallons of crude oil in Salt Lake City, Utah in 2010 exposed residents in a nearby community to chemical fumes, causing them to experience drowsiness and lethargy. After being commissioned in 2010, the TransCanada Keystone Pipeline had reported 35 leaks and spills in its first year alone. In April 2016, the Keystone pipeline leaked 17,000 gallons of oil in South Dakota. Older pipelines are more likely to leak than newer ones, so this issue will only increase as pipeline infrastructure ages.
Natural gas pipelines have also been shown to leak methane, a major component in natural gas, at levels that far exceed what is estimated. Not only does methane contribute to climate change, it puts surrounding communities at risk of gas explosions, and exposes them to dangerously high levels of methane in the air they breathe.
F. Explosions

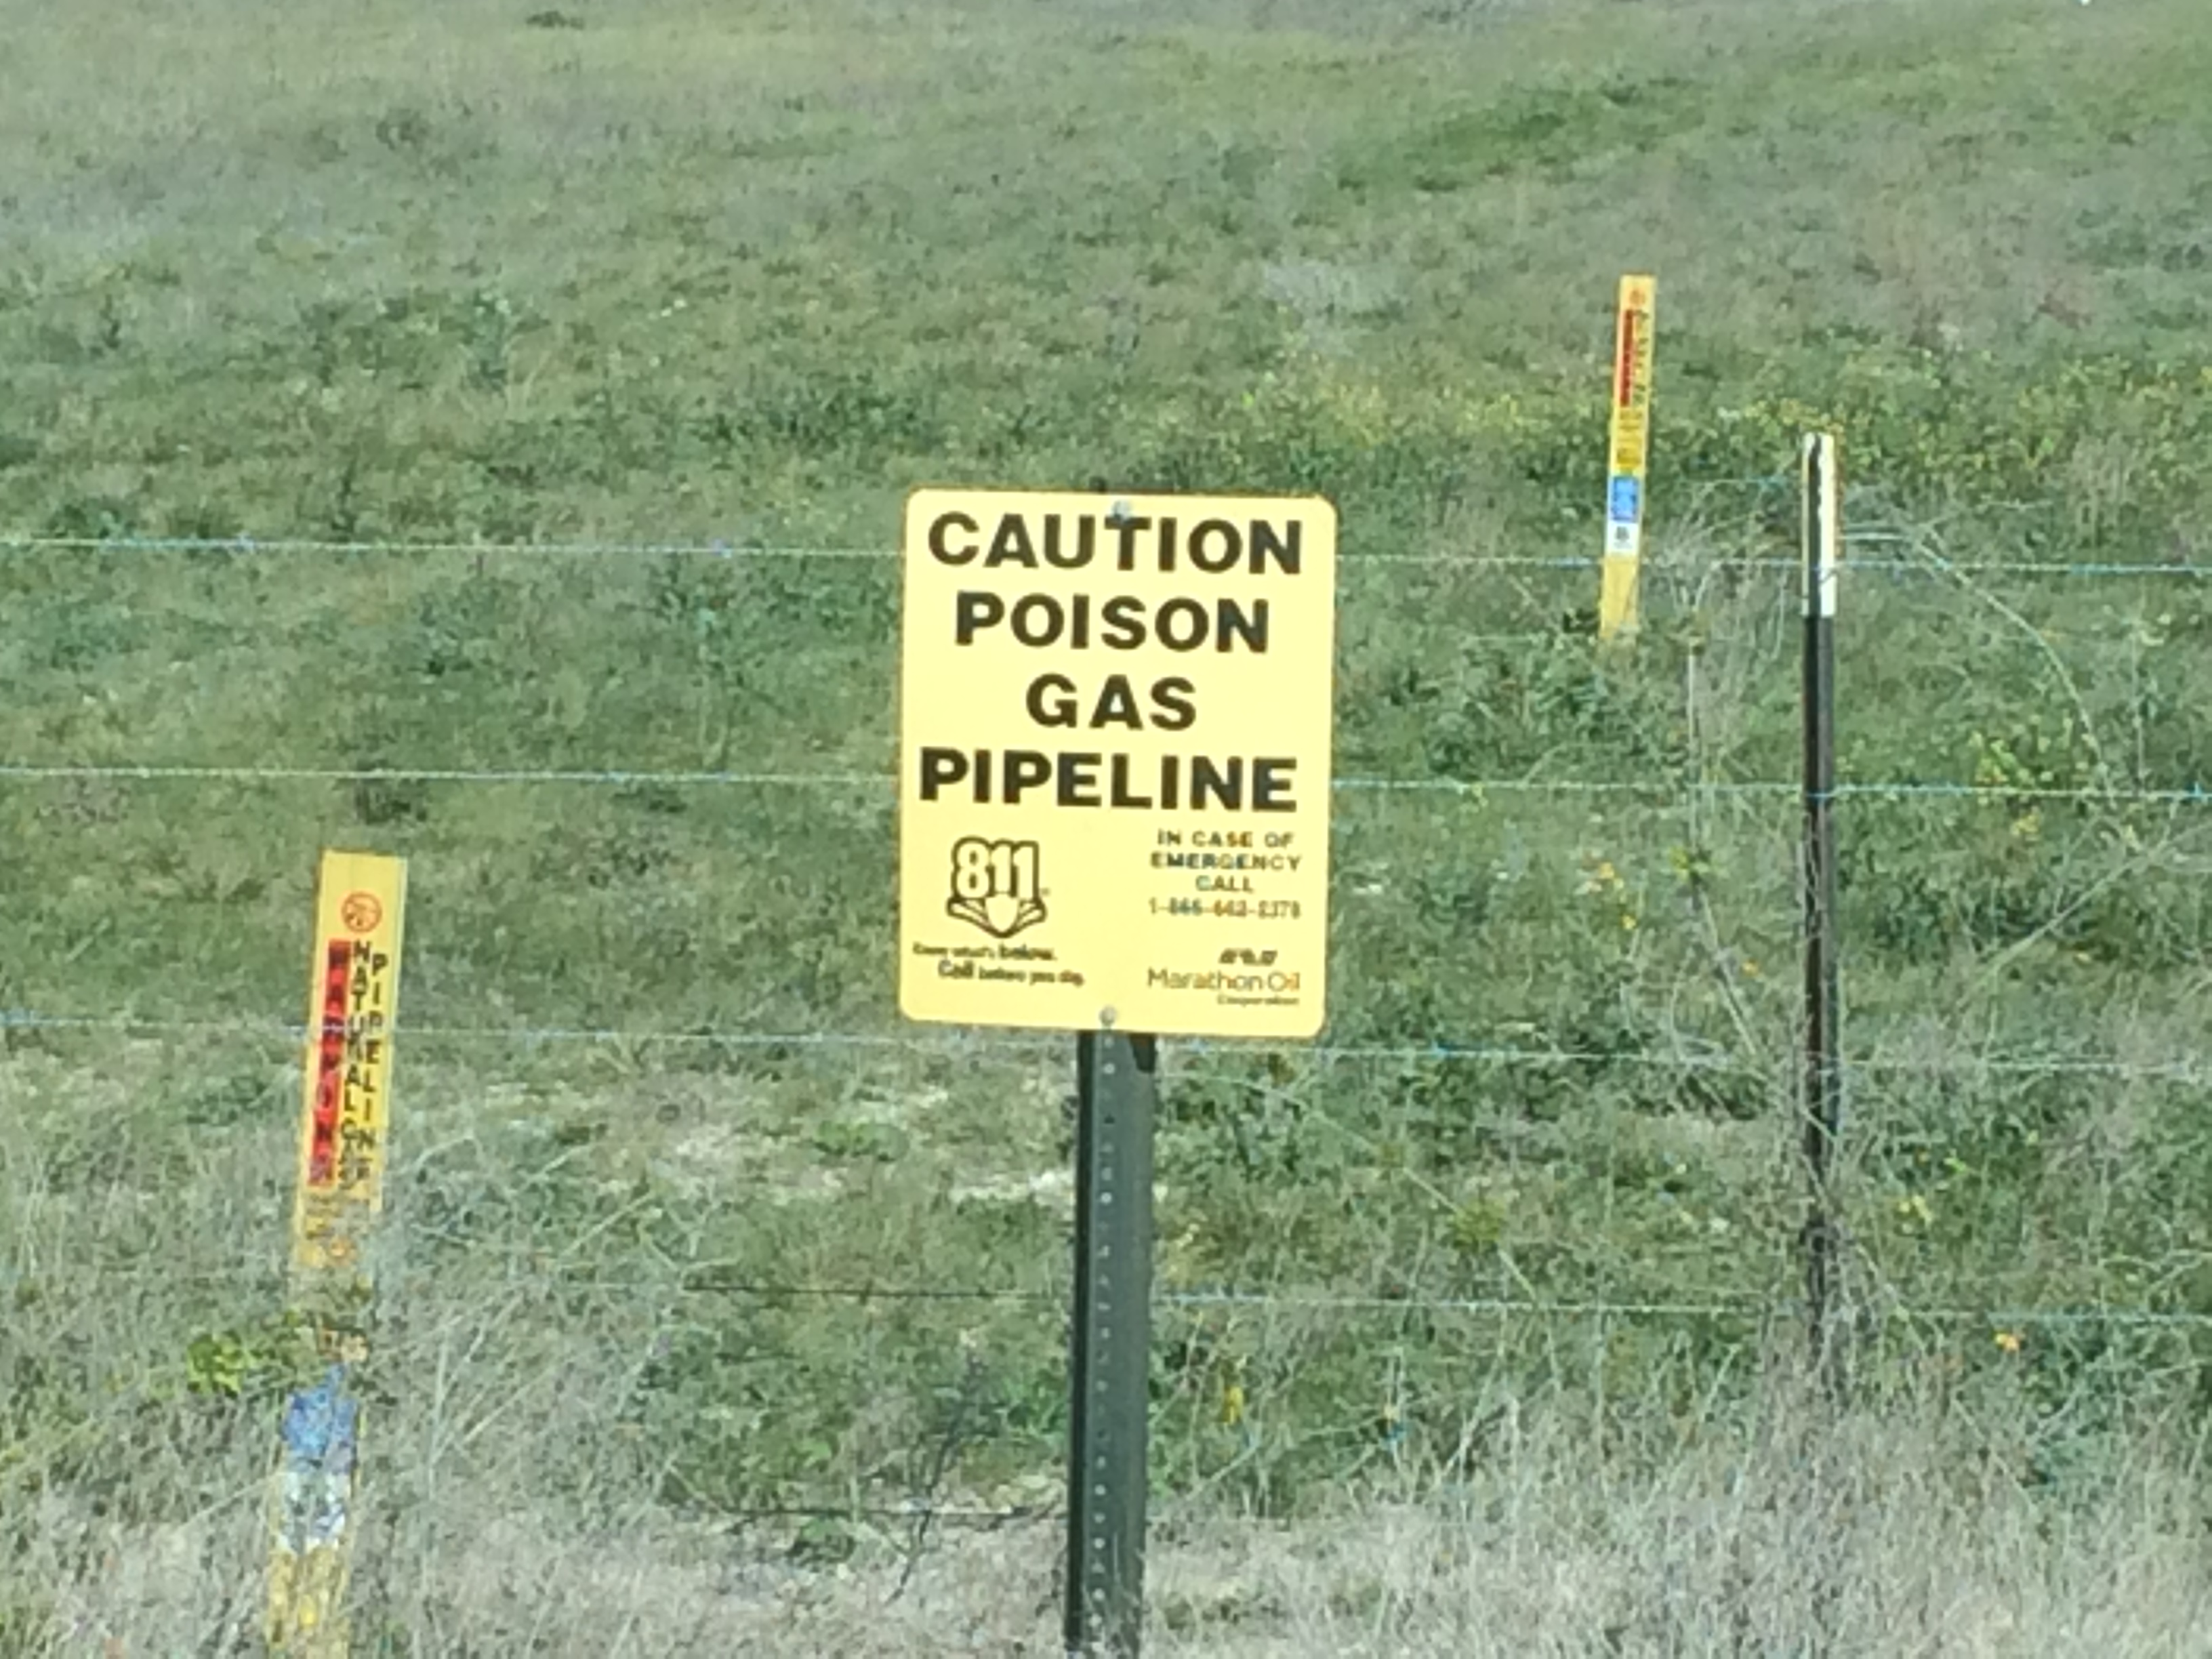
Pipeline warning sign in Texas. Photo credit: Ecologic Institute US
Explosions are also common with faulty pipelines that leak natural gas. Unlike oil or liquid spills, which generally spread and infiltrate into the soil, gas leaks can explode due to the hydrocarbon’s volatility. A recent pipeline explosion in Westmoreland County, PA, for example, caused a man to incur severe burns, as well as caused dozens of homes to be evacuated. Another pipeline explosion in San Bruno, California resulted in 8 people dead, 6 missing, and 58 injured. Thirty-eight homes were also destroyed and 70 others were damaged. This explosion exposed the haphazard system of record keeping for the tens of thousands of miles of gas pipelines, shoddy construction, and inspection practices.
Upcoming Proposed Projects
An estimated 4,600 miles of new interstate pipelines will be completed by 2018. Below are just a few major projects that are currently being proposed or are in the process of obtaining a permit.
A. Atlantic Sunrise Expansion Project
This pipeline will include 194 miles throughout the state of Pennsylvania. It will be constructed to cut through portions of 10 different PA counties, including Columbia, Lancaster, Lebanon, Luzerne, Northumberland, Schuylkill, Susquehanna, Wyoming, Clinton, and Lycoming. This project will require a 125-foot ROW, and will traverse through 52 areas designed as “protected land” in Pennsylvania. This proposed project is still in review by FERC – a decision is expected late 2016 or early 2017.
B. NEXUS Gas Transmission
Spectra Energy (Houston), DTE Energy (Detroit), and Enbridge Inc. (Canada) are partnering to build a $2 billion gas line that would travel from eastern Ohio to Michigan to Ontario. Already applied with FERC and will start construction early 2017. It proposed a 255-mile pipeline and will be 36-inch wide line.
C. Mariner East 2 Pipeline
This pipeline will expand the existing pipeline’s capacity from 70,000 barrels a day to 345,000. It has plans to deliver propane, butane, ethane, and other natural gas liquids across state to Delaware, Berks, and Lebanon counties in PA. Currently, the construction is delayed due to push back and permits acquisition.
D. Northeast Energy Direct (NED) Project
This project was intended to expand an existing pipeline by 420 miles from Susquehanna County, Pennsylvania and passing through New York, Massachusetts, New Hampshire, and Connecticut. Recently in April 2016, Kinder Morgan decided to suspend further development of this proposed pipeline.
E. Atlantic Coast Pipeline
The Atlantic Coast Pipeline had initial plans to establish 550 miles of pipeline from West Virginia to North Carolina, and to cut through dozens of Chesapeake headwater streams, two national forests, and across Appalachian Trail. Their permit to construct this pipeline was denied by the US Forest Service on January 2016; thus, delaying the project at the moment.
F. Algonquin Incremental Market (AIM) Project
With approval by FERC, Spectra Energy has begun 37 miles of pipeline construction through New York, Connecticut, and Massachusetts. The pipeline location is particularly worrisome because it is critically close to the Indian Point nuclear power plant. Ruptures or leaks from the pipeline can threaten the public’s safety, and even result in a power plant meltdown. Spectra Energy has also submitted two additional proposals: the Atlantic Bridge and Access Northeast. Both projects will expand the Algonquin pipeline to reach New England, and both are still in the approval process with FERC.
G. Constitution Pipeline
The Constitution pipeline had initially planned to include 124 miles from Susquehanna County, Pennsylvania to Schoharie County, New York, and was denied by NY State in April 2016.
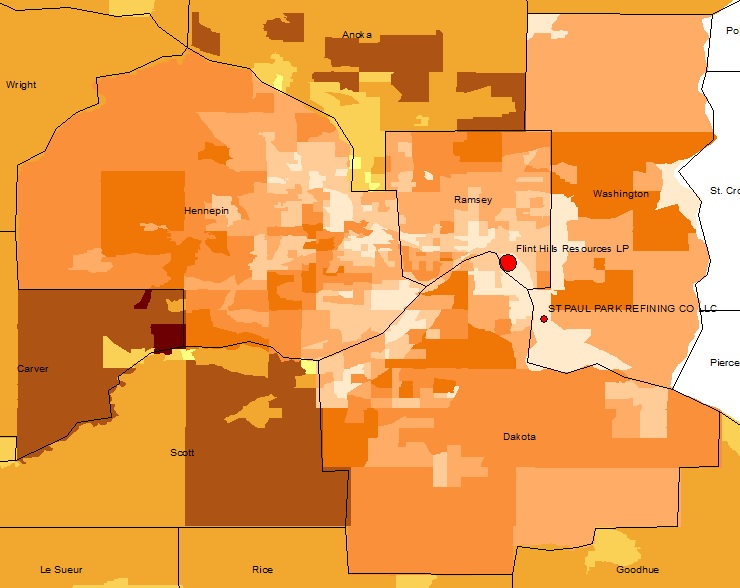
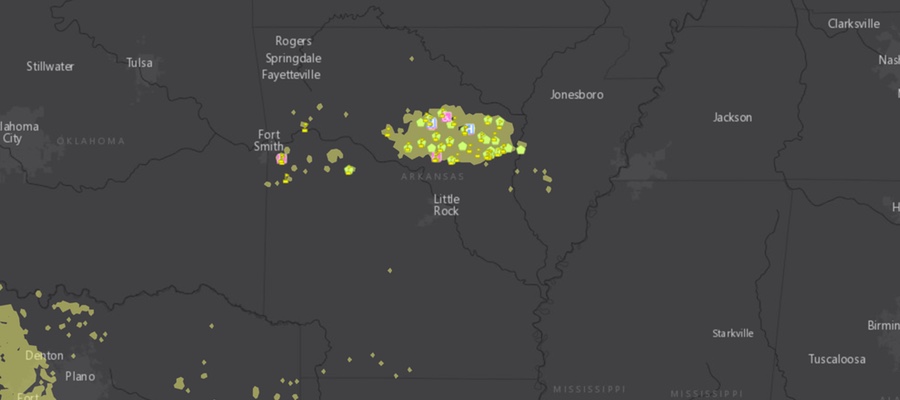
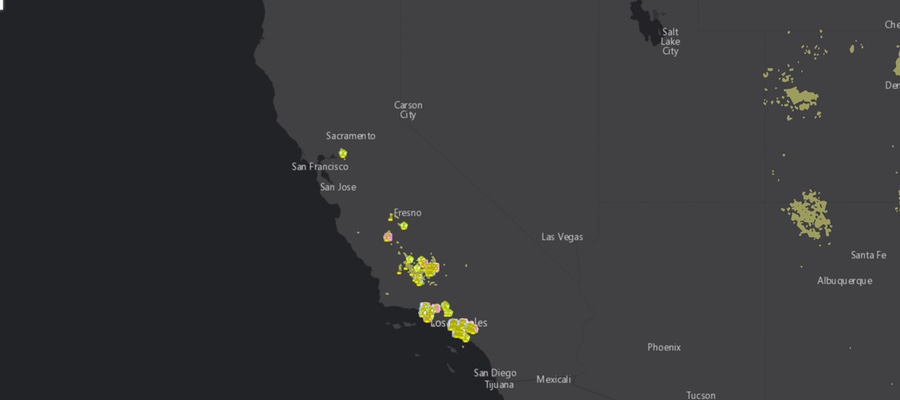
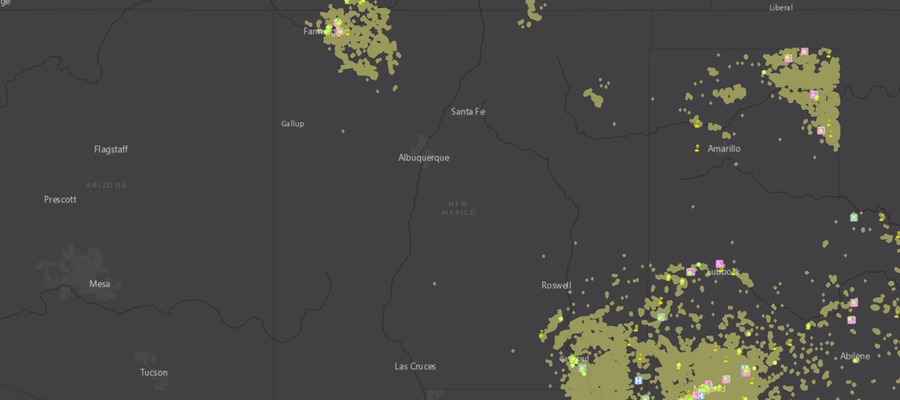
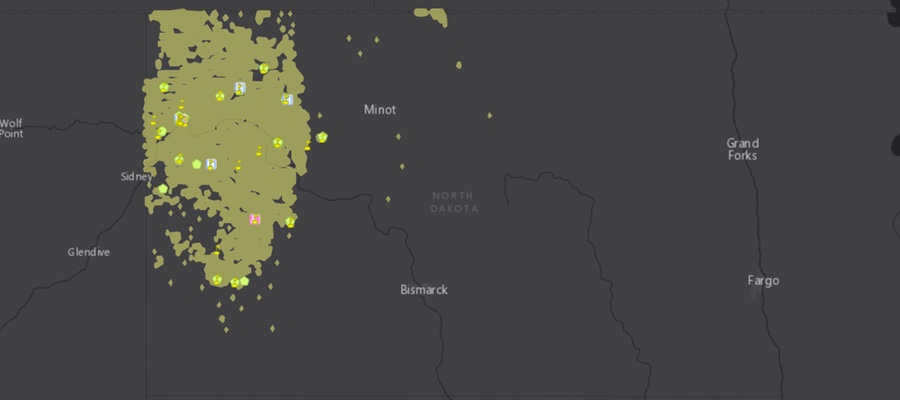
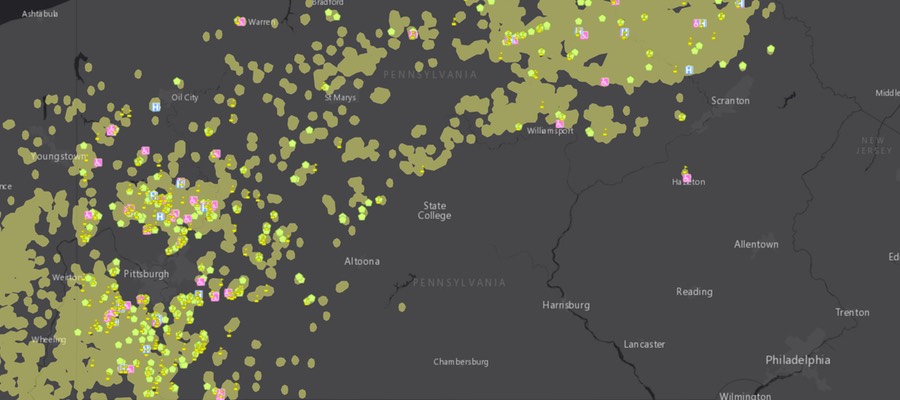
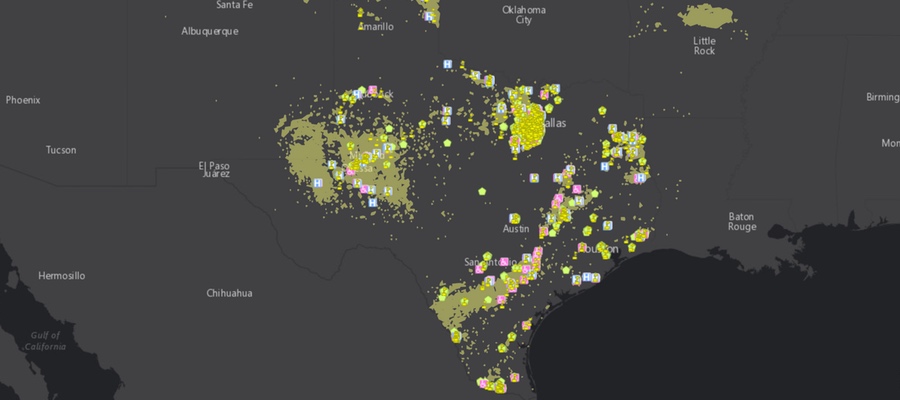
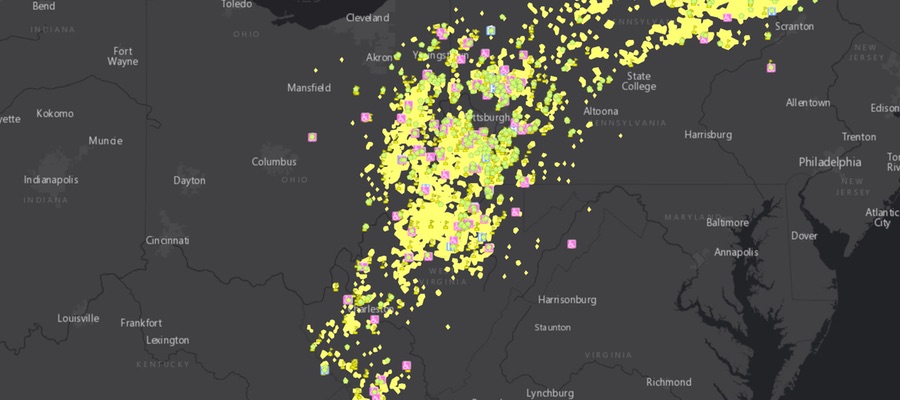
To view the routes of proposed pipelines, visit FracTracker’s North American Pipeline and Oil and Gas Infrastructure Proposals map.
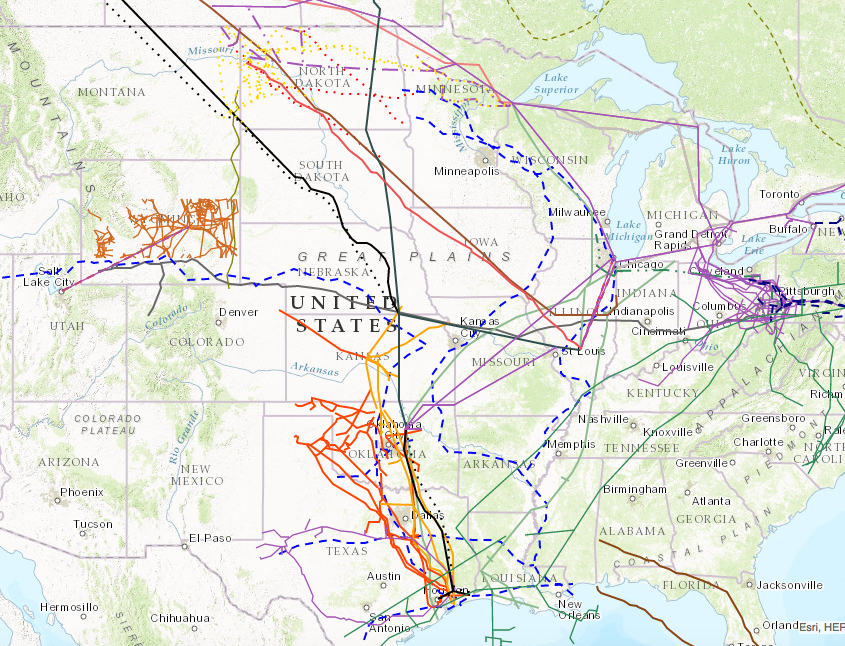
Preview of North America proposed pipelines map. Click to view fullscreen.
Further Questions
Please email us at info@fractracker.org if there are any unanswered questions you would like us to answer or include.
Update: this article was edited on June 21, 2016 due to reader feedback and suggestions.


")
")


