This article looks at the contrasting approach to fracking in Pennsylvania and New York. Pennsylvania’s extensive fracking operations have resulted in environmental and public health concerns. In contrast, New York’s ban on fracking has led to significant investments in renewable energy and permanent jobs.
https://www.fractracker.org/a5ej20sjfwe/wp-content/uploads/2017/03/Solar-Array-Feature.jpg400900Karen Edelsteinhttps://www.fractracker.org/a5ej20sjfwe/wp-content/uploads/2025/09/2025-Wordmark-Logo.pngKaren Edelstein2023-08-30 10:32:502023-09-07 18:55:31Transitioning to Clean Energy: The Success of Solar Tompkins and HeatSmart in New York State
https://www.fractracker.org/a5ej20sjfwe/wp-content/uploads/2021/08/Bitcoin-feature.jpg6671500Karen Edelsteinhttps://www.fractracker.org/a5ej20sjfwe/wp-content/uploads/2025/09/2025-Wordmark-Logo.pngKaren Edelstein2021-08-02 17:05:372022-01-04 10:48:28The world is watching as bitcoin battle brews in the US
Over the past decade, New York State has seen a steep decline in the quantity of waste products from the fracking industry sent to its landfills for disposal. Explore FracTracker’s 2020 updated data.
https://www.fractracker.org/a5ej20sjfwe/wp-content/uploads/2021/04/PA-Unconventional-Drilling-Waste-Disposal-in-NYS-2011-20-feature-scaled.jpg6671500Karen Edelsteinhttps://www.fractracker.org/a5ej20sjfwe/wp-content/uploads/2025/09/2025-Wordmark-Logo.pngKaren Edelstein2021-04-20 14:05:162021-05-19 10:54:04Trends in fracking waste coming to New York State from Pennsylvania
New York State Department of Environmental Conservation (DEC) Oil and Gas Database includes records for nearly 45,000 wells in the state, nearly all of which are related to the oil and gas industry. Of these records, only 19,600 include drilling dates; some records simply reflect drilling permits that were applied for and expired, or were cancelled for other reasons. Of the records listed, 99% of those drilled are vertical, “conventional” wells.
Research by Bishop (2013) indicates that there could be more than 30,000 additional oil and gas wells that are not documented in the DEC’s database, and potentially not adequately plugged.
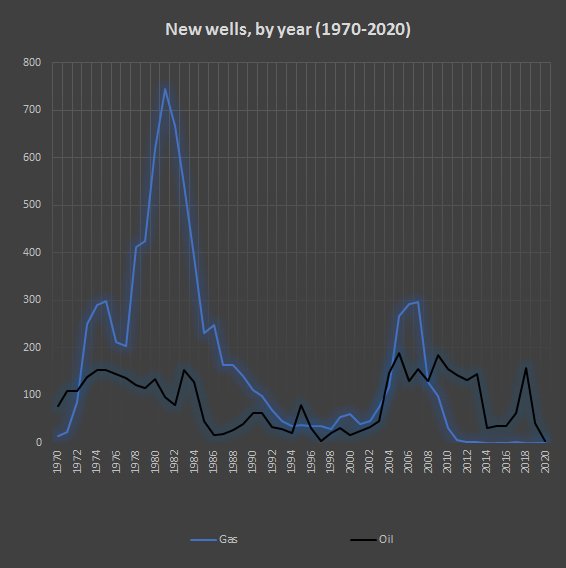
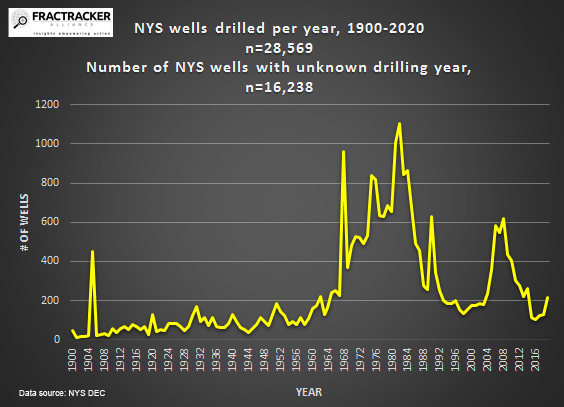
Over the past half-century, drilling activity in New York State has ebbed and flowed. In that period of time, drilling interest in oil and gas saw two main peaks: between 1975 and 1985, and — especially for gas — between 2004 and 2010. Gas drilling activity has currently tailed off to practically nothing since the ban on high-volume hydraulic fracturing was passed in late 2014.
In 2018 and 2019, there was a brief flurry of oil drilling, but that too has dropped off. The causes for the decline in new wells are complicated, but likely reflect a combination of reduced consumption of fossil fuels, as well as steady decreases in the price of oil and gas. Prices in the past several years are up to half what they were previously. In addition, the impact of COVID on the industry has also contributed to this decline, although other sources assert that the fossil fuel industry has benefited from the global pandemic.
In this article we’ll look specifically at spatial and temporal patterns in oil and gas drilling across New York State.
Mapping analysis
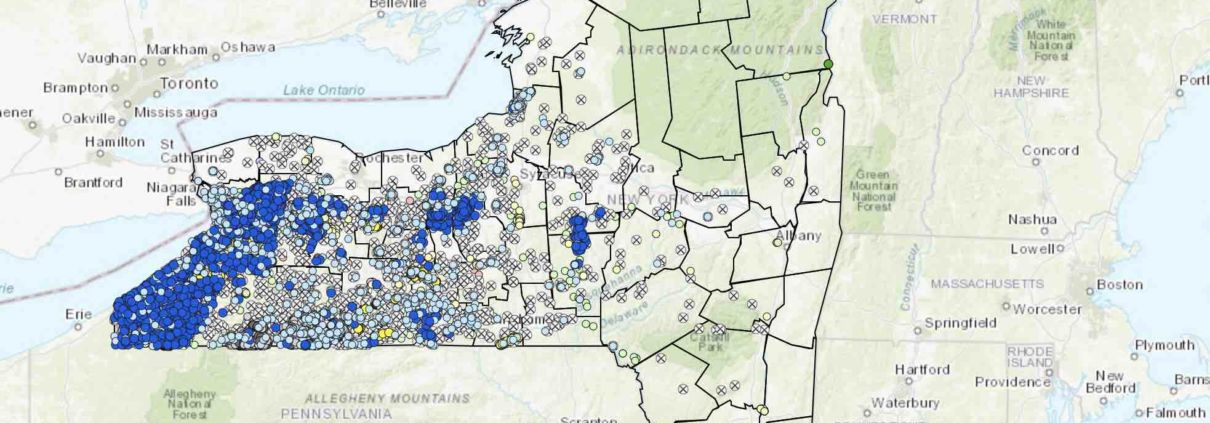
Every year, FracTracker updates the full state-wide dataset of oil, gas, and other assorted (non-drinking water) wells. To see the entire “big picture,” you can explore our interactive map below, which shows all wells in the New York State database, from prior to 1900 through late February 2021.
New York State Oil and Gas Wells
This map shows that, despite New York State banning high volume hydraulic, nearly 45,000 wells have been drilled, according to the Department of Environmental Conservation (DEC). Not all the wells in the DEC’s database were actually drilled; some were sites that were permitted, but never explored. Many have been plugged and abandoned. There may be nearly as many undocumented wells as there are in the database, given that record keeping in earlier years was nowhere near as comprehensive as it is today.
In order to turn layers on and off in the map, use the Layers dropdown menu. This tool is only available in Full Screen view. Data sources can be found in the Details section of the map as well as listed the end of this article.
FracTracker has also taken a more fine-grained approach to consider the patterns in drilling in New York State both spatially and temporally. Using the DEC wells database, we first filtered out well data for records that had actual spud (drilling) dates between 1970 and the present. Then, using pivot tables in Microsoft Excel, we graphed the data, and also looked for patterns around where the drilling was taking place.
Emergent from this process, we see the following.
Spatial distributions
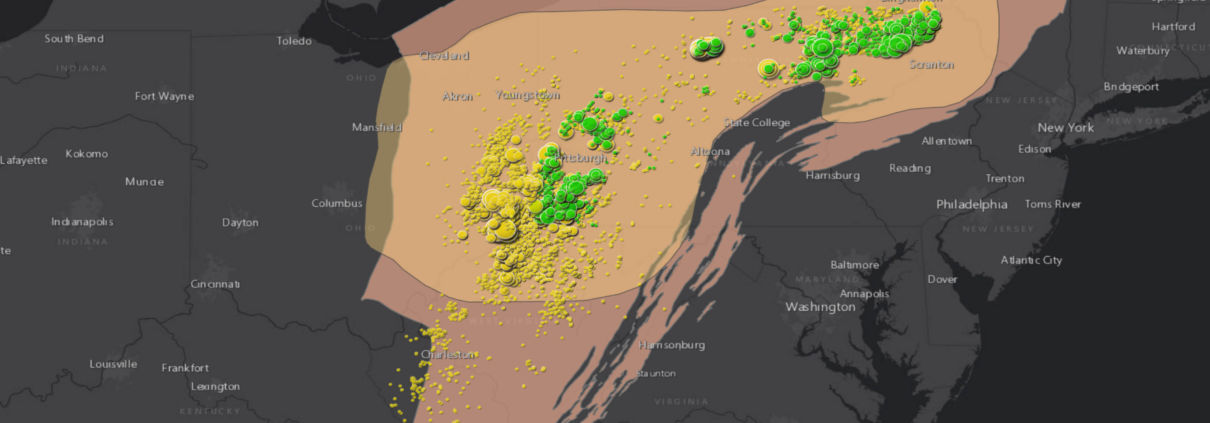
Oil and gas hotspots are directly related to the underlying geology of a region. In New York State, the majority of oil wells have been drilled in the Chipmunk and Bradford Formations, followed by the Fulmer Valley, Glade, and Richburg Formations.
Oil Wells in NYS and Their Associated Geological Formations
Updated February 2021
Figure 1. Oil Wells in NYS and Their Associated Geological Formations. Gas wells have historically been most productive in the Medina Formation, followed by the Queenston, and also Trenton-Black River Formations. Data source: New York State DEC Oil and Gas Database.
Gas Wells in NYS and Their Associated Geological Formations
Updated February 2021
Figure 2. Gas wells in NYS and their associated geological formations. Data source: NYS DEC Oil and Gas Database.
Temporal distributions
Activity in drilling has exhibited distinct patterns over time, as well.
In 1982 and 1983, gas drilling in New York State surged, with 774 and 667 new wells drilled over those two years, respectively. The hot spot was in the Medina Group, which over the years, continued to be a primary focus. Well depths in this section of bedrock average around 3,400 feet at that time, although wells were exploited at a more shallow depth in subsequent years. Starting in 1995, gas was discovered in the Black River shale formation, with reservoirs more than 10,000 feet deep in some places. All of these wells were vertically oriented, but still were exploited using hydraulic fracturing technologies.
Oil
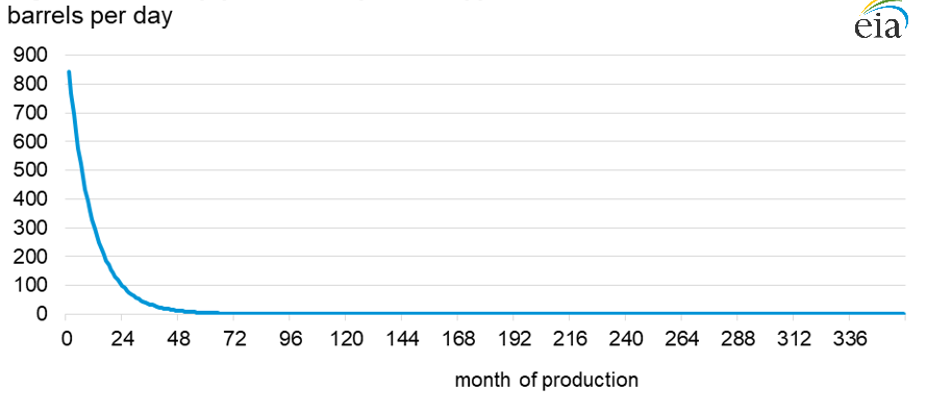
The early to mid-1980s marked a relatively high level in oil well drilling in New York State, with a peak occurring in 1984, with 153 wells drilled. After a lull of about 20 years, activity picked up again in 2005, hitting a high point in 2006 when 188 oil wells were drilled. In 2010, there was another peak with 188 wells, followed by a waning period of 4 years. Then, in 2019, interest exploded in a small area of the Bradford oil fields in Cattaraugus County, with 156 wells drilled, and an average production of 319 barrels per well over the course of that year.
Economic implications
According to EIA estimate from 2014, the cost of drilling an onshore oil well is between $4.9 – 8.3 million, however smaller vertical wells like those common in New York State are likely to cost more in the range of $150,000. With the price of oil at $64 a barrel in 2019, in its first year in production, the gross profit of any of these wells in New York, based on reported production, would have been between $0 and $120,000, with an average year around $20,400 per well. It’s hard to imagine how drilling for oil in recent years in New York State could have possibly been profitable, in particular with the steep drop-off in production typically seen after the first year or two.
These simple examples of a localized “oil boom” in New York State provide a stark example of exactly how unsustainable these endeavors are, particularly for small drilling operators. So, despite the enthusiastic rush to oil drilling in 2019, activity after that has been followed by a quick decline, with only 41 oil wells drilled in New York State in 2020, and only 4, so far, in 2021.
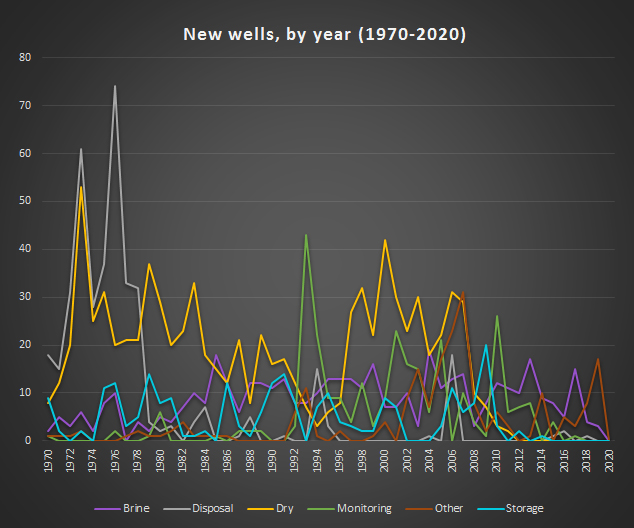
Patterns in other types of wells
The increase in dry wells seems to track with the general patterns of oil and gas exploration. Hence, in periods when a lot of oil and gas wells are being drilled, there will be a higher number of wells that are dry, or nonproductive. During the 1970s, there was also a strong peak in disposal wells drilled. We are not certain whether this is, or is not, related to the high number of gas wells drilled during this period.
New York State moving towards better stewardship of legacy wells
Some of the oil and gas wells drilled in the 19th and early 20th century were particularly poorly documented (or not documented at all), and improperly plugged. This creates a public and environmental safety hazard, with more than 30,000 of these undocumented oil and gas wells spread across the state potentially leaking methane into the air and water. Finding the abandoned and orphan wells has been a long term problem because they are often located in rough terrain across central and western New York. Fortunately, the New York State Department of Environmental Conservation has taken new measures to locate and plug these legacy wells, using drone technology. FracTracker reported on a pilot initiative a few years ago that was testing this technique, but the new program is backed by $400,000 in funding from NYSERDA, the New York State Energy Research and Development Authority, in support of New York States ambitious goals to reduce greenhouse gas emissions through the Climate Leadership and Community Protection Act.
The Takeaway
One hundred years ago, few people expressed concerns about the environmental hazards associated with oil and gas drilling. Record-keeping was spotty, which has left us with a legacy of wells whose locations are lost to memory, or simply improperly plugged. After several periods of vigorous mineral extraction activity in the 1980s and early 2000s, oil and gas drilling has declined in its profitability, and formerly easily-accessed reserves have been depleted. Today, with unprecedented interest in clean energy sources like wind, geothermal, and solar, society can become less dependent on fossil fuels, and focus on responsibly stewarding the remnants of these “dinosaurs,” using new technologies to help clean up the damages left by them.
https://www.fractracker.org/a5ej20sjfwe/wp-content/uploads/2021/04/New-York-State-wells-feature.jpg8331875Karen Edelsteinhttps://www.fractracker.org/a5ej20sjfwe/wp-content/uploads/2025/09/2025-Wordmark-Logo.pngKaren Edelstein2021-04-01 11:10:062021-04-15 14:08:35New York State Oil & Gas Well Drilling: Patterns Over Time
The production of fracking waste in the Appalachian Basin puts public health and safety at risk.
Fracking produces more than just oil and gas — billions of gallons of highly toxic waste are also created in the process. Regulatory loopholes have led to limited oversight into how this waste is tracked and treated, putting public health and safety at risk.
The maps below explore issues related to fracking waste from the Marcellus and Utica Shale regions of Pennsylvania, Ohio, New York, and West Virginia.
This mapping platform is an evolving tool based on available data — yet the opaqueness of the fracking industry limits our ability to map and analyze the full scope of the problem of fracking waste in the Appalachian Basin.
Unfortunately, even after sifting through thousands of data points, we’re left with many outstanding questions — what are the chemical components of the waste created? Where is it all sent? Where are its byproducts sent? What facilities are being planned and proposed? How much illegal dumping occurs?
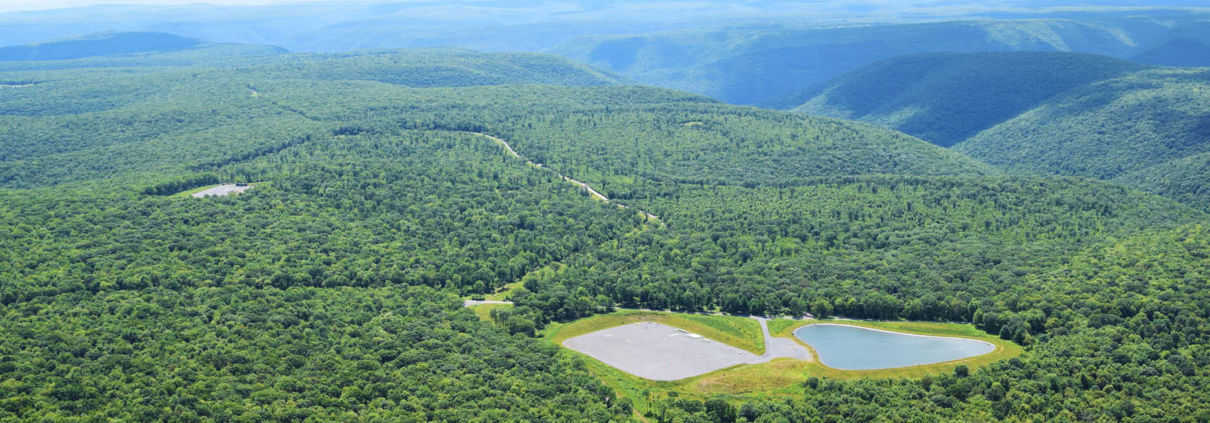
The production of fracking waste in the Appalachian Basin will continue to create environmental and public health threats for decades after the industry leaves the region. Wells can continue to generate wastewater for years and contaminated equipment sent to landfills will leach toxins into the environment. Furthermore, with the industry’s history of failing to restore land after it has been used for oil and gas operations, we can expect abandoned fracking sites to become an increasing source of pollution in the Appalachian Basin in the coming decades. It’s imperative that the public have access to accurate and detailed data on fracking waste to protect the health of workers and residents.
By Erica Jackson, Community Outreach & Communications Specialist, FracTracker Alliance
https://www.fractracker.org/a5ej20sjfwe/wp-content/uploads/2021/01/Utica-and-Marcellus-shale-plays-feature-scaled.jpg6671500Erica Jacksonhttps://www.fractracker.org/a5ej20sjfwe/wp-content/uploads/2025/09/2025-Wordmark-Logo.pngErica Jackson2021-01-15 17:36:502021-04-16 19:46:43Fracking Waste in the Appalachian Basin – A Story Map
In this article, we’ll take a look at the current trend in “re-branding” incineration as a viable option to deal with the mountains of garbage generated by our society. Incineration can produce energy for electricity, but can the costs—both economically, and ecologically—justify the benefits? What are the alternatives?
Changes in our waste stream
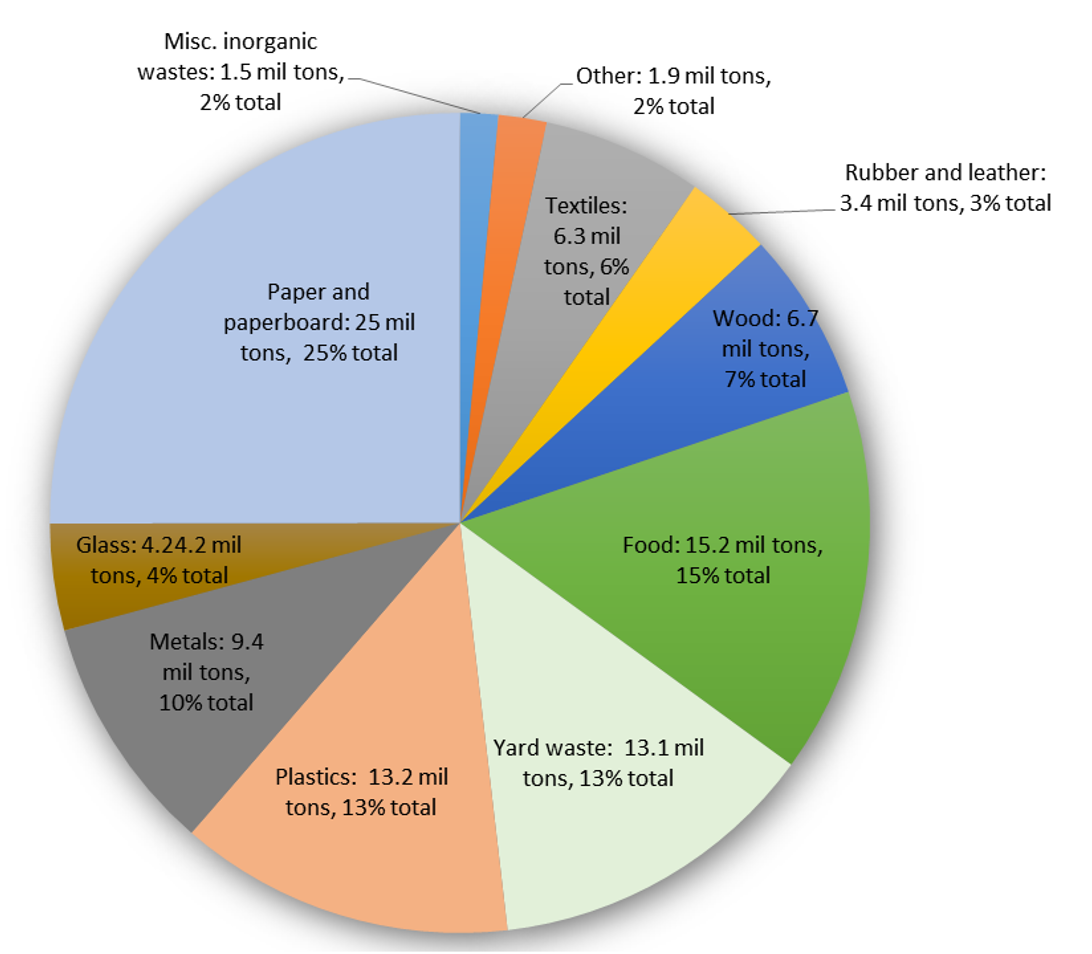
In today’s world of consumerism and production, waste disposal is a chronic problem facing most communities worldwide. Lack of attention to recycling and composting, as well as ubiquitous dependence on plastics, synthetics, and poorly-constructed or single-use goods has created a waste crisis in the United States. So much of the waste that we create could be recycled or composted, however, taking extraordinary levels of pressure off our landfills. According to estimates in 2017 by the US Environmental Protection Agency (EPA), over 30 percent of municipal solid waste is made up of organic matter like food waste, wood, and yard trimmings, almost all of which could be composted. Paper, glass, and metals – also recyclable – make up nearly 40 percent of the residential waste stream. Recycling plastic, a material which comprises 13% of the waste stream, has largely been a failed endeavor thus far.
Why say NO to incinerators?
They are bad for the environment, producing toxic chlorinated byproducts like dioxins. Incineration often converts toxic municipal waste into other forms, some of which are even more toxic than their precursors.
They often consume more energy than they produce and are not profitable to run.
They add CO2 to the atmosphere.
They promote the false narrative that we can “get something” from our trash
They detract from the conversation about actual renewable energy sources like wind power, solar power, and geothermal energy that will stop the acceleration of climate chaos.
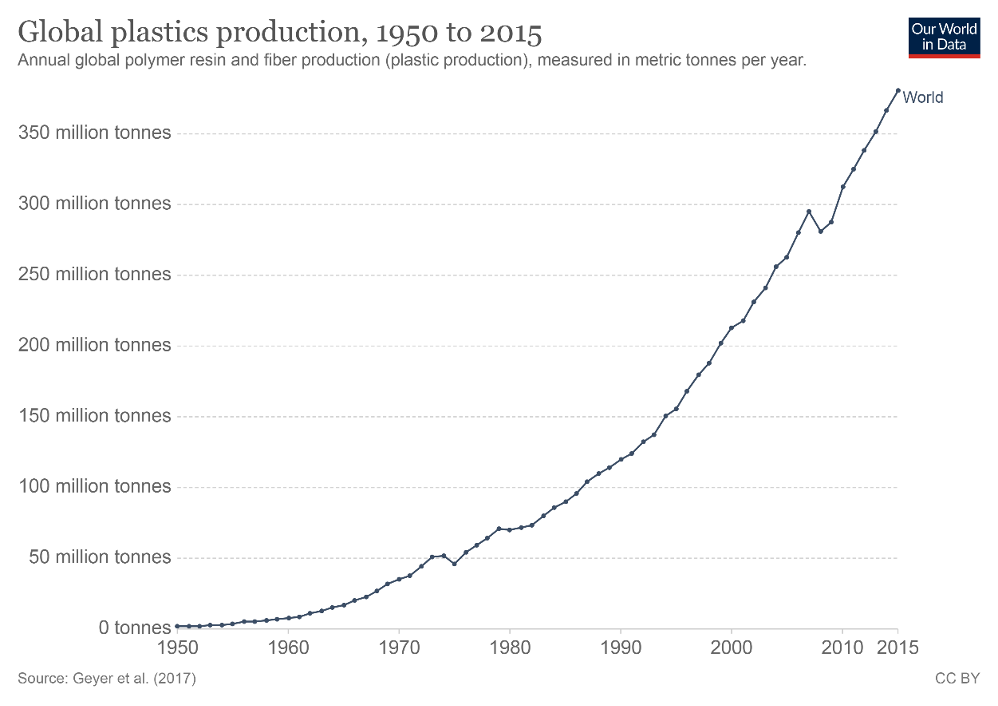
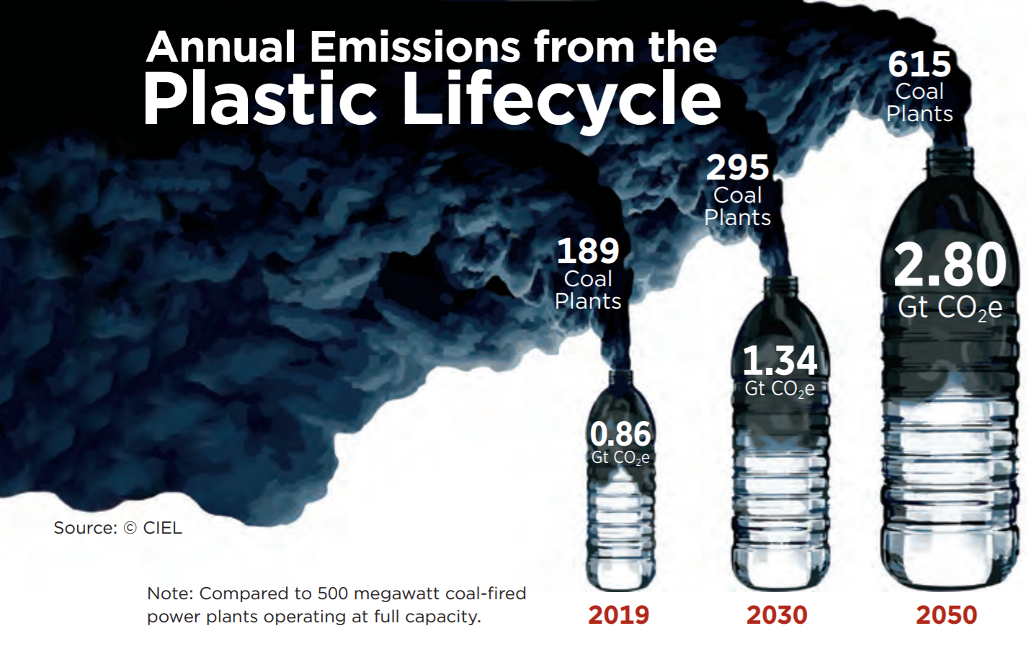
Nevertheless, of the approximately 400 million tons of plastic produced annually around the world, only about 10% of it is recycled. The rest winds up in the waste stream or as microfragments (or microplastics) in our oceans, freshwater lakes, and streams.
According to an EPA fact sheet, by 2017, municipal solid waste generation increased three-fold compared with 1960. In 1960, that number was 88.1 million tons. By 2017, this number had risen to nearly 267.8 million tons. Over that same period, per-capita waste generation rose from 2.68 pounds per person per day, to 4.38 pounds per person per day, as our culture became more wed to disposable items.
The EPA provides a robust “facts and figures” breakdown of waste generation and disposal here. In 2017, 42.53 million tons of US waste was shipped to landfills, which are under increasing pressure to expand and receive larger and larger loads from surrounding area, and, in some cases, hundreds of miles away.
How are Americans doing in reducing waste?
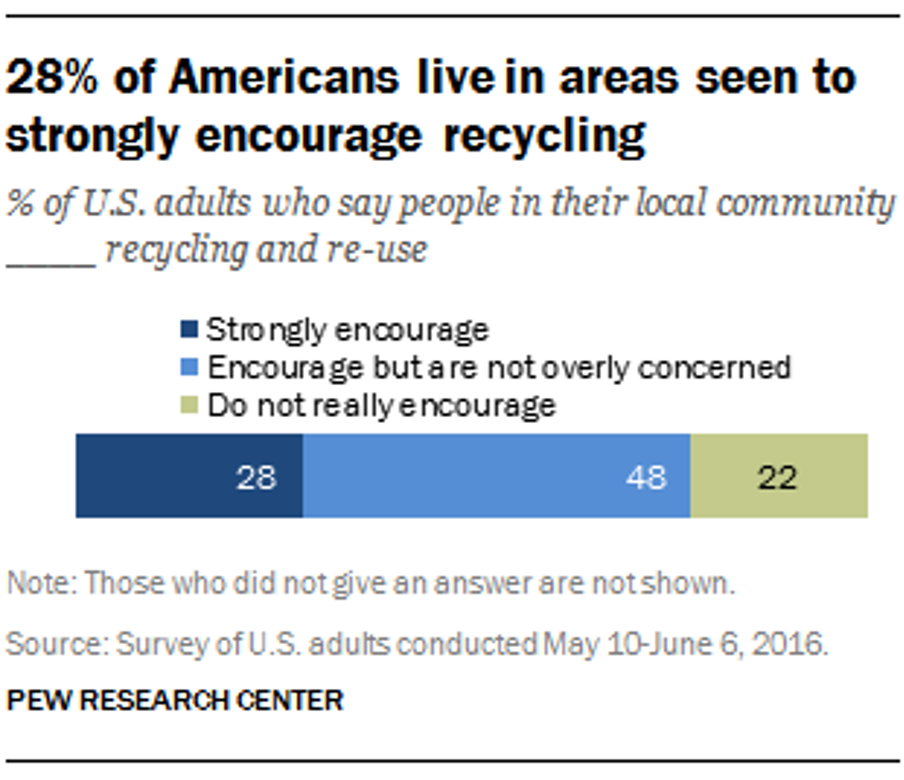
On average, in 2017, Americans recycled and composted 35.2% of our individual waste generation rate of 4.51 pounds per person per day. While this is a notable jump from decades earlier, much of the gain appears to be in the development of municipal yard waste composting programs. Although the benefits of recycling are abundantly clear, in today’s culture, according to a PEW Research Center report published in 2016, just under 30% of Americans live in communities where recycling is strongly encouraged. An EPA estimate for 2014 noted that the recycling rate that year was only 34.6%, nationwide, with the highest compliance rate at 89.5% for corrugated boxes.
Figure 3. Percent of Americans who report recycling and re-use behaviors in their communities, via Pew Research center
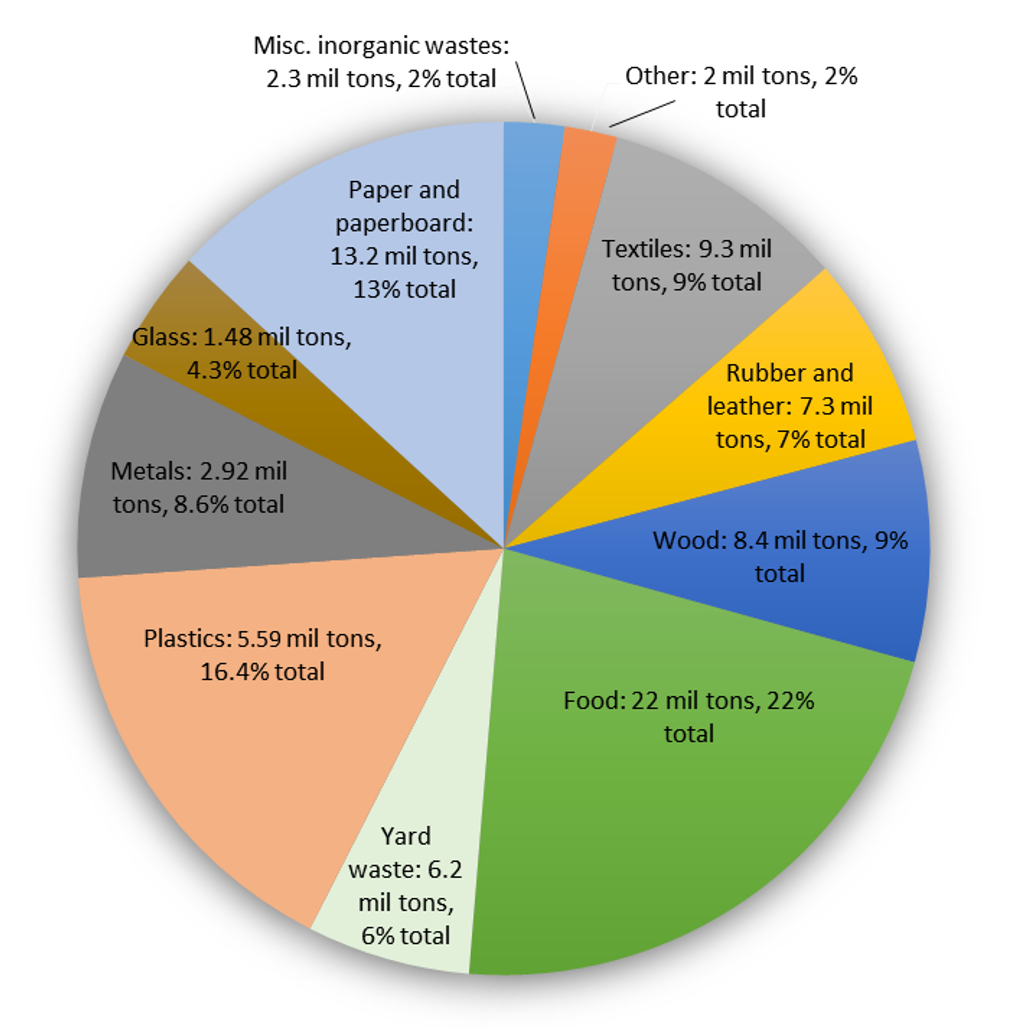
Historically, incineration – or burning solid waste – has been one method for disposing of waste. And in 2017, this was the fate of 34 million tons—or nearly 13%– of all municipal waste generated in the United States. Nearly a quarter of this waste consisted of containers and packaging—much of that made from plastic. The quantity of packaging materials in the combusted waste stream has jumped from only 150,000 tons in 1970 to 7.86 million tons in 2017. Plastic, in its many forms, made up 16.4% of all incinerated materials, according to the EPA’s estimates in 2017.
Figure 4: A breakdown of the 34.03 tons of municipal waste incinerated for energy in the US in 2017
What is driving the abundance of throw-away plastics in our waste stream?
Sadly, the answer is this: The oil and gas industry produces copious amounts of ethane, which is a byproduct of oil and gas extraction. Plastics are an “added value” component of the cycle of fossil fuel extraction. FracTracker has reported extensively on the controversial development of ethane “cracker” plants, which chemically change this extraction waste product into feedstock for the production of polypropylene plastic nuggets. These nuggets, or “nurdles,” are the building blocks for everything from fleece sportswear, to lumber, to packaging materials. The harmful impacts from plastics manufacturing on air and water quality, as well as on human and environmental health, are nothing short of stunning.
FracTracker has reported extensively on this issue. For further background reading, explore:
A report co-authored by FracTracker Alliance and the Center for Environmental Integrity in 2019 found that plastic production and incineration in 2019 contributed greenhouse gas emissions equivalent to that of 189 new 500-megawatt coal power plants. If plastic production and use grow as currently planned, by 2050, these emissions could rise to the equivalent to the emissions released by more than 615 coal-fired power plants.
Just another way of putting fossil fuels into our atmosphere
Incineration is now strongly critiqued as a dangerous solution to waste disposal as more synthetic and heavily processed materials derived from fossils fuels have entered the waste stream. Filters and other scrubbers that are designed to remove toxins and particulates from incineration smoke are anything but fail-safe. Furthermore, the fly-ash and bottom ash that are produced by incineration only concentrate hazardous compounds even further, posing additional conundrums for disposal.
Incineration as a means of waste disposal, in some states is considered a “renewable energy” source when electricity is generated as a by-product. Opponents of incineration and the so-called “waste-to-energy” process see it as a dangerous route for toxins to get into our lungs, and into the food stream. In fact, Energy Justice Network sees incineration as:
… the most expensive and polluting way to make energy or to manage waste. It produces the fewest jobs compared to reuse, recycling and composting the same materials. It is the dirtiest way to manage waste – far more polluting than landfills. It is also the dirtiest way to produce energy – far more polluting than coal burning.
Municipal waste incineration: bad environmentally, economically, ethically
Waste incineration has been one solution for disposing of trash for millennia. And now, aided by technology, and fueled by a crisis to dispose of ever-increasing trash our society generates, waste-to-energy (WTE) incineration facilities are a component in how we produce electricity.
But what is a common characteristic of the communities in which WTEs are sited? According to a 2019 report by the Tishman Environmental and Design Center at the New School, 79% of all municipal solid waste incinerators are located in communities of color and low-income communities. Incinerators are not only highly problematic environmentally and economically. They present direct and dire environmental justice threats.
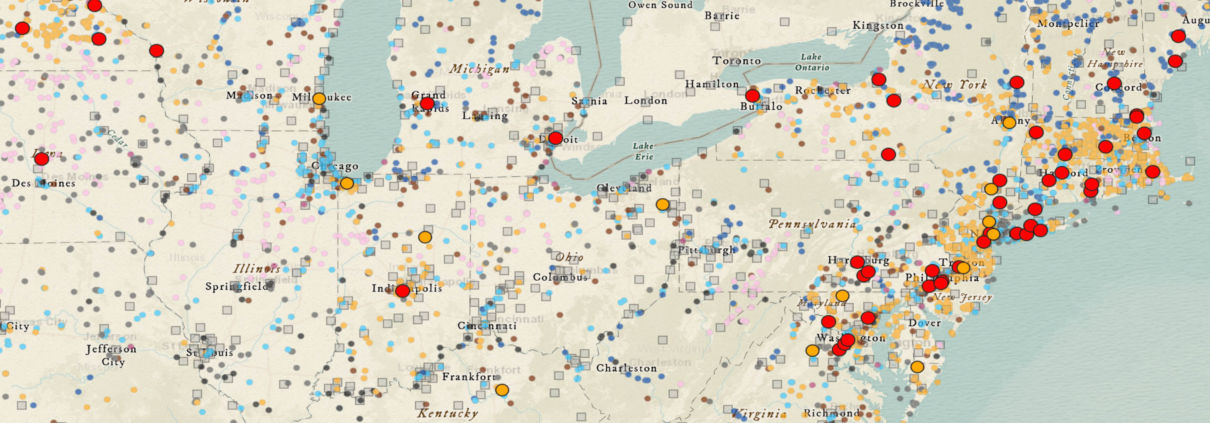
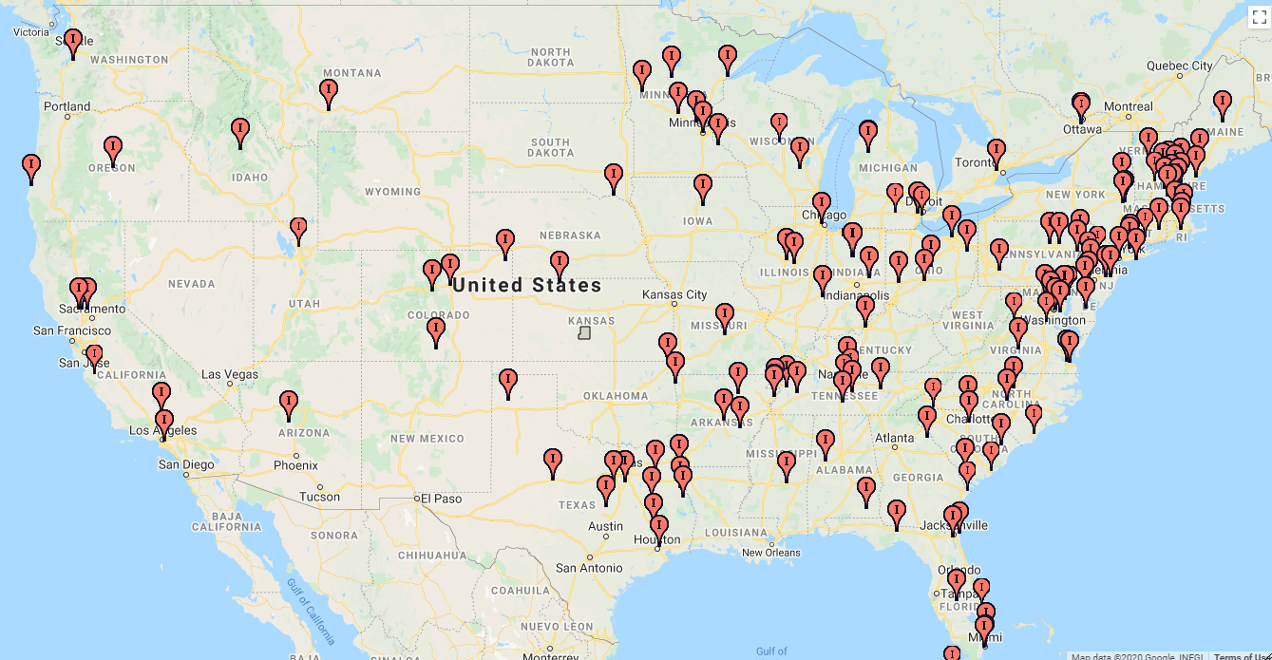
Waste-to-Energy facilities in the US, existing and proposed
Activate the Layers List button to turn on Environmental Justice data on air pollutants and cancer occurrences across the United States. We have also included real-time air monitoring data in the interactive map because one of the health impacts of incineration includes respiratory illnesses. These air monitoring stations measure ambient particulate matter (PM 2.5) in the atmosphere, which can be a helpful metric.
What are the true costs of incineration?
These trash incinerators capture energy released from the process of burning materials, and turn it into electricity. But what are the costs? Proponents of incineration say it is a sensible way to reclaim or recovery energy that would otherwise be lost to landfill disposal. The US EIA also points out that burning waste reduces the volume of waste products by up to 87%.
The down-side of incineration of municipal waste, however, is proportionally much greater, with a panoply of health effects documented by the National Institutes for Health, and others.
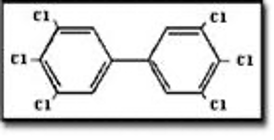
Dioxins (shown in Figures 6-11) are some of the most dangerous byproducts of trash incineration. They make up a group of highly persistent organic pollutants that take a long time to degrade in the environment and are prone to bioaccumulation up the food chain.
Dioxins are known to cause cancer, disrupt the endocrine and immune systems, and lead to reproductive and developmental problems. Dioxins are some of the most dangerous compounds produced from incineration. Compared with the air pollution from coal-burning power plants, dioxin concentrations produced from incineration may be up to 28 times as high.
Federal EPA regulations between 2000 and 2005 resulted in the closure of nearly 200 high dioxin emitting plants. Currently, there are fewer than 100 waste-to-energy incinerators operating in the United States, all of which are required to operate with high-tech equipment that reduces dioxins to 1% of what used to be emitted. Nevertheless, even with these add-ons, incinerators still produce 28 times the amount of dioxin per BTU when compared with power plants that burn coal.
Even with pollution controls required of trash incinerators since 2005, compared with coal-burning energy generation, incineration still releases 6.4 times as much of the notoriously toxic pollutant mercury to produce the equivalent amount of energy.
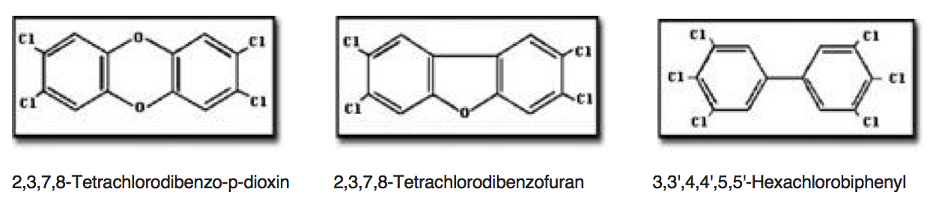
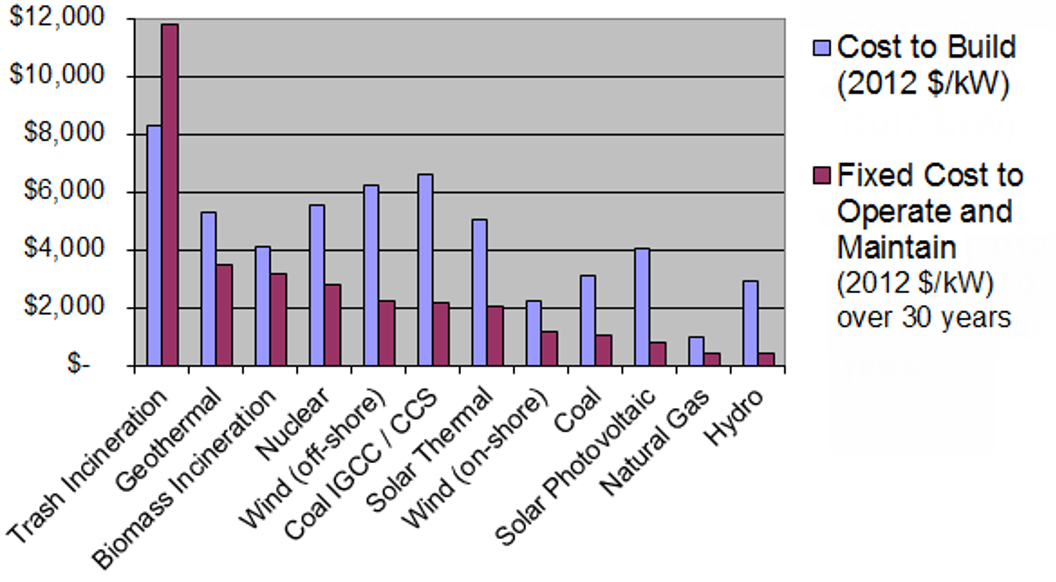
Energy Justice Network, furthermore, notes that incineration is the most expensive means of managing waste… as well as making energy. This price tag includes high costs to build incinerators, as well as staff and maintain them — exceeding operation and maintenance costs of coal by a factor of 11, and nuclear by a factor of 4.2.
Figure 12. Costs of incineration per ton are nearly twice that of landfilling. Source: National Solid Waste Management Association 2005 Tip Fee Survey, p. 3.
Energy Justice Network and others have pointed out that the amount of energy recovered and/or saved from recycling or composting is up to five times that which would be provided through incineration.
Figure 13. Estimated power plant capital and operating costs. Source: Energy Justice Network
The myth that incineration is a form of “renewable energy”
Waste is a “renewable” resource only to the extent that humans will continue to generate waste. In general, the definition of “renewable” refers to non-fossil fuel based energy, such as wind, solar, geothermal, wind, hydropower, and biomass. Synthetic materials like plastics, derived from oil and gas, however, are not. Although not created from fossil fuels, biologically-derived products are not technically “renewable” either.
Biogenic materials you find in the residual waste stream, such as food, paper, card and natural textiles, are derived from intensive agriculture – monoculture forests, cotton fields and other “green deserts”. The ecosystems from which these materials are derived could not survive in the absence of human intervention, and of energy inputs from fossil sources. It is, therefore, more than debatable whether such materials should be referred to as renewable.
Although incineration may reduce waste volumes by up to 90%, the resulting waste-products are problematic. “Fly-ash,” which is composed of the light-weight byproducts, may be reused in concrete and wallboard. “Bottom ash” however, the more coarse fraction of incineration—about 10% overall—concentrates toxins like heavy metals. Bottom-ash is disposed of in landfills or sometimes incorporated into structural fill and aggregate road-base material.
How common is the practice of using trash to fuel power plants?
Trash incineration accounts for a fraction of the power produced in the United States. According to the United States Energy Information Administration, just under 13% of electricity generated in the US comes from burning of municipal solid waste, in fewer than 65 waste-to-energy plants nation-wide. Nevertheless, operational waste-to-incineration plants are found throughout the United States, with a concentration east of the Mississippi.
According to EnergyJustice.net’s count of waste incinerators in the US and Canada, currently, there are:
88 operating
41 proposed
0 expanding
207 closed or defeated
Figure 14. Locations of waste incinerators that are already shut down. Source: EnergyJustice.net)
Precise numbers of these incinerators are difficult to ascertain, however. Recent estimates from the federal government put the number of current waste-to-energy facilities at slightly fewer: EPA currently says there are 75 of these incinerators in the United States. And in their database, updated July 2020, the United States Energy Information Administration (EIA), lists 63 power plants that are fueled by municipal solid waste. Of these 63 plants, 40—or 66%—are in the northeast United States.
Regardless, advocates of clean energy, waste reduction, and sustainability argue that trash incinerators, despite improvements in pollution reduction over earlier times and the potential for at least some electric generation, are the least effective option for waste disposal that exists. The trend towards plant closure across the United States would support that assertion.
Let’s take a look at the dirty details on WTE facilities in three states in the Northeastern US.
Review of WTE plants in New York, Pennsylvania, and New Jersey
A. New York State
Operational WTE Facilities
In NYS, there are currently 11 waste-to-energy facilities that are operational, and two that are proposed. Here’s a look at some of them:
The largest waste-to-energy facility in New York State, Covanta Hempstead Company (Nassau County), was built in 1989. It is a 72 MW generating plant, and considered by Covanta to be the “cornerstone of the town’s integrated waste service plan.”
According to the Environmental Protection Agency’s ECHO database, this plant has no violations listed. Oddly enough, even after drawing public attention in 2009 about the risks associated with particulate fall-out from the plant, the facility has not been inspected in the past 5 years.
Other WTE facilities in New York State include the Wheelabrator plant located in Peekskill (51 MW), Covanta Energy of Niagara in Niagara Falls (32 MW), Convanta Onondaga in Jamesville (39 MW), Huntington Resource Recovery in Suffolk County (24.3 MW), and the Babylon Resource Recovery Facility also in Suffolk County (16.8 MW). Five additional plants scattered throughout the state in Oswego, Dutchess, Suffolk, Tioga, and Washington Counties, are smaller than 15 MW each. Of those, two closed and one proposal was defeated.
Closed / Defeated Facilities
The $550 million Corinth American Ref-Fuel, was proposed for Corinth, New York. It was designed to take 1.27 million tons of New York City waste/year, even more than what is planned for the CircularEnerG plant. It was defeated ~2004. Population of 864 in immediate vicinity of plant, 98% white, income $59K.
Fire Island, Saltaire Incinerator closed. Took 12 tons/day. It was opened in 1965s, but not designed to produce energy, just burn trash. There was a population of 317 in immediate vicinity of plant, 93% white, income $123K.
The Long Beach incinerator processed 200 tons per day of solid waste. This plant was operating in 1988, but closed in 1996.
The Albany Steam Plant closed in 1994. When it was operational, it took in 340-600 tons of trash per day. Environmental justice issues were plentiful at this plant, with over 99% of the area as African American, according to the LA Times coverage of the issue.
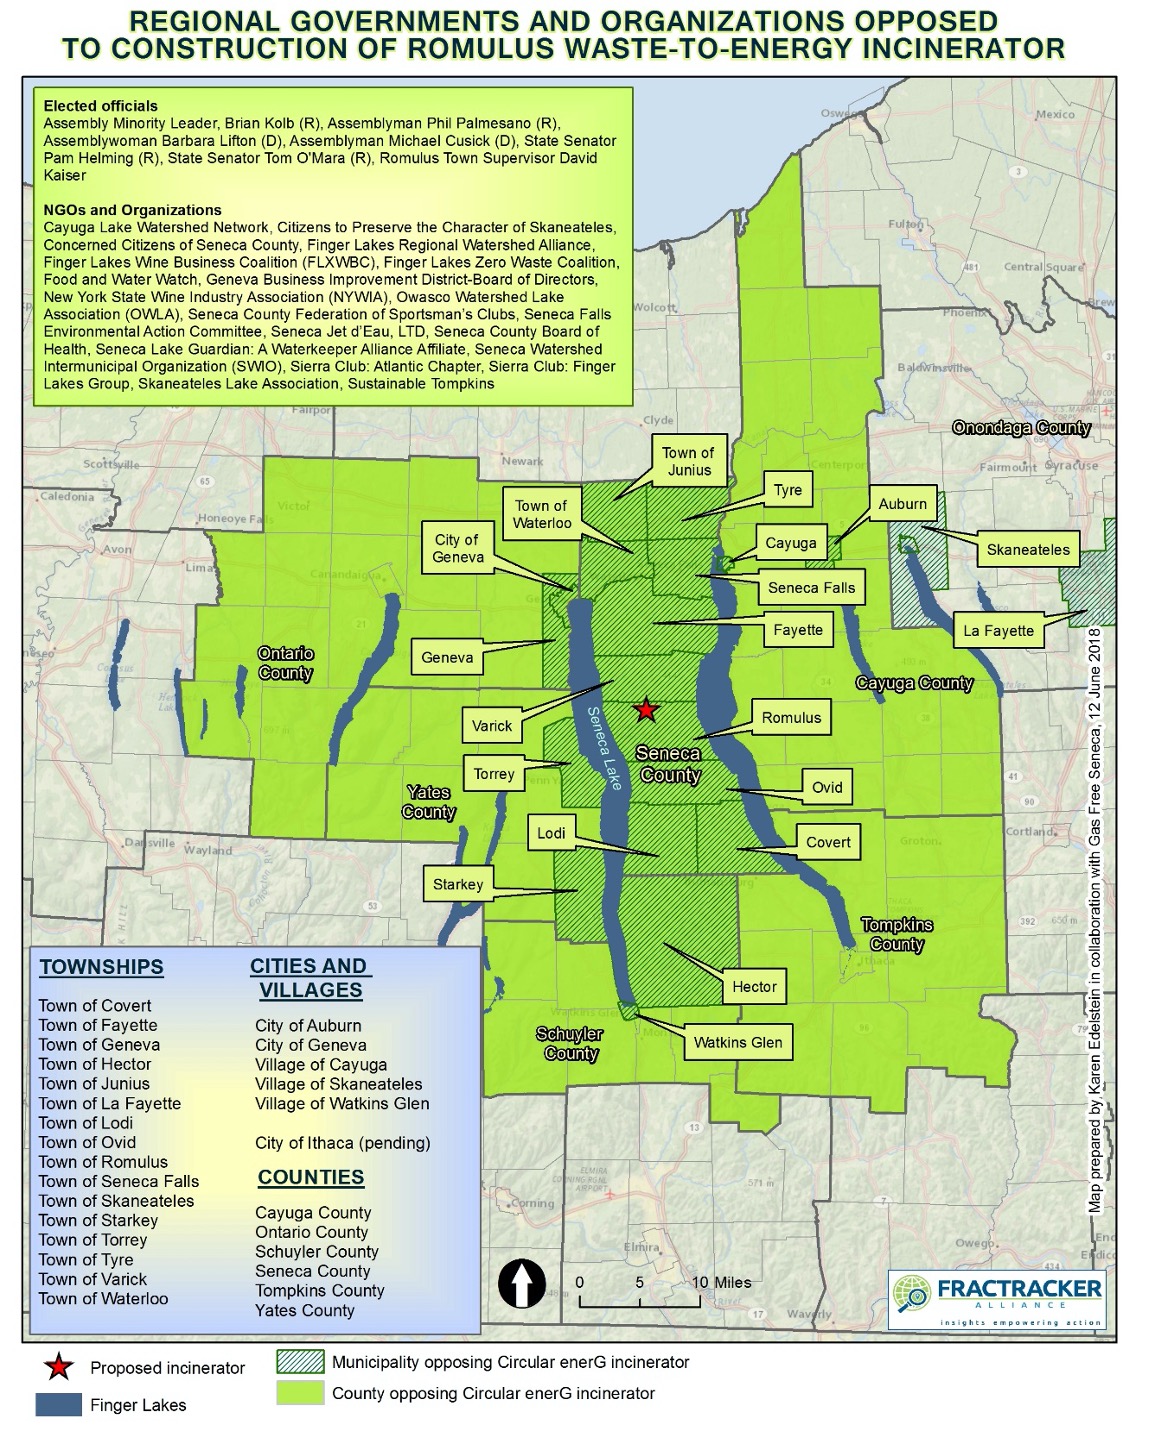
CircularEnerG, was a 50 MW plant proposed in Romulus, on the former Seneca Army Depot, in the middle of largely white Seneca County, New York. However, the nearest large population to the proposed site was the 1500-prisoner capacity Five Points Correctional facility, swaying the demographics to nearly 52% African American in the highest impact zone. More broadly, the facility was in the heart of the Finger Lakes wine region, known for its extraordinary scenery, clean lakes, and award-winning wines. This facility was broadly opposed by nearly all the surrounding municipalities and counties, and mired in controversy about improper procedures and a designation by a local zoning officer as a “renewable” source of energy in its early filing papers.
Local advocacy groups, Seneca Lake Guardian (an affiliate of the Waterkeeper Network), and the Finger Lakes Wine Business Coalition worked exhaustively with the legal group, Earthjustice, to stop the project.
Figure 15. Map of regional governments and organizations opposed to construction of Romulus waste-to-energy incinerator in New York State
In March 2019, after state lawmakers, along with Governor Andrew Cuomo came out against the trash incinerator, the special use permit application for the facility was withdrawn.
Plans were also in development for a garbage-to-gas plant in the Hudson River community of Stony Point, New York. The company, New Planet Energy, had hoped to construct the gasification plant that would accept 4,500 tons of waste daily, brought in each day by approximately 400 trucks, according to an article in Lohud, May 1, 2018. However, the owner of the property eventually backed out of the proposal shortly after the publication of the article, following an uptick in criticism about the project about environmental and traffic safety concerns. This property is also currently an active Superfund site.
Proposed WTE Facilities
In New York State, there are currently two proposed WTE facilities.
New York State has rejected the designation for WTE facilities since 2011. As of the latest reports, the company is pushing ahead with its plans, despite the widespread dislike for the project. A bill in the State Legislature has been introduced to block the project. Green Waste Energy has been proposed for Rensselaer, NY. This trash-burning gasification plant would accept 2500 tons of trash per day. However, in August 2020, the New York State Department of Environmental Conservation (DEC) denied the air quality permit for the facility. The developers may appeal this decision.
In New Windsor, NY, a project called W2E Orange County has been under consideration. Most recent news coverage of this project was three and a half years ago, so it is possible this project is not moving forward. The parent company of the project, Ensorga, appears to have contracted its operations to West Virginia.
B. Pennsylvania
Operational WTE Facilities
In Pennsylvania, six WTE facilities are currently operating. Two have been closed, and six defeated.
Proposed WTE Facilities
In Pennsylvania, there are currently no WTEs under consideration for construction.
Closed WTE Facilities
Chester Resource Recovery #1 was used from the late 1950s to 1979. The neighborhood is over 64% African American. This was one of three incinerators used here.
Westmoreland County WTE plant, which opened in 1986 and burned 25 tons of solid municipal waste per day, has been closed due to financial unviability, and lack of need for the steam that was produced, according to a report drafted in 1997. It was located in a densely populated area, and provided steam to a nursing home, jail, and low-income housing.
Defeated WTE Facility Proposals
Elroy trash-to-steam plant was located in a densely populated section of Franconia Township, Montgomery County, Pennsylvania. It was to handle 360 tons of waste per day and was located on the grounds of a rendering plant. The application for this plant was withdrawn in June, 1989. Citizens for a Clean Environment successfully defeated this project.
The Plasma Gasification Incinerator, located in Hazle Township, Pennsylvania, was proposed to burn 4,000 tons of trash per day. The median income in the immediate vicinity of the site is $46K. The application for this project was withdrawn.
The Pittston Trash Incinerator in a very low-income area of Luzerne County, Pennsylvania, was designed to burn 3,000 tons of trash per day. This project was defeated.
The $65 million Delta Thermo Muncy facility, which would have burned municipal waste and sewage sludge, was defeated in December, 2016. Citizens in the Energy Justice Network and Stop the Muncy Waste Incinerator organized and passed a set-back ordinance that made it impossible for the plant to locate there. This proposed plant, would have been located in Lycoming County, Pennsylvania. The plan there was to decompose trash and sewage through a hydrothermal technique to create pellets, which would then be burned to yield energy.
Originally proposed in 2007, the $49 million Delta Thermo Allentown plant has been fought for many years by Allentown Residents for Clean Air. If built, it would generate 2 MW of energy, and receive 100 tons of municipal waste each day and 50 tons of sewage sludge. The plant is located in a densely-populated, predominately Hispanic neighborhood. There has been no news on this project in over four years, so this project appears to have been defeated.
Glendon Energy proposed building an incinerator in Northampton County, Pennsylvania. This proposal was also defeated.
C. New Jersey
Operational WTE Facilities
And in New Jersey, there are currently four operating WTE facilities. Essex County Resource Recovery Facility, is New Jersey’s largest WTE facility. It opened in 1990, houses three burners, and produces 93 MW total.
Three WTE facilities are currently proposed in New Jersey. Jefferson Renewable Energy Trash Incinerator (Jersey City, New Jersey) is designed to produce 90 MW of power, accepting 3,200 tons/day solid waste, plus 800 tons/day construction/demo waste.
Delta Thermo Sussex is designed to burn both municipal solid waste and sewage sludge. And DTE Paterson would accept 205 tons of waste/day. The price tag to build this small facility is not so small: $45 million.
Closed WTE Facilities
Two WTE plants in New Jersey are no longer in operation. These include Fort Dix, which opened in 1986 and burned 80 tons of trash per day; and Atlantic County Jail, which opened in 1990 and burned 14 tons of trash per day.
Throw-aways, burn-aways, take-aways
Looming large above the arguments about appropriate siting, environmental justice, financial gain, and energy prices, is a bigger question:
How can we continue to live on this planet at our current rates of consumption, and the resultant waste generation?
The issue here is not so much about the sources of our heat and electricity in the future, but rather “How MUST we change our habits now to ensure a future on a livable planet?”
Professor Paul Connett (emeritus, St. Lawrence University), is a specialist in the build-up of dioxins in food chains, and the problems, dangers, and alternatives to incineration. He is a vocal advocate for a “Zero Waste” approach to consumption, and suggests that every community embrace these principles as ways to guide a reduction of our waste footprint on the planet. The fewer resources that are used, the less waste is produced, mitigating the extensive costs brought on by our consumptive lifestyles. Waste-to-energy incineration facilities are just a symptom of our excessively consumptive society.
Dr. Connett suggests these simple but powerful methods to drastically reduce the amount of materials that we dispose — whether by incineration, landfill, or out the car window on a back-road, anywhere in the world:
Source separation
Recycling
Door-to-door collection
Composting
Building Reuse, Repair and Community centers
Implementing waste reduction Initiatives
Building Residual Separation and Research centers
Better industrial design
Economic incentives
Interim landfill for non-recyclables and biological stabilization of other organic materials
Connett’s Zero Waste charge to industry is this: “If we can’t reuse, recycle, or compost it, industry shouldn’t be making it.” Reducing our waste reduces our energy footprint on the planet.
In a similar vein, FracTracker has written about the potential for managing waste through a circular economics model, which has been successfully implemented by the city of Freiburg, Germany. A circular economic model incorporates recycling, reuse, and repair to loop “waste” back into the system. A circular model focuses on designing products that last and can be repaired or re-introduced back into a natural ecosystem.
This is an important vision to embrace. Every day. Everywhere.
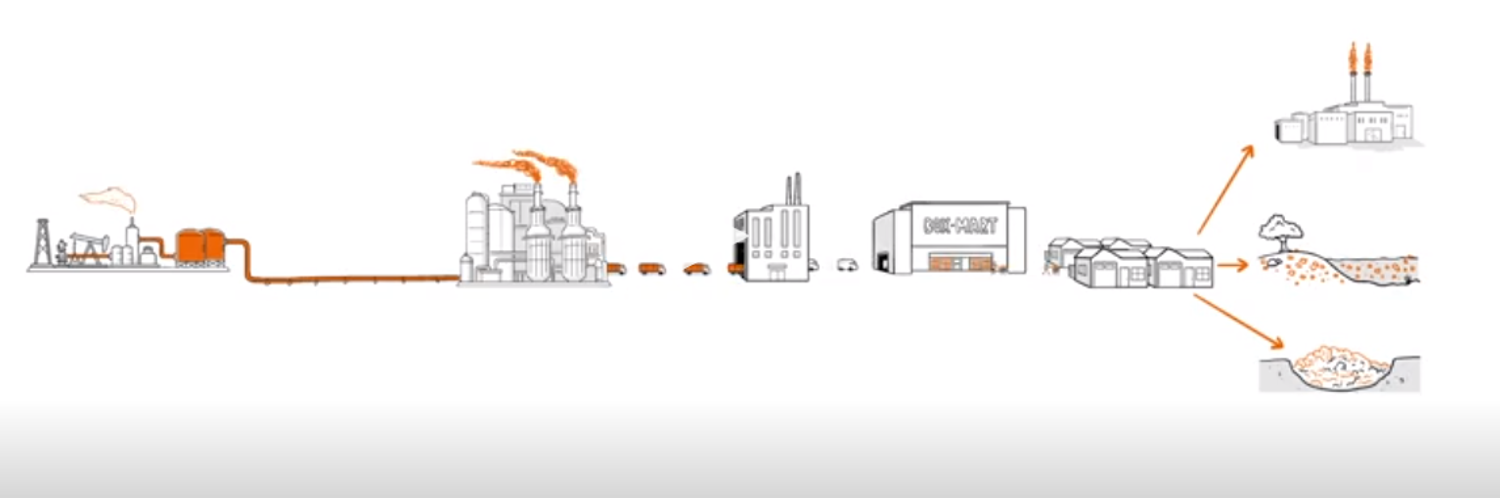
For more in-depth and informative background on plastic in the environment, please watch “The Story of Plastic” (https://www.storyofplastic.org/). The producers of the film encourage holding group discussions after the film so that audiences can actively think through action plans to reduce plastic use.
https://www.fractracker.org/a5ej20sjfwe/wp-content/uploads/2020/10/Waste-to-Energy-facilities-in-the-US-feature--scaled.jpg6671500Karen Edelsteinhttps://www.fractracker.org/a5ej20sjfwe/wp-content/uploads/2025/09/2025-Wordmark-Logo.pngKaren Edelstein2020-10-19 15:11:492021-04-15 14:16:05Incinerators: Dinosaurs in the world of energy generation
On August 3, 2020, New Yorkers rejoiced in Governor Cuomo’s signing of legislation to protect the Empire State from Pennsylvania’s fracking waste. Although New York State has banned high-volume, horizontal hydraulic fracturing, or “fracking” within its borders, a fracking waste loophole allowed numerous landfills to received both solid and liquid waste products from drilling operations just south of its border, according to records from the Pennsylvania Department of Environmental Protection (PA DEP).
What has been at stake
A regulatory loophole in New York State’s laws exempted drilling waste from scrutiny as hazardous materials. Therefore, solid and liquid wastes from drilling operations — including many constituents which are considered secret or “proprietary” — were sent to landfills, and in some cases, spread on roads and walkways in the state. Municipalities were provided with very little understanding of the risks those materials might be posing to air and water quality in and around landfills. Until the signing of this legislation, New York State Department of Environmental Conservation has considered road-spreading of waste brine from both conventional and unconventional oil and gas wells that was spread on roads a “BUD,” or a beneficial use determination.
Nevertheless, research has shown that produced water from fracking operations can contain tens to thousands of times the allowable drinking water concentration limit of radium, strontium, barium, lead, arsenic, and other elements. Human health impacts of all phases of drilling operations were explored in a recent paper by Wollin et al. (May 2020).
Water that flows to the surface from oil and gas wells, so-called ‘produced water’, represents a mixture of flow-back, the injected frac fluid returning to the surface, and the reservoir water present in natural oil and gas deposits. Among numerous hazardous compounds, produced water may contain bromide, arsenic, strontium, mercury, barium, radioactive isotopes and organic compounds, particularly benzene, toluene, ethylbenzene and xylenes (BTEX). The sewage outflow, even from specialized treatment plants, may still contain critical concentrations of barium, strontium and arsenic. Evidence suggests that the quality of groundwater and surface water may be compromised by disposal of produced water.
Carcinogenic and radioactive wastes that are brought to the surface with both conventional and unconventional drilling technologies can have toxic impacts on human health and the natural environment, impacting the endocrine, nervous, cardiovascular, and respiratory systems, as well as air and water quality. According to the Natural Resources Defense Council, more than 75 percent of the chemicals used in fracking are associated with harm to human organs, while 25 percent are tied to cancer and other genetic mutations.
How could this be allowed?
Although the federal Resource Conservation and Recovery Act (RCRA)—passed in 1976—specifically safeguards human and environmental health, an amendment to the Act in 1980 exempted from regulation all waste from oil and gas exploration, development, and production. Despite close to 40 years of federal oversight of pollution created by countless industries, oil and gas operations have been subject to far more lax regulations. And although states can pass their own regulations to supplement the federal rule-making, this had not occurred in New York State.
The lead-up to the legislation
The recent legislation to close the fracking loophole in New York State was sponsored in 2019 by Senator Rachel May and Assemblyman Steve Engelbright. Lawmakers had been deadlocked on the issue since 2011, but through much hard work, political and public will, and a favorable complement of elected officials, after the bills finally passed both the New York State Senate and Assembly, they could move to Governor Andrew Cuomo’s desk, where they were signed into law in early August, 2020. According to EarthWorks, all oil and gas waste will be
Subject to laboratory analysis to determine whether it has the characteristics of hazardous waste (i.e., ignitability, corrosivity, reactivity, and toxicity)
Subject wastes to clearer, stronger management regulations like processing, tracking and marking of loads, recordkeeping with a manifest system, reporting to DEC, and specific requirements for clean up in the case of a spill
In addition, the law ensures that waste is disposed of only at facilities equipped to safely handle it.
Now, even wastes like brine from conventional drilling operations must undergo laboratory analysis to determine whether they have characteristics consistent with hazardous materials.
Here’s a look back at our history of accepting fracking waste from Pennsylvania into New York State.
Visualizing a long history of oil and gas waste coming to New York State from Pennsylvania
FracTracker has annually mapped the flow of drilling waste from Pennsylvania to New York State.
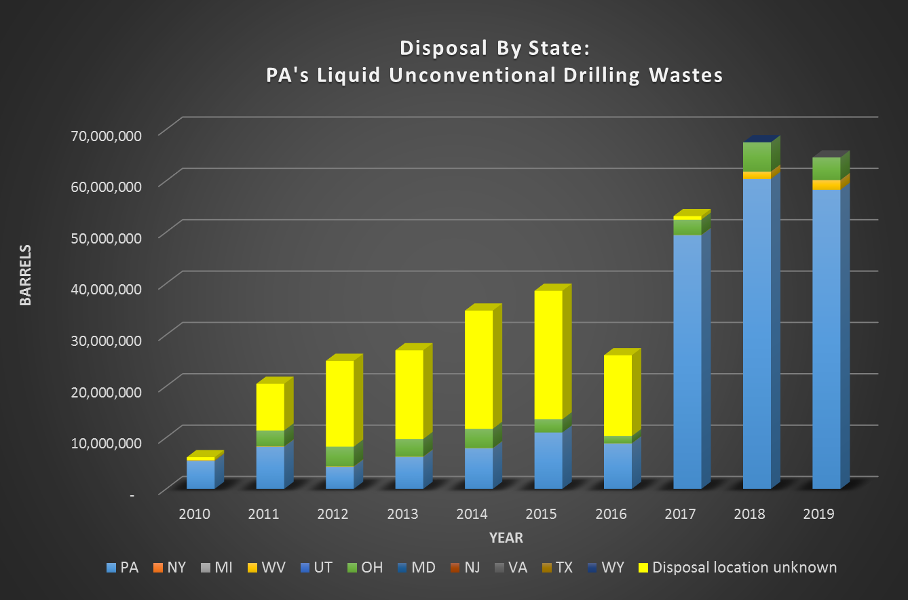
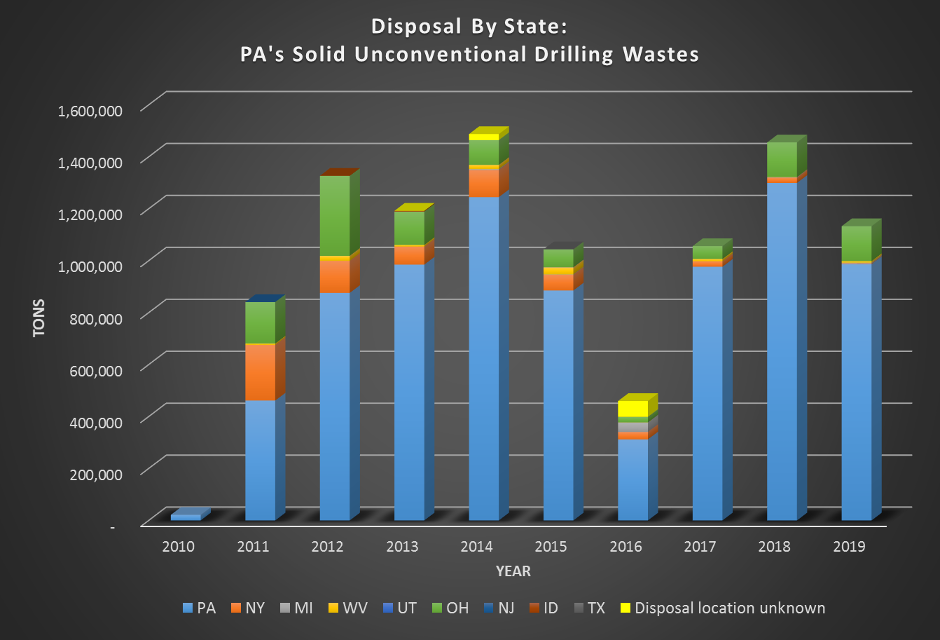
Since 2011, nearly 29,000 barrels of fracking liquid waste (drilling fluids, fracturing fluids, produced waters, etc.), along with close to 645,000 tons of solid waste (drill cuttings—some of it radioactive, sludge, contaminated soils, etc.) from Pennsylvania drilling operations have been disposed of in New York State. For more references on radioactivity in drilling materials, explore this resource. Drilling waste reports available from 2010 through the present show a steady decline in waste sent to New York State, beginning in 2011. Nonetheless, New York’s landfills have received as much as 11,548 barrels of drilling waste, and 214,168 tons of solid waste in a given year.
PA DEP’s records are far from complete prior to 2016, however, with disposal destinations unknown for close to 2/3 of liquid waste (see yellow portions of the bar chart in Figure 1) generated between 2012 and 2015.
In more recent years, waste products were accounted for more accurately, as well as shipped to injection wells in Ohio.
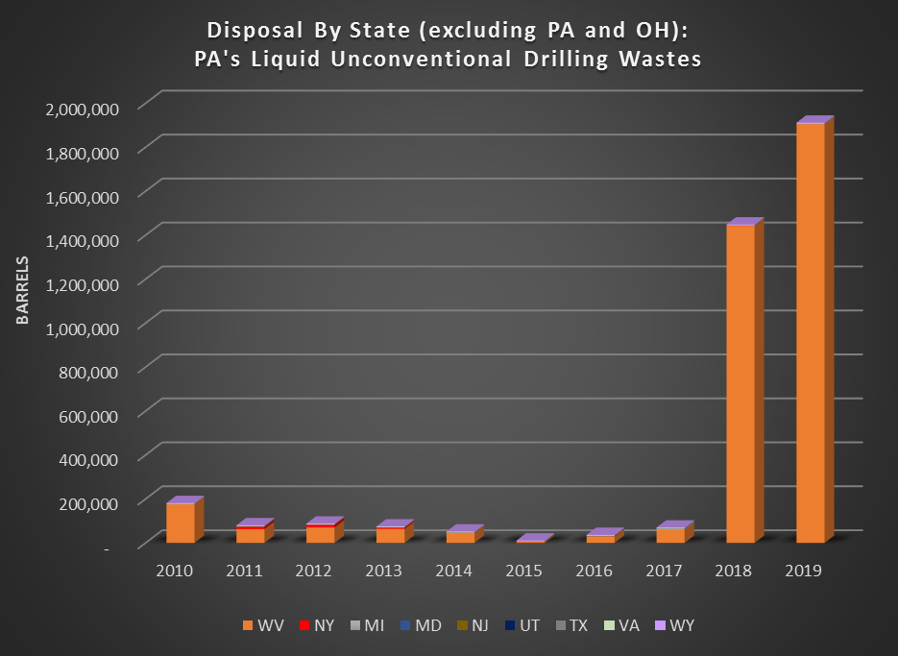
On a relatively smaller scale, one can also see how West Virginia’s acceptance of Pennsylvania’s fracking waste has skyrocketed in 2018 and 2019, particularly in comparison to states other than Pennsylvania and Ohio (Figure 2).
Figure 2. Pennsylvania’s liquid unconventional drilling waste disposal by state (excluding Pennsylvania and Ohio), 2010-2019
In general, records indicate more solid waste disposal occurring within Pennsylvania over time, with Ohio accepting varying quantities from year to year, and New York State steadily receiving less over time (Figure 3).
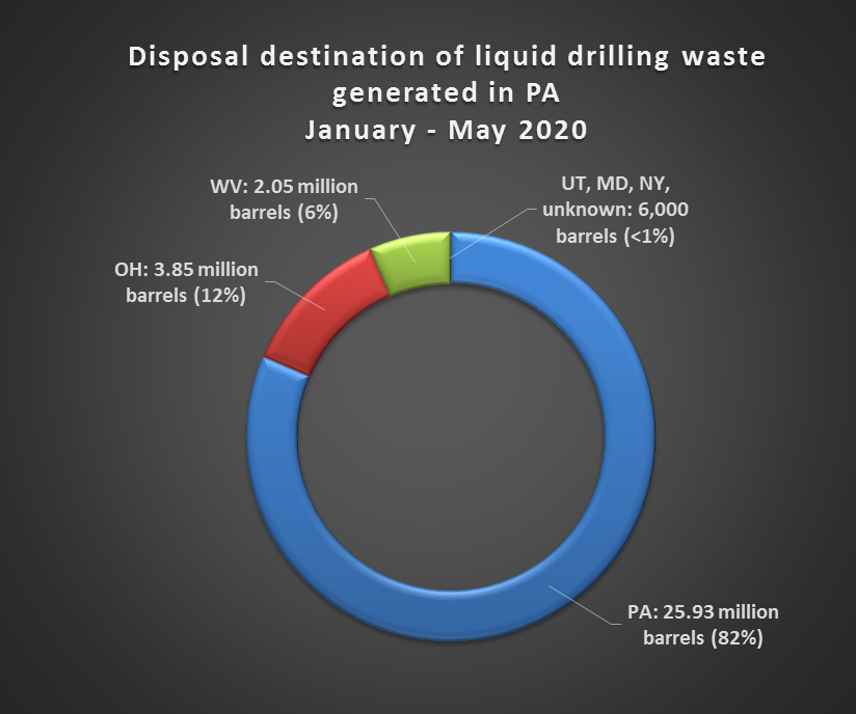
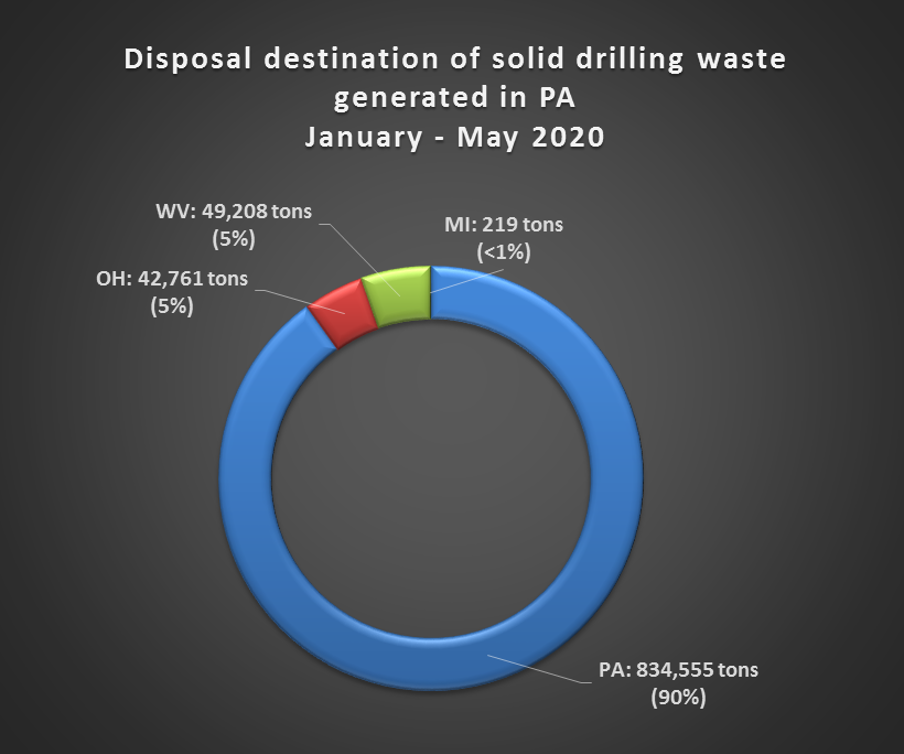
Now that the regulatory loophole has been closed, these numbers should drop to near zero. Data about waste coming from Pennsylvania to New York in the first half of 2020 support that assertion (Figures 4 and 5).
FracTracker applauds New York State for closing the fracking waste loophole and in doing so, continuing to set high standards to protect its residents from the human and environmental impacts created by oil and gas extraction. We hope that other states will follow suit, and develop their own stringent standards to protect human and environmental health, in particular where federal legislation like RCRA has fallen woefully short.
https://www.fractracker.org/a5ej20sjfwe/wp-content/uploads/2020/08/TAuch_Infrastructure-FrackPad_ImpoundmentPond_AccessRoad-PineCreekWatershed_PA_LightHawk_Aug2019-Feature.jpg8331875Karen Edelsteinhttps://www.fractracker.org/a5ej20sjfwe/wp-content/uploads/2025/09/2025-Wordmark-Logo.pngKaren Edelstein2020-08-28 15:38:042021-04-15 14:16:10New York State Closes the Fracking Waste Loophole
By Kim Fraczek (Sane Energy Project), with input and mapping by Karen Edelstein (FracTracker Alliance)
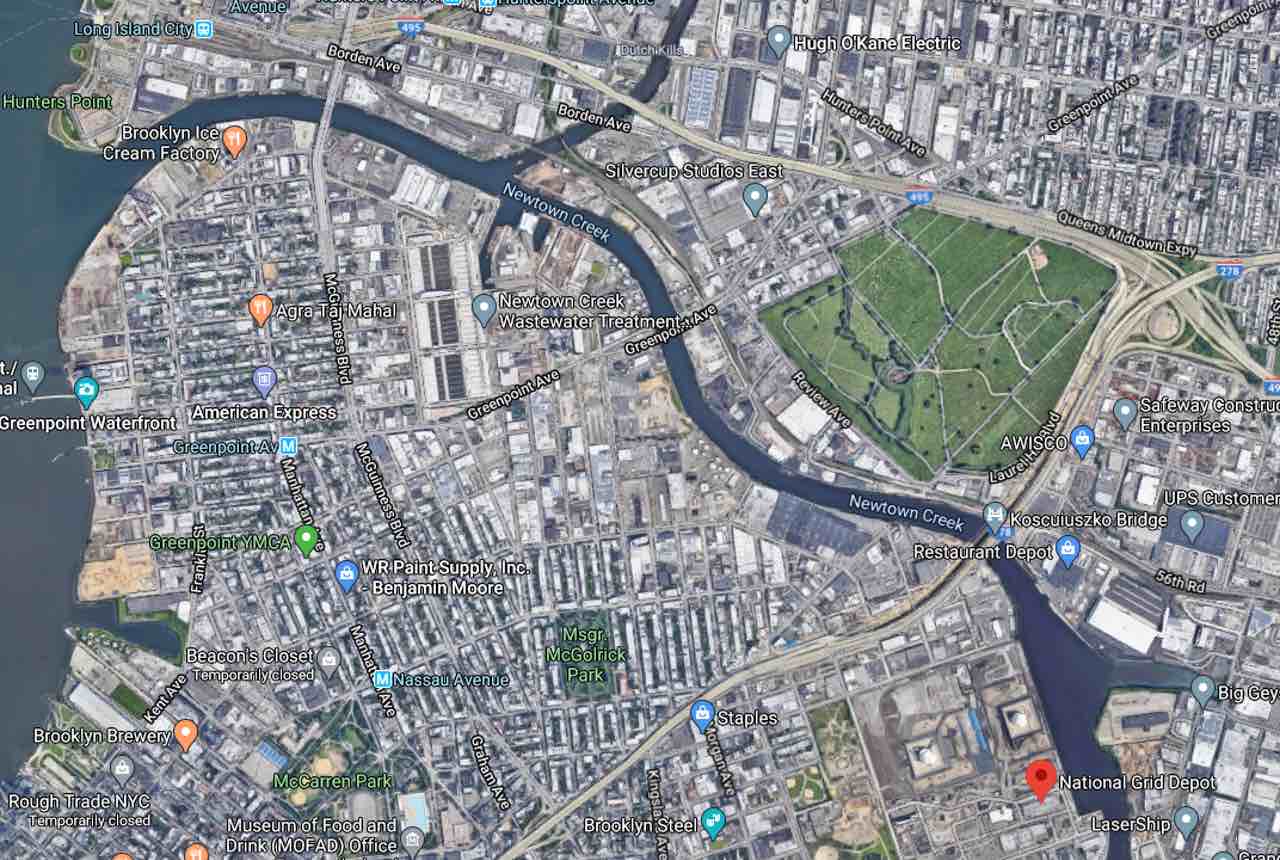
Despite overwhelming concern about the impacts of fossil fuels on climate chaos, pipeline projects are springing up all over the country in an effort find markets for the surplus of fracked gas extracted from the Marcellus region in Pennsylvania. New Yorkers are directly impacted by these problematic supply chains. The energy company, National Grid, is proposing to raise New Yorkers’ monthly bills in order to complete a new, 30-inch high-pressure fracked gas transmission pipeline through Brooklyn, New York. National Grid euphemistically named the 350-psi pipeline the “The Metropolitan Reliability Pipeline Project.” Gas moving through this pipeline is destined for a National Grid Depot on Newtown Creek, which divides Brooklyn from the borough of Queens. National Grid plans to expand liquefied natural gas (LNG) storage and vaporizer operations at the Depot. The Depot expansion will also facilitate trucking transport of gas to and from North Brooklyn to destinations in Long Island and Massachusetts.
For an industry explanation on how vaporizers work, click here.
National Grid Depot is located on the western bank of Newtown Creek. Source: Google Maps
National Grid is asking the New York State Public Service Commission (PSC) to approve:
A charge of $185 million to rate-payers in order to finish the current pipeline phase under construction in Bushwick. Pipeline construction would continue north into East Williamsburg and Greenpoint (other sections of Brooklyn)
$23 million to replace two old vaporizers at National Grid’s Greenpoint LNG facility
$54 million to add two new vaporizers to the Greenpoint LNG facility
$31.5 million over the next 4 years to add “portable LNG capabilities at the Greenpoint site that will allow LNG delivered via truck to on-system injection points.” National Grid is currently seeking a variance from New York City for permission to bring LNG trucks onto city property. Currently, this sort of activity is illegal due to high risk of fires and explosions.
Impacts on the community, resistance to the pipeline
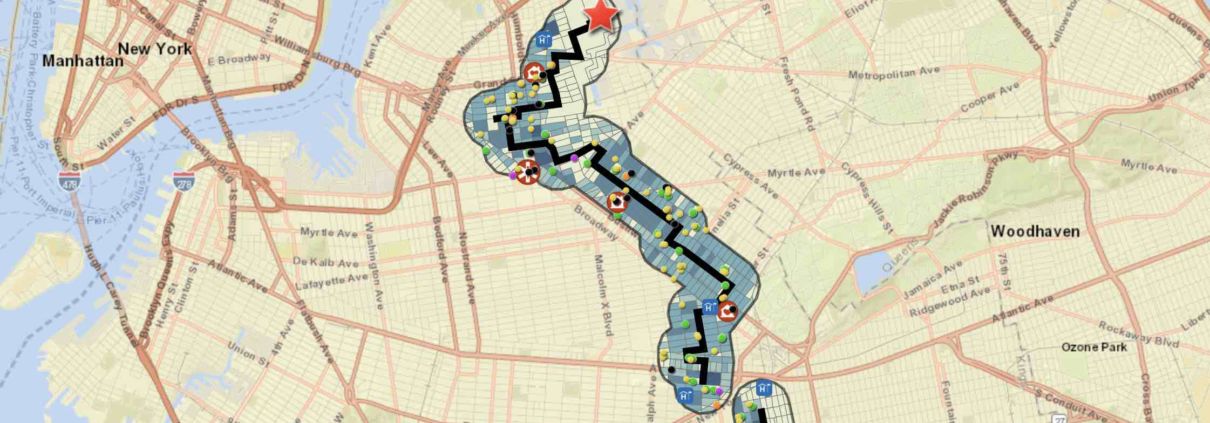
Pipelines also present risks of catching fire and exploding. On average, a 350-psi gas pipeline has an evacuation radius of approximately 1275 feet. FracTracker Alliance created the interactive map, below, using 2010 census data to show population density in the neighborhoods within this blast zone. According to FracTracker, there were 614 reported pipeline incidents in the United States in 2019 alone, resulting in the death of 10 people, injuries to another 35, and about $259 million in damages.
There is widespread community opposition to this pipeline, LNG expansion, and trucking proposal because it will:
Threaten the health and safety of nearly 153,000 people living in the evacuation zone. Concerns include air quality impacts from fugitive methane that could especially impact those with asthma, and functional logistics around safe evacuation in the event of a leak or explosion.
Within the evacuation zone, using federal data, FracTracker determined that there are also:
Opponents of this pipeline project also raise objections that the pipeline will:
Become a stranded asset leaving residents to foot the bill for the pipeline as city and state climate laws are implemented
Contribute carbon monoxide and methane to the atmosphere, thereby accelerating climate change and its impacts on coastal metropolises like New York City
Project Status
National Grid is currently constructing Phase 4 of the pipeline. However, public pressure and concern about COVID-19 safety measures forced them to stop construction on March 27, 2020. After Governor Cuomo issued an executive order to halt all non-essential work, neighbors reported the company was not mandating personal protective equipment (PPE) nor social distancing for its workers.
Additionally, funding to build north of Montrose Avenue in Bushwick through to Greenpoint—neighborhoods in northeastern Brooklyn on the border with Queens that make up the fifth phase of the pipeline construction—is pending a decision by the Public Service Commission. The approval of the fifth phase of the pipeline would allow it to reach the LNG facility at Greenpoint.
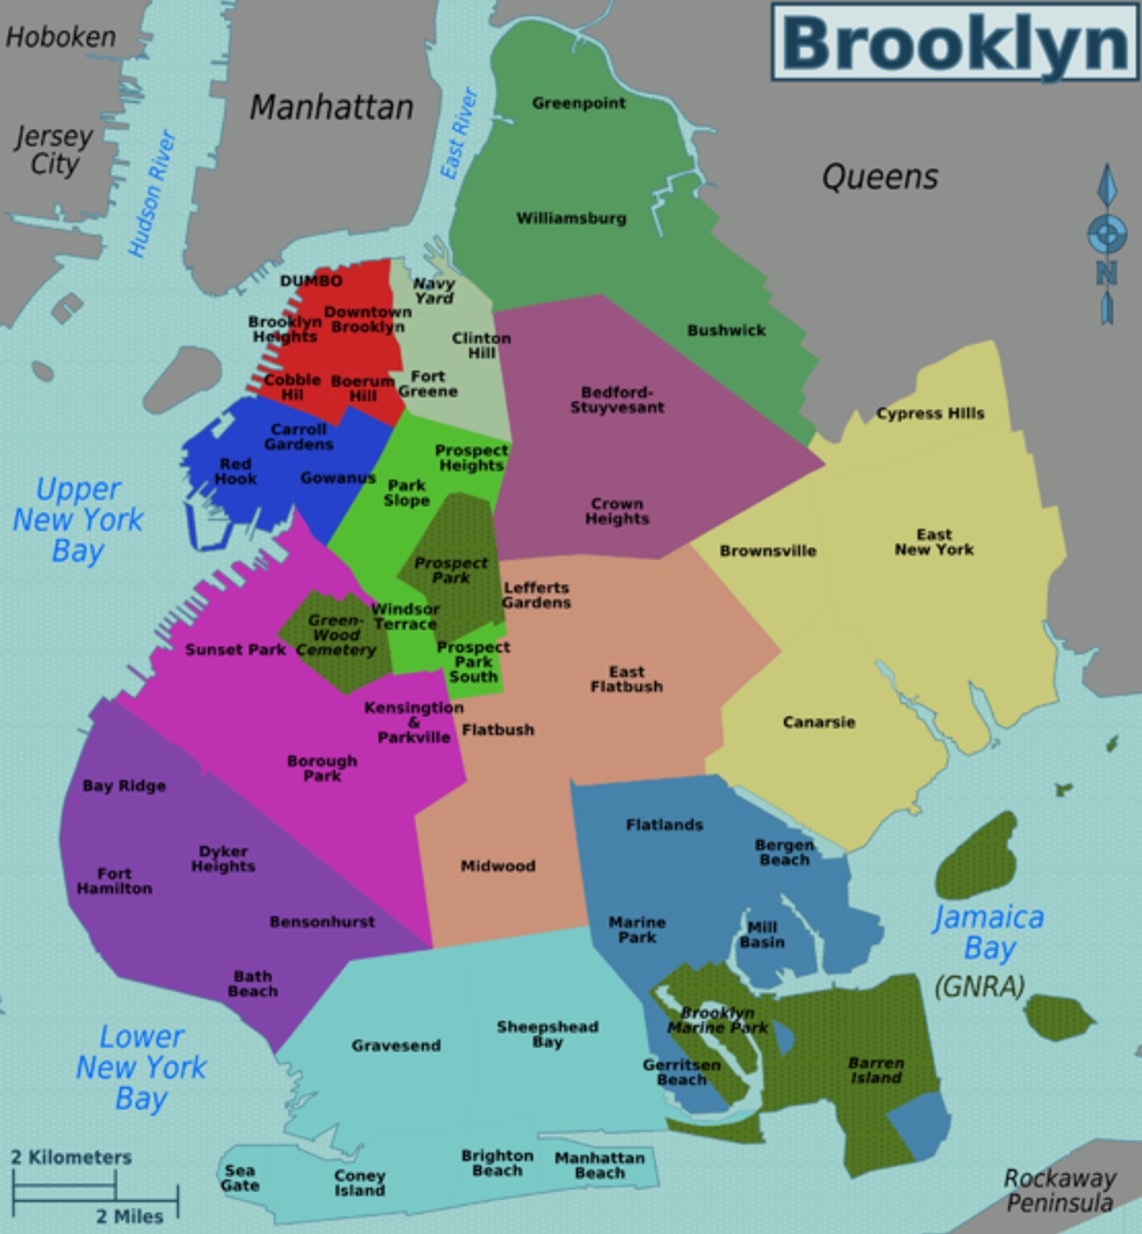
Generalized map of Brooklyn neighborhoods. Source: Wikipedia.
The current National Grid rate case proceeding is in its last stage of discovery, testimony, cross-examination, and final briefs from parties to the rate case. The Administrative Law Judges overseeing the proceeding will review all parties’ information, and make a recommendation to the Public Service Commission, a five-person panel appointed by New York State Governor Cuomo to regulate our utilities. This decision will most likely happen at the monthly meeting on June 18, 2020, where they also may make a decision on National Grid’s Long Term Plan proceeding that could determine the future of LNG expansion in North Brooklyn.
What are the broader economic and political concerns for stopping this, and other new pipeline projects?
Sane Energy Project has laid out a clear and cogent set of arguments. These include:
This project is not about “modernizing” our system for heating and cooking. This is about an expansion to charge rate-payers an increase and to grow profits for National Grid’s shareholders.
This is a transmission pipeline, not a gas distribution line. It will not service the affected community where the already trafficked main thoroughfares and already stressed trucking routes for local businesses will be dug up.
Gas pipelines are not safe. According to the United States Pipeline and Hazardous Safety Materials Administration (PHMSA), between 2016 and 2018, an average of 638 pipeline incidents per year resulted in a total of 43 fatalities and 204 injuries . The cost to the public for these incidents over those three years was nearly $2.7 billion. [For more analysis on national pipeline incidents, see FracTracker’s February 2020 article.]
Fracking exacerbates climate change. Methane is a potent greenhouse gas. Over a 20 year period, it contributes 86 to 100 times more atmospheric warming than equivalent amounts of carbon dioxide. Climate change is destroying Earth’s ability to sustain life.
This project holds New York State back on our renewable energy goals. We should be mandating any gas pipelines should be replaced with geothermal energy, along with energy efficiency measures in our buildings.
The industry coined the term “natural” gas to create the sense that it is clean, but the extraction, transport and burning of this gas creates air pollution, disturbs ecosystems, contaminates drinking water sources,and disproportionately affects lower income communities and communities of color.
A report authored by Suzanne Mattei, former DEC Region 2 Chief, notes National Grid does not have gas supply constraints–the situation where consumer demand exceeds the supply. Mattei contends that this is a manufactured crisis to maintain business-as-usual, keep us hooked on fossil fuels, and charge rate-payers for construction well after the lifespan of this pipeline. This makes local constituents pay for the company’s stranded assets. National Grid themselves report that they are able to handle yearly peak demand through existing supplemental gas sources. What’s more, the EIA expects for natural gas demand to remain flat over the course of the next decade, refuting National Grid’s claim that their massive pipeline project is necessary to respond to the few hours of peak demand experienced each year.
This is actually a substantial project, which avoided more stringent permitting and discussion by breaking the work into five separate projections, a process known as “segmentation”. The North Brooklyn Pipeline project is disguised as a local upgrade by segmentation, while in reality, it is a much larger project leading to an LNG (Liquefied Natural Gas) depot, CNG (Compressed Natural Gas) and other fracking infrastructure facilities in Greenpoint.
National Grid is requesting almost 185 million ratepayer dollars over the next three years to complete the project.
What’s next?
As gas prices continue to drop and renewable energy technologies are more accessible and wide-spread, the whole equation that relies on a fossil fuel-based economy becomes more desperate and unsustainable. Many communities are also saying “no” to new pipelines in their communities, so industry is looking to ship fracked gas over land by truck. Another method for disposing of surplus gas is to compress it into LNG (liquefied natural gas) and ship it to international markets by boat.
For more updates on the North Brooklyn Pipeline, check Sane Energy Project’s website. If you live in the New York/Metropolitan area and want to get involved in this fight, there are numerous ways in which you can work with Sane Energy. Click here for details.
https://www.fractracker.org/a5ej20sjfwe/wp-content/uploads/2020/05/North-Brooklyn-Pipeline-demographics_1.jpg9142242Guest Authorhttps://www.fractracker.org/a5ej20sjfwe/wp-content/uploads/2025/09/2025-Wordmark-Logo.pngGuest Author2020-05-18 09:00:212021-04-15 14:16:48New Yorkers mount resistance against North Brooklyn Pipeline
We’ve recently updated the New York State Oil and Gas Well Viewer with data up to 2020. The map and data below show that conventional gas drilling in New York State has decreased significantly since the first decade of 2000, but drilling for oil in western New York has increased in the past few years. In part thanks to the fracking ban in New York State, less than 1% of the wells in New York State have been drilled unconventionally.
These data are compiled by the New York State Department of Environmental Conservation on their Downloadable Well Data site, and mapped by FracTracker. Well data can either be accessed as a zipped file, or viewed on a well-by-well scale through a searchable database.
Summary
Currently, there are more active gas wells in New York State than all other types combined. Fewer than 1% of the wells in the New York State database have been drilled directionally or horizontally. And only a fraction of those were gas wells. Since 2014, high-volume hydraulic fracturing has been banned, due to health and environmental concerns.
Western New York State was once a very active region for oil drilling, but today, only 21% of all oil wells are still active. Additional well types include brine solution mines. Many of these mines, once a large enough cavern has been dissolved, are later converted into storage mines for gas.
Well type, as of 24 January 2020
Status = Active
Status = Other (includes plugged and abandoned, unlisted/unknown, converted, voided/expired permit, etc.)
Gas well
6,721 (58% of all active wells)
4,214 (13% of “other” categories)
Oil well
3,581 (31% of all active wells)
13,217 (40% of “other” categories)
Storage well
840 (7% of all active wells)
146 (<1% of “other” categories)
Monitoring well
165 (1% of all active wells)
311 (1% of “other” categories)
Brine well
138 (1% of all active wells)
593 (2% of “other” categories)
Other (145 geothermal, 7724 category not listed)
85 (1% of all active wells)
7,784 (23% of “other” categories)
Disposal well
36 (<1% of all active wells)
4,186 (13% of “other” categories)
Dry hole
4 (<1% of all active wells)
2,786 (8% of “other” categories)
Total
11,570
33,237
Patterns in Well Drilling
Well drilling in New York State was at a high point between the mid-1960s and the early 1990s. After another peak in activity in the first decade of the 21st century with conventional gas drilling, activity has dropped off sharply.
Figure 1. Oil and gas wells in New York State per year, 1990-2020. Data from NYS DEC.
A Potential Uptick in the Past Few Years
While gas drilling in New York State has tapered off dramatically, drilling for oil in Cattaraugus County in western New York has increased significantly since 2017.
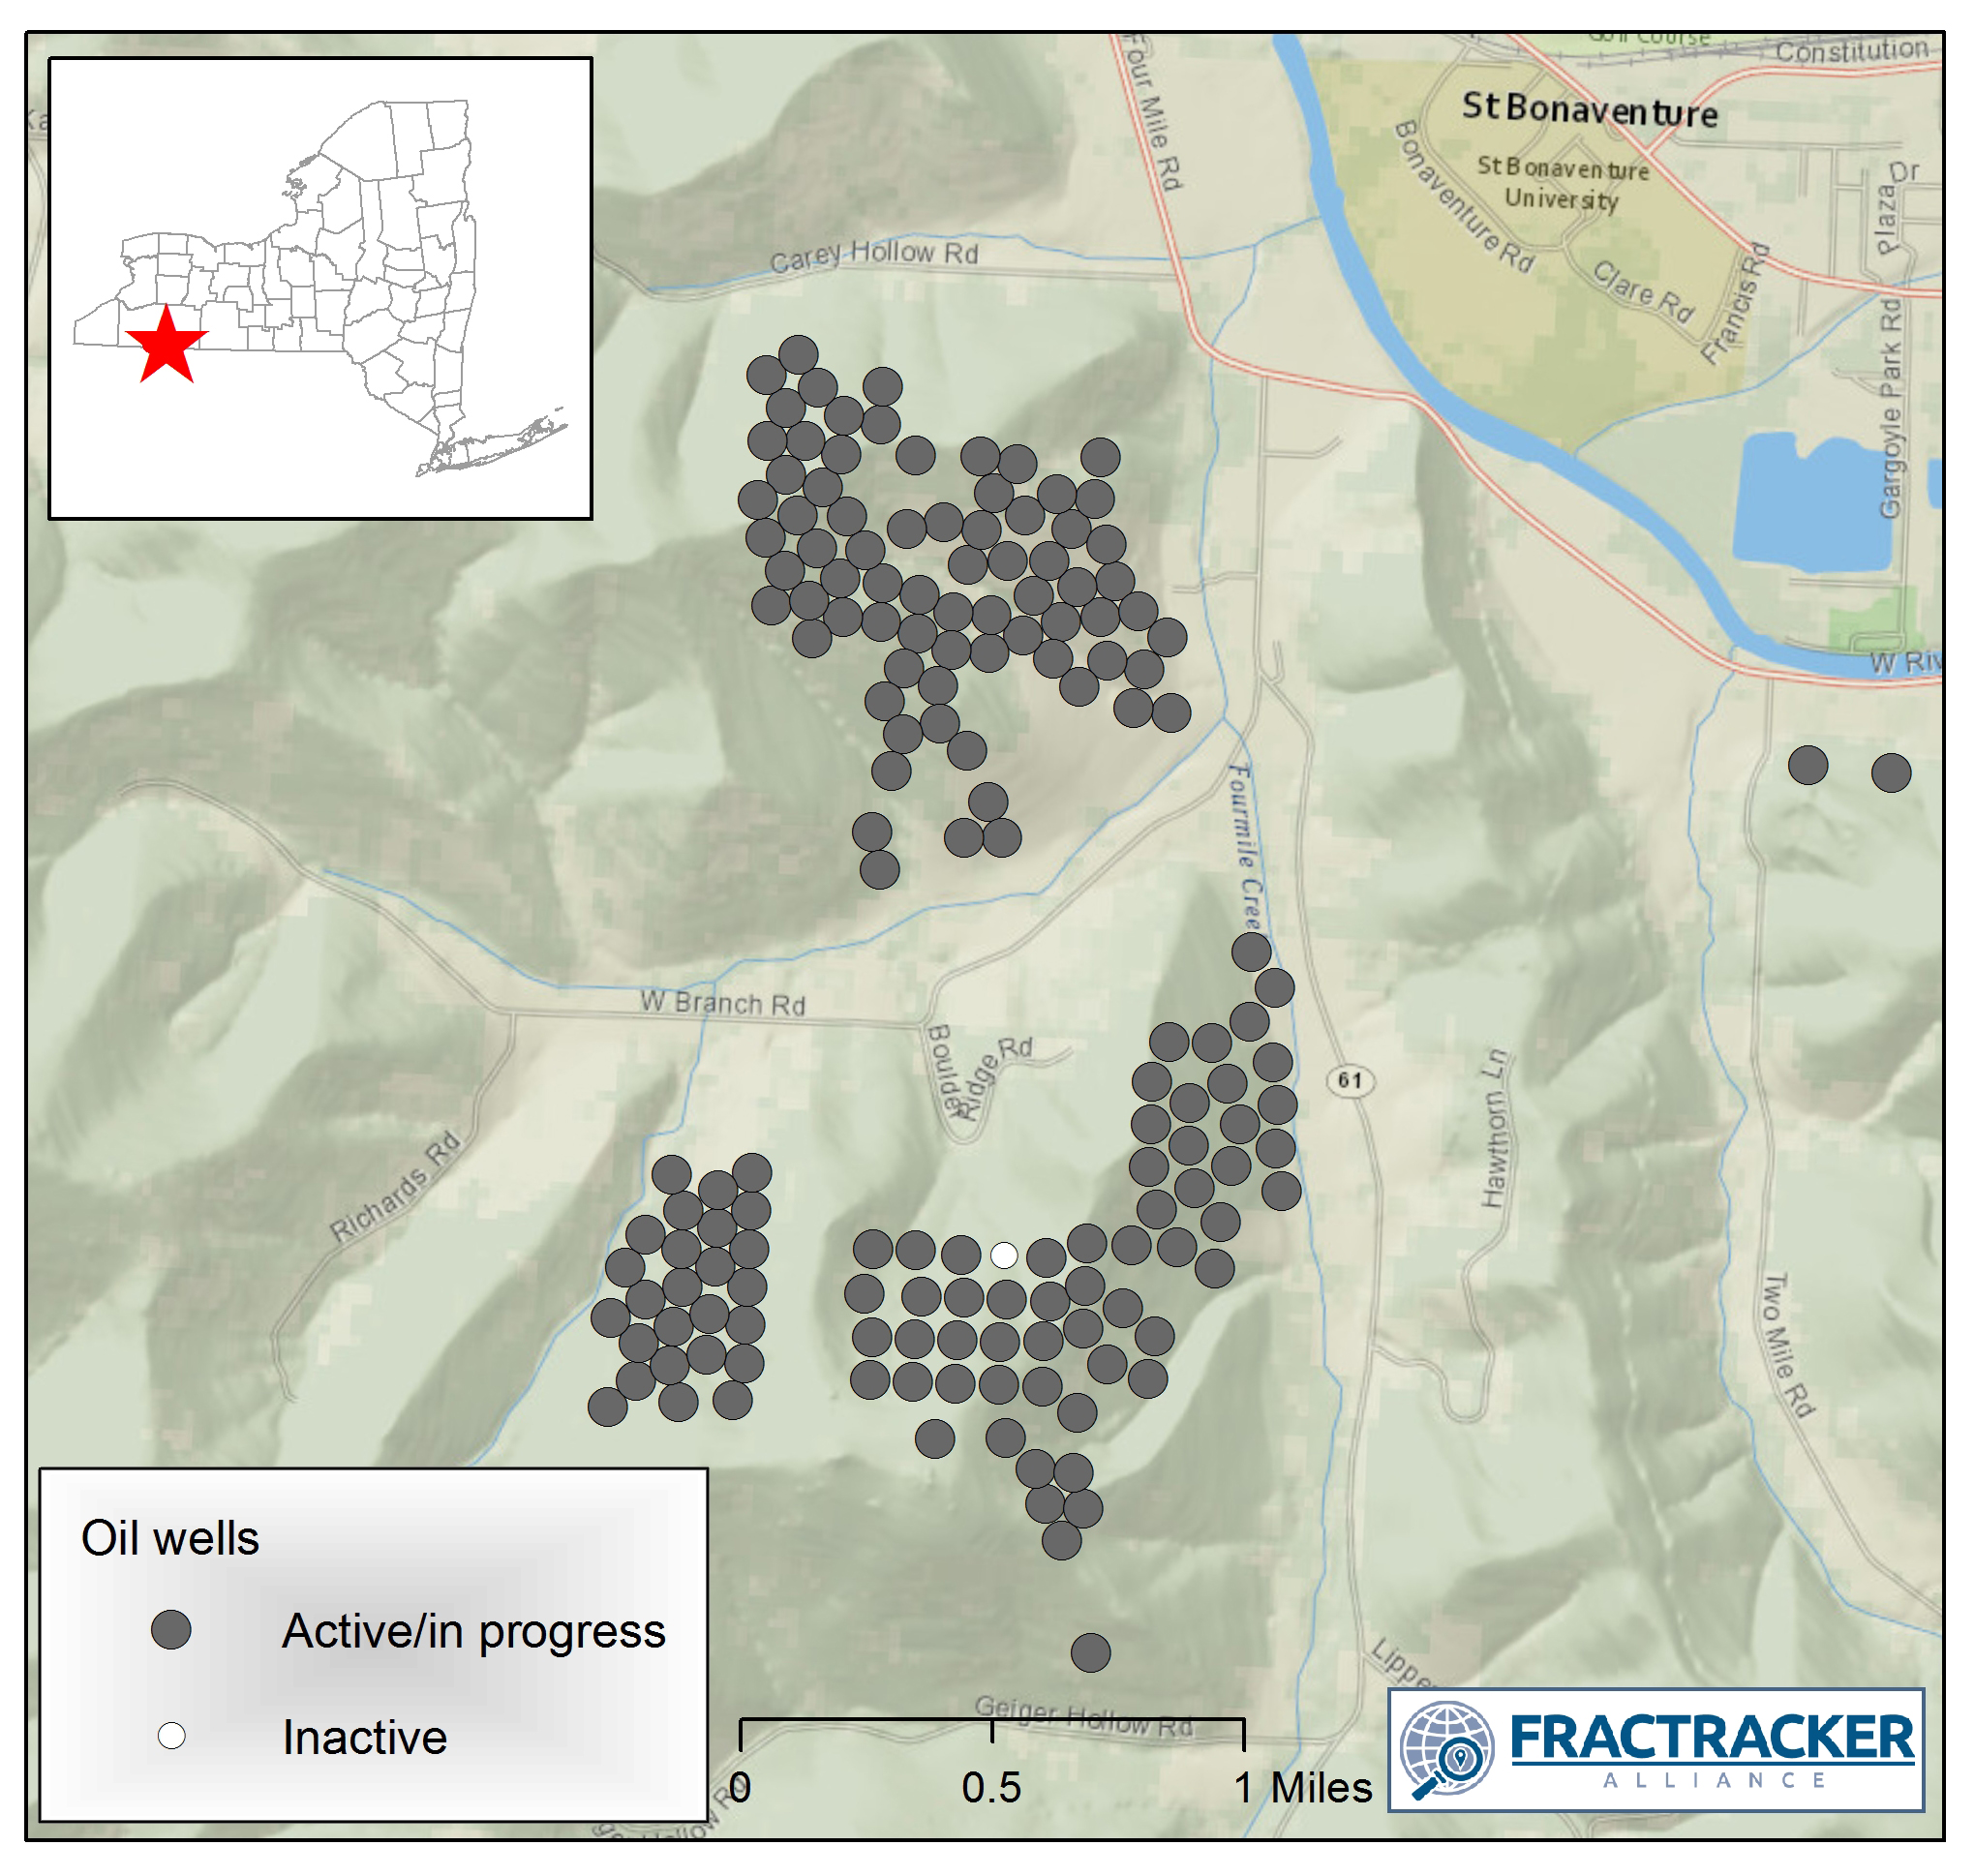
Figure 2. Oil wells drilled in Cattaraugus County, New York, 2018-19. Data from NYS DEC.
Nearly every one of the 169 new wells drilled in New York State during 2019 was an oil well within 5 miles of St. Bonaventure in Cattaraugus County. We’ll be following up shortly with a more in-depth analysis of the issues and risks associated with this oil “boom” in the upper reaches of the Allegheny River of New York State.
https://www.fractracker.org/a5ej20sjfwe/wp-content/uploads/2020/03/New-York-State-Oil-Gas-Well-Viewer-2020.jpg12081966Karen Edelsteinhttps://www.fractracker.org/a5ej20sjfwe/wp-content/uploads/2025/09/2025-Wordmark-Logo.pngKaren Edelstein2020-03-11 12:07:052021-04-15 14:16:54New York State Oil & Gas Wells – 2020 Update
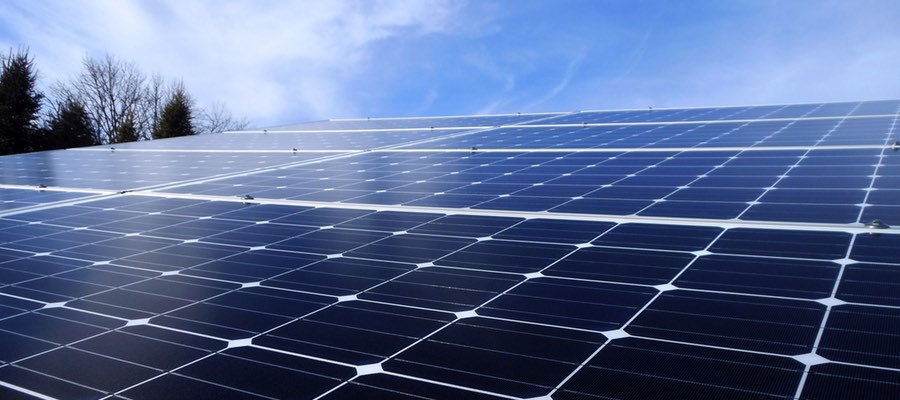
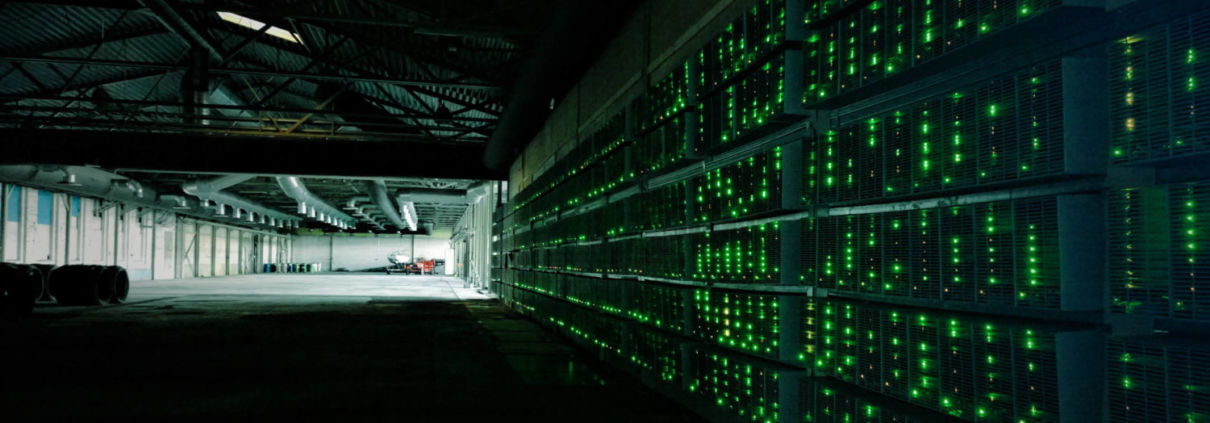
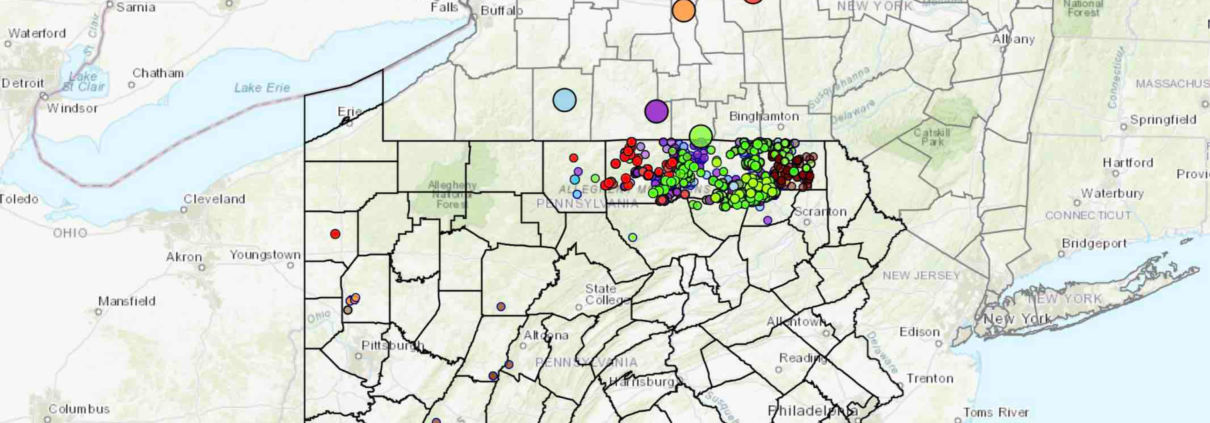
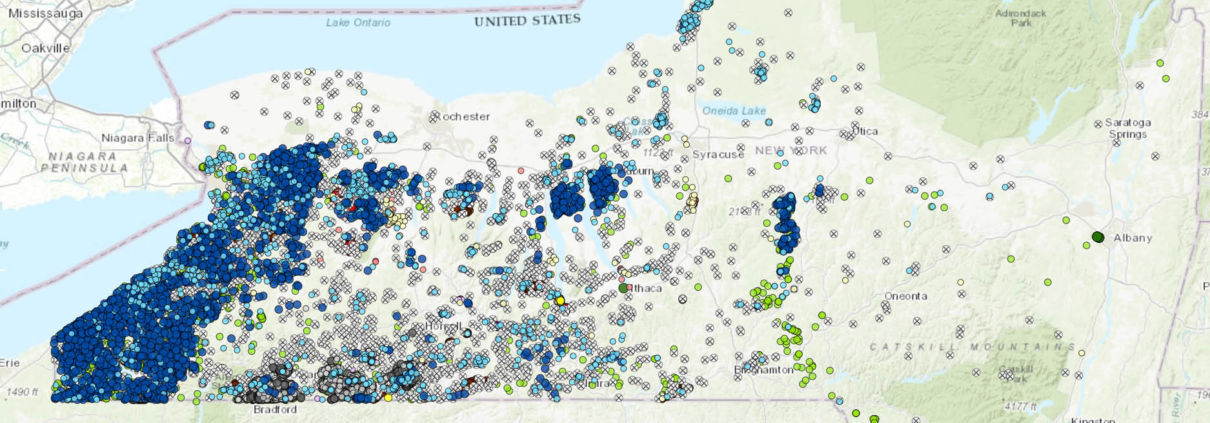
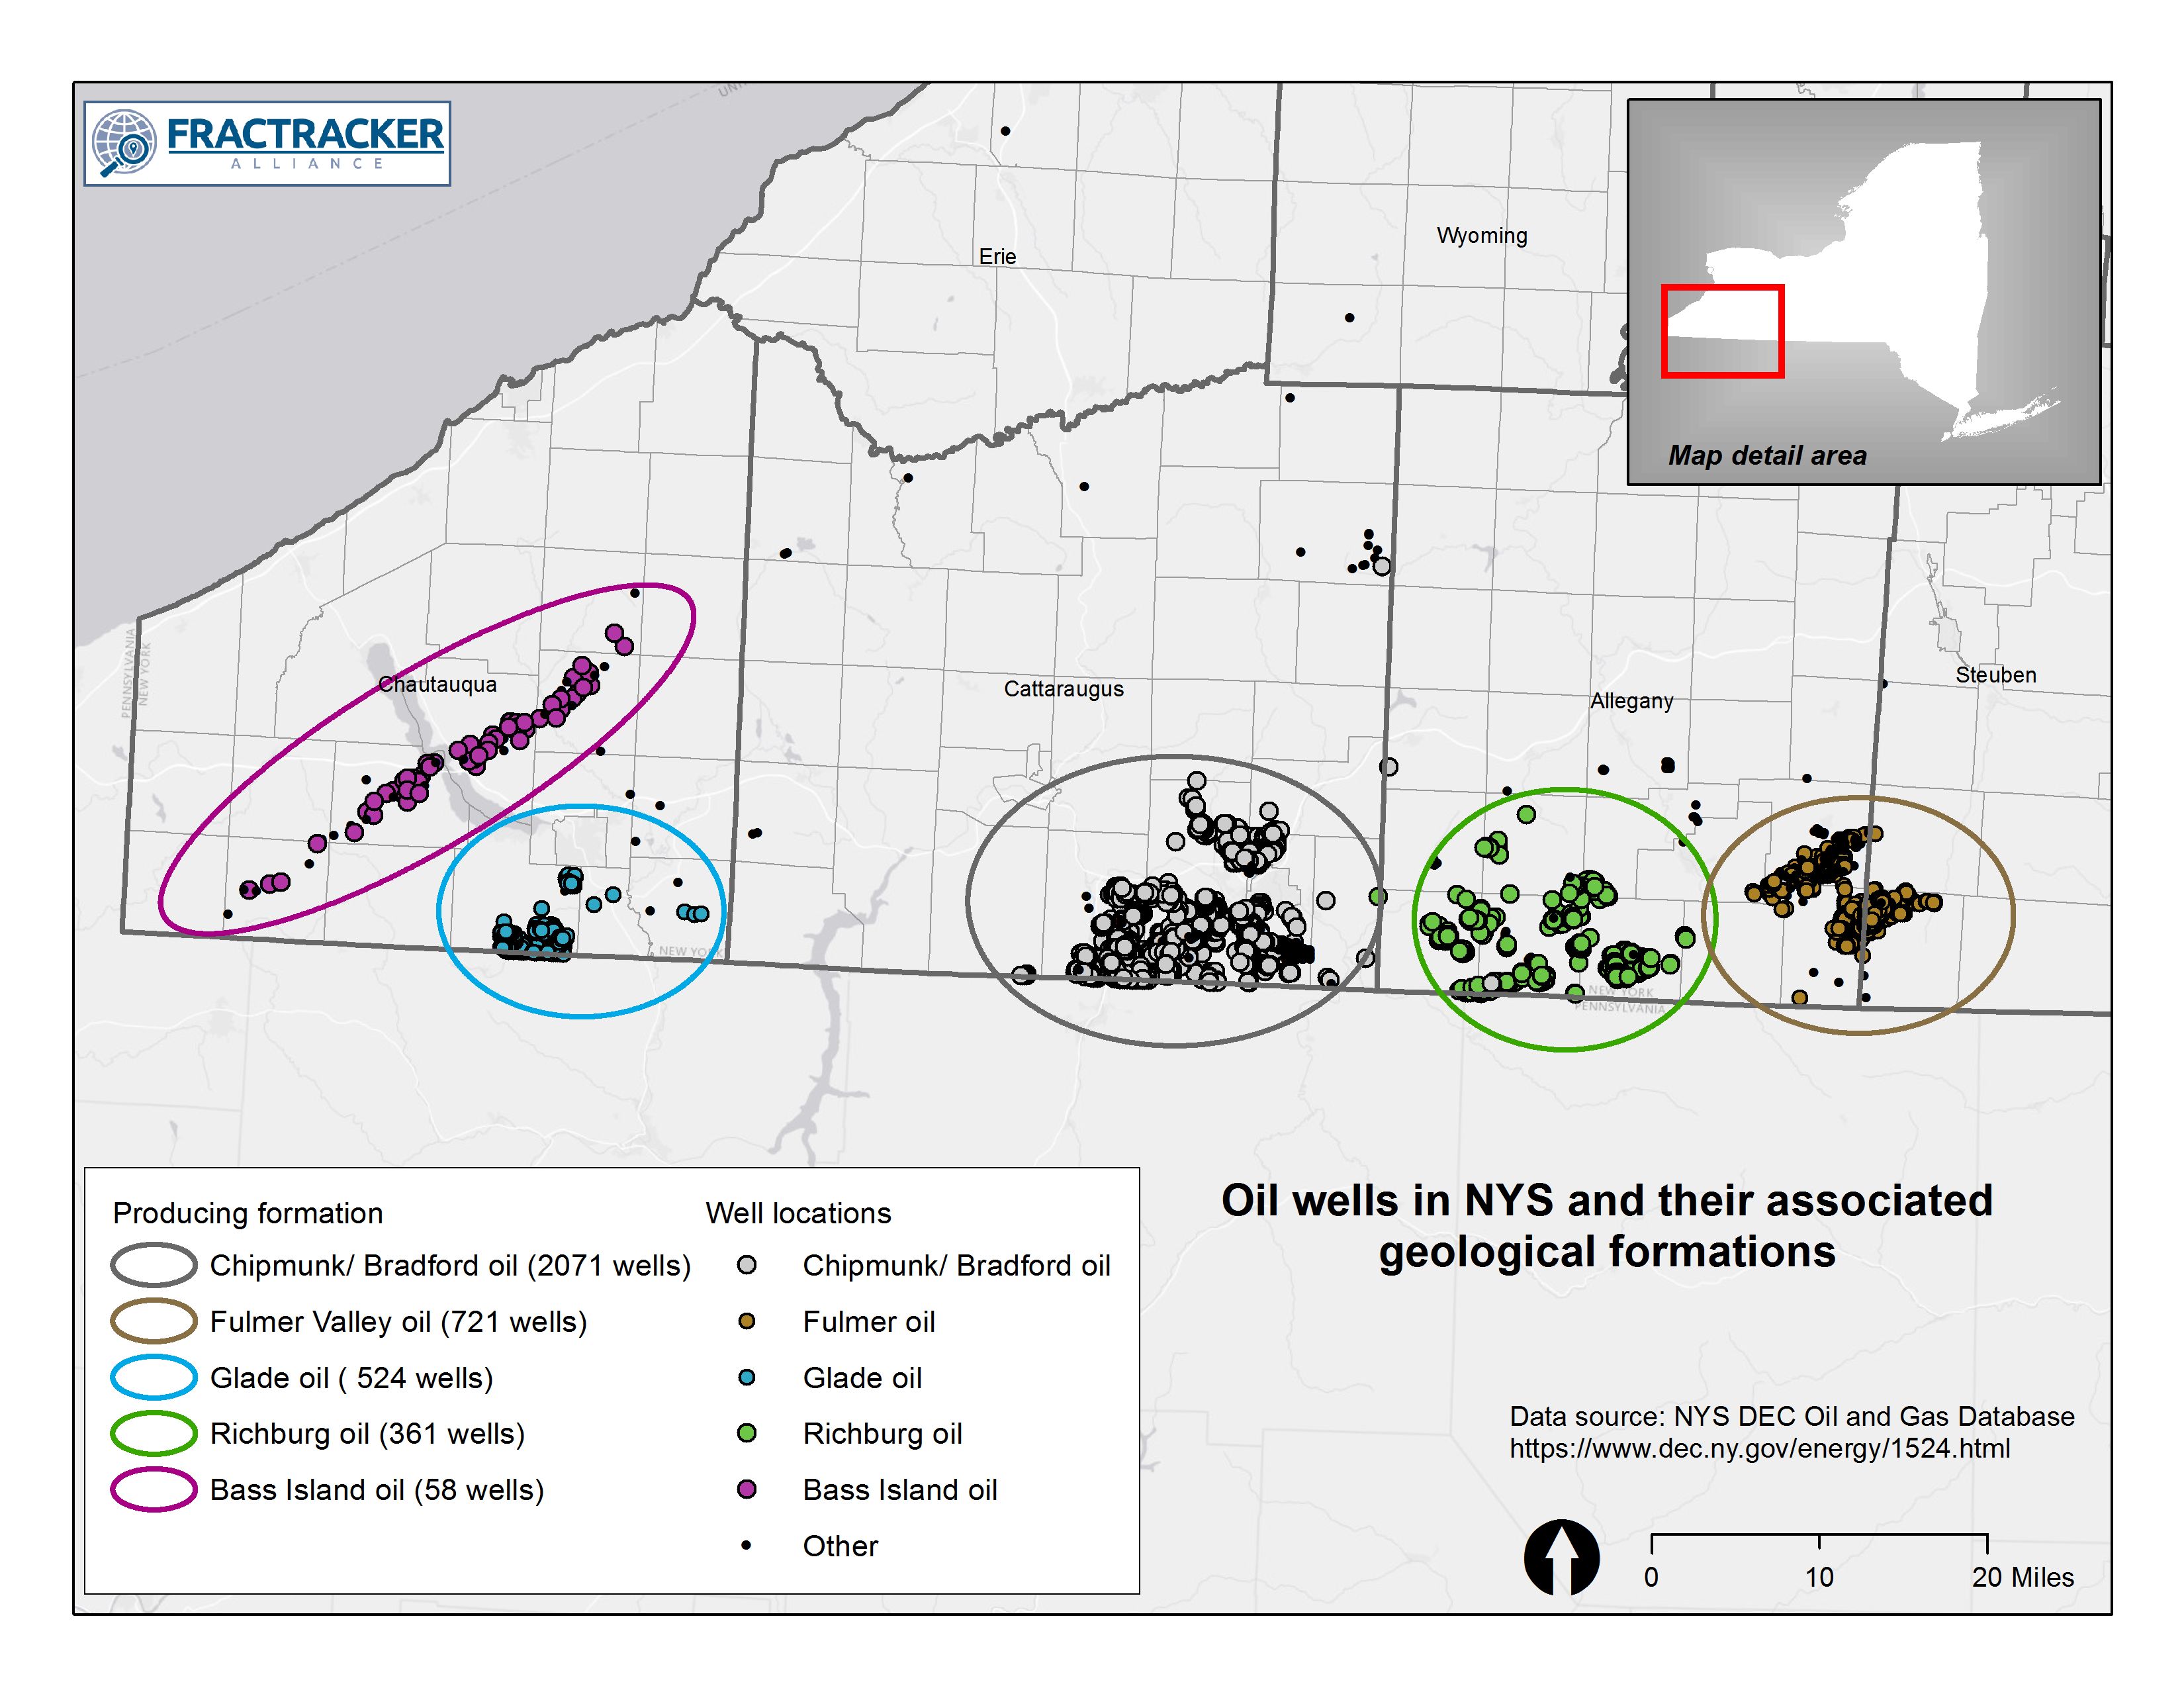 Figure 1. Oil Wells in NYS and Their Associated Geological Formations. Gas wells have historically been most productive in the Medina Formation, followed by the Queenston, and also Trenton-Black River Formations.
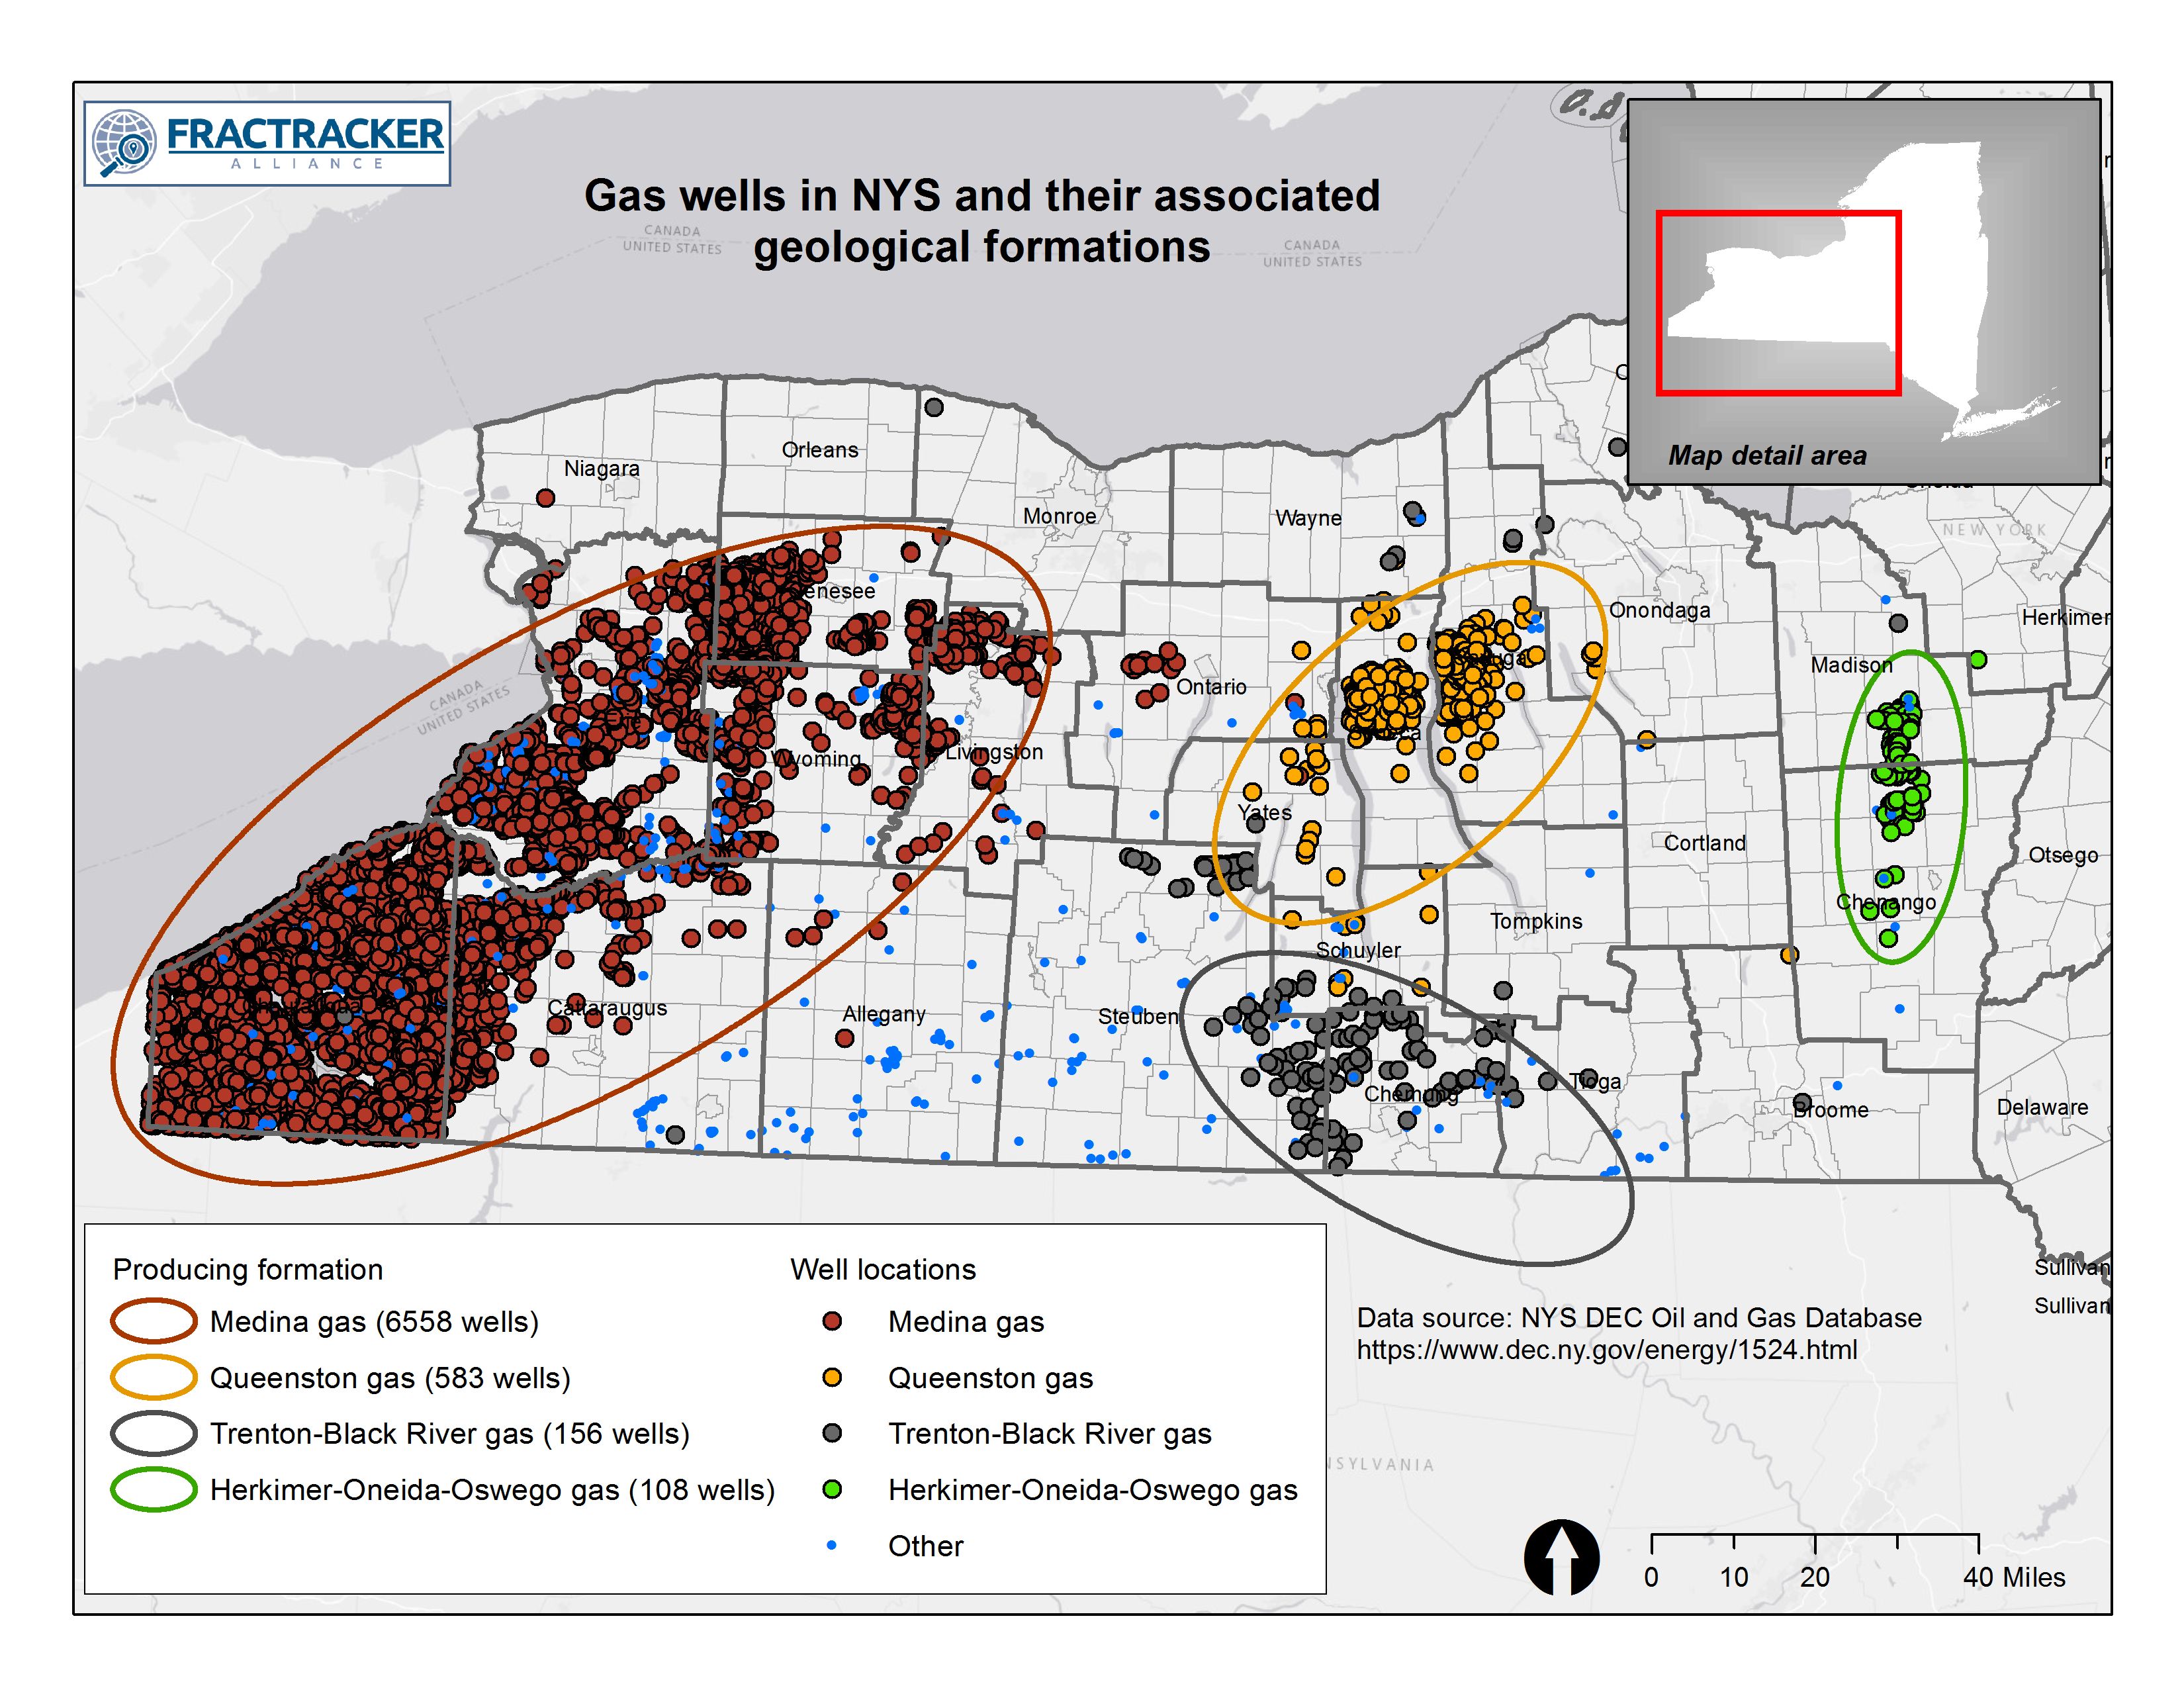

