Tag Archive for: New York

New York: A Sunshine State!

Photovoltaic solar resources of the US (NREL)

Photovoltaic solar resources of the US (NREL)

It’s difficult to talk about the risks of oil and gas extraction without providing data on energy alternatives in the conversation. Let’s look at New York State, as an example. There, solar power is taking a leadership position in the renewable energy revolution in the United States. Although New York State receives far less sunshine than many states to the west and south, the trends are bright! Currently, New York State ranks seventh in the nation in installed solar capacity, with over 700 MW of power generated by the sun, enough to power 121,000 homes.

Despite common assumptions that solar power only makes sense where the sun shines 360 days a year, we’ve been seeing successful adoption of solar in Europe for years. For example, in Germany, where even the most southern part of the country is further north of the Adirondack Mountains in New York State, close to 7% of all the power used comes from combined residential and commercial scale photovoltaic sources–35.2 TWh in all. Munich, one of the sunniest places in all of Germany, has a lower average solar irradiation rate of 3.1 kWh/m2/day than most cities in New York State; compare it with locations in New York like Rochester (3.7 kWh/m2/day), New York City (4.0 kWh/m2/day), and Albany (3.8 kWh/m2/day). At present, Germany still leads New York State by more than double the electrical output from solar for equivalent areas.

cumulative_capacity

Cumulative Solar Capacity in New York

The cumulative capacity for completed photovoltaic systems in New York State has risen steeply in the past three years, with ground-mounted and roof-top residential capacity outpacing commercial capacity by a wide margin.

Nonetheless, commercial and industrial scale installations in New York account for over 100 MW of power capacity in the state.

Large-Scale Solar Installations Map

This map shows the location of those large-scale solar installations in the US (zoom out to see full extent of US), as of March 2016. Here is our interactive map:

View map full screen | How FracTracker maps work

In the past fifteen years, the increase in small to medium-sized solar installations in New York State has been significant, and growth is projected to continue.  The following animation, based on data from the New York State Energy Research and Development Authority (NYSERDA), shows that increase in capacity (by zip code) since 2000:

solar_animation_cumulative_2000-15

Solar Installations by Zip Code

NYSERDA also provides maps that show distributions of residential, governmental/NGO, and commercial solar energy projects (images shown below). For example, Suffolk County leads the way in the residential arena, with nearly 8200 photovoltaic (PV) systems on roofs and in yards, with an average size of 8.3 kW each.

Erie County has 128 PV systems run by governmental and not-for-profit groups, with an average size of about 27 kW each. Albany County has over 320 commercial installations, with an average size each of about 117 kW.

New York State’s Future Solar Contribution

pricing

Price of Completed Solar Systems 2003-2016

The prices of solar panels is steeply declining, and is coupled with generous tax incentives. The good news, according to the Solar Energy Industries Association (SEIA), is that over the next five years, New York State’s solar capacity is expected to quadruple its current output, adding over 2900 MW of power. This change would elevate New York State from seventh to fourth place in output in the US.


By Karen Edelstein, Eastern Program Coordinator, FracTracker Alliance

Pilgrim Pipelines proposal & community actions

Controversial 178-mile-long parallel pipelines proposed for NY’s Hudson Valley/Northern NJ

By Karen Edelstein, Eastern Program Coordinator

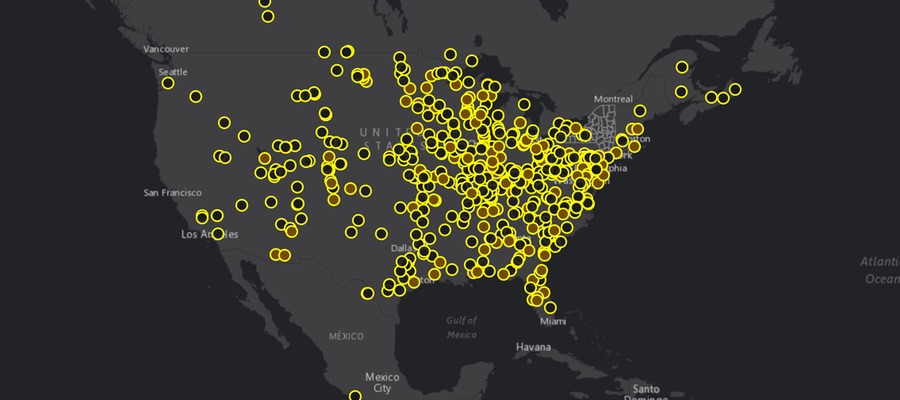
Over the past seven years, there has been a very strong upswing in domestic oil production coming from Bakken Formation in North Dakota. Extraction rates increased over 700% between November 2007 and November 2015, to over 1.2 million barrels per day. With all this oil coming out of the North Dakota oil fields, the challenge is how to get that oil to port, and to refineries. For the large part, the method of choice has been to move the oil by rail. Annual shipments out of North Dakota have jumped from 9500 carloads in 2008 to close to a half million carloads by 2013.

Nearly 25% of oil leaving the Bakken Formation is destined for east coast refineries located in New Jersey, Philadelphia, and Delaware. Trains carrying the crude enter New York State along two routes. A southern route, passes through Minneapolis, Chicago, Cleveland, and Buffalo, and on to Albany. A northern route, which originates in the oil fields of southern Manitoba and Saskatchewan Provinces in Canada, passes through Toronto, Montreal, and then south to Albany.

Currently, once the oil reaches Albany, it is transported south through the Hudson Valley, either by barge or by train. Two “unit trains” per day, each carrying 3 million gallons in 125-tank car trains, are bound for Philadelphia-area refineries. In addition, a barge per day, carrying 4 million gallons, heads to New Jersey refineries. Environmental groups in New York’s Hudson Valley, including Hudson RiverKeeper, have registered alarm and opposition about the potential impacts and risks of the transport of this process poses to the safety of residents of the Hudson Valley, and to the health of the Hudson River. More background information is available in this Pilgrim Pipelines 101 webinar.

What are the Pilgrim Pipelines?

The proposed Pilgrim Pipelines are two parallel 18-24-inch pipelines that would run from the Port of Albany to Linden, NJ, alongside the New York State Thruway (I-87) for 170 miles just to the west of the Hudson River, with nearly 80% of the pipeline within the public right-of-way. The rest of the pipeline would traverse private property and some utility areas.

The pipeline running south from Albany would carry the light, explosive crude to refineries in NJ, Philadelphia, and Delaware. After the oil is refined, the North-bound pipeline would carry the oil back to Albany, moving 200,000 barrels (8.4 million gallons) of oil in each direction, every day. Touted by Pilgrim Pipeline Holdings, LLC as a central component in “stabilization of the East Coast oil infrastructure,” the project proposes to:

provide the Northeast region of the United States with a more stable supply of essential refined petroleum products… and… provide the region with a safer and more environmentally friendly method of transporting oil and petroleum products.

The Controversy

The Pilgrim company is lead by two individuals with deep ties to the energy industry. Both the company president, Errol B. Boyles, as well as vice-president, Roger L. Williams, were in the upper echelon management of Wichita, Kansas-based Koch Industries.

Proponents of the project claim that it includes environmental benefits, such as 20% lower greenhouse gas emissions than would be generated moving the same quantity of oil via barge, and even claim that the proposed Pilgrim Pipelines “will produce a net air quality benefit to the region.” Of course, this argument is predicated on the belief that the unbridled oil extraction from the Bakken Formation is both environmentally desirable, and nationally required.

Economic benefits described by the pipeline company include the faster rate the petroleum products can be pumped through existing terminals in New York, and also meet a hoped-for demand surge for petroleum products. Naturally, the company would also create some construction jobs (albeit somewhat temporary and for out-of-state firms), and increase fuel available to consumers at lower prices because of proposed transportation savings. However, the Albany Business Review indicated that the pipeline could actually create a net loss of jobs if the pipeline were to make the Port of Albany less active as a shipping location.

Project opponents cite both short- and long-term impacts of the project on human and environmental health, the local and regional economy, property values, nearly a dozen threatened and endangered wildlife species, water quality, ecology of the pristine Hudson Highlands Region, and contributions that the project invariably makes to accelerating climate change, both through local impacts, and as an infrastructure component supporting the extraction of crude from the East Coast all the way to the Bakken Fields of North Dakota. Groups also cite the high rate of “non-technical” pipeline failures, due to excavation damage, natural force damage, and incorrect operation.

Communities in Action

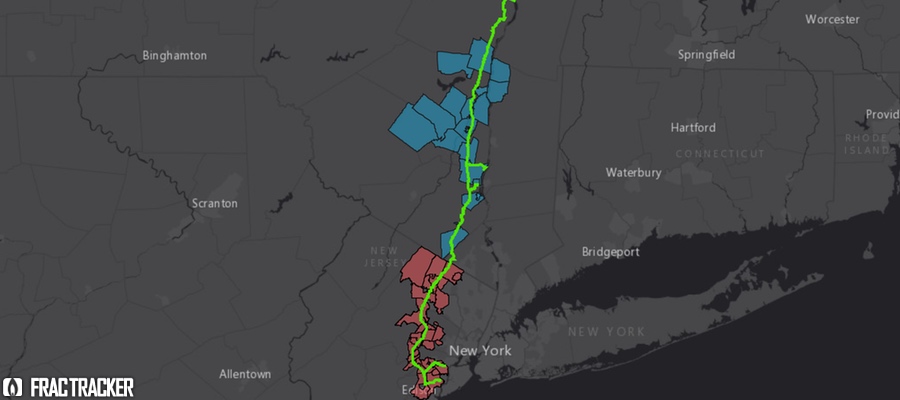
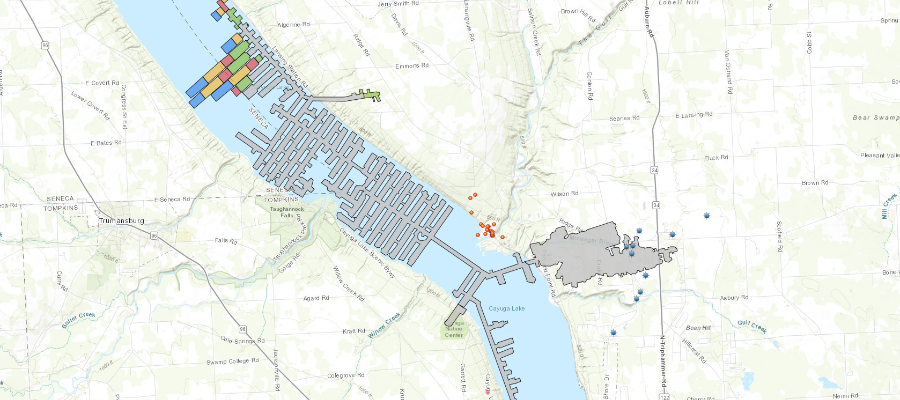
Close to 60 municipalities along the pipeline route have passed local resolutions and ordinances expressing their opposition to the pipeline. Residents assert that the local communities would bear most of the risks, and few, if any, of the benefits associated with the Pilgrim Pipeline. These communities, represented by over a million people in New York and New Jersey, are shown in the map below. Other groups – including the New Jersey State Assembly and Senate, numerous county boards in both New York and New Jersey, and several school districts – have also passed resolutions opposing the project.

Access links to the resolution documents for individual towns by clicking on the town location in the map below.


View full screen map | How to work with our maps

Decision Makers in Question

The New York State Thruway Authority was initially the sole lead agency on the State Environmental Quality Review (SEQR) of the project, a decision that was decried by impacted municipalities, environmental groups, and the Ramapough Lenape Nation. Dwain Perry, Ramapough Lenape chief, urged that the New York State Department of Environmental Conservation be the lead agency, instead, saying:

…DEC has a much more thorough outlook into different things that can happen….[and]..is looking out for everyone’s interest.

However, in a development announced in late December 2015, the New York State Department of Environmental Conservation revealed that they, along with the NYS Thruway Authority, would jointly lead the environmental review of the project. This decision has perplexed many groups involved in the debate, and environmental groups such as Scenic Hudson, Environmental Advocates of New York, Hudson Riverkeeper, and Coalition Against the Pilgrim Pipeline expressed their dismay over this choice, and urged that the SEQR review address whether the project will be consistent with NY Governor Cuomo’s aggressive goals to reduce carbon emissions that are driving climate disruption.

DEC’s own guidelines advise against creating co-lead agencies in projects particularly because there is no prescribed process for resolution of disputes between two such agencies. Nonetheless, a DEC spokesperson, Sean Mahar, tried to assure critics that because the two lead agencies have “unique and distinct expertise” few problems would arise.

We’ll post updates as the project’s SEQR process gets underway.

Resources

Pilgrim Pipelines 101 webinar, presented by Kate Hudson (Riverkeeper) and Jennifer Metzger (Rosendale Town Board)

Coal fired power plants in North America

NYS targets an end to coal power

By Karen Edelstein, Eastern Program Coordinator

It’s been just over a year since New York Governor Andrew Cuomo made public his administration’s decision to ban high-volume hydraulic fracturing in the state. A formal ban was established in June 2015. While Cuomo’s politics and record may be controversial on some fronts, he has most certainly shown important leadership in some facets of energy policy. Significantly, activists and environmental advocacy groups have been especially strong during the Cuomo administration, pressing the governor daily to take seriously the responsibility and planning that New York State must demonstrate in light of the realities of climate change.

On Wednesday, January 13, 2016, New York Governor Andrew Cuomo delivered his annual State of the State address. Among the high points of the talk was a commitment to a full phase-out of coal-burning power plants by 2020. Coal, once more affordable alternative to other fossil fuels, is no longer an attractive option from both an economic and environmental standpoint. Despite advances in scrubber technology, coal burning still emits more particulate waste into the atmosphere than other fuels, and leaves behind copious quantities of fly ash containing radioactivity and heavy metals. Historically, fly ash, bottom ash, boiler slag, and flue gas desulfurization materials have been disposed of in landfills. While current disposal methods using landfill liner technologies do attempt to safeguard against groundwater contamination, during earlier decades, these waste products from burning coal were buried in unlined pits, some of which are now actively leaching into waterways and groundwater.

Existing coal burning power plants being shut down, but what’s next?

In New York State, many old, polluting coal plants are now only partially in service or completely shuttered. They did at one time, however, have the capacity to supply over 2100 MW of power to the state. While it’s generally accepted from an economic and environmental standpoint that New York should be transitioning away from coal, the next steps are more fraught with controversy. Several communities, such as those around the likely-to-be-closed Dunkirk (Chautauqua County, 520 MW),  as well as Huntley (Niagara County, 380 MW), and Cayuga (Tompkins County, 315 MW) power plants feel that a repowering of these plant with natural gas provides an important economic stabilizer for the surrounding communities. Another smaller coal-burning plant, Greenidge Generation (Seneca County, 107 MW) has been shuttered for several years. A recent local economic development initiative to re-start that plant with a conversion to natural gas met with considerable resistance from environmental groups. This development also resulted in a notification from the US Environmental Protection Agency indicating that proper procedure for restarting the plant had not been followed, setting back the timetable on the project indefinitely.

Coal Burning Power Plants in North America, Zoomed in to NYS

View full screen map | How to work with our maps

Cayuga Power, which has been operating at a deficit for several years as a coal burning plant, is subsidized through a surcharge that is levied on every ratepayer within the system, with each monthly bill. According to The Sierra Club, these subsidies amount to over $4M a month charged to NYSEG ratepayers for the Cayuga plant, alone. Elected officials, as well as citizen groups concerned with the impacts of natural gas on the environment, are pressing for other viable options to repowering the plant from coal to natural gas, currently estimated to cost over $500M for the Cayuga Plant, alone. These options include solar power – or, in the case of the Cayuga power plant, upgrades to a short stretch of transmissions lines for less than $100M, in lieu of repowering. In either case, the upgrade costs would be passed on to the consumer. Transmission line upgrades would actually obviate the need for the power plant itself, conserving the energy that is now lost through inefficiencies in the system. Repowering the plant would also necessitate the construction of a highly controversial 7-mile-long pipeline from the Town of Dryden, which would significantly raise the carbon footprint of Tompkins County through due to predicted fugitive methane emissions. The power utility, itself, New York State Electric and Gas (NYSEG) has said that they prefer the option of upgrading the lines, rather than converting the plant to run on natural gas. Another study by the Institute for Energy Economics and Financial Analysis also found the Cayuga repowering proposition unviable. Proponents of repowering cite the impacts that shutting down the plant would have on the local Lansing School district, which–unlike any of the surrounding school districts–has benefited for several decades from tax revenues generated by the plant.

Environmental concerns about continuing to invest in fossil fuel technologies like natural gas as an alternative to coal include the entire life cycle of methane extraction, from the air and water quality risks that occur during the process of unconventional drilling (high volume hydraulic fracturing), to environmental and public health impacts of pipelines and compressor stations that convey the gas to the power plants, to the addition of CO2 to the atmosphere as a byproduct of natural gas combustion at these fossil-fuel burning plants.

Of course, energy conservation and making lifestyle changes to how we individually, and collectively, approach energy consumption are at the heart of the changes that need to occur if we are to slow climate change caused by the dramatic upswing of methane and CO2 in the atmosphere during the past 50 years.

New York State’s Renewable Energy Agenda

Cuomo and the State Legislature have shown additional and ongoing interest in moving New York towards a clean energy future. They have been establishing appealing tax incentives for renewable energy, including:

Cuomo’s REV, or Reforming the Energy Vision, attempts to take a comprehensive look at an energy strategy across many sectors of New York. REV targets for 2030 include a goal of 50% of all NYS’s energy being met by renewable sources, a 40% reduction in greenhouse gas levels based on 1990 levels (and an overall emission cut of 80% by 2050), and based on 2012 levels, a 25% reduction on building energy use. The strategy also looks to support the growth of the clean energy sector, energy education to residents and businesses, natural resources protection, and job creation in the energy sector.

New York is taking important steps for a cleaner energy future, but should continue to put more resources towards incentives for renewable resources, as well as outreach and education to municipal, residential, and commercial energy consumers.

We have very little time to waste.

Ancient Seas, Modern Ownership Concerns

By Karen Edelstein, NY Program Coordinator, FracTracker Alliance

In the Finger Lakes Region of New York State, while the debate rages about underground storage of gas in abandoned salt solution mines near Seneca Lake, the story is quite different to the east at Cayuga Lake. Cayuga has a history of not just solution brine mining, but also extensive mining of solid rock salt. The map below shows the footprint of underground salt mining – room-and-pillar style 2300 feet below Cayuga Lake – by the multinational corporation, Cargill. Mineral rights beneath the lake are owned by New York State, but note that some of the mine also extends underneath privately owned land in the Town of Lansing.


Map of Lansing, NY Cargill Salt Mine. For a full-screen version of this map (including map legend), click here.

About this Map

The interactive map (above) shows the location and extent of the Cargill Salt mine in Lansing, NY. The boundaries of the mine were digitized from a map, Figure 2.3-2, entitled “Plan View of the Cayuga Mine Showing East and West Shoreline Benchmark Locations” from the Spectra Environmental Group, Latham, NY, circa 2004, and another planning document acquired. Here is one of the original maps, and a planning map showing expansion through 2003. An additional map from a Cargill mine expansion permit request, viewed at the DEC headquarters in Cortland, NY, shows additional requested development under residential areas in Lansing. This layer is shaded green.

Questions Abound

The dynamics around salt extraction, and other uses such as gas extraction, raise several questions.

Consider the stratigraphic column of rocks in New York State. The salt layer that is being mined by Cargill is the Salina Group, approximately 2300 feet below the surface. Salt is dug out mechanically, broken up by machinery and explosives to break up the solid layer. The Marcellus Shale (in Lansing) is above that salt layer–in the expanse of Middle Devonian Rocks, while the Utica Shale is below it–part of the Ordovician rock strata. In order to drill into the Marcellus Shale, one would not need to enter the salt layer, although the boundary of rock between the two strata might only be a few hundred feet thick. Reaching the Utica Shale would require piercing the salt layer. The Central New York region is crisscrossed by an abundance of vertical cracks and joints in the bedrock, some of which are thought to be hundreds to thousands of feet long, and may extend to “basement rock”, the ancient rock below the hundreds-of-millions year-old sedimentary layers such as the shale, sandstone, and salt.

Numerous plugged and abandoned salt wells from the days of solution mining–mid 1800s to mid 1900s– are located on and near Salt Point, the delta where Salmon Creek meets Cayuga Lake. As the map shows, the rock salt mining extent is near to, but not in contact with, these old brine wells. The underground shape of the solution wells is not entirely understood, and may be variable due to different rates of dissolution of halite during the extraction process. The rock salt is mined out as a solid, not a a saturated salt liquid that would have then gone through an evaporation process in a giant kiln. Were rock salt extraction to occur too close to the old solution wells and a wall breached, flooding in the current Cargill mine could result.

This would obviously not be good.

(Nor, for that matter, would have been the prospect of storing spent nuclear fuel in the abandoned brine wells, something that was being considered in the mid-1970s. In a 3-volume study of the geology of the Salina Basin (spanning a d-state area), the conclusion made by the Stone and Webster Engineering Corporation1,  consultant to the US Department of Energy, was that no salt mining sites in the Finger Lakes region were appropriate  for nuclear fuel storage without further study of the area’s extensive, but under-studied, faulting patterns.)

What are the implications of other sorts of mineral extraction, in this part of the Finger Lakes Region?

Yours or Mine?

The extent of Cargill’s mining under residential portions of the Town of Lansing provokes several questions. For example, if Cargill has long-term access to these subsurface mineral rights, property owners do not control the land beneath their homes. This is not altogether uncommon in areas of mineral – or oil and gas – extraction. Can that land be leased for gas drilling?

It was revealing to look more closely at records of expired oil and gas leases in the area. During this process, we discovered that within the area that is “claimed” by Cargill for subsurface mineral extraction, numerous surface owners had also leased the gas rights beneath their property (see blue starburst markers on the map)2, even if the property deeds explicitly, for example,  indicated that the property owner “will not cause any damage to the said salt or mining operations [of the party of the second part] by permitting or consenting to any other drilling 1000 feet below the the surface of said premises, for oil, gas, water or any other substance or mineral..” (Tompkins County Clerk, Liber 463, p.284-5).  Here are links to page 2 and 3 of the deed, and the very comprehensive leasing clause of one of these oil and gas leases that permits a wide variety of gas-extraction related activity–both on the surface, and below ground.

Four of the ten leases were on property held by the Town of Lansing itself, and one other was on property owned by a local elected official. While all of these leases expired in 2012, and were never, in fact, drilled (due to the de facto moratorium on HVHF gas extraction in New York), the mash-up of these datasets raises important questions about our permitting structure. The implications of two separate entities claiming overlapping subsurface rights spotlights many questions regarding the oversight and regulation of potentially conflicting uses. Of particular concern are the risks posed by migration of gas through joints and fissures in the bedrock that are further weakened by hydraulic fracturing – and the potential for methane explosions3 in salt mines, whether or not a well shaft penetrates the salt gallery.

For more details on operations at Cargill’s Lansing mine, see this article from The Lansing Star, September 2012: Lansing Down Under: A Look at the Cargill Salt Mine.

References

  1. Regional Geology of the Salina Basin, Report of the Geologic Project Manager
    Volumes 1 and 2, Phase I, August 1977-January 1978, and Volume 3 Update, October 1979. Prepared by Stone and Webster Engineering Corporation for the Office of Nuclear Waste Isolation, Battelle Memorial Institute, Project Management Division, US Department of Energy.
  2. Map of Gas Leases in Tompkins County
  3. Cargill Incorporated Belle Isle Salt Mine Explosion (1979)

Tag Archive for: New York

Nothing Found

Sorry, no posts matched your criteria