Utica well water and chemical usage in-depth: Part I
By Ted Auch, PhD and Daniel Berghoff
Our Ohio intern and I have been working to compile complete water and chemical usage data for Ohio’s horizontal Utica wells. At this point we have an inventory for 248 wells and thought it would be helpful to present our initial analysis.
Water Use

Figure 1. Million gallons per fracked well interval range for 248 horizontal Utica wells. Click to enlarge.
The Ohio Utica wells are using 4.4-4.6 million gallons (±1.6 MG) of water per fracked well1 (Fig. 1). On the low end of the range are the 93,402-533,412 gallons for the Onega Commissioners 14-25H (PDC Energy), Kernich 3-10-2 1H, and Starkey 36-13-4 5H wells in Guernsey, Columbiana, and Carroll Counties, respectively; the latter two are owned by Chesapeake Energy. On the high end are the four 10 MG+ Antero and Anadarko wells in the counties of Monroe, Muskingum, Noble, and Coshocton (Fig. 2).
Excluding Carroll County – where this water usage is equivalent to 63% of the county’s per capita annual water usage – the Utica wells have used 1.2 billion gallons of water or 3.2% of the population’s annual water demands2. When the state’s additional permitted wells come online they will require an additional 2.5 billion gallons of freshwater…
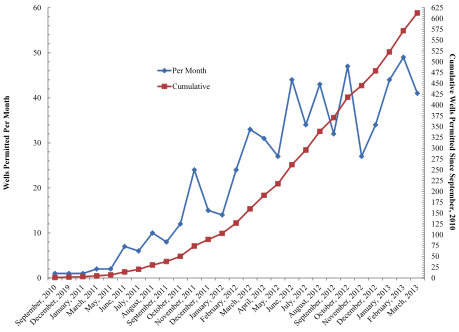
Put another way, Ohio Utica water usage in five years – assuming 25-52 permits per month3 – will amount to 6.1-12.8 billion gallons per year.
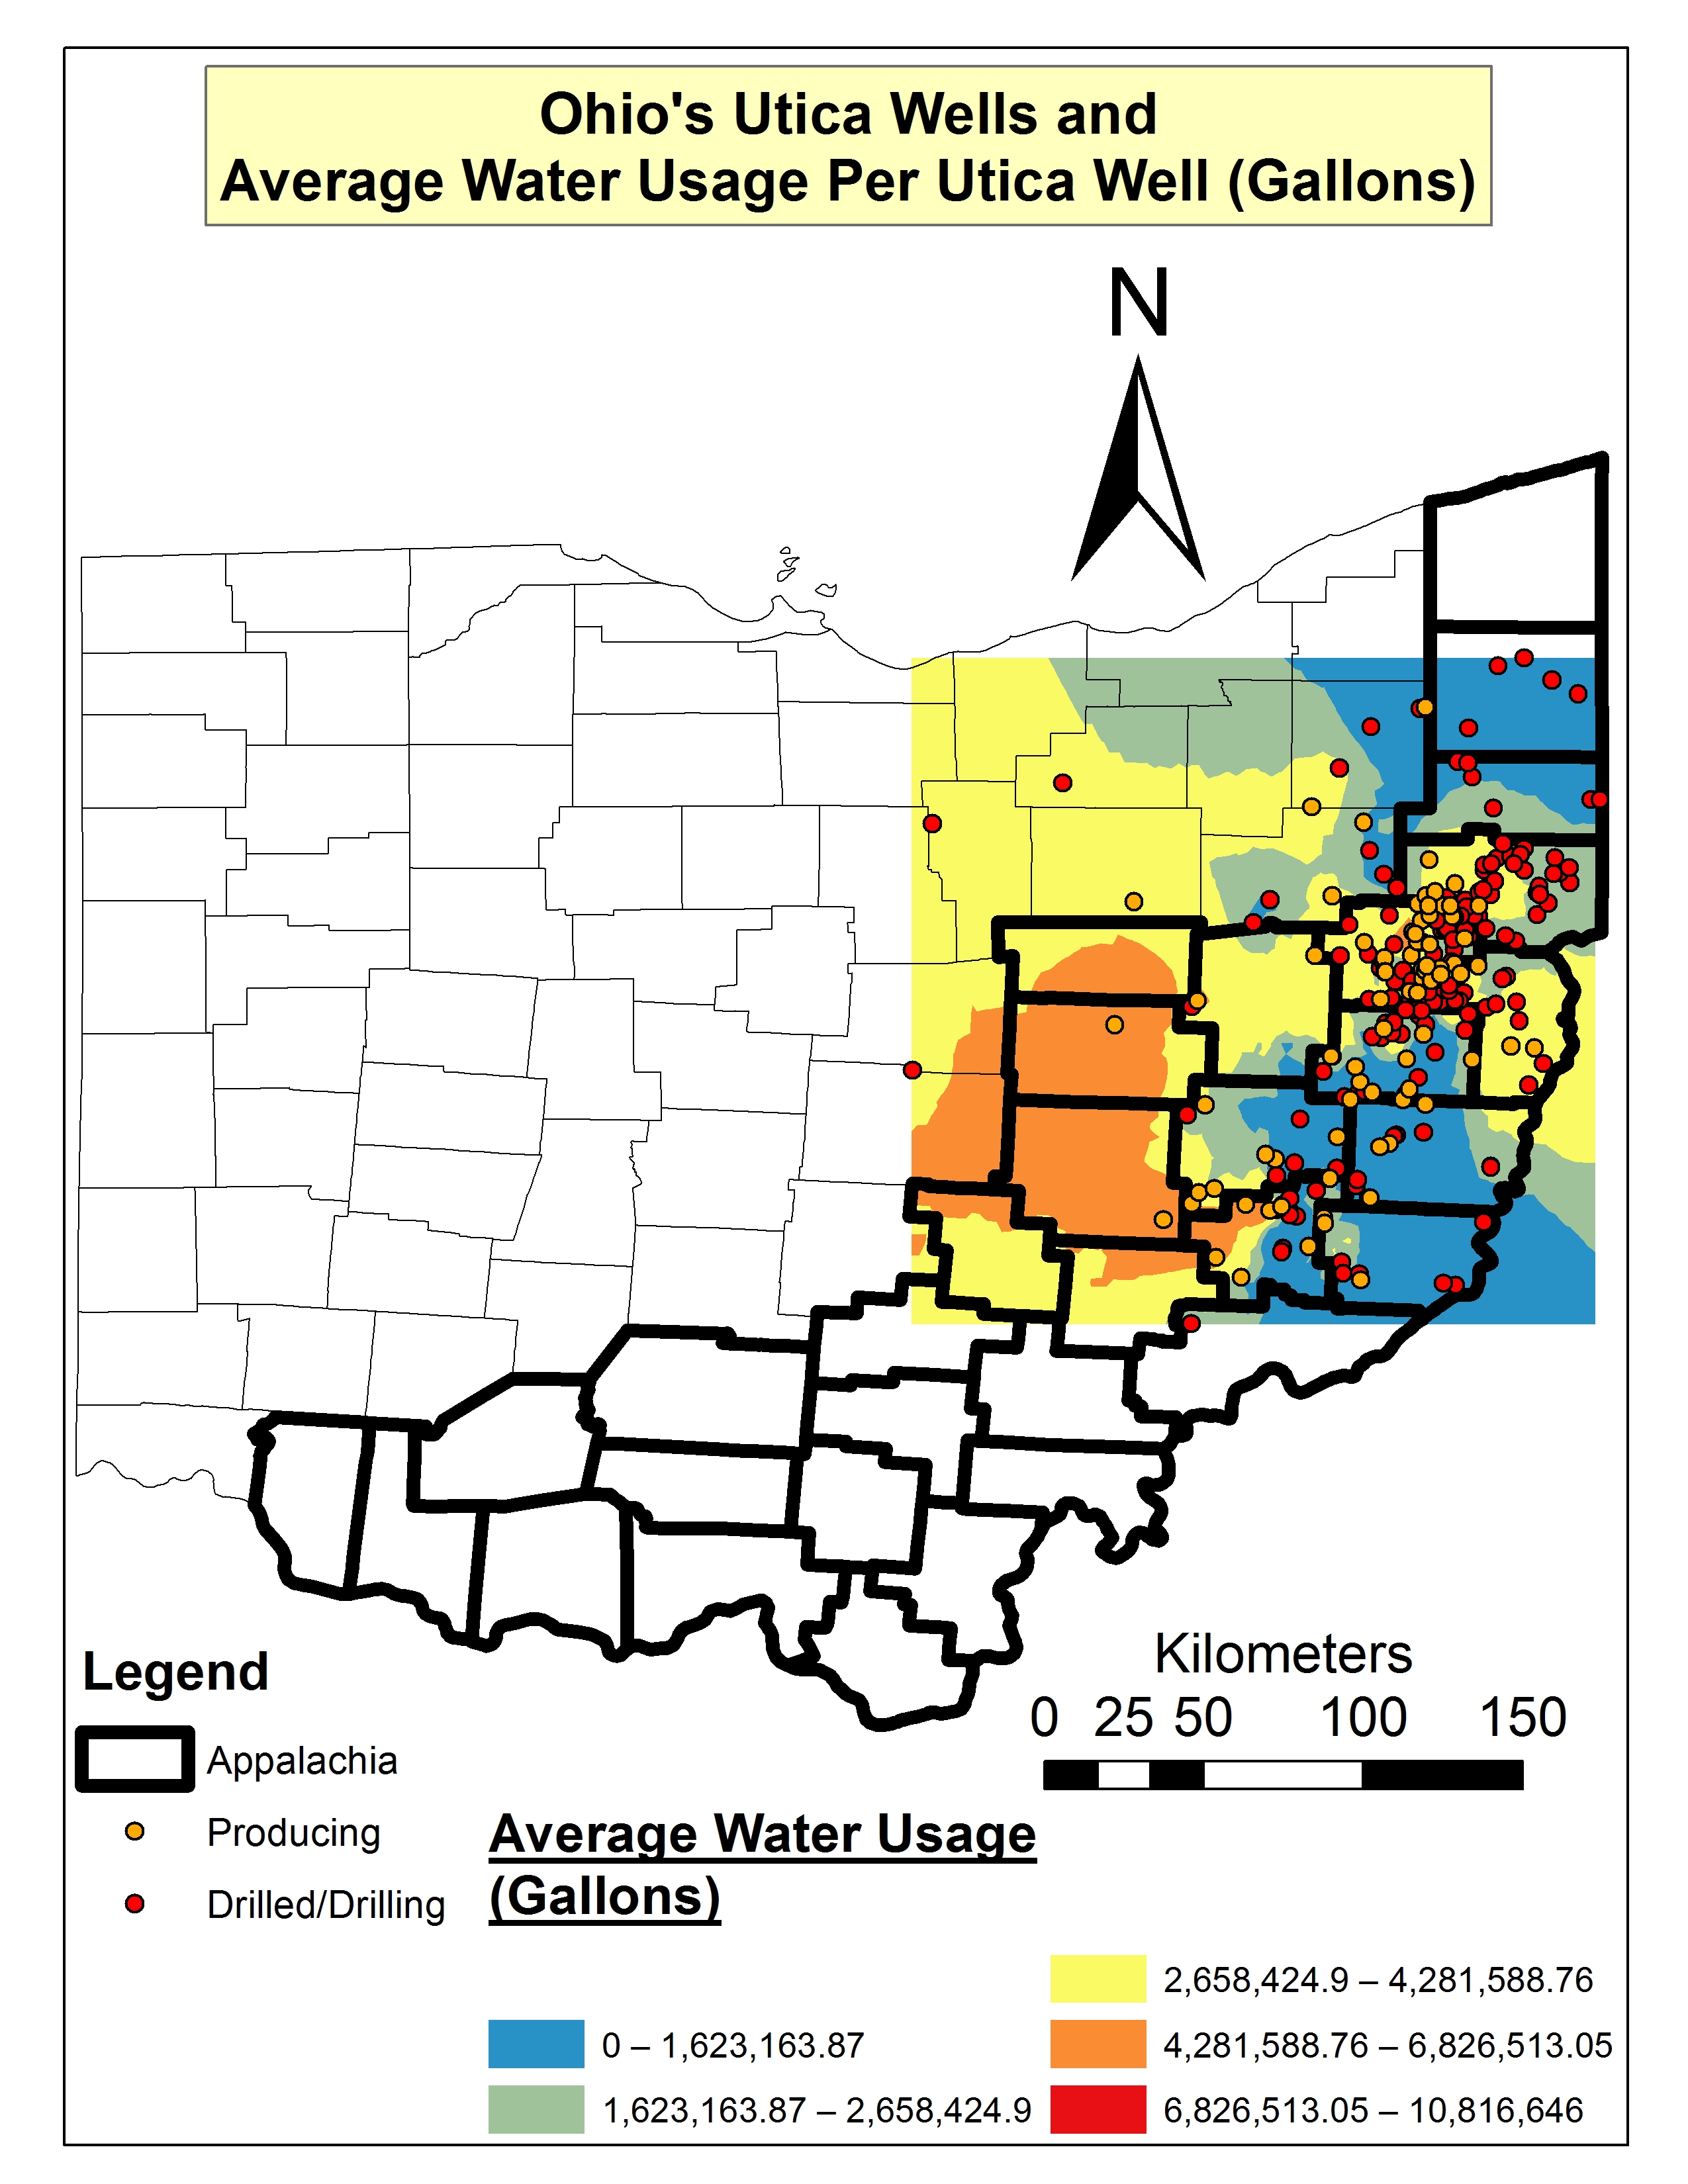
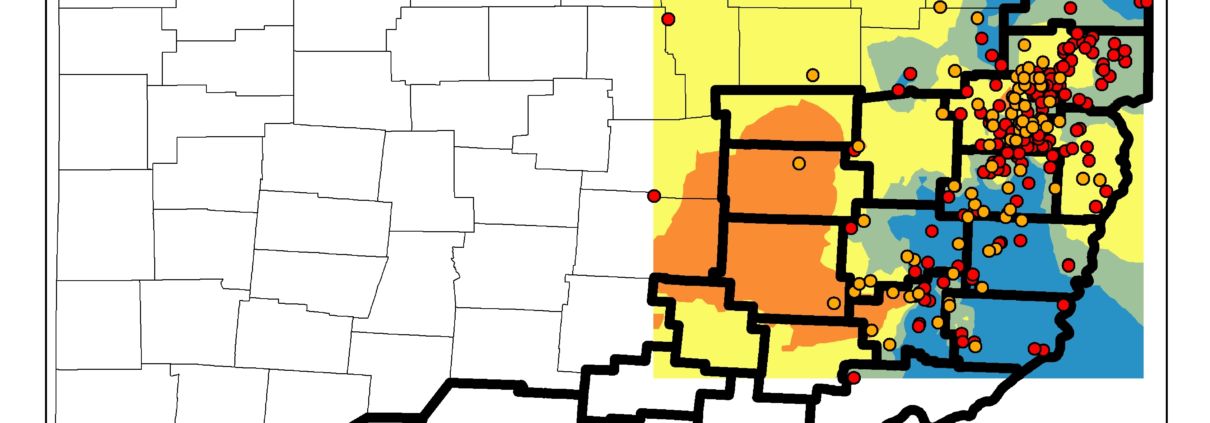
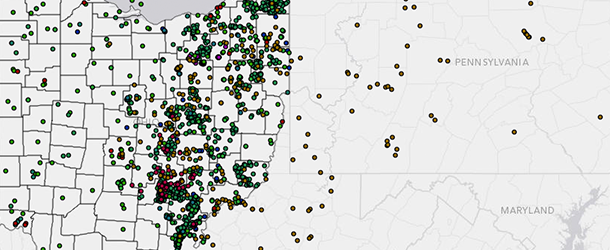
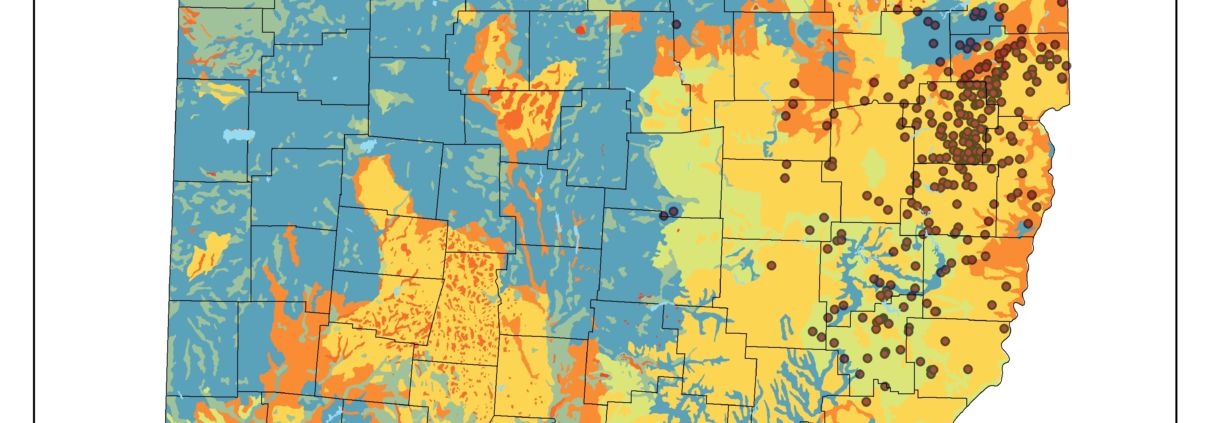
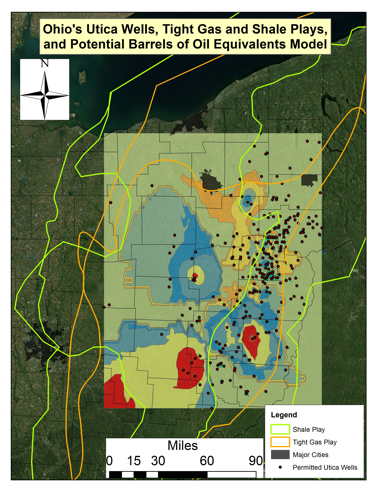
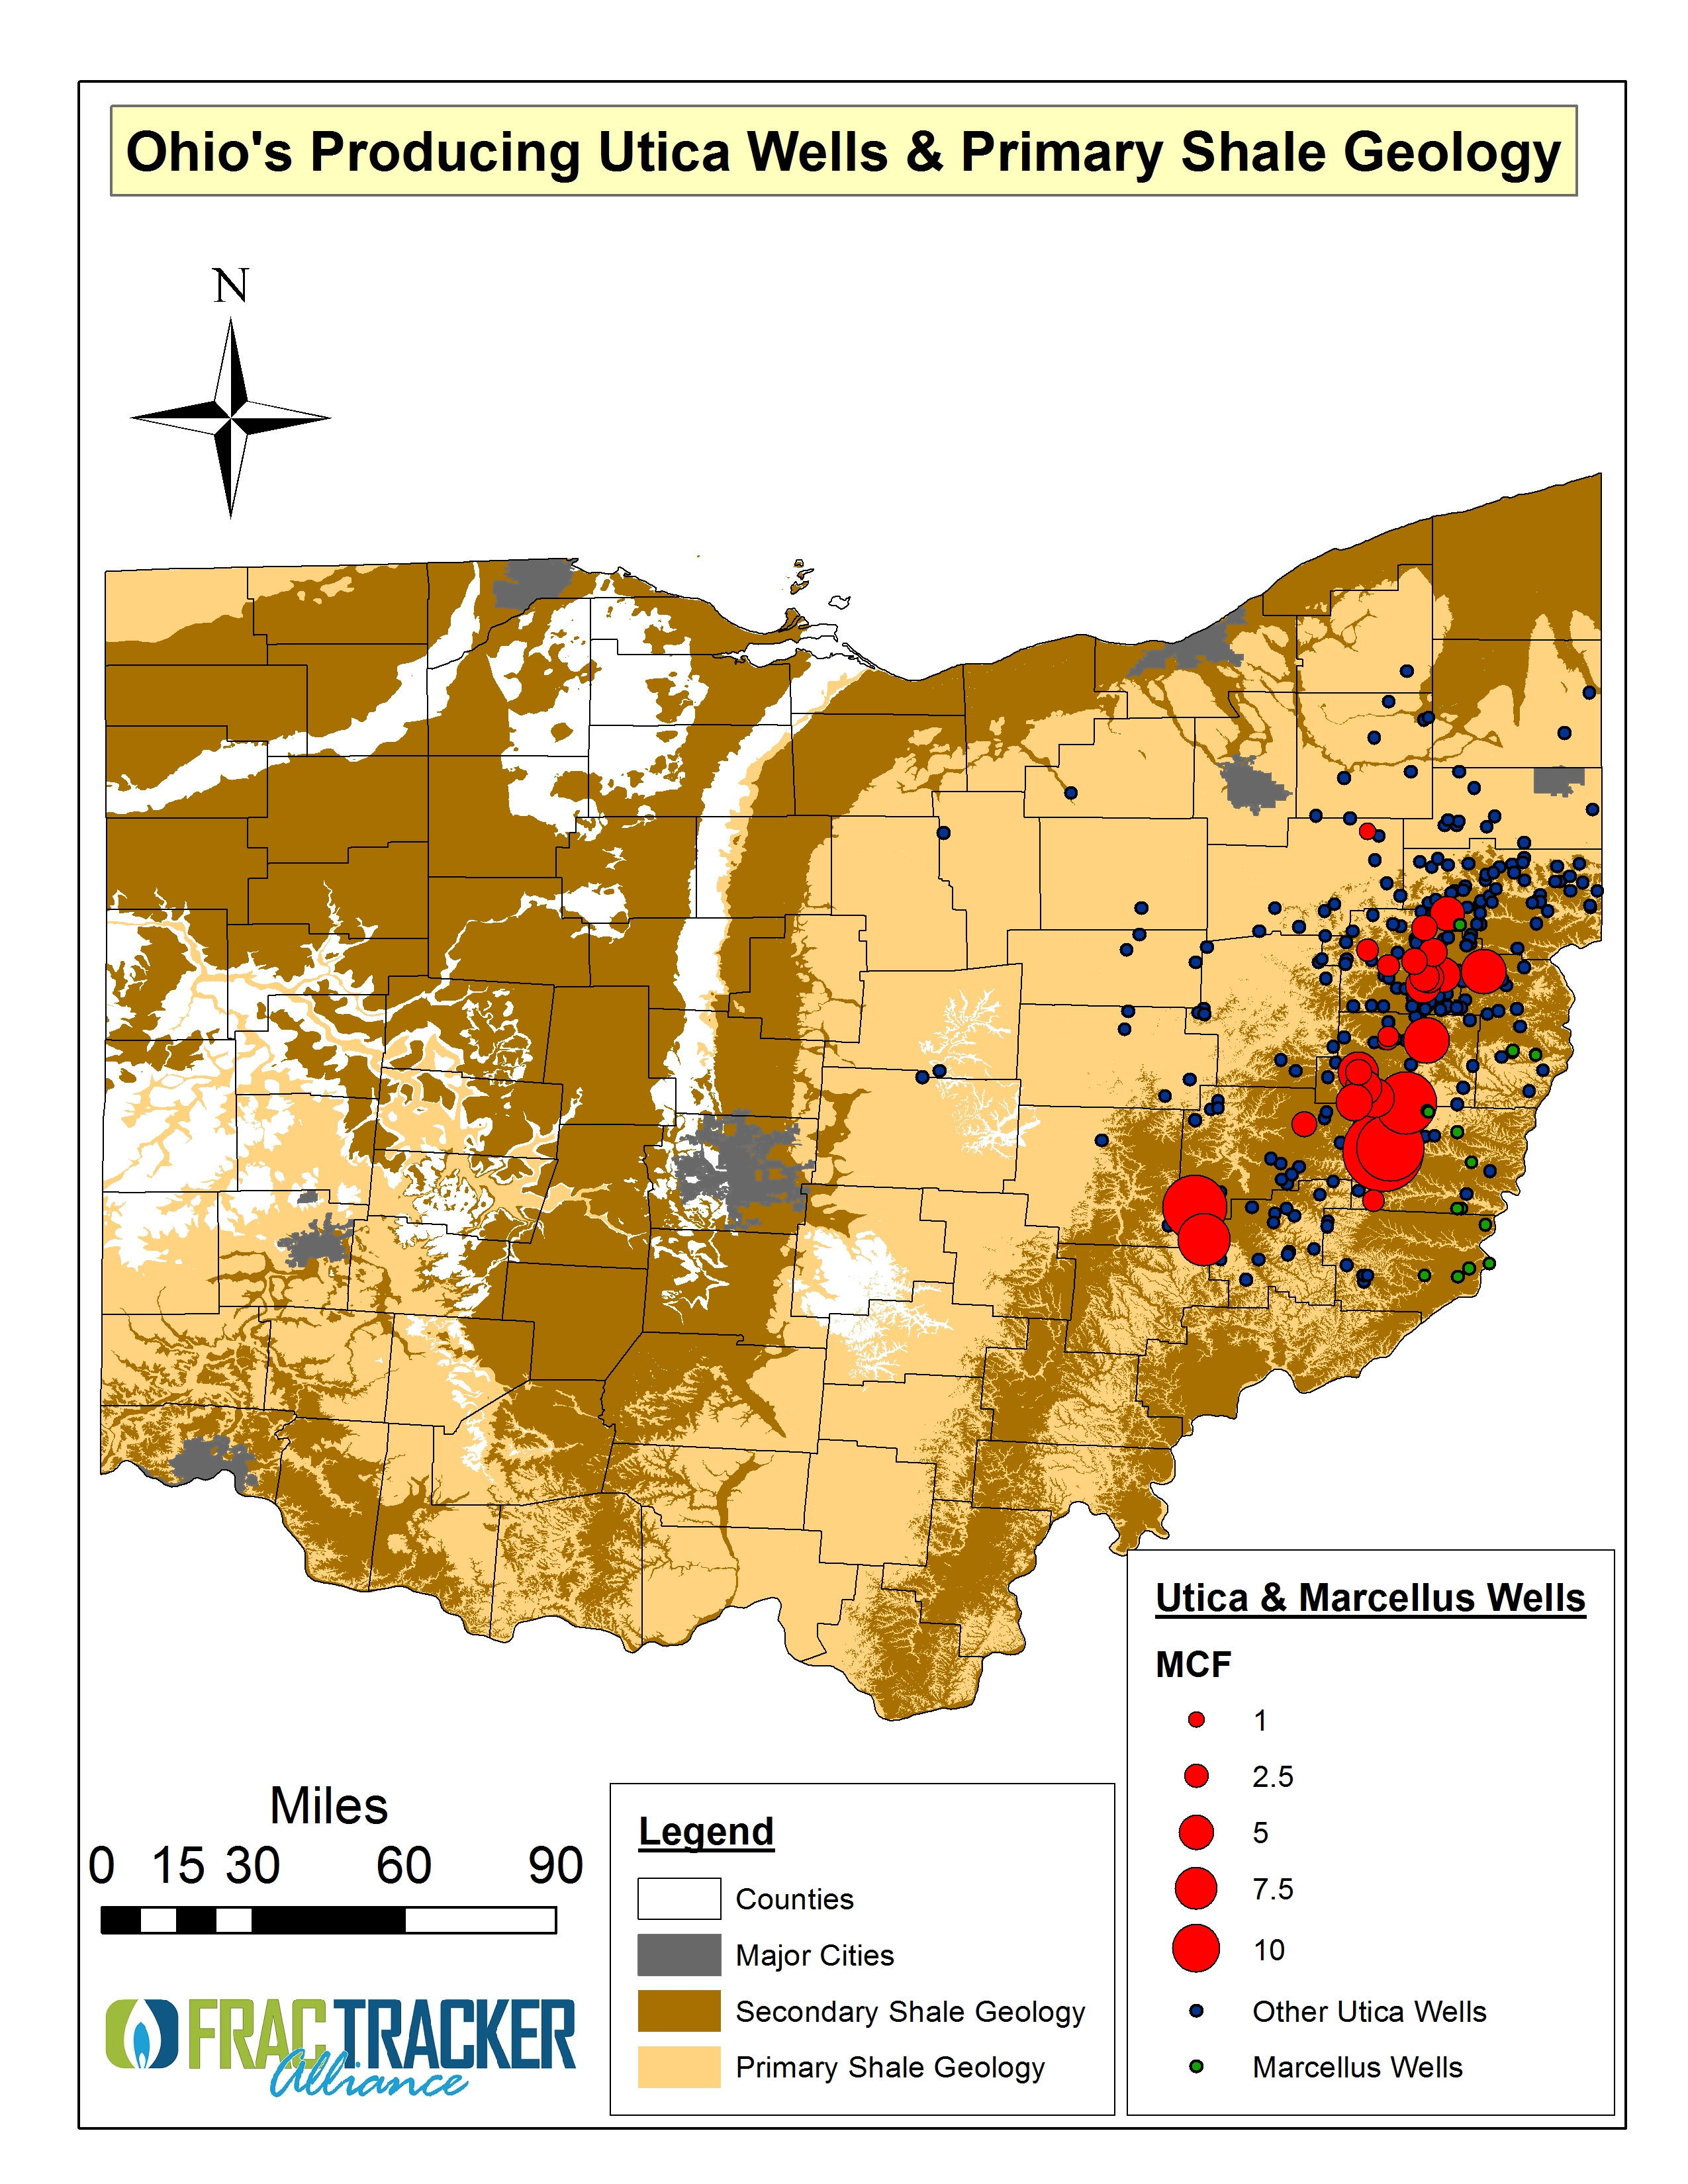
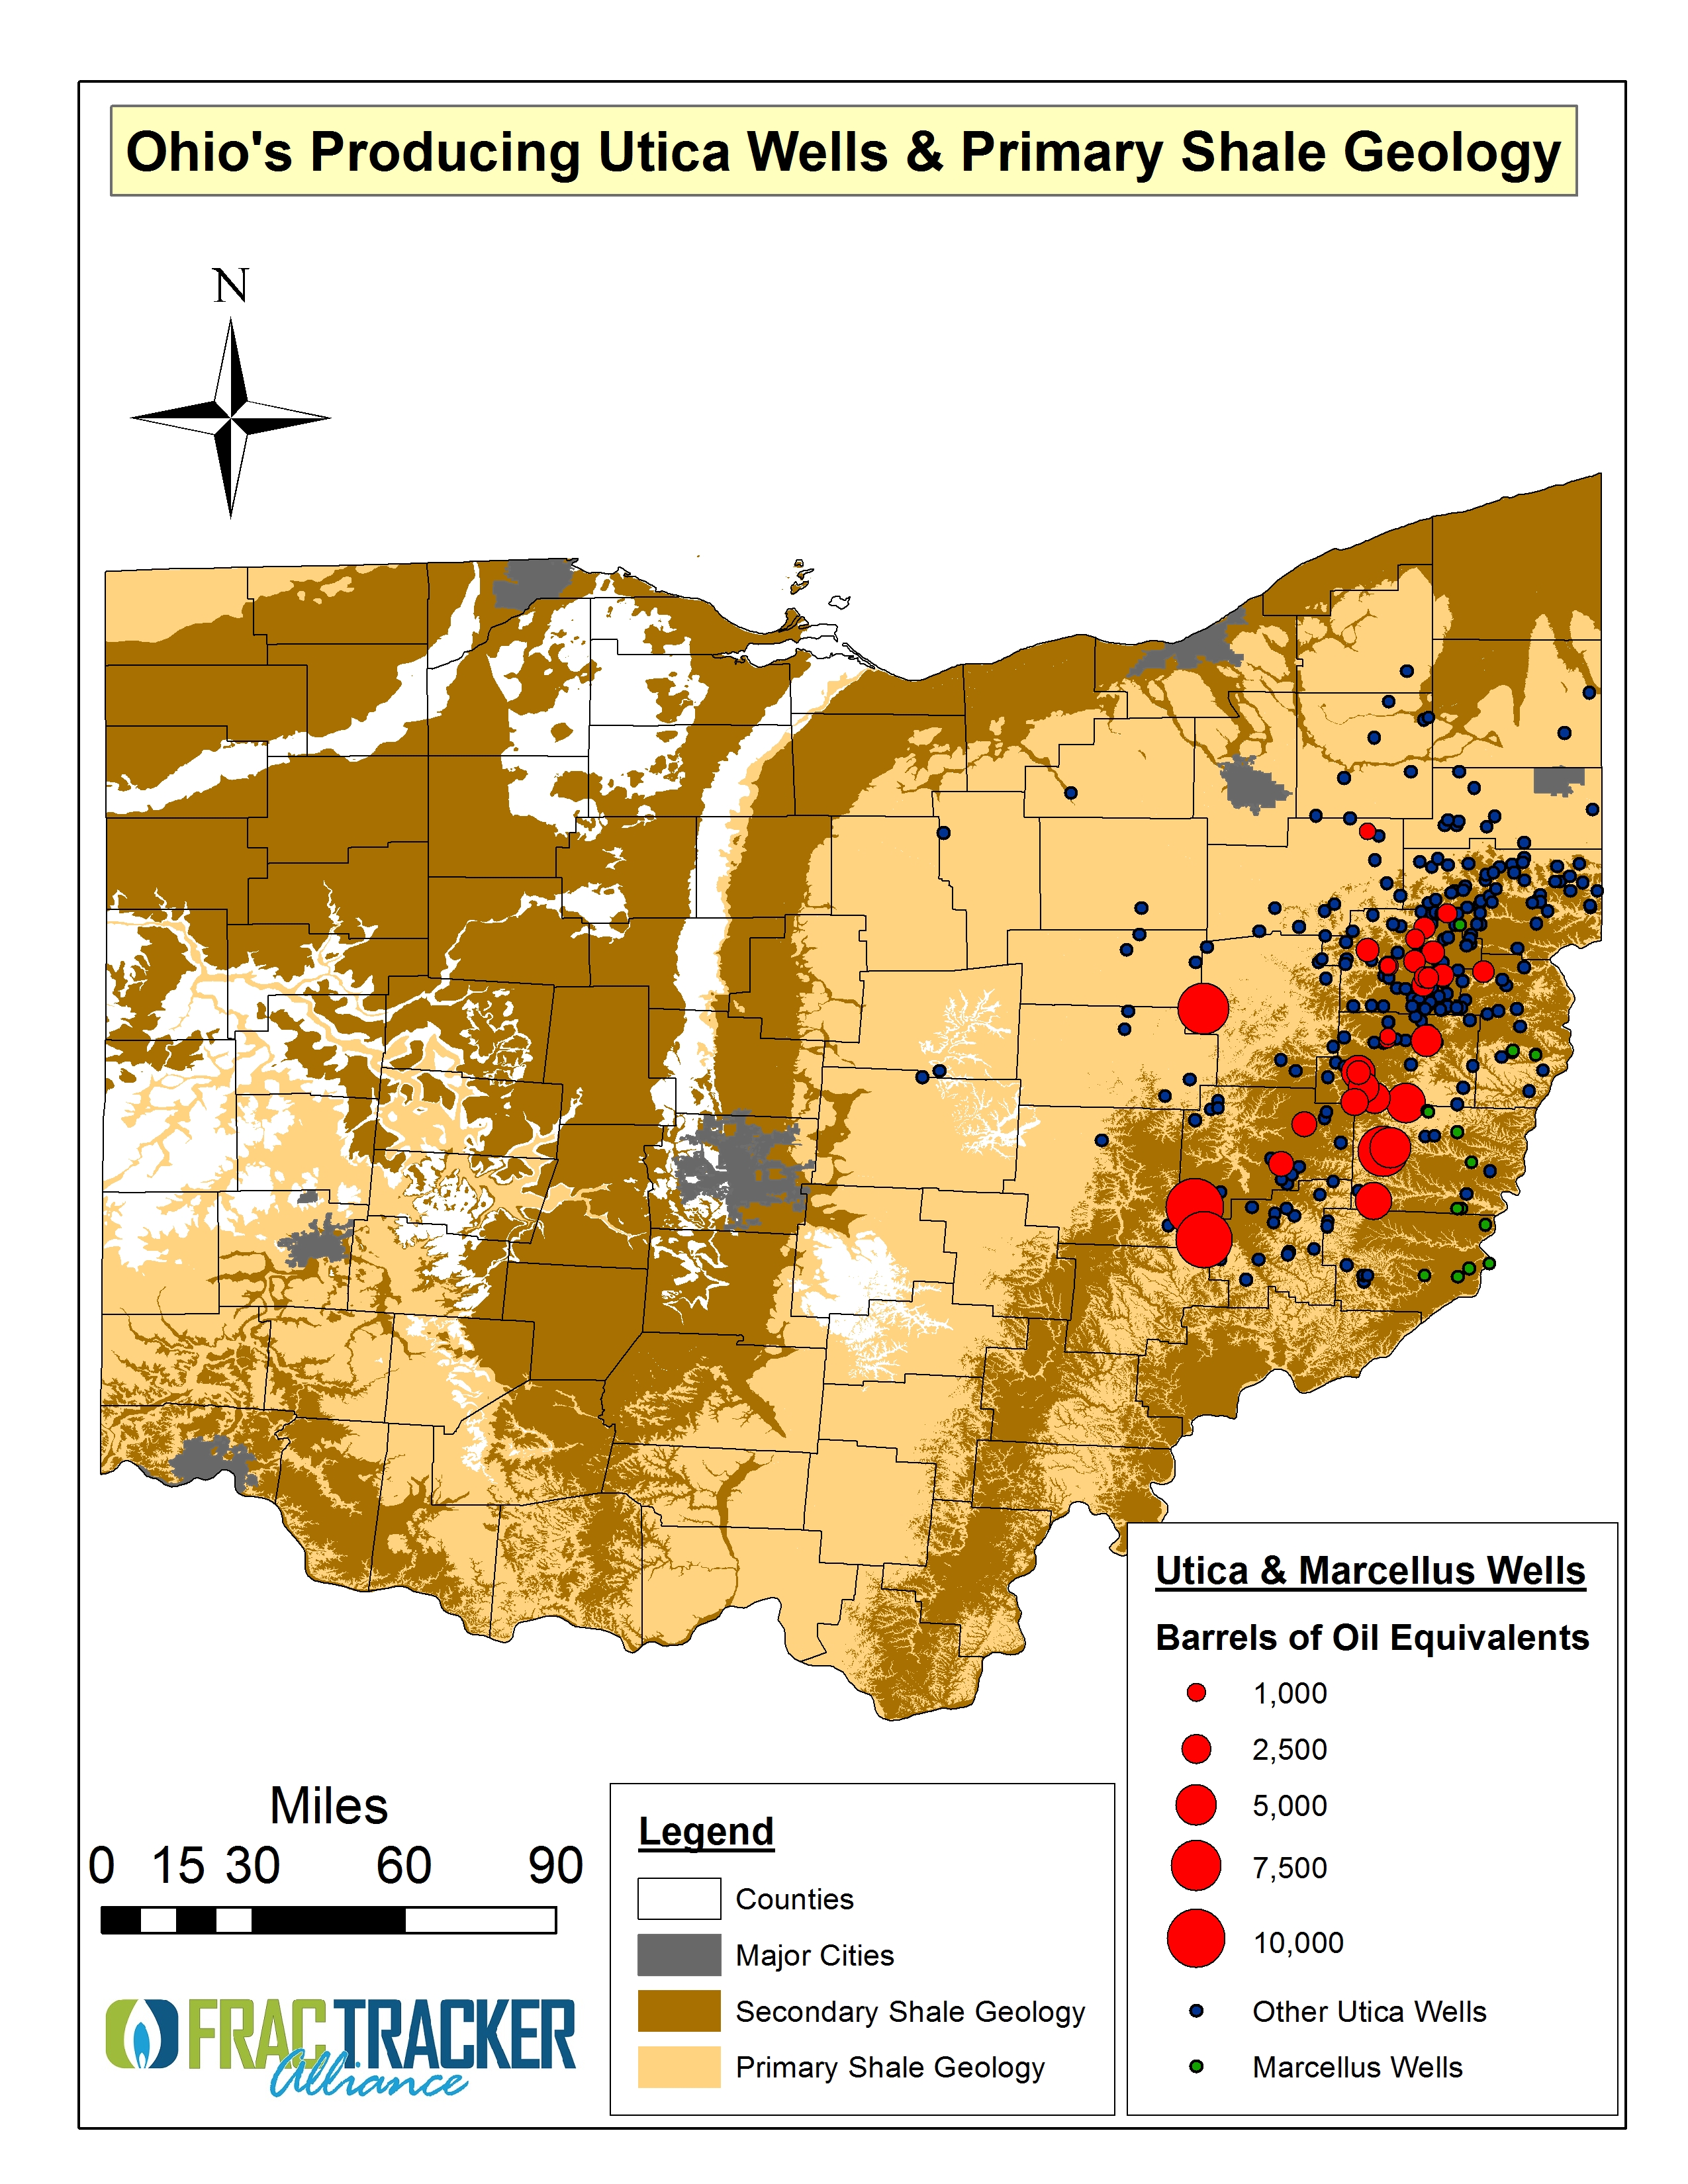
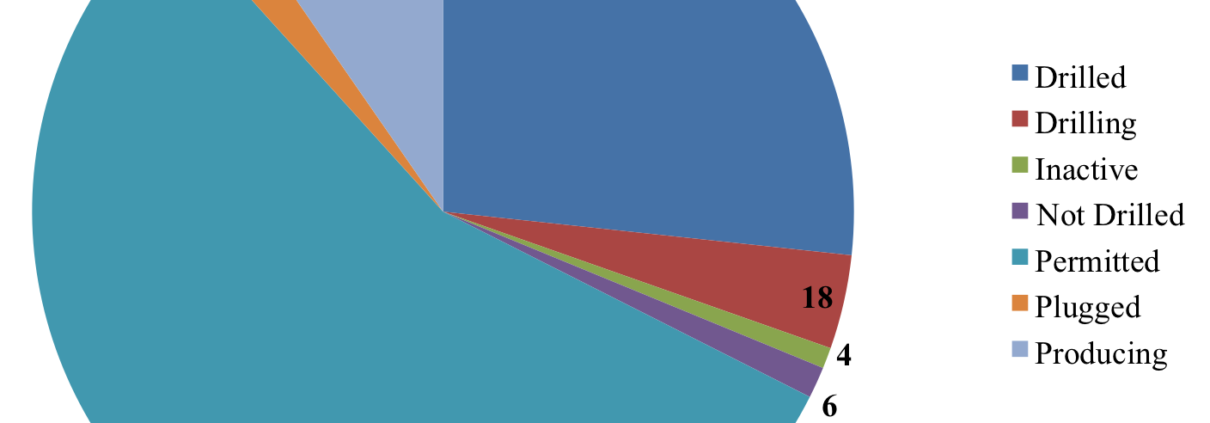
Figure 2. Ohio’s drilling, drilled, and producing Utica wells and average water usage per well interpolation. Click to enlarge.
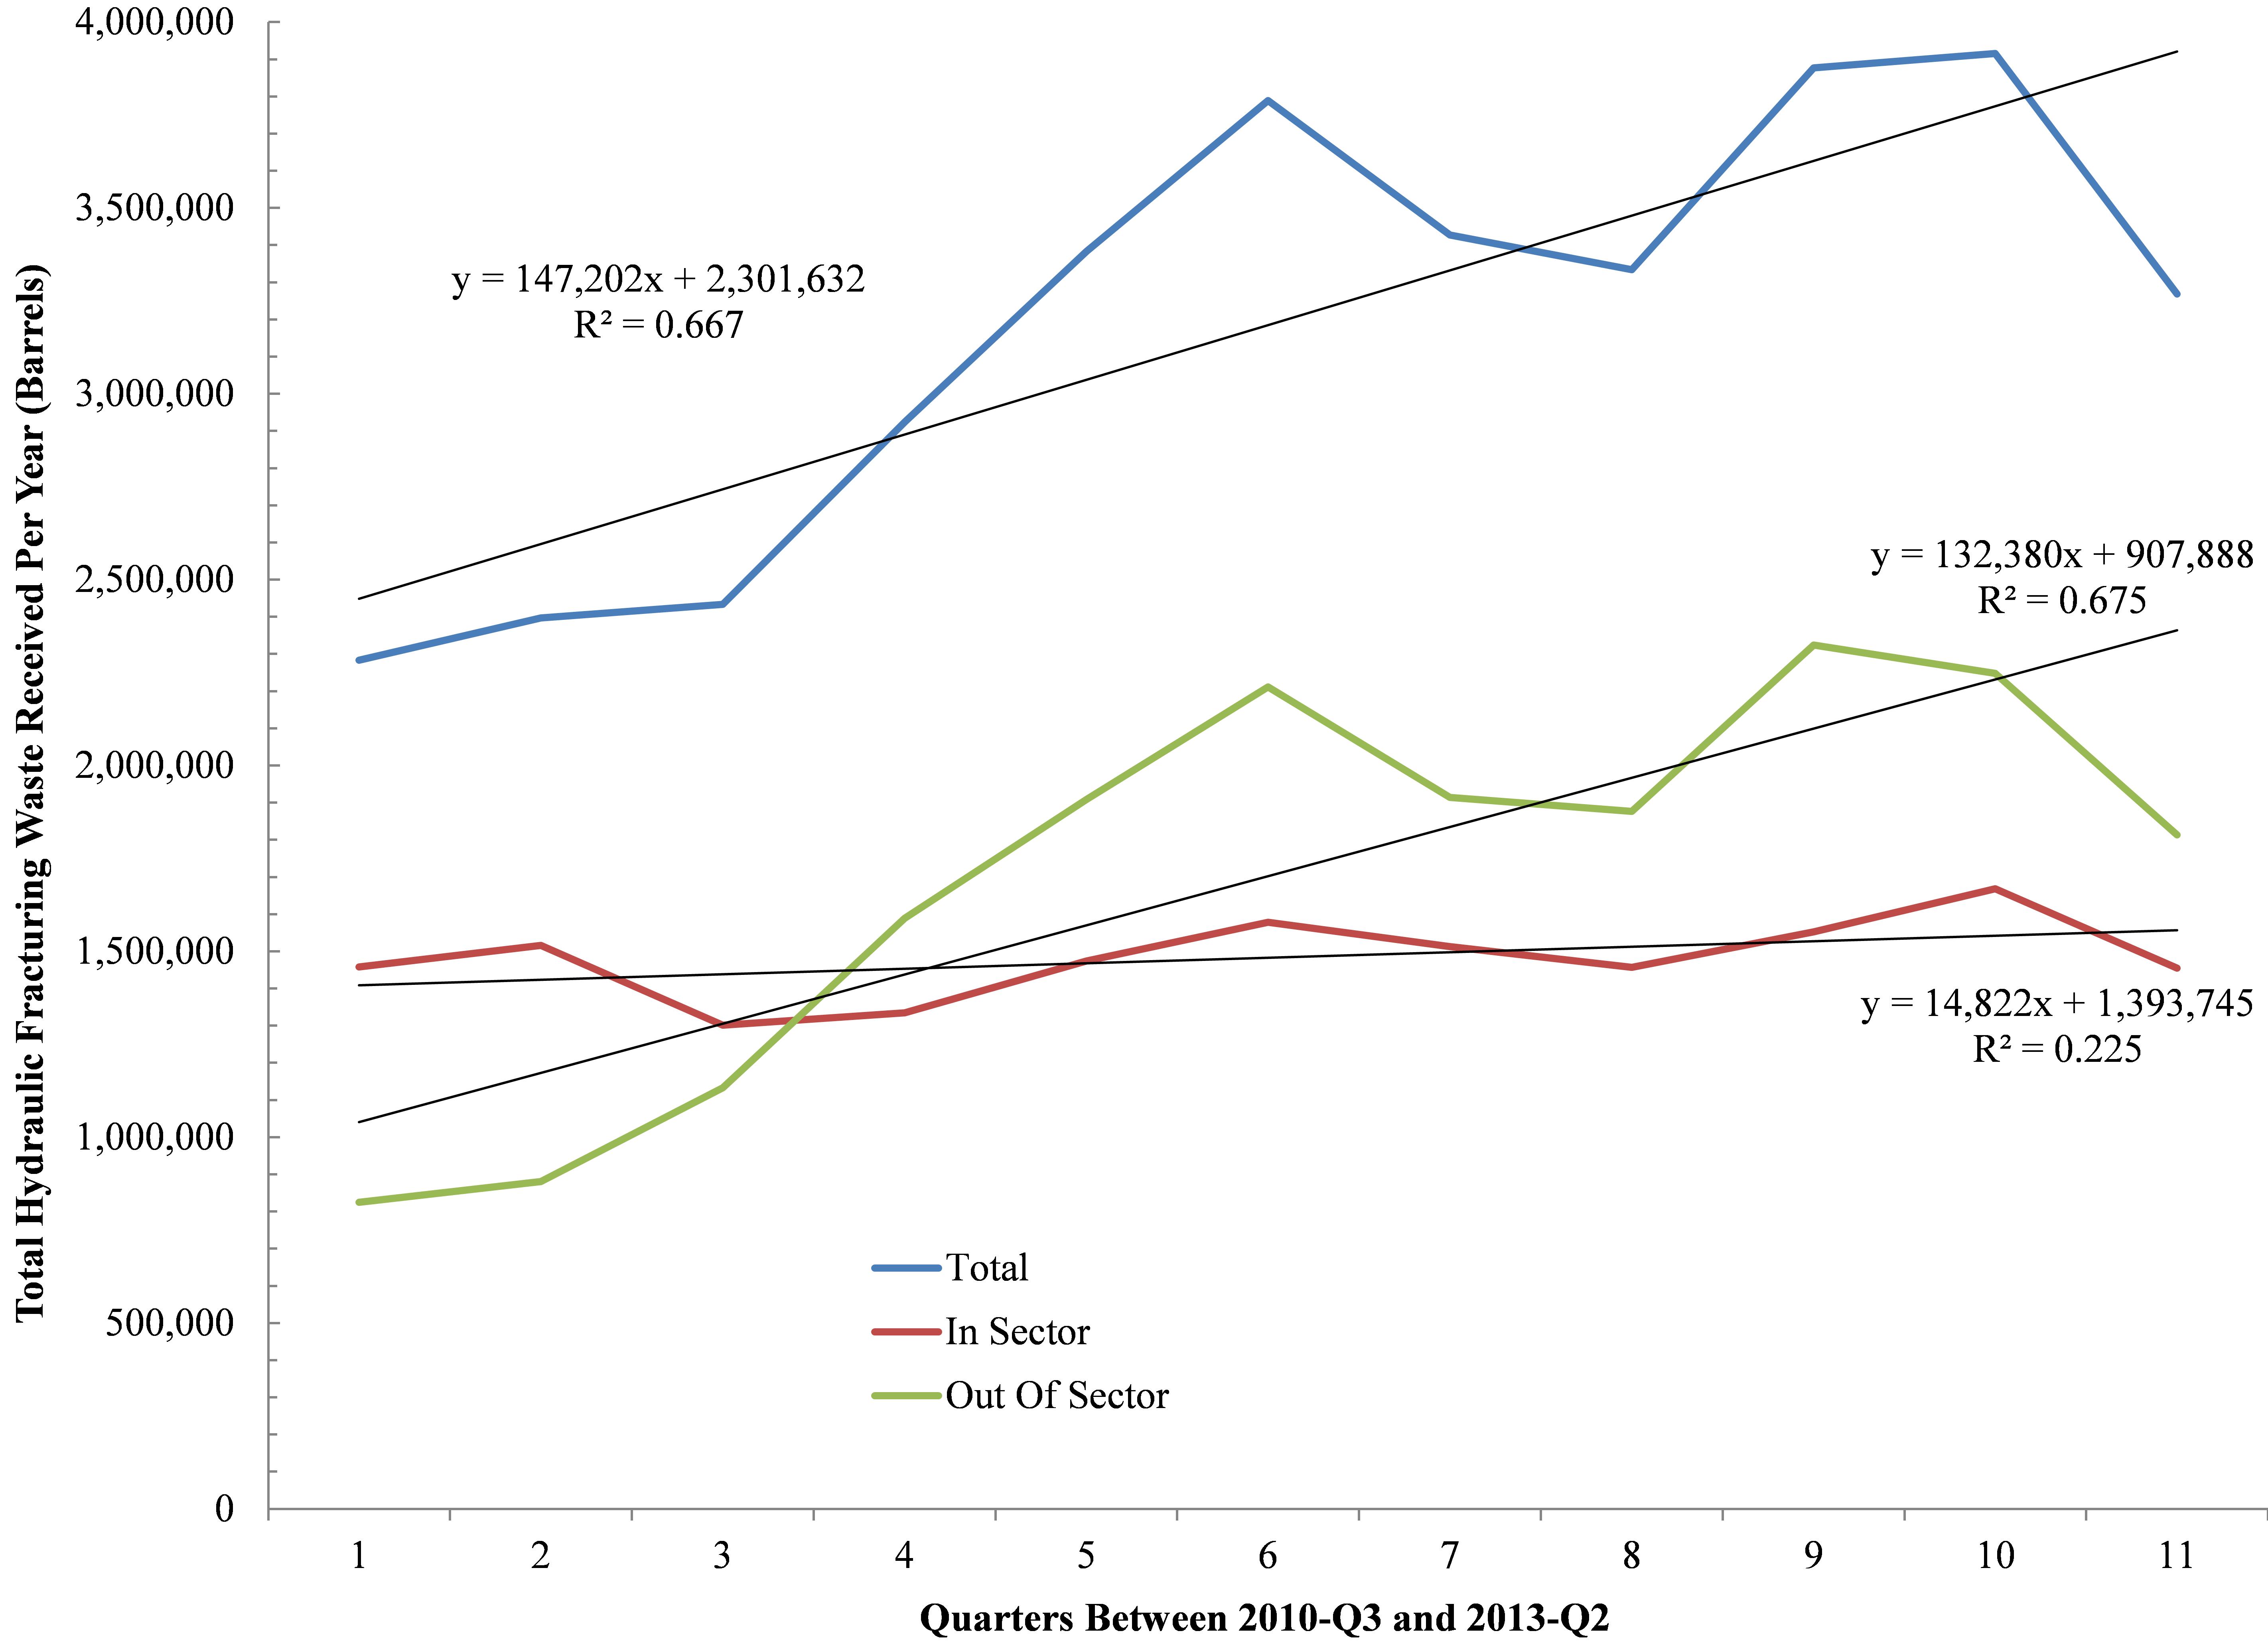
The volume of material injected into each well is 80±6% freshwater (4.1 million gallons) and 7±4% recycled water (373,783 gallons) (Figs. 3 & 4, below). Of the top 20 wells utilizing the highest percent of freshwater, Anadarko and Antero operate 14 of the wells. With respect to recycled water, the only corporation utilizing recycled water is Chesapeake accounting for all 152 wells, with a range of 13,471 4 – 966,412/1,015,826 gallons5 recycled water (Fig. 2, right). A quarter of Ohio’s drilled, drilling, or producing wells – along with the other 12 firms we have data for – do not utilize any recycled waters, however. Currently Ohio’s Utica wells are producing 1.4-11.1 or 1.7-1,063 barrels of brine per barrel of oil depending on whether you choose to incorporate into your calculations the eight wells that have only reported brine numbers to date all of which speaks to its place on nascent Energy Return On Energy Invested (EROEI) league tables. Learn more>
Chemical Utilization
Utica wells are using Hydrochloric Acid (HCl) ranges of 0.12-0.36% per well. However, due to the fact that the strength of this reagent is not required for each well knowing the percentage of HCl – which is one of six “Strong Acids”6 – is relatively useless; HCl’s molarity/concentration determines its corrosive and acidifying capabilities as defined by the International Union of Pure and Applied Chemistry’s (IUPAC) Gold Book. As such, requiring firms to report the concentration of the HCl utilized on a per well basis should be a component of the reporting process especially given that these percentages translate to 5,351-16,350 gallons of HCl per well– nontrivial amounts by anyone’s standards.
Frac Sand
Ohio’s Utica wells have used 703,080 tons of sands with a market value of $46.87 million7. See Table 1 for a more detailed breakdown.
The per-well origin of these frac sands is an additional unknown variable that would assist in understanding the flows of materials into the state and within the state given that:
- Ohio is home to one of the major players in the north American frac sands industry Fairmount Minerals;
- the origin and texture of frac sands determine their ability to result in silicosis – already 10 times higher in hydraulic fracturing workers – on and around fracking operations; and
- states such as Minnesota and Wisconsin (Click here for 2012 Wisconsin DNR “Silica Sand Mining in Wisconsin” report) and to a lesser degree Kansas, Iowa, and Illinois are claiming that their frac sands are smaller, more uniform, and rounder.
Just like the concentration of HCl, we need to have access to frac sands sourcing in order to fully understand the industry’s footprint and trajectory outside of the “shale plays.”
| Table 1. Summary sand usage and chemistry statistics for 248 horizontal Utica wells | |||||
| Constituent | Mean | Median | +/- |
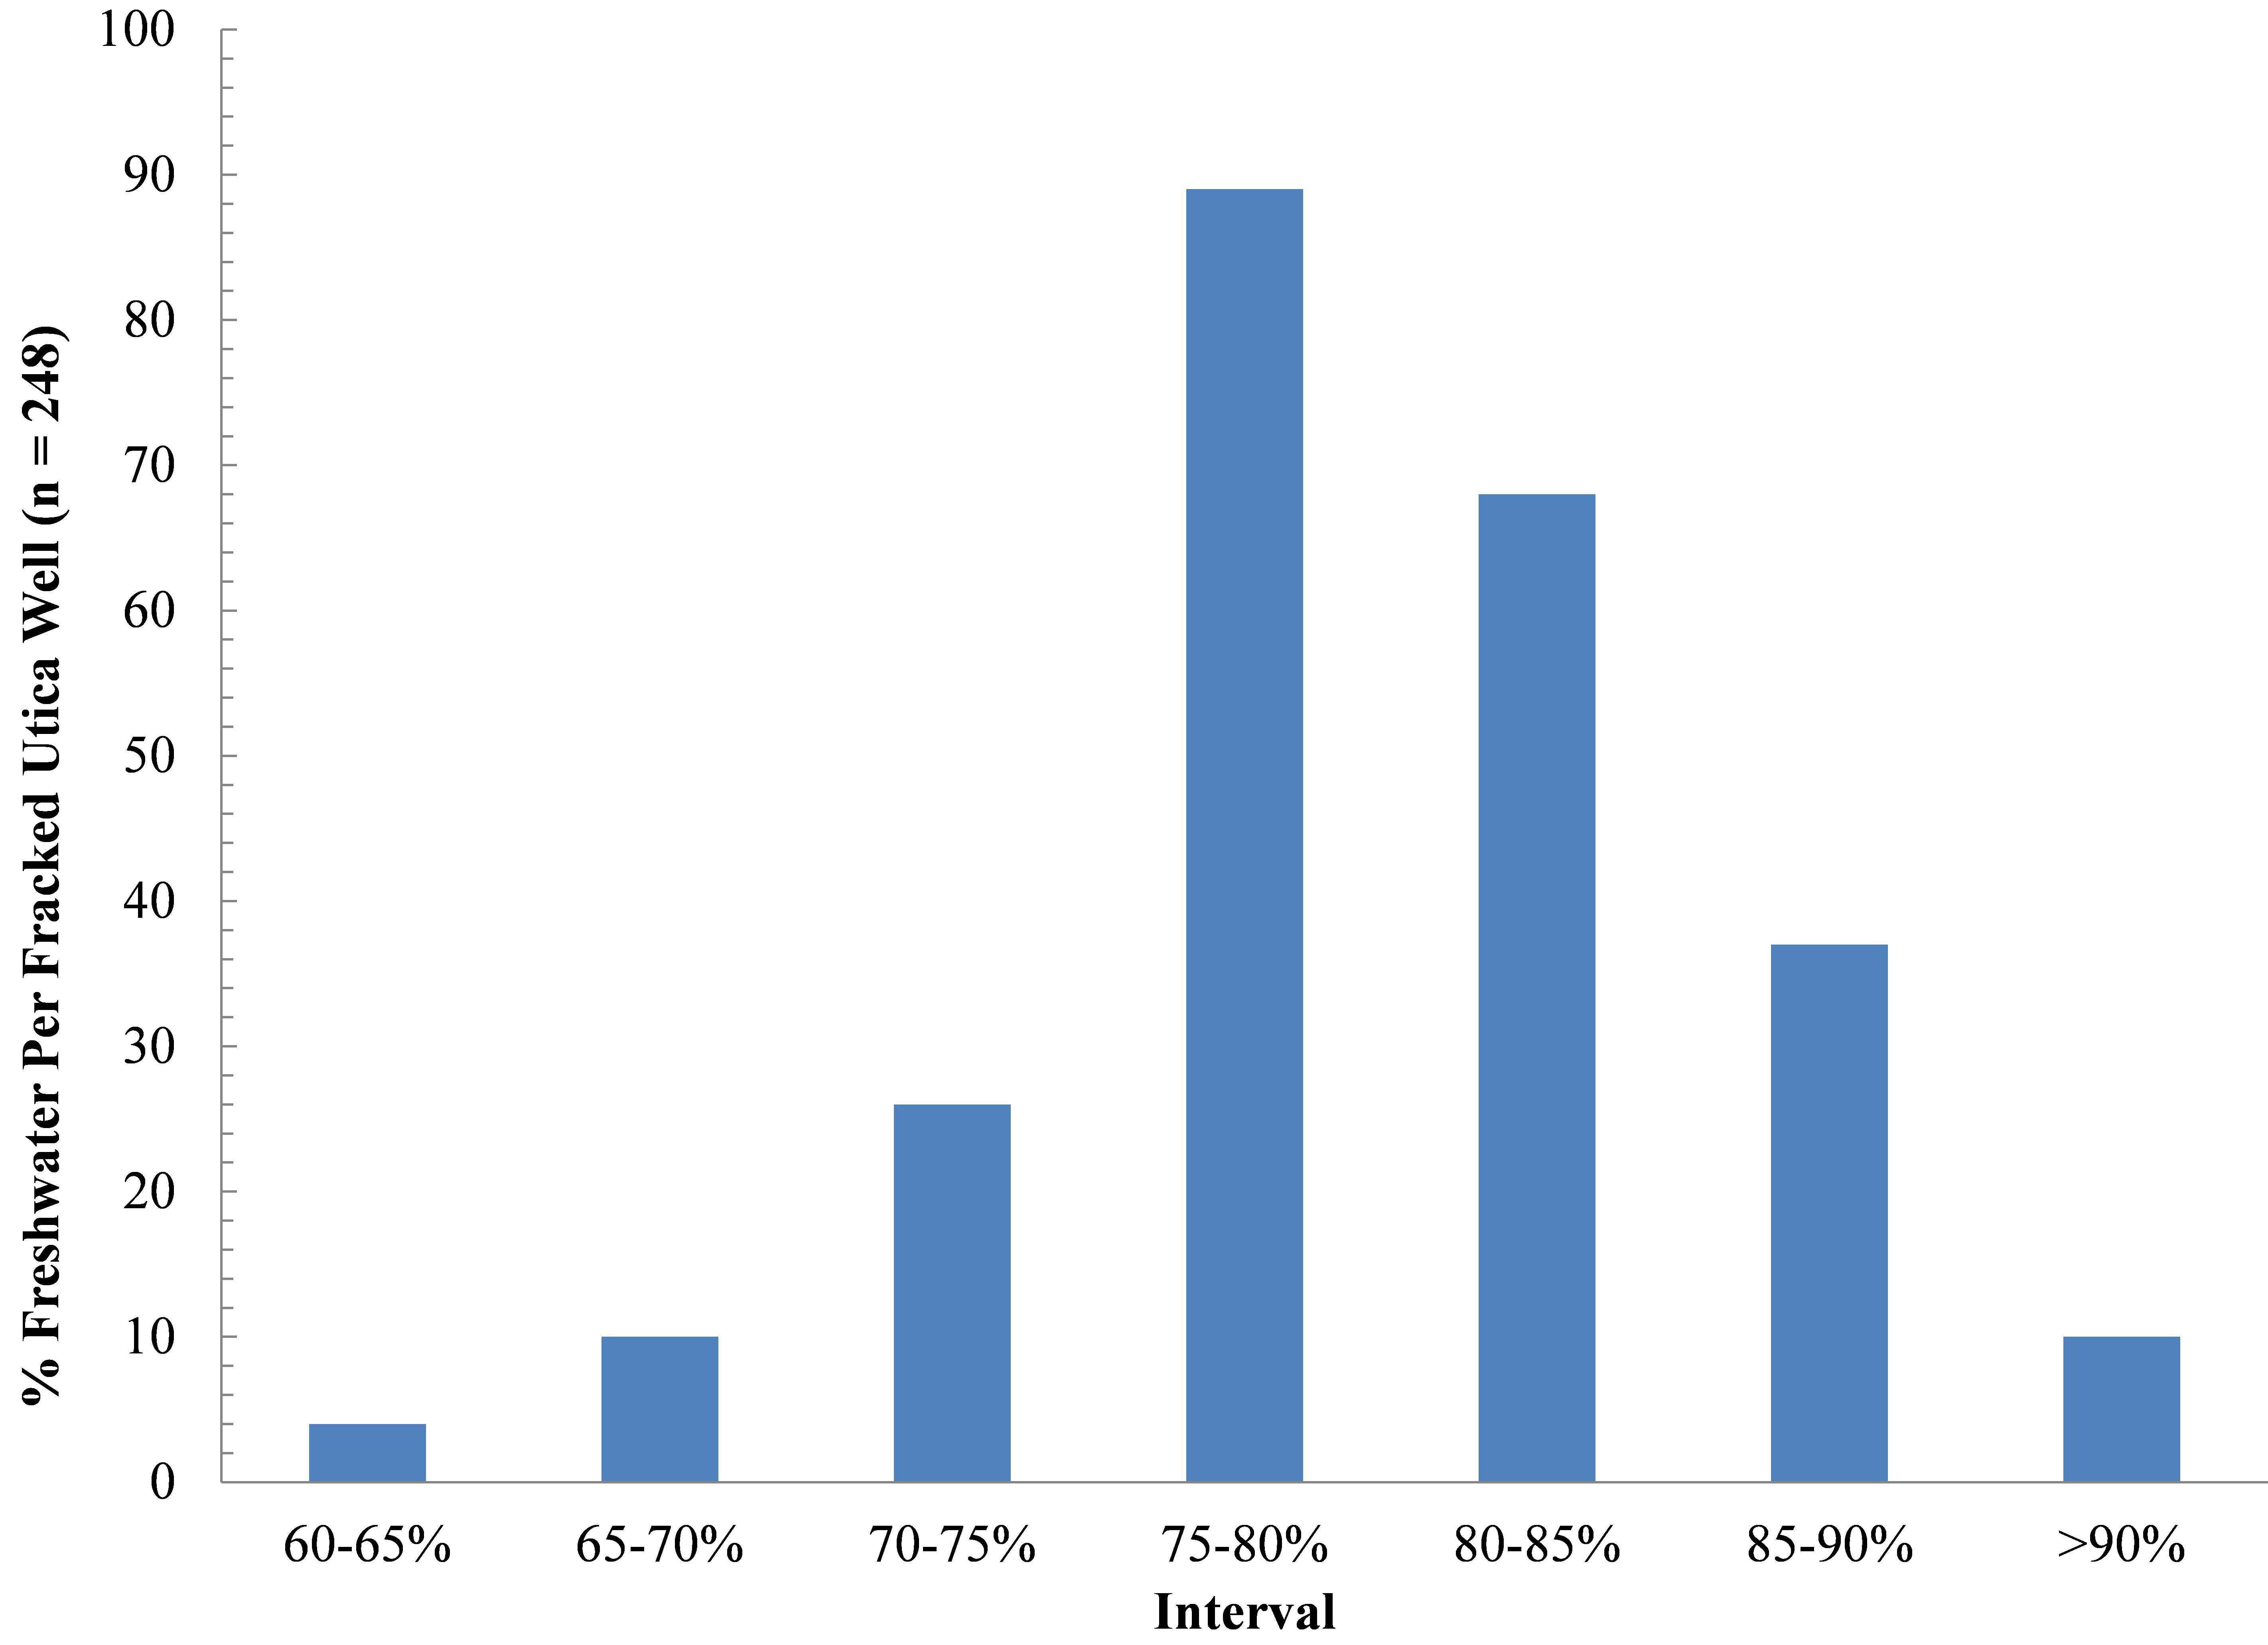 Figure 3. Percent freshwater per fracked well interval range (248 horizontal Utica wells). Click to enlarge. |
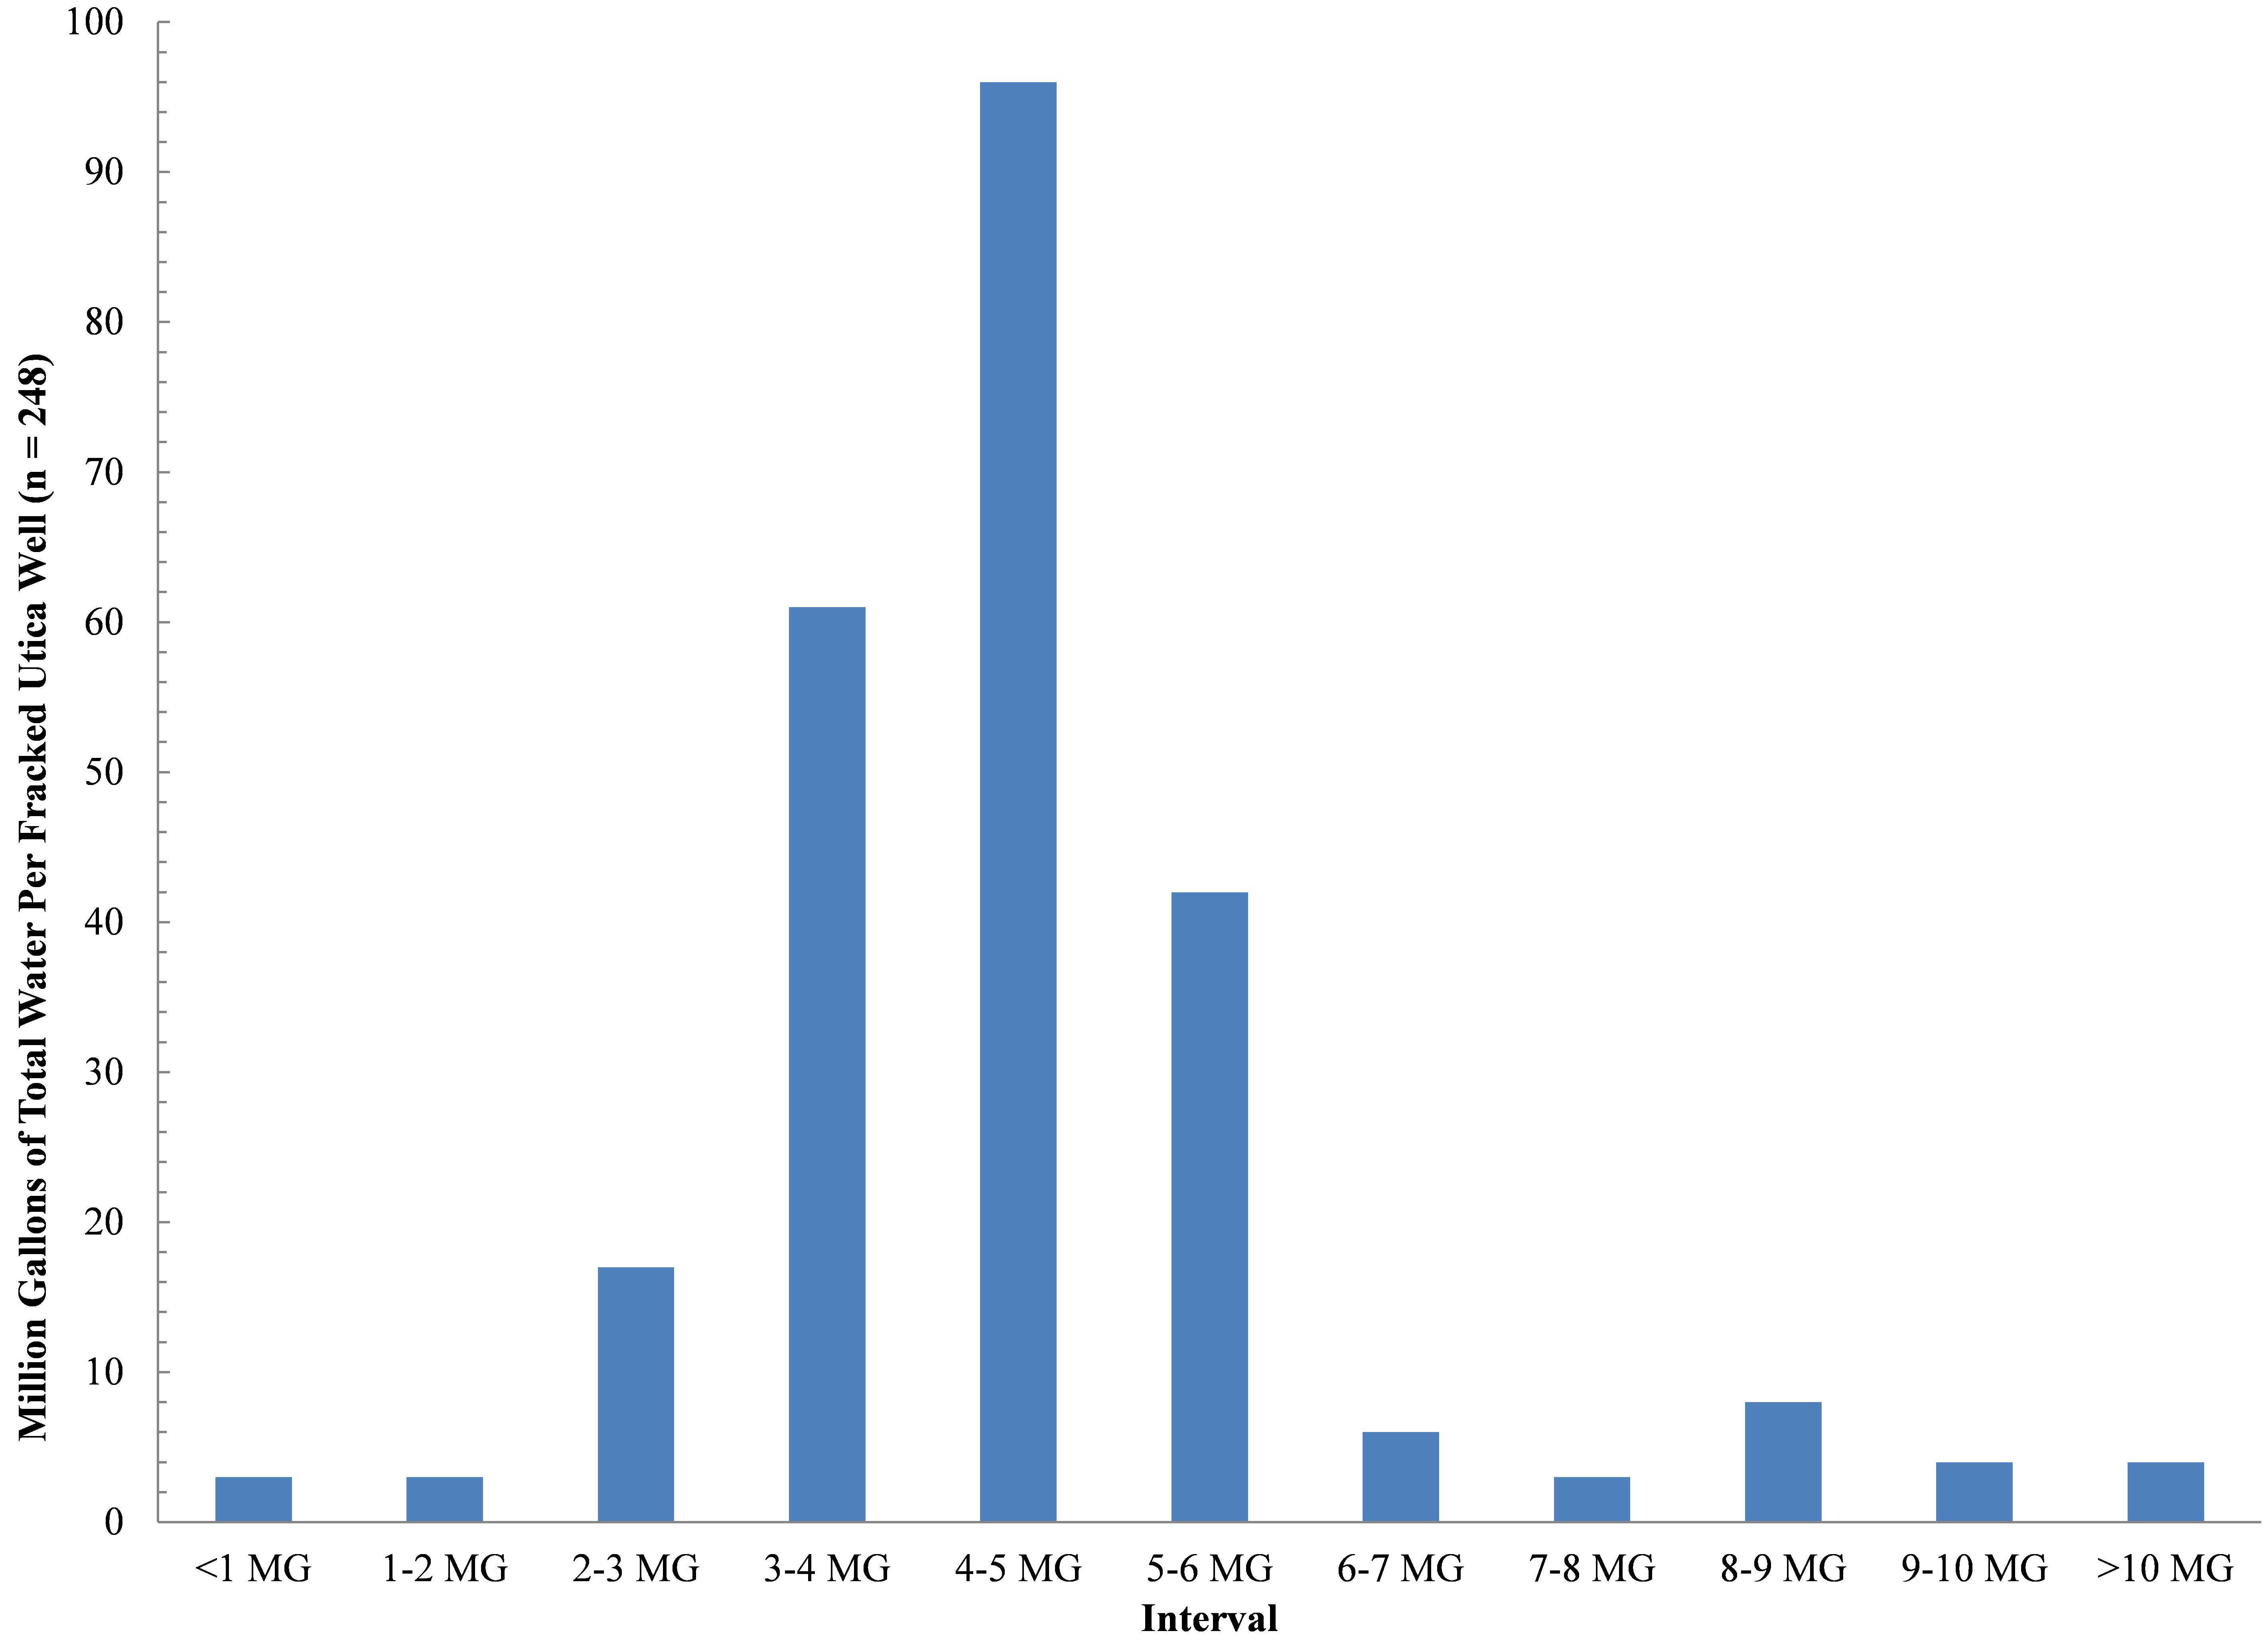 Figure 4. Percent recycled water per fracked well interval range (248 horizontal Utica wells). Click to enlarge. |
| Grain Size (μm) | Sand Usage Per Well (Tons) | ||||
| 106-212 212-425 300-600 425-850 |
1,406 1,269† 5,320 2,267 |
737 – 5,371 1,499 |
4,872 – 1,374 1,858 |
||
| – – – – – – – – – – – % of Total Frac Fluid – – – – – – – – – – – | |||||
| Petroleum Polysaccharides Guar Gum Proprietary Polymers Surfactants Crystalline Silica Gelling Agents |
0.090 0.1034 0.172 3.47 0.029 0.029 0.511 |
0.084 0.1021 0.070 0.07 0.003 0.003 0.145 |
0.042 0.0247 1.22 12.96 0.061 0.060 3.80 |
||
| † Only one well reported using 212-425 mm sands | |||||
Endnotes
- To put these volumes in perspective, a complete inventory (n= 411) of neighboring West Virginia horizontal wells, we find that their wells are using 5.39-5.49 MGs per well with 85.8-88.0% freshwater and 8.00-9.28% recycled water – or 9.2-11.0 freshwater-to-recycled water ratios. Additionally, WV wells are using 0.76-0.094% HCl and 8.38-10.29% sands. Meanwhile across sixteen Michigan wells, water usage is quite variable with an average between 369,349 and 4.23 MGs, along with 87.85-90.69% freshwater, 0.56-0.79% HCl, and 8.05-8.80% sands.
- Assuming 90 gallons of water usage per capita per day. Reference: USGS
- The 25 and 52 permits per month values are the monthly average since the first permits were issued here in Ohio in September 2010 and the 2013 monthly Ohio average, respectively.
- Fligiel 29-12-5 12H well
- Lozier 14-15-5 8H and Bucey Bucey 3H wells, respectively.
- Sulfuric Acid H2SO4 is the only common acid that is stronger.
- Assuming 4-8 million pounds per lateral well. References: ICIS and OAIMA

 as a proxy for previous land-use.")
 Conference attendees heard from a variety of researchers and community activist about their successes and failures, data needs, and expectations for how to leverage the conference gathering into a relatively cohesive and largely ego free movement. One highlight was a presentation and informal discussion with Deborah Rogers, former Merrill Lynch and Smith Barney investment banker,
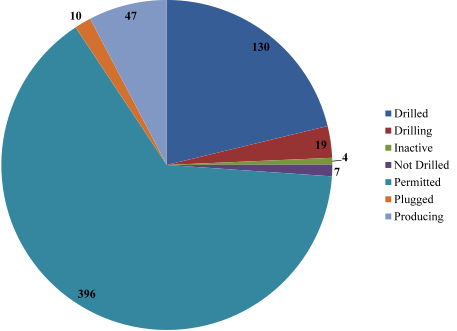


")