Fracking vs. Ohio’s Renewable Energy Portfolio – A False Distinction
Changes to OH Wind Power
Part I of a Multi-part Series – By Ted Auch, OH Program Coordinator, FracTracker Alliance
Governor Kasich recently signed SB 310 “Ohio’s Renewable Energy Portfolio Standard” and HB 483.1 This action by all accounts will freeze energy efficiency efforts (such as obtaining 25% of the state’s power from renewables by 20252) and impose a tremendous degree of uncertainty on $2.5 billion worth of wind farm proposals in Ohio.
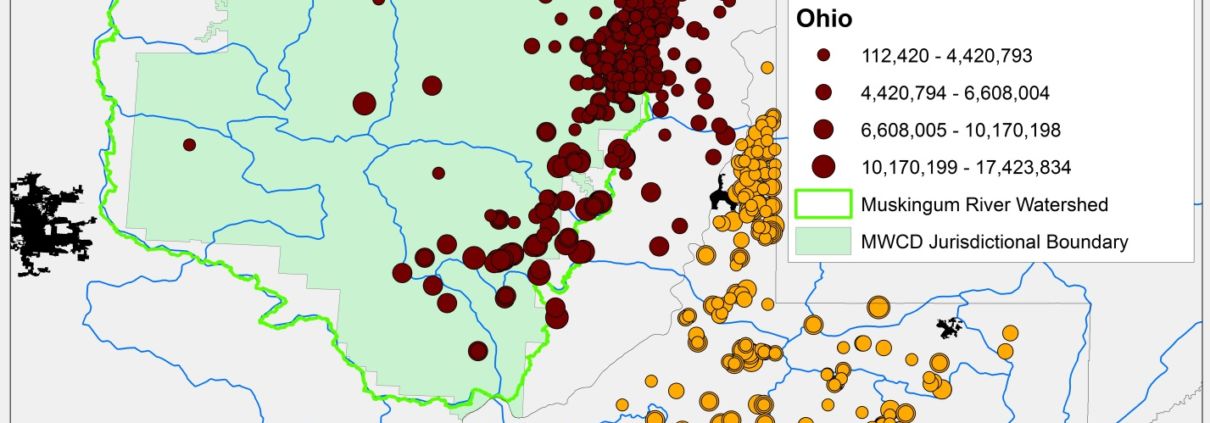
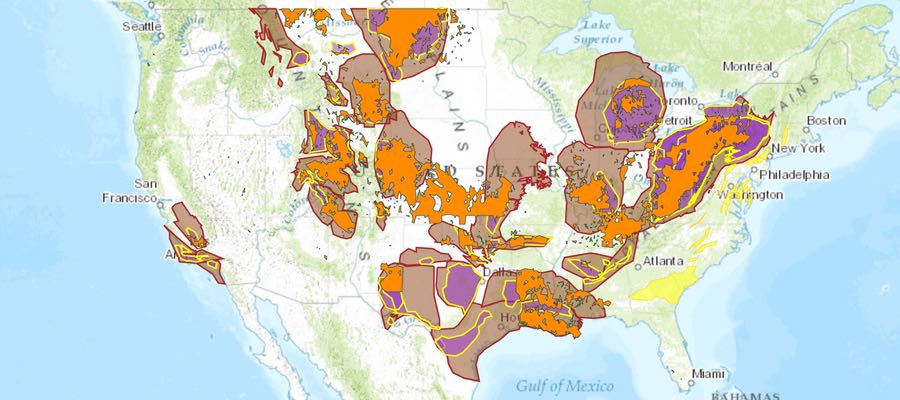
Active & Proposed Wind Projects in the U.S.
The above map describes active and proposed renewable energy projects, as well as energy related political funders and think tanks. We will be relying heavily on this map throughout our Ohio renewable energy series. Click the arrows in the upper right hand corner of the map to view the legend, metadata, and more.
Opposing Views
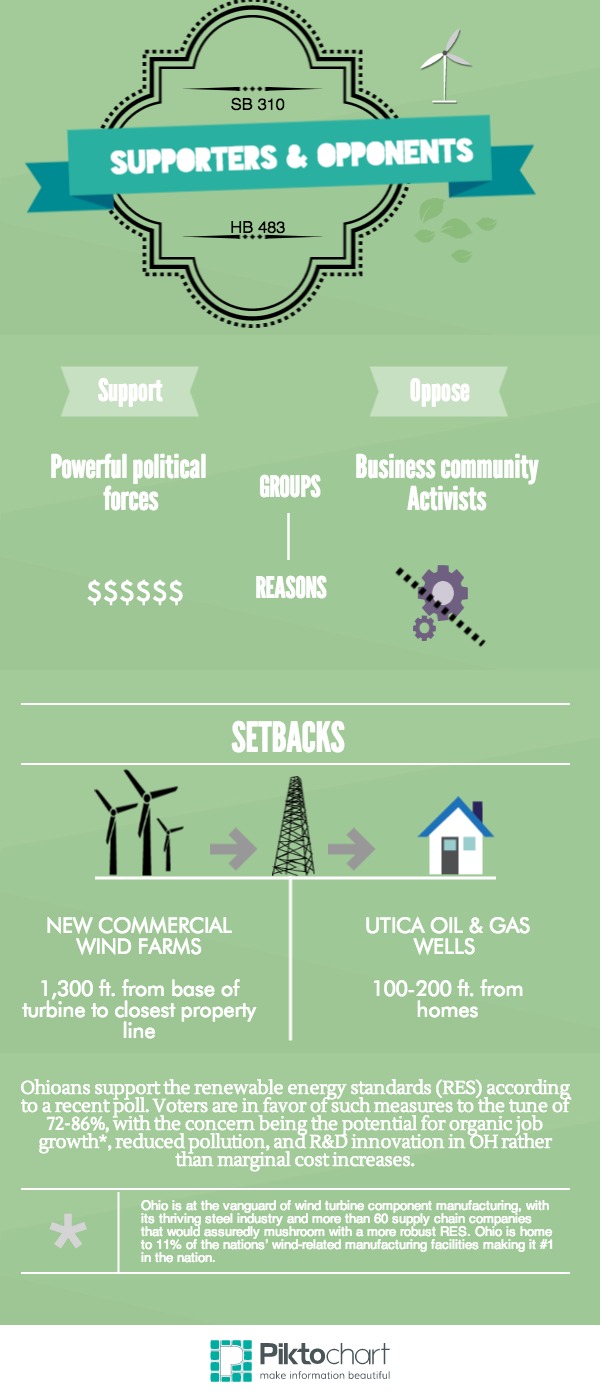
Opposition to SB 310 and HB 483 is coming from the business community3 and activists, while powerful political forces provide support for the bill (see figure right). Opponents feel that renewables and a more diversified energy portfolio are the true “bridge fuel,” and unlike hydrocarbons, renewables provide a less volatile or globally priced source of energy.
HB 483 will change new commercial wind farms setbacks to 1,300 ft. from the base of the turbine to the closest property line – rather than the closest structure. The bill will also change the setback for permitted and existing wind projects to 550 feet from a property line in the name of noise reduction, potential snow damage (Kowalski, 2014; Pelzer, 2014). This imposed distance is curious given that setbacks for Utica oil and gas wells are only 100-200 feet.
OH’s turbine setback requirements instantly went from “middle of the pack” to the strictest in the nation. OH is now in the dubious position of being the first of 29 states with Renewable Energy Standards (RESs) to freeze renewable energy before it even got off the ground. Is the road being intentionally cleared for an even greater reliance on shale gas production and waste disposal in OH?
An Environment of Concerns
As Mary Kuhlman at the Public News Service pointed out, the concern with both bills from the renewable energy industry – including wind giant, Iberdrola – is that the bills will “create a start-stop effect that will confuse the marketplace, disrupt investment, and reduce energy savings for customers.” These last minute efforts to roll back the state’s renewable energy path were apparently inserted with no public testimony; the OH Senate spent no more than 10 minutes on them, and there was overwhelming support in both the House and the Senate.
Ohioans, unlike their elected officials, support the renewable energy standards according to a recent poll (Gearino, 2014). Voters are in favor of such measures to the tune of 72-86%, with the concern being the potential for organic job growth4, reduced pollution, and R&D innovation in OH rather than marginal cost increases.
The elephant in the room is that fossil fuel extraction may not improve residents’ quality of life. Many of the most impoverished counties in this country are the same ones that relied on coal mining in the past and hydrocarbon production presently. The best examples of this “resource curse” are the six Appalachian Mountain and Texas Eagle Ford Shale counties chronicled by The New York Times (Fernandez and Krauss, 2014; Flippen, 2014; Lowrey, 2014).
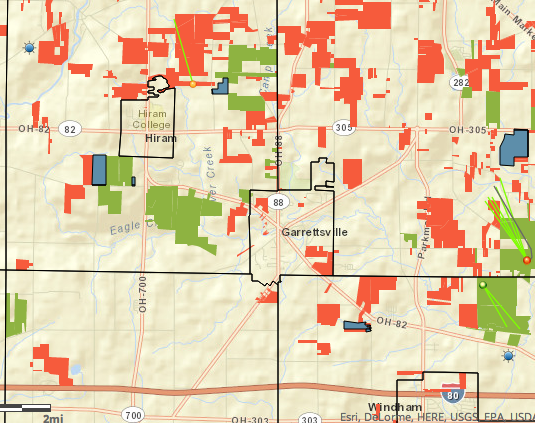
Ohio Wind Potential
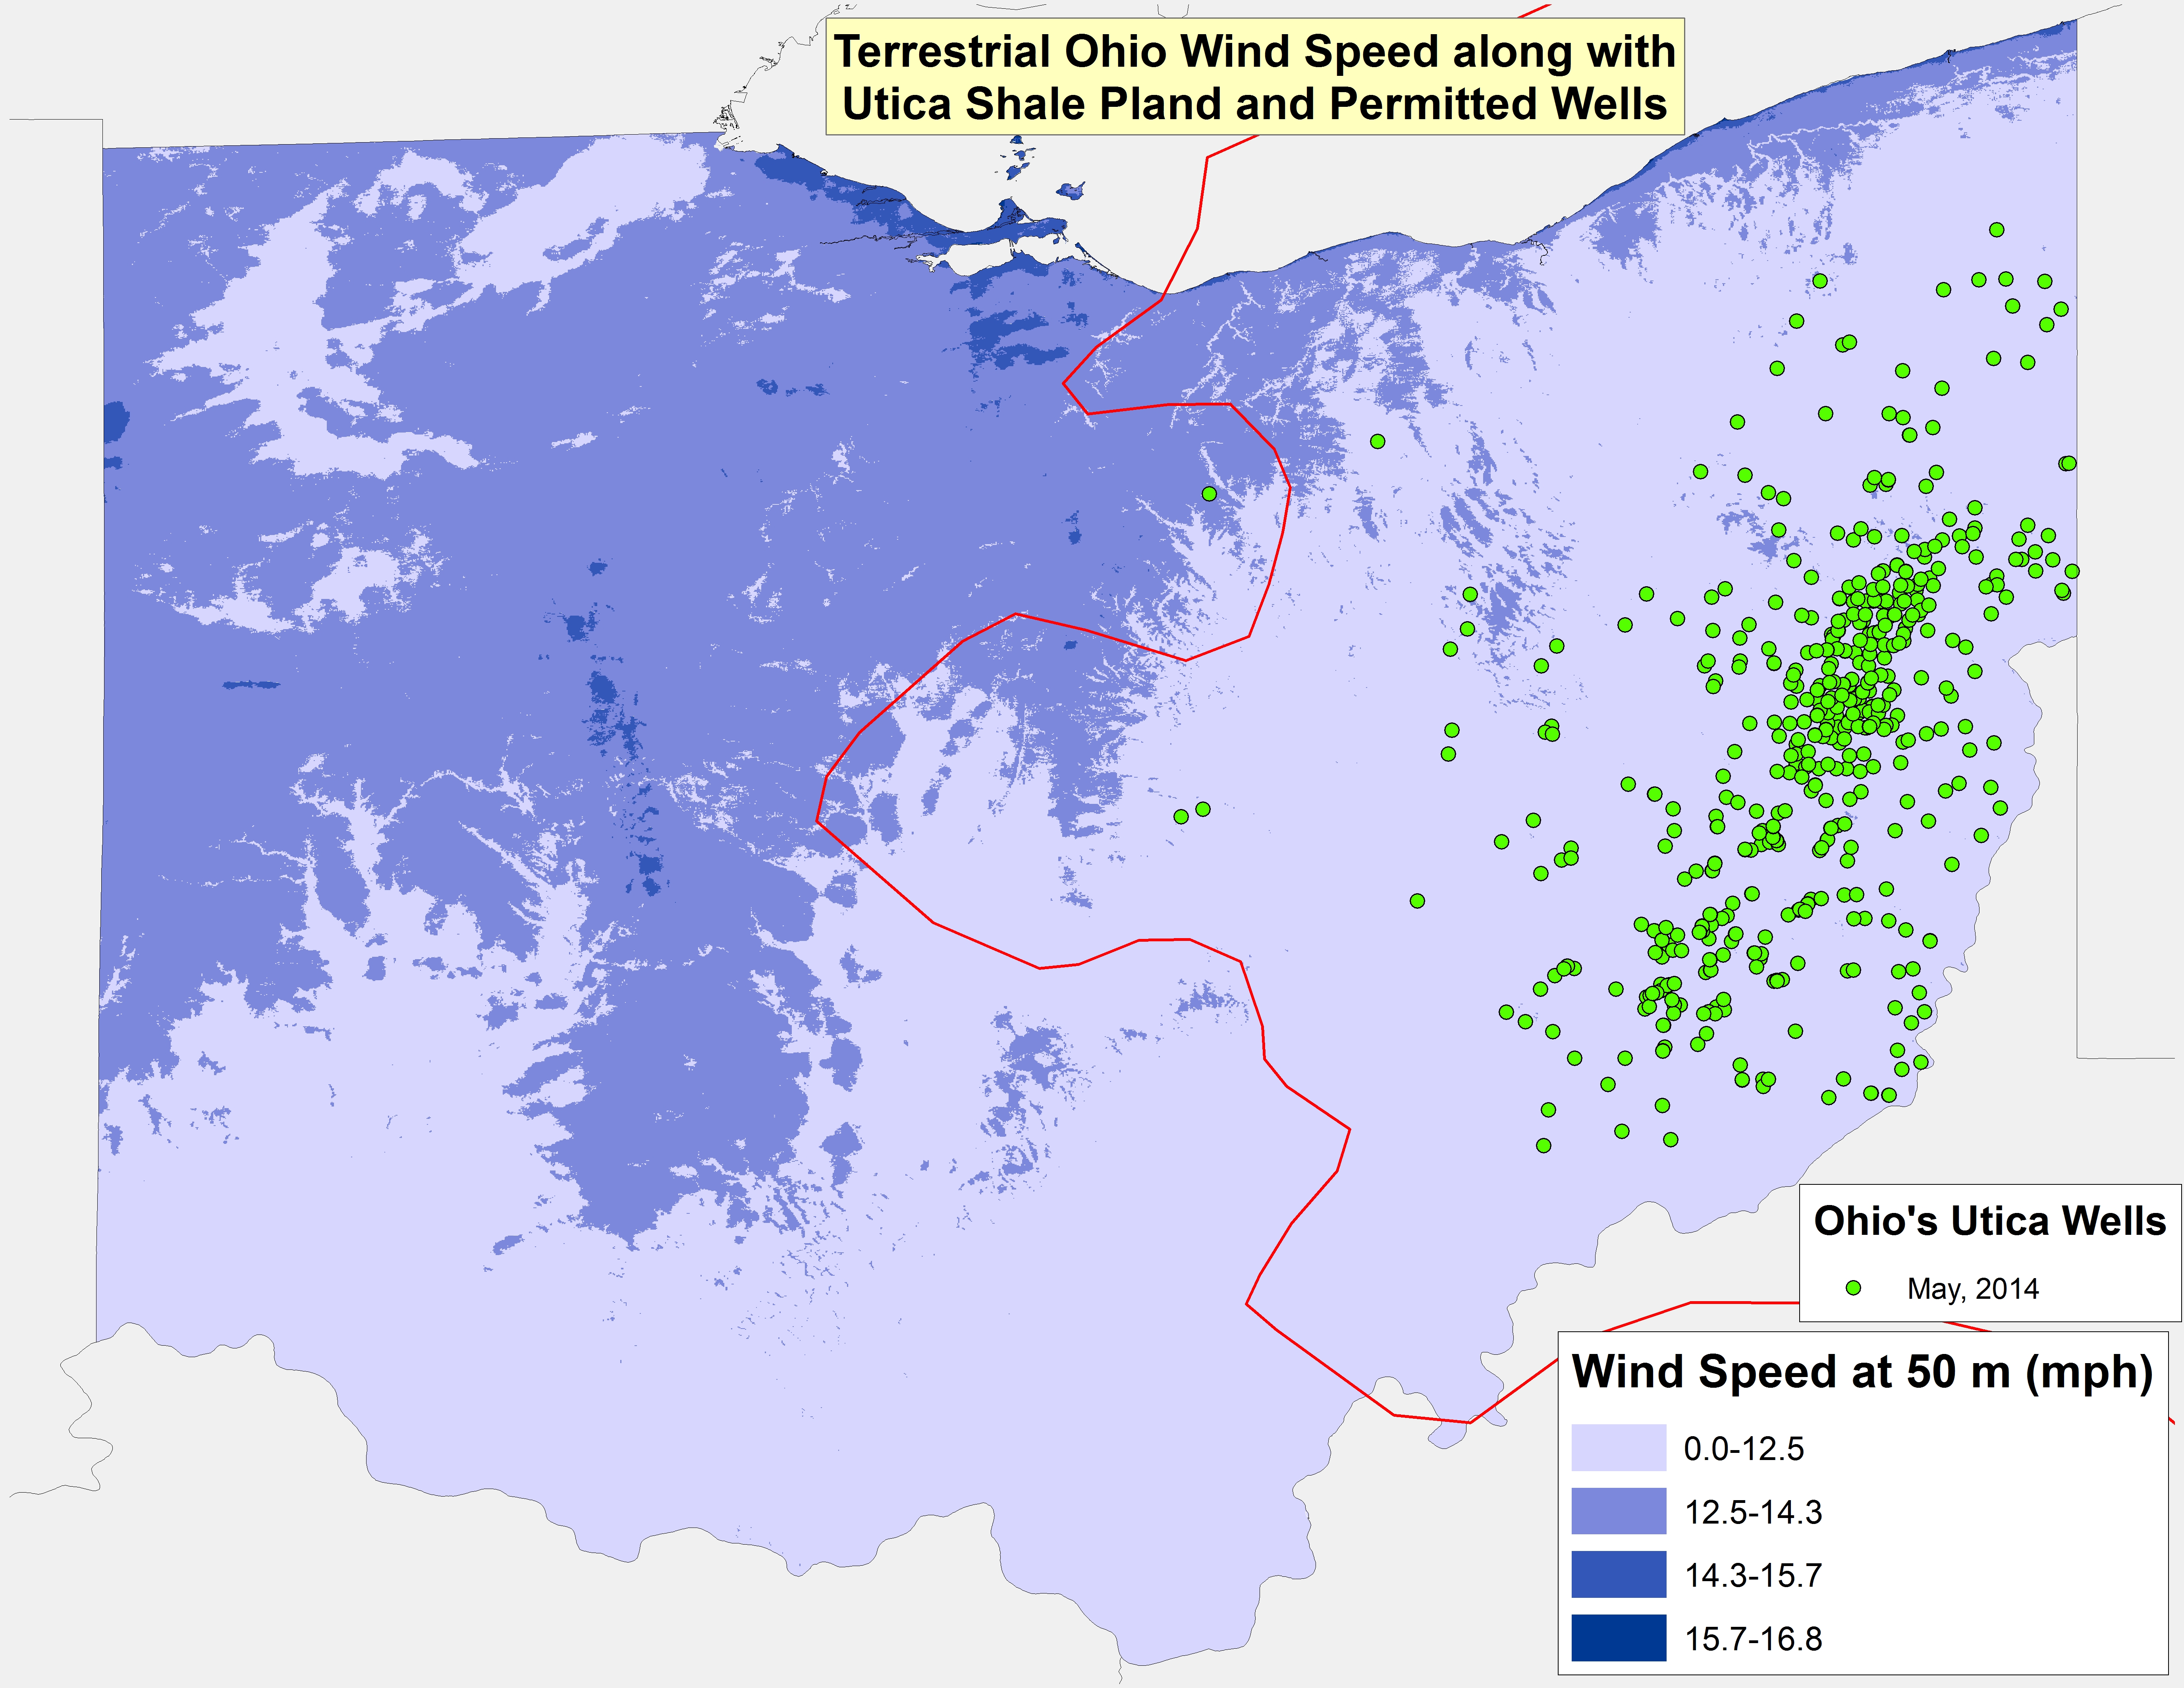
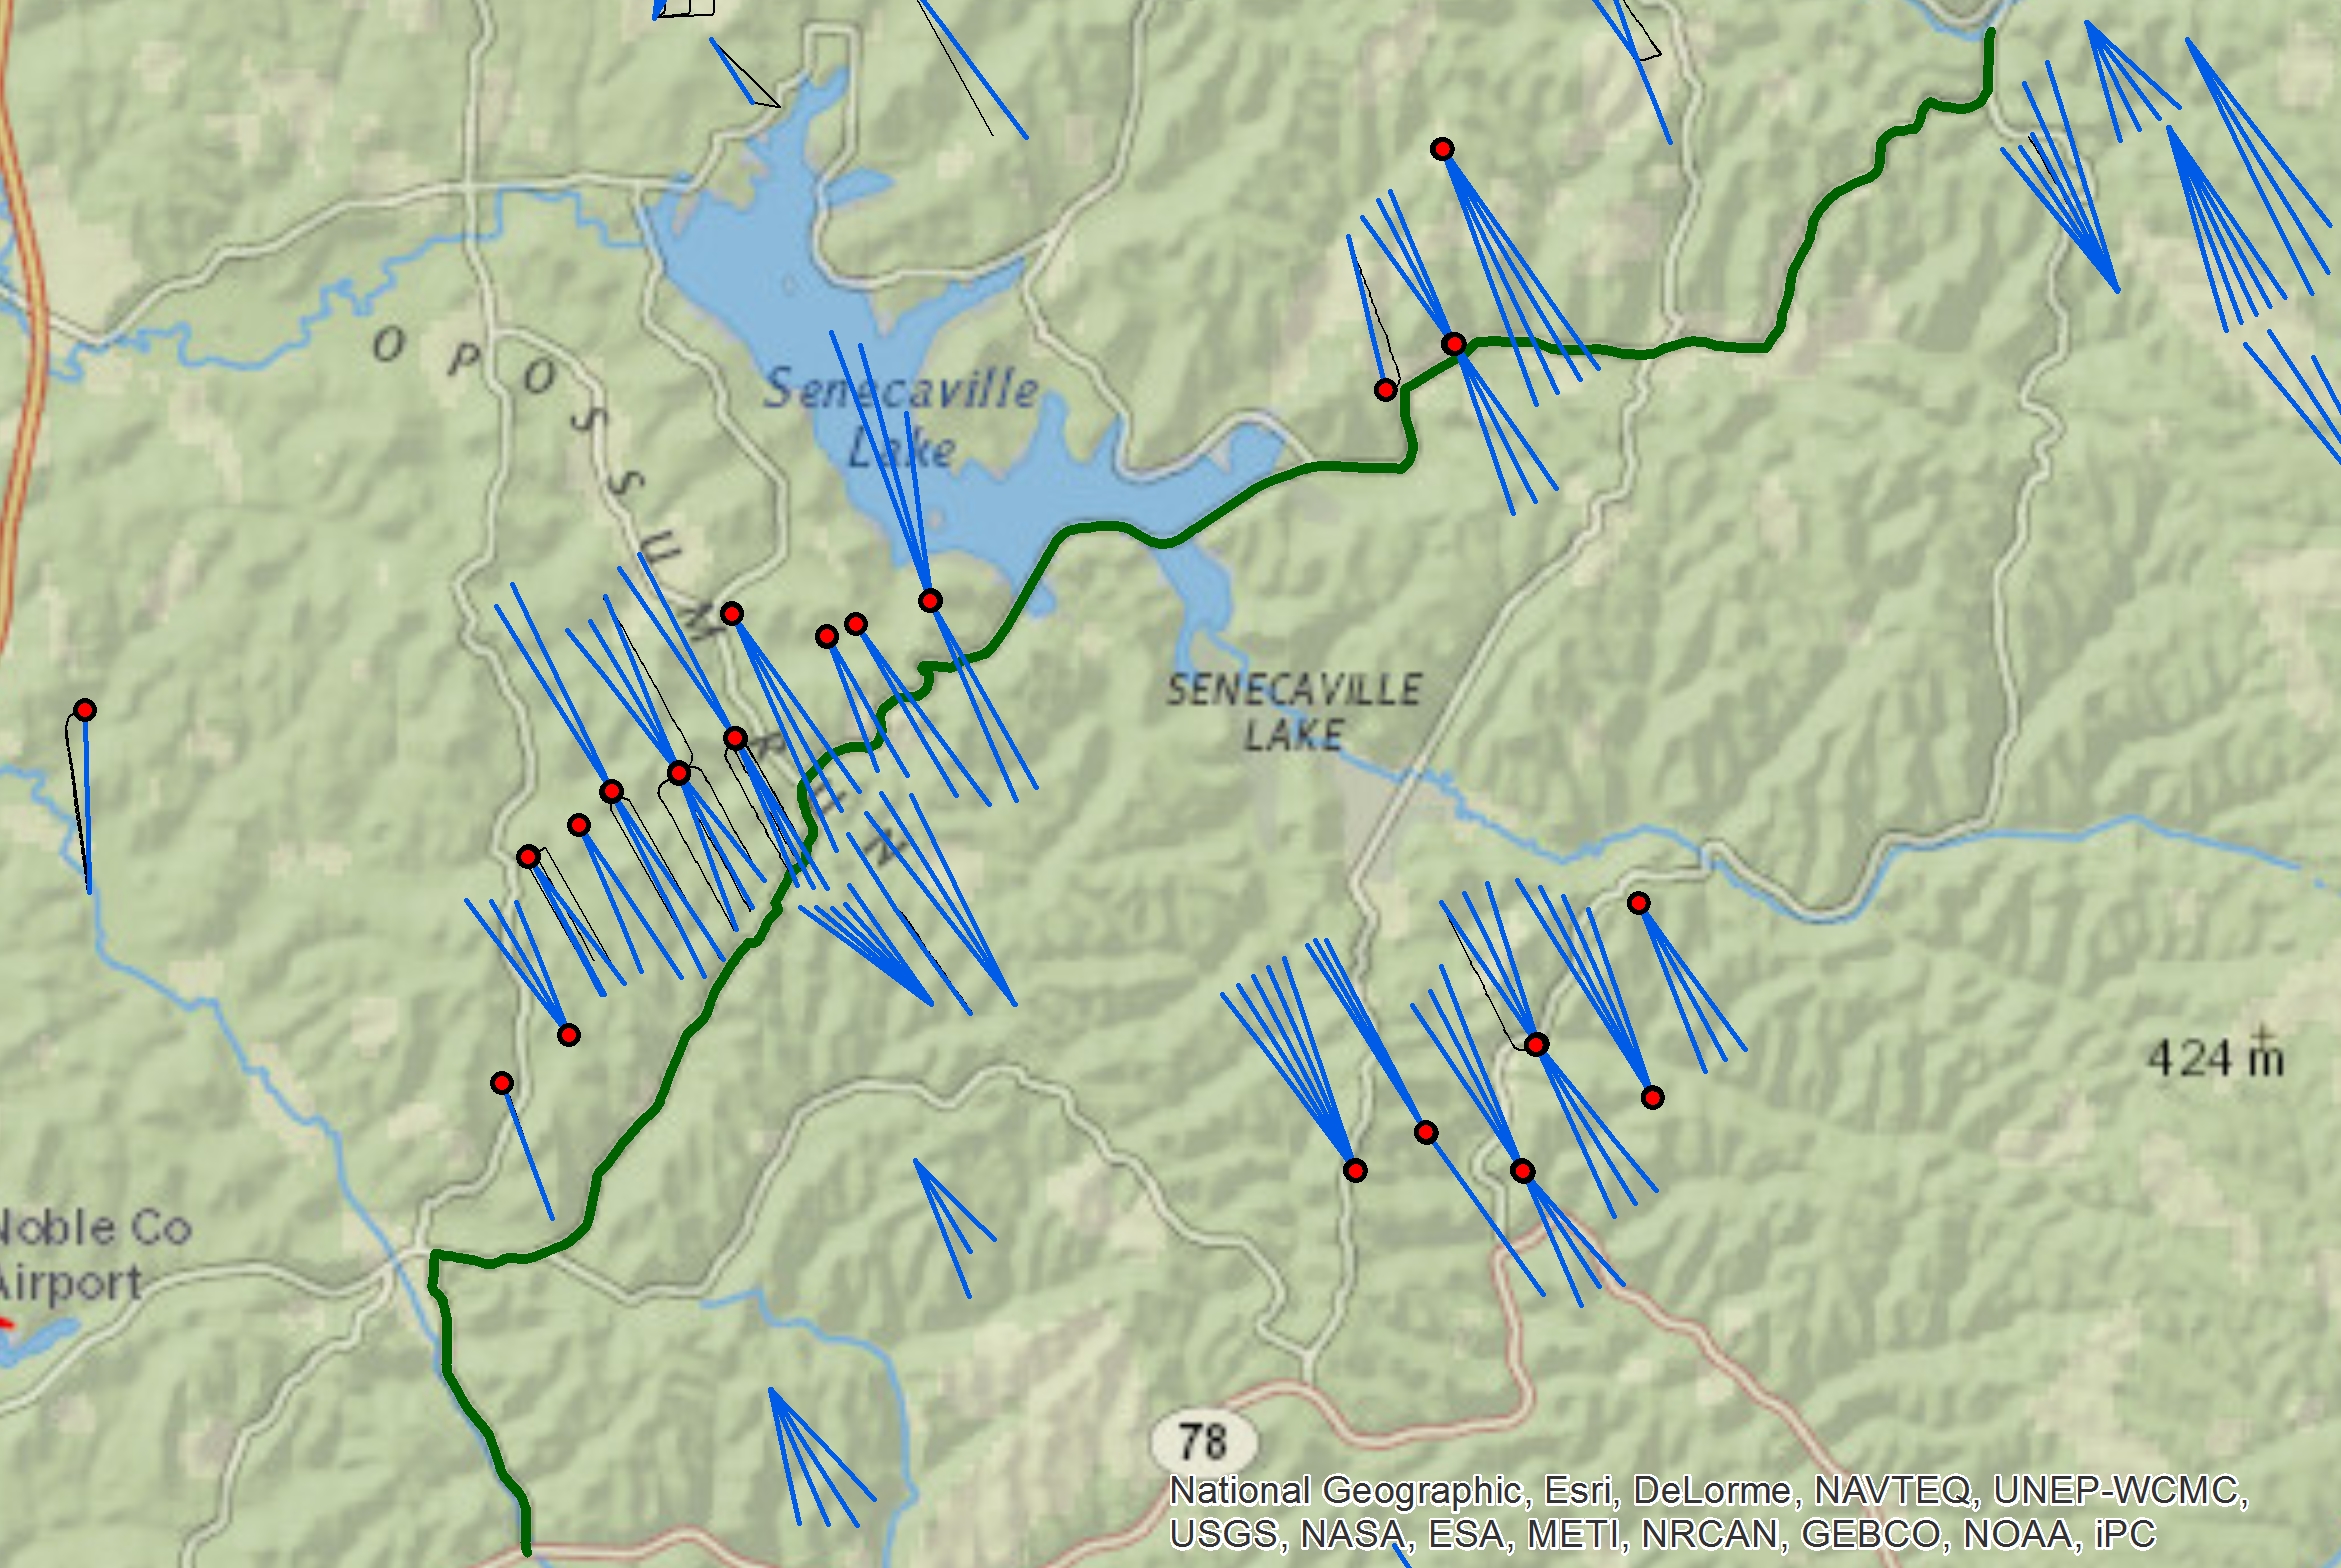
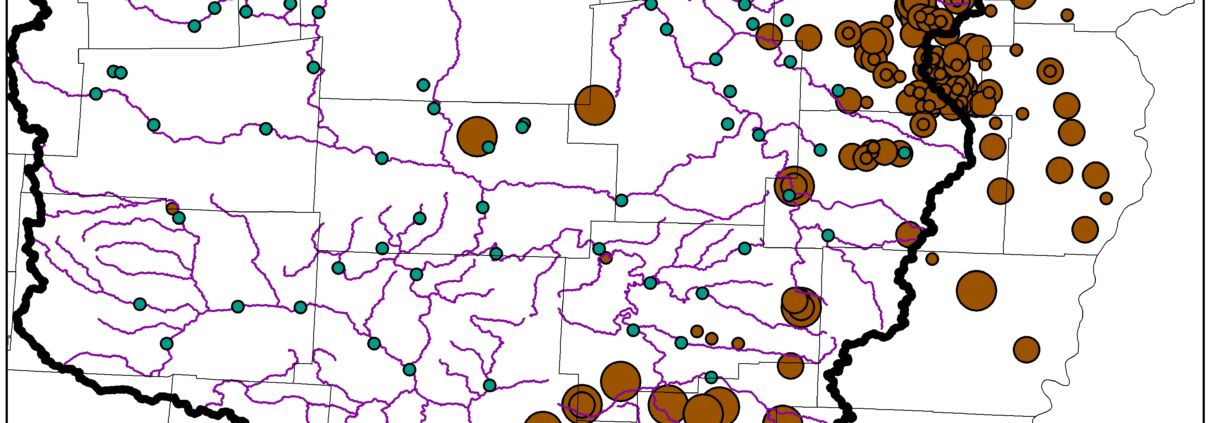
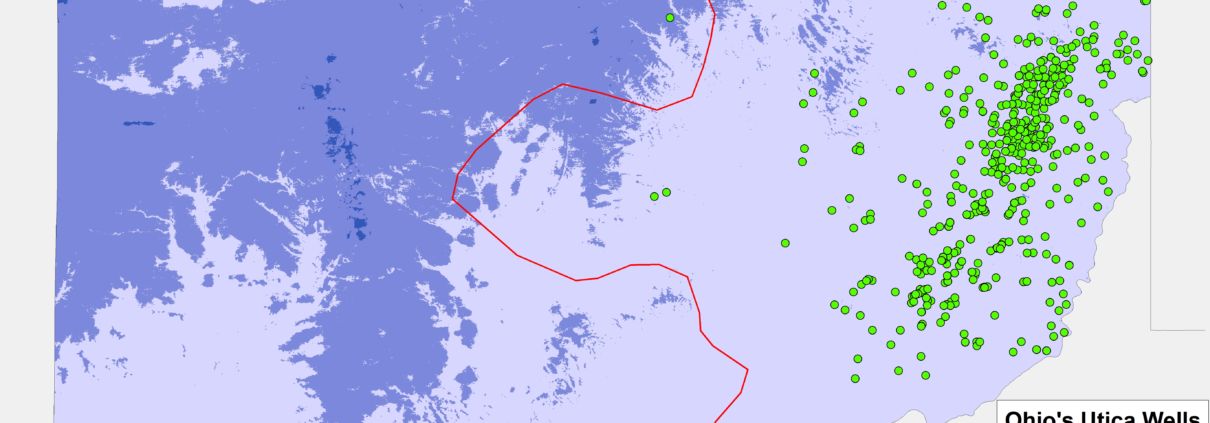
Figure 1. OH Wind Speed, Utica Shale Play, & Permitted Utica Wells. Click to enlarge.
According to the American Wind Energy Association (AWEA), OH currently has 425-500 megawatts (MW) worth of operating wind power, which ranks it ahead of only Kentucky in the Appalachian shale gas corridor and #26 nationally.6 Using factors provided by Kleinhenz & Associates, a 428 MW capacity equates to 856-1,284 jobs, $628 million in wages (i.e., $49-73K average), $1.85 billion in sales, and $48.9 million in public revenues.
Seventy-one percent of OH’s capacity is accounted for by the $600 million Iberdrola owned and operated Blue Creek Wind Farm in northwestern OH. The terrestrial wind speeds are highest there – in the range of 14.3-16.8 mph as compared to the slow winds of the OH Utica Shale basin (Figure 1).6 It is worth noting that the recent OH renewable energy legislation would have diminished the Blue Creek project by 279 MW if built under new standards, given that only 12 of the turbines would fall within the new setback criteria.
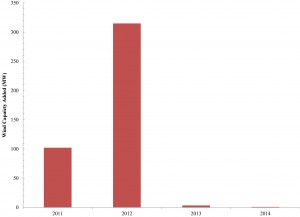
Figure 2. OH Wind Capacity (MW) Added Between 2011 and 2014. Click to enlarge.
If OH were to pursue the additional 900 MW public-private partnership wind proposals currently under review by the Ohio Power Siting Board (OPSB), an additional 900,000-1.2 million jobs, $1.3 billion in wages, $3.9 billion in sales, and $102.9 million in revenue would result. These figures are conservative estimates for wind power but would result in markedly more jobs for Ohioans with the component manufacturing and installation capacity already in OH (Figure 2). The shale gas industry, in comparison, relies overwhelmingly on the import of goods, services, capital, and labor for their operations. Additionally, lease agreements with firms like Iberdrola compare favorably with the current going rate for Utica leases in OH; landowners with turbines on their properties receive $8K. Nearby neighbors receive somewhat smaller amounts depending on distance from turbines, noise, and visibility.
OH’s current inventory of wind projects alleviate the equivalent of 45 Utica wells worth of water consumption.7 Considering current wind energy capacity and the proposed 900 MWs, OH will have only tapped into 2.4% of the potential onshore capacity in the Buckeye State. If the state were to exploit 10% more of the remaining wind capacity, the numbers would skyrocket into an additional 5.5-7.1 million jobs, $8.1 million in wages, $23.8 billion in sales, and $627.9 million in public revenues.
Taking the Wind out of the Sails
However, SB 310 and HB 483 took the wind out of Iberdrola and the rest of the AWEA’s membership’s proverbial sails. Their spokesperson noted that “The people (who will be hurt) most are the ones who have spent a couple of million dollars to go through the OPSB process expecting those (renewable-energy) standards to be there.” OH’s increased capacity historically has accounted for approximately 2.3% of increases nationwide.
Equally, hydrocarbon production dependent states like Texas have found time, resources, and regulatory room for wind even as they continue to explore shale gas development. Texas alone – home to 26% of the nation’s active oil and gas wells according to work by our Matt Kelso – accounted for 14% of wind-power installation capacity coming online (Gearino, 2013). This figure stands in contrast to the claims of those that supported SB 310 and HB 483 that increase in renewable energy equate to declines in jobs, tax revenue, and countless other metrics of success. The politics of Texas and the state’s higher reliance on hydrocarbon generation should demonstrate that support for renewables is not a zero-sum game for traditional energy sources.
The average US wind farm has a potential of 300 MWs, with approximately 88 turbines or 3.4 MW per turbine spread across an average footprint of 7,338 acres. The actual footprint of these turbines, however, is in the range of 147-367 acres. Tower and turbine heights are generally 366 and 241 feet, respectively. These projects generate 0.89 jobs per MW and nearly 175,000 labor hours.
Thus, the potential of wind power from a tax revenue, employment, and energy independence standpoint is substantial but will only be realized if OH strengthens and diversifies renewable energy standards in Columbus.
Next in the Series
In the next part of this series we will look at the potential of woody biomass as an energy feedstock in OH.
References
- Downing, B., 2011. Wind turbines rise above flatlands of western Ohio, The Akron Beacon Journal, Akron, OH.
- Fernandez, M., Krauss, C., 2014. Boom Meets Bust in Texas: Atop Sea of Oil, Poverty Digs In, The New York Times, New York, NY.
- Flippen, A., 2014. Where Are the Hardest Places to Live in the U.S.?, The New York Times, New York, NY.
- Gearino, D. 2013. Wind-energy capacity swells in Ohio amid uncertainty, The Columbus Dispatch, Columbus, OH.
- Gearino, D., 2014. Renewable-energy backers tout support in Ohio poll, The Columbus Dispatch, Columbus, OH.
- Kowalski, K., 2014. Industry: Setback changes will end new wind farms in Ohio, Midwest Energy News.
- Lowrey, A., 2014. What’s the Matter With Eastern Kentucky?, The New York Times Magazine, New York, NY.
- Pelzer, J., 2014. Gov. John Kasich to act on proposal critics claim could kill Ohio’s wind energy industry, The Cleveland Plain Dealer. Northeast Ohio Media Group, Cleveland, OH.
Footnotes
- Most of HB 483 focuses on taxation and social programs with the one hydrocarbon provision doubling maximum penalties for gas pipeline violations removed by the Ohio House Finance Committee.
- According to Ohio’s Public Utilities Commission “At least 12.5 percent must be generated from renewable energy resources, including wind, hydro, biomass and at least 0.5 percent solar. The remainder can be generated from advanced energy resources, including nuclear, clean coal and certain types of fuel cells…at least one half of the renewable energy used must be generated…in Ohio.”
- Supporters include Honda, Whirlpool, Owens-Corning, Campbell Soup Co., and most of the big players in the alternative-energy sector.
- Ohio is at the vanguard of wind turbine component manufacturing with its thriving steel industry and more than 60 supply chain companies that would assuredly mushroom with a more robust RES. Ohio is home to 11% of the nations’ wind-related manufacturing facilities making it #1 in the nation.
- This is equivalent to 305,278 Ohioans, 18.07 million tons of CO2 or 950,012 Ohioans annual emissions.
- Note that the wind speed map includes measurements made at 50 meters in height, while OH turbines are typically installed at 80-100 m hub height, which “is the distance from the turbine platform to the rotor of an installed wind turbine and indicates how high your turbine stands above the ground, not including the length of the turbine blades. Commercial scale turbines (greater than 1MW) are typically installed at 80 m (262 ft.) or higher, while small-scale wind turbines (approximately 10kW) are installed on shorter towers.”
- Assuming the following claim from the American Wind Energy Association is true: “The water consumption savings from wind projects in Ohio total more than 248,000,000 gallons of water a year.”