One of the potentially troubling aspects of oil and gas development is that there are usually people who live in the vicinity of the wells. Pennsylvania now has over 8,000 active unconventional wells; there are any number of issues that can occur with these modern, industrial-scale sites, including road degradation, contaminated water, and health impacts, among others. In addition, there are over 93,000 of the smaller, conventional wells in operation throughout the Commonwealth. While these garner far less attention than their unconventional counterparts, they are also prone to producing similar impacts, not to mention that since many of them are older wells, they not only have potentially been subject to deterioration and occasional neglect, but were constructed during a period with less stringent requirements than are currently expected.
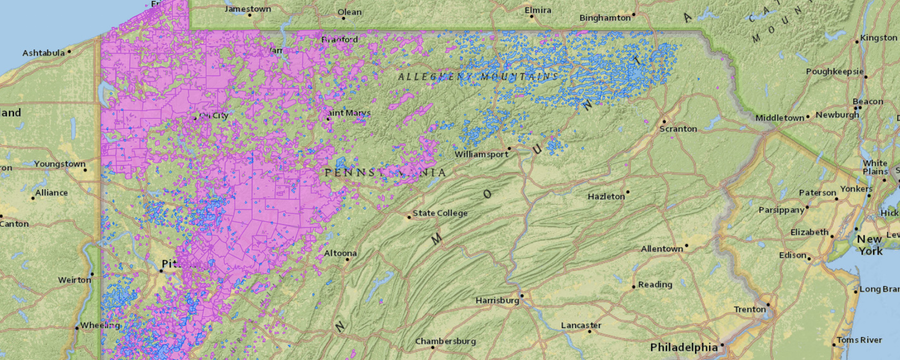
Petroleum engineers are now capable of drilling horizontally for tens of thousands of feet. For the most part, however, this technology is employed to maximize production, rather than to ameliorate impacts on people who live near the product. But who are these people? To help to answer this question, the FracTracker Alliance calculated the number of people living in a half-mile radius around active wells in the state.
More than 1.2 million Pennsylvanians live within the impact area.
Of the 93,754 wells that have been drilled in the state since 1950 that have not yet been plugged, the Pennsylvania DEP only has location data for 79,118 of them. All but one of the 14,636 missing locations are for wells that are categorized as Conventional. While one must presume that there is some overlap in coverage within the half-mile zone, the extent of this region – and therefore the population that lives within it – cannot be determined.
Fig. 1. PA Populations Near Oil and Gas Wells. Click here to access written description and additional map tools.
To maximize the reliability of our calculations, this map was created using a custom Albers equal-area projection centered on Pennsylvania. A half-mile buffer around each well type was created, and the resulting layer was clipped to Census tract data. The ratio of the smaller clipped area to the full Census tract area was calculated, and that ratio was then multiplied by the population totals from the 2010 Census to obtain our population estimates of the half-mile zone. The area in the study area is larger than six states, while the calculated population is larger than that of eight states.
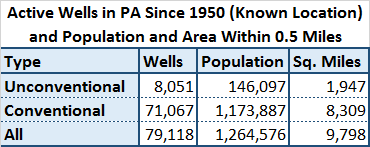
Fig. 2. Number of people in PA near oil and gas wells (79,118 active wells for which location data are available). Note that some regions are with a half-mile of both conventional and unconventional wells.
The county most impacted, in terms of area, for unconventional wells is Bradford, with 353 square miles (See Figure 2). Washington County had the most people living in the zone, however, with 20,566. For conventional wells, the drilling landscape is the largest in Indiana County, affecting 761 square miles, while Erie County has the most people in the half-mile zone, with 212,900. When considering all wells together, the numbers are almost identical to conventional wells. Indiana County leads with 762 square miles, while the drill zone in Erie County represents 211,903 people, or 76% of the county’s population in 2010.
https://www.fractracker.org/a5ej20sjfwe/wp-content/uploads/2014/10/PA-Wells-Feature.png400900Matt Kelso, BAhttps://www.fractracker.org/a5ej20sjfwe/wp-content/uploads/2025/09/2025-Wordmark-Logo.pngMatt Kelso, BA2014-10-30 11:23:432020-07-21 10:34:06Over 1.2 Million Pennsylvanians Within 1/2 Mile of a Well
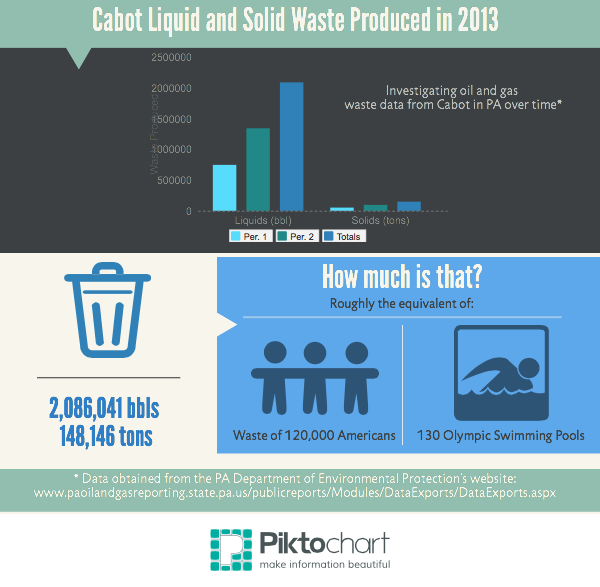
Seeing is believing, as the saying goes. Without physically observing the amount of waste generated from hydraulic fracturing of unconventional oil and gas wells, it is difficult to comprehend the volume and scope of the waste produced.
The Pennsylvania Department of Environmental Protection (PADEP) makes a considerable amount of waste production data publicly available, speaking to the quantities of fluids and solids produced by 25 oil and gas operators across 25 counties. This figure, however, is only about 40% of all of the operators according to StateImpactPA. Also, complete data is not available for the 25 companies that are included, but let’s dig into some waste data simply as an exercise.
Dig Into Basic Cabot Waste Statistics
In order to gain a sense for industry trends we decided to look at data pertaining to Cabot Oil and Gas Corporation, specifically, whose entire 2013 inventory of oil and gas wells were in Susquehanna County and the surrounding region. The first and second halves of 2013 contain fairly complete records for Cabot – such as well location, waste facility location, waste type, waste quantity, and disposal method. It is interesting to note that in the comments section, all but a few of the well permit sites read “Entire water fraction of waste stream recycled at a centralized treatment plant for reuse by Cabot,” even for drill cuttings that were taken to a landfill.
The following analysis focuses on the waste generated by 264 Cabot wells during this period. All of Cabot’s unconventional oil and gas wells in Pennsylvania during 2013 were in Susquehanna County and the surrounding region.
Waste Produced
In the first 6 months of 2013 (Period 1), liquid waste – consisting of produced fluid, servicing fluid, hydraulic fracturing fluid (frac fluid) waste, and drilling fluid waste – totaled 745,898 barrels (Bbl) or over 30,000,000 gallons. Solid waste – or drill cuttings – totaled 51,981 tons.1 To put this into perspective, 745,898 Bbls is equivalent to the water usage requirements of about 4 wells in West Virginia.2 The 51,981 tons of drill cuttings weighs about the same as the average amount of garbage produced by 65,029 Americans per year, or 1.5 times the population of Susquehanna County. The fluid waste is also enough to fill approximately 48 Olympic swimming pools.
Period 2 (July through December) of 2013, consisting of 319 reporting wells, experienced a 77% increase in liquid waste, climbing past the 1 million Bbl mark to 1,340,143 Bbl. This figure is the equivalent of filling almost 85 Olympic swimming pools. Similarly, drill cuttings increased to 96,165 tons, almost double the amount generated in Period 1. The total amount of waste generated by Cabot for the entire year yields more than 2 million Bbl of liquid waste and nearly 150,000 tons of solid waste from drill cuttings1 – more than 130 Olympic swimming pools worth of water and a weight of solid waste equivalent to the average waste generated by more than 120,000 American per year- over 2.8 times the population pf Susquehanna County (see infographic below).
Waste Composition
According to Cabot’s waste data, most of the liquid waste is made up of produced fluid,1 which is the saline water that returns to the surface as a byproduct of the drilling process. This fluid can be up to 10 times saltier than ocean water and can also be radioactive.3 Frac fluid waste3 contributed to the next largest amount of waste, followed by drilling fluid waste and servicing fluid. Produced fluid tripled from Period 1 to Period 2, while frac fluid waste remained fairly steady, and drilling fluid waste decreased slightly. However, the amount of servicing fluid waste generated between the first and second half of 2013 increased more than 12 times.1 Overall, the following increases were seen between Period 1 and Period 2 in 2013:
Fluid waste from hydraulic fracturing rose by nearly 80%
Solid waste rose by 85%
The number of unconventional oil and gas reporting wells only increased by about 20%, from 264 to 319.
Examining the data from FracFocus that is available for these reporting wells,4 it is interesting to note that the average true vertical depth of the wells decreased by about 100 feet between the two periods. Therefore, it is difficult to understand why the amount of drill cuttings increased by 85% in Period 2. Why is there such a large increase in both solid and liquid waste between these two periods when there was only a 20% increase in the number of wells? There are various theories that could result in such a dramatic increase in period 2 compared to the 6 months prior, including but not limited to:
The use of more liquids for the construction or drilling processes,
Longer lateral distances per horizontal well,
More lax operating procedures,
More detailed reporting by Cabot, and/or
Stricter reporting/enforcement by the PADEP.
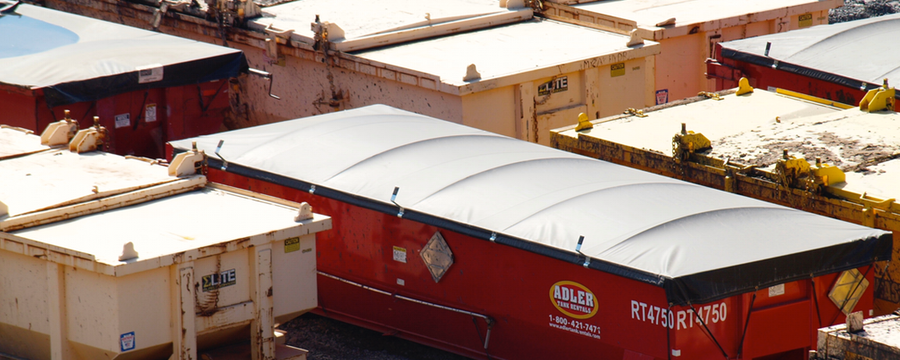
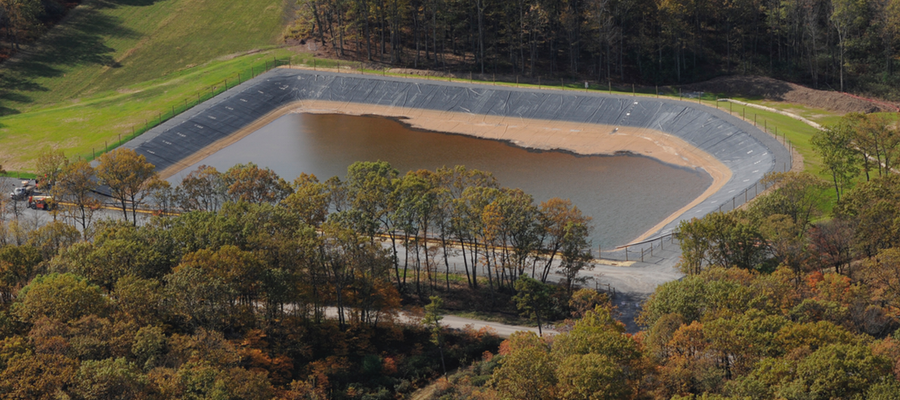
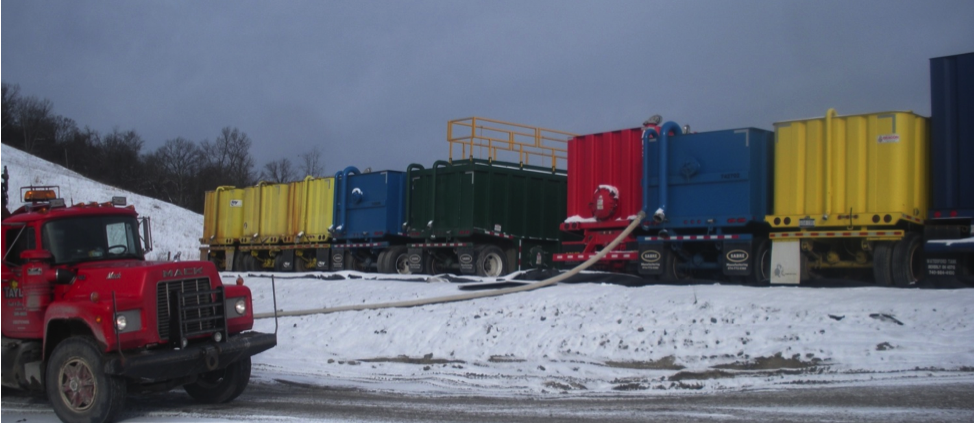
Waste Impoundment – Photo by Pete Stern 2013
Waste Produced Means Waste Transported
Although Cabot is responsible for producing large amounts of waste, they also are recycling their liquid waste (as is listed for every site in the Period 2 data). To do so, the company transports their waste to a centralized treatment plant. There, the water is filtered so that it can be mixed with more freshwater and chemicals and be reused at another well site. However, hauling so much fluid to the centralized treatment plant requires numerous trips by tanker trucks, as well as dump trucks and trailer trucks taking drill cuttings to landfills. Some treatment facilities for PA waste are located as far away as Ohio, West Virginia, and New York. Cabot trucks travelled approximately 114,000 miles5 in Period 1 of 2013, and over 1,122,000 miles were travelled in Period 2 of 2013. The total miles travelled to transport Cabot’s waste is equivalent to almost 50 times around the earth – for one company in one state, operating in only two counties.1
Additional Considerations
Further analysis should examine the air pollution and carbon footprint generated from such extensive traffic. The miles make a difference, considering that a highly efficient tractor trailor only gets ~10 miles per gallon.
While reusing the majority of liquid waste in an effort to reduce the amount of fresh water needed for hydraulic fracturing is a positive step, transporting recycling water by truck still results in fuel used, pollutants emitted, and traffic impacts.
Cabot Oil and Gas Corp. was the second largest unconventional shale gas producer in PA behind Chesapeake Appalachia LLC, which had more than 809 reporting wells in Period 2 of 2013. With a total of 62 companies operating in PA at this time,6 the cumulative effects of waste transportation undoubtedly add up. Serious efforts should be made on the part of all oil and gas companies to reduce their waste and provide accurate and timely waste reports.
https://www.fractracker.org/a5ej20sjfwe/wp-content/uploads/2014/10/Waste-Data-Feature.png400900FracTracker Alliancehttps://www.fractracker.org/a5ej20sjfwe/wp-content/uploads/2025/09/2025-Wordmark-Logo.pngFracTracker Alliance2014-10-22 12:26:262020-07-21 10:42:47Digging into Waste Data
FracTracker Alliance and the CREATE Lab at CMU are seeking volunteers to track oil trains on October 21st near Pittsburgh, PA for 2-hour segments from 7:00am – 7:00pm.
Sign up to participate (Link Deactivated, Archived Event)
Approximately 400,000 barrels of oil are transported daily from the west, following tracks from North Dakota’s Bakken Shale Play, which typically run through populated urban areas such as Pittsburgh. These trains have been known to derail and cause immense damage. The most recent of cases occurred in Québec in July of 2013, when a derailed train and the subsequent explosions resulted in the deaths of 47 people. The transportation of volatile crude oil from western states to major cities up and down the Eastern seaboard poses a major risk to any town or city through which these trains pass. FracTracker and affiliated groups want to understand the true risk that these volatile train cars pose to our region.
FracTracker and CREATE Lab will use the data collected during this project to analyze the frequency and risk of crude oil freight trains passing through the Pittsburgh area, but we need your help.
We are looking for volunteers that can commit to a two-hour shift throughout the day on October 21st. Volunteers will be equipped with a video camera, tripod, and of course coffee and snacks in order to record the passing of trains in either direction throughout a two-hour shift. The video footage will allow us to identify a plaque that is required to be displayed on cars carrying oil, as well as whether the cars are empty or full.
If you are interested in volunteering with FracTracker and this freight train project, follow the link above to sign up for a shift. Please do not hesitate to contact us with any questions or concerns at (412) 802-0273 or Malone@FracTracker.org. We hope to see you there!
About Us
FracTracker Alliance is a non-profit with an office in the Pittsburgh area whose mission is to share maps, data, and analyses to communicate impacts of the global oil and gas industry and to inform actions that positively shape our energy future. www.fractracker.org
The Community Robotics, Education and Technology Empowerment Lab (CREATE Lab) explores socially meaningful innovation and deployment of robotic technologies and is based out of Carnegie Mellon University. www.cmucreatelab.org
https://www.fractracker.org/a5ej20sjfwe/wp-content/uploads/2014/10/Train-Image.jpg400900FracTracker Alliancehttps://www.fractracker.org/a5ej20sjfwe/wp-content/uploads/2025/09/2025-Wordmark-Logo.pngFracTracker Alliance2014-10-15 15:21:272020-07-21 10:42:47Help Us to Track Oil Trains in Pittsburgh and Beyond
We recently received a request for unconventional (fracking) drilling data in Southwestern Pennsylvania counties and municipalities. Specifically, the resident wanted to know the following information:
Number of drilled wells in Southwestern PA counties, and in each municipality,
How many wells are producing natural gas in each municipality, and
The number of well violations reported there.
The following counties in Southwestern PA were studied (based on available electronic data): Allegheny, Armstrong, Beaver, Butler, Cambria, Fayette, Greene, Indiana, Somerset, Washington, and Westmoreland.
The well production data was compiled from a production report found on the Pennsylvania DEP Office of Oil and Gas website. This report detailed production values from unconventional gas wells statewide from January 2014 – June 2014. The well violation data was compiled using the Pennsylvania DEP Office of Oil and Gas’s interactive Oil and Gas Compliance report. From here, a compliance report was created using the following criteria: All PA regions, counties, and municipalities, all well operators, unconventional wells only, and wells inspected from 1/1/2000 – 9/9/2014.
Drilling Data Trends
Once all of the data was compiled, we created a spreadsheet that included a ratio of violations/wells for each municipality and county. Below are a few observations that stood out to us, followed by possible explanations for what has been reported.
Slightly less than 1/3 of all wells drilled in the 11 counties selected for this analysis have committed some sort of violation (.31).
The ratio of violations to wells drilled in Somerset County is 1.38, by far the largest ratio discovered. This means than more than one violation has been cited for every well drilled in that area, but that does not mean that every well carries with it a violation. The second largest ratio would be Cambria County at 1.00.
If you break down the numbers and look at municipality trends, the largest violation/wells ratio by municipality is found in Stewart Township, Fayette County (9.00). There have been 18 reported violations in association with the 2 wells drilled in the area.
Of the 60 municipalities that recorded no violations, South Buffalo Township in Armstrong County has the most wells drilled with 20.
Across the 11 counties studied, Allegheny County has the lowest ratio of violation/wells (.007).
Violations were reported in Somerset Township, Somerset County. No wells were drilled in this area, however.
Violations were reported in Wayne Township, Greene County, yet no wells were reported to be drilled in the municipality.
Explaining Some Data Caveats
Why is Allegheny County seeing such a low violation/well ratio?
Across the 11 counties studied, Allegheny County has the lowest ratio of violation/wells (.007).
Allegheny is the most populated county studied in Southwestern PA. Oil and gas drillers in the county, therefore, have the largest audience watching them. This may be encouraging the drillers to be more cautious or follow rules and regulations more strictly. Another possible explanation is that inspectors may be more lenient when reporting violations in in Allegheny County. Additionally, drillers operating primarily in Allegheny County may be are more likely to or are more capable of drilling according to the regulations. A final possibility is that Allegheny County is one of the last counties in this region to be heavily drilled, perhaps allowing for more best practices to be implemented on site compared to well pads established early on.
Violations With No Wells?
Violations were reported in Somerset Township, Somerset County. No wells were drilled in this area, however. These violations could have occurred when constructing the well pad. If construction has stopped at this site since the violation, there would not have been any wells drilled. Additionally, there may be an error in the dataset as to the actual location (e.g. county) of the well pad.
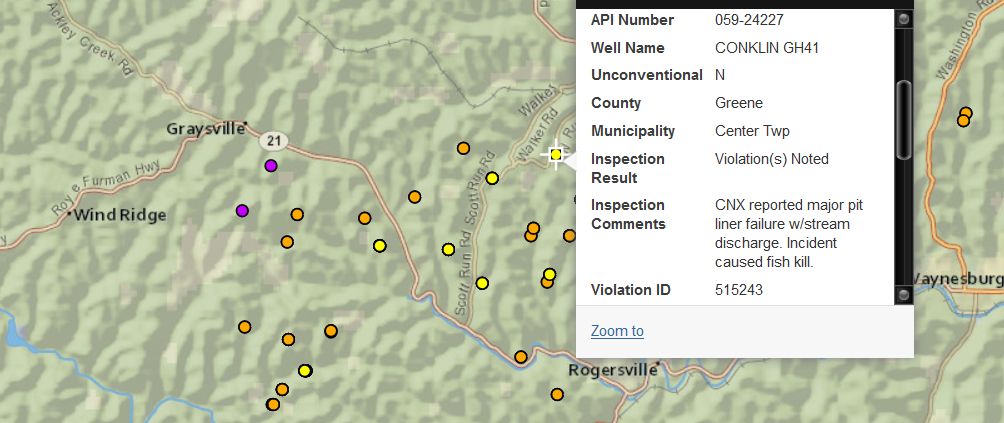
Violations were reported in Wayne Township, Greene County, yet no wells were reported to be drilled in the municipality. The PA DEP has informed FracTracker that these violations were actually reported for a well pad located in Center Township, Greene County. The entry for Wayne Township was a recording error on their part. Our data has been updated to reflect the proper number of violations reported in Center Township, as well as the removal of any activity in Wayne Township.
Download the Spreadsheet
The spreadsheet we supplied to this resident can be downloaded as a compliance report.
Updated PA Map
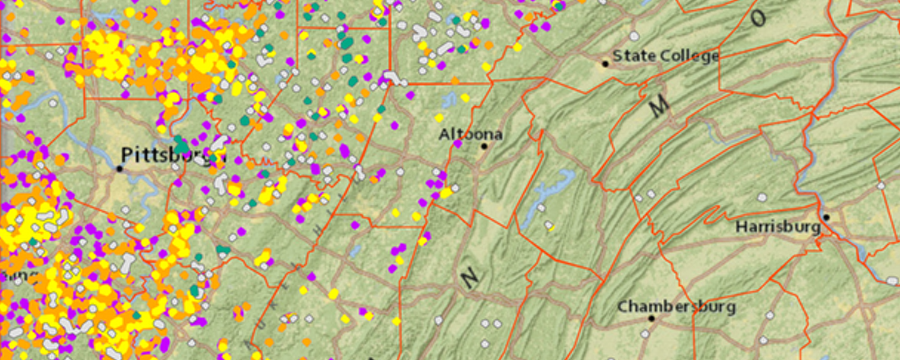
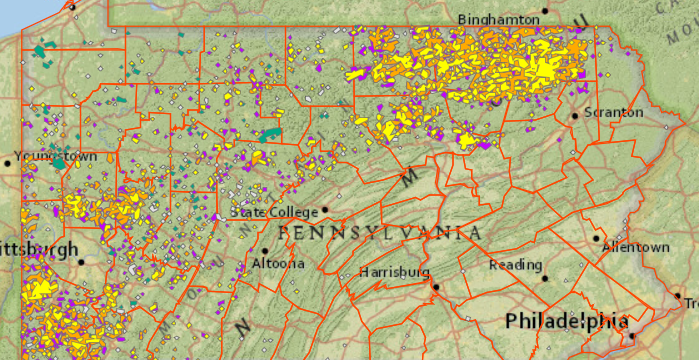
Explore our map of PA unconventional wells and violations by clicking on the map below:
Last updated: September 19, 2014
https://www.fractracker.org/a5ej20sjfwe/wp-content/uploads/2014/09/SWPA-Map.png400900FracTracker Alliancehttps://www.fractracker.org/a5ej20sjfwe/wp-content/uploads/2025/09/2025-Wordmark-Logo.pngFracTracker Alliance2014-09-22 16:06:592020-07-21 10:42:45Comparing Unconventional Drilling in Southwestern PA
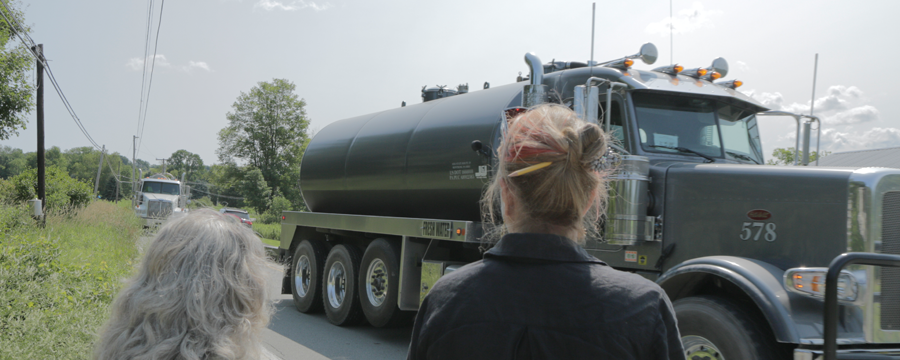
Part of the FracTracker Truck Counts Project By Mary Ellen Cassidy, Community Outreach Coordinator, FracTracker Alliance
I was recently invited by a community member to visit his home. It sits in a valley that is surrounded by drilling pads, as well as compressors and processing stations. While walking down the road that passes directly in front of his home, several caravans of gas trucks roared past and continued far into the evening. Our discussion about the unexpected barrage of this new invasion of intense truck traffic was frequently interrupted by the noise of the diesel engines passing nearby. Along with the noise, truck headlights pierced through the windows of the home, and dust flew up from the nearby road onto his garden.
There are many stories like this about homes and families impacted by the increased truck traffic associated with fracking-related activities. FracTracker is currently working with some of these communities to document the intensity of gas and oil trucks travelling their roads. In response to these concerns we have a launched a pilot Truck Counts project to provide support, resources, and networking opportunities to communities struggling with high volume gas truck traffic.
Preliminary Results
Volunteers in PA, WV, OH and WI have already started to participate in the project, with some interesting results, photos, observations, and suggestions.
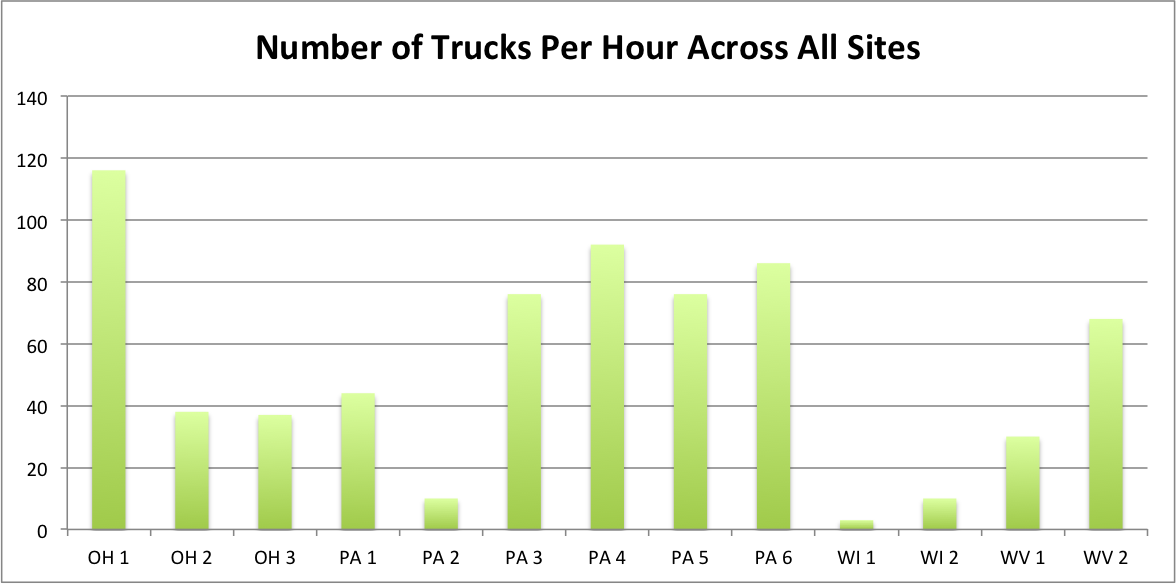
To-date, truck counts have varied significantly, as to be expected. Some of the sites where we chose to count passing trucks were very close to drilling activity, and some were more remote. While developing the counting protocol, we often included large equipment and tanker trucks, as well as gas company personnel vehicles (as indicated by white pickup trucks and company logos on the side). While the data vary, the spikes in truck counts do tell the story of a bigger and broader issue – the influx of heavy equipment during certain stages of drilling can be a significant burden on the local community. In total, we counted 676 trucks over 13 sites The average number of trucks that passed by per hour was 44, with a high of 116 an hour, and a low of 5.
About the Project
FracTracker Truck Counts partners with communities to: help identify issues of concern related to high volume gas truck traffic; collect data, photos, videos and narratives related to gas truck traffic; and analyze and share results through shared database and mapping options.
What motivates volunteers to join us in our Truck Counts program? Community concerns include dust, diesel exhaust, spills, accidents, along with other health and safety issues, as well as the cost and inconvenience of deteriorating road conditions resulting from the increased weights and numbers of vehicles. So, what do we already know about the extent of the damages caused by heavy truck traffic?
Public Safety
Several studies have found that shale gas development is strongly linked to increased traffic accidents and that the increases cannot be attributed only to more trucks and people on the road.
Unlike gas truck traffic issues from past oil and gas booms, this recent shale gas boom impacts traffic and public safety in many different ways. The hydraulic fracturing process requires 2,300 to 4,000 truck trips per well, where older drilling techniques needed one-third to one-half as many trips. Another difference is the speed of development that often far outpaces the capacity of communities to build better roads, bridges, install more traffic signals or hire extra traffic officers. Some experts explain increased truck traffic related accidents by pointing to regulatory loopholes such as federal rules that govern how long truckers can stay on the road being less stringent for drivers in the oil and gas industry. Others note that out of state drivers in charge of large heavy duty loads are not always accustomed to the regional weather patterns or the winding, narrow and hilly country roads that they travel.
An Associated Press analysis of traffic deaths in six drilling states shows that in some counties, fatalities have more than quadrupled since 2004 when most other American roads have become much safer in that period (even with growing populations). Marvin Odum, who runs Royal Dutch Shell’s exploration operations in the Americas, said that deadly crashes are “recognized as one of the key risk areas of the business”. Along with the community, gas truck drivers themselves are at risk. According to a study by the National Institute for Occupational Safety and Health, vehicle crashes are the single biggest cause of fatalities to oil and gas workers. The AP study finds that:
In North Dakota drilling counties, the population has soared 43% over the last decade, while traffic fatalities increased 350%. Roads in those counties were nearly twice as deadly per mile driven than the rest of the state
From 2009-2013-
Traffic fatalities in West Virginia’s most heavily drilled counties…rose 42%. Traffic deaths in the rest of the state declined 8%.
In 21 Texas counties where drilling has recently expanded, deaths/100,000 people are up an average of 18 % while for the rest of Texas, they are down by 20%.
Traffic fatalities in Pennsylvania drilling counties rose 4%, while in the rest of the state they fell 19 %.
New Mexico’s traffic fatalities fell 29%, except in drilling counties, where they only fell 5%.
A separate analysis by Environment America using data from the Upper Great Plans Institute finds that – “While the expanding oil industry in North Dakota has produced many benefits, the expansion has also resulted in an increase in traffic, especially heavy truck traffic. This traffic has contributed to a number of crashes, some of which have resulted in serious injuries and fatalities.” In the Bakken Shale oil region of North Dakota, the number of highway crashes increased by 68% between 2006 and 2010, with the share of crashes involving heavy trucks also increasing over that period.”1
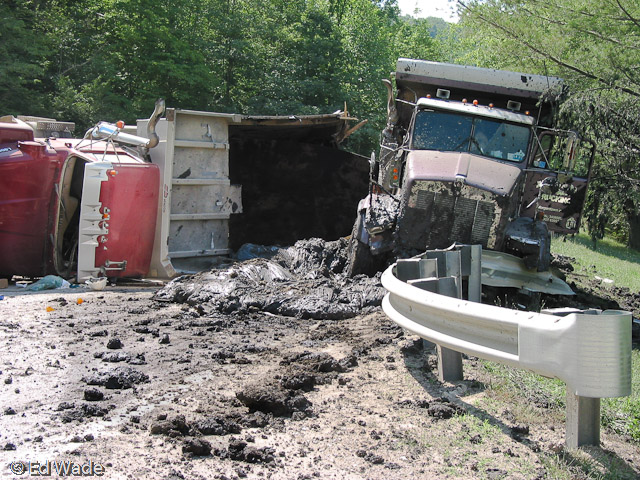
Truck accident and spill in WV. Wetzel County Action Group photo, copyright of Ed Wade, Jr.
Public health concerns do not end with traffic accidents and fatalities. An additional cost of heavy gas truck traffic is the strain it places on emergency service personnel. A 2011 survey by State Impact Pennsylvania in eight counties found that:
Emergency services in heavily drilled counties face a troubling paradox: Even though their population has fallen in recent years, 911 call activity has spiked — by as high as 46 percent, in one case.” Along with the demands placed on emergency responders from the number of increased calls, it also takes extra time to locate the accidents since many calls are coming from transient drivers who “don’t know which road or township they are in.
In Bradford County, a heavily drilled area, increased traffic has delayed the response times of emergency vehicles. According to an article in The Daily Review, firefighters and emergency response teams are delayed due to the increased number of accidents, gas trucks breaking down, and gas trucks running out of fuel (some companies only allow refueling once a night).
Road Deterioration and Regional Costs
Roadway degradation from truck traffic. Wetzel County Action Group photo, copyright of Ed Wade, Jr.
An additional cost often passed on to the impacted communities is infrastructure maintenance. In an article from Business Week, Lynne Irwin, director of Cornell University’s local roads program in Ithaca, New York, states, “Measures to ensure that roads are repaired don’t capture the full cost of damage, potentially leaving taxpayers with the bill.”
This Food and Water Watch Report calculated the financial burden imposed on rural counties by traffic accidents alone, estimating that if the heavy truck accident rate in fracked counties had matched those untouched by the boom, $28 million would have been saved.2
Garrett County is currently struggling with anticipating potential gas traffic and road costs. The Garrett County Shale Gas Advisory Committee uses recent studies from RESI ‘s New York and Pennsylvania data to project gas truck traffic for 6 wells/pad at 22,848 trips/pad and 91,392 total truck trips the first year with increasing numbers for the next 10 years. Like many counties, Garrett County also faces the issue that weights and road use are covered by State, not County code. There is a possibility, however, that the County could determine best “routes” for the trucks. (This is a prime example of the need and benefit for truck counts.)
Although truck companies and contractors pay permit fees, often they are either insufficient to cover costs or are not accessible to impacted counties. The Texas Tribune reports, “The Senate unanimously passed a joint resolution which would ask voters to approve spending $5.7 billion from the state’s Rainy Day Fund, including $2.9 billion for transportation debt. But little, if any, of that money is likely to go toward repairing roads in areas hit hardest by the drilling boom.”
Commenting on the argument that gas companies already pay their fair share for road damages they cause, George Neal posts calculations on the Damascus Citizens for Sustainability website that lead him to conclude that, although “the average truck pays around 27 times the fuel taxes an average car pays… according to the Texas Department of Transportation, they do 8,000 times the damage per mile driven and drive 8 times as far each year.”
The funds needed to fill the gap between the costs of road repairs and the amount actually paid by the oil and gas companies must come from somewhere. According to a draft report from the New York Department of Transportation looking at potential Marcellus Shale development costs, “The annual costs to undertake these transportation projects are estimated to range from $90 to $156 million for State roads and from $121-$222 million for local roads. There is no mechanism in place allowing State and local governments to absorb these additional transportation costs without major impacts to other programs and other municipalities in the State.”
Poor Air Quality
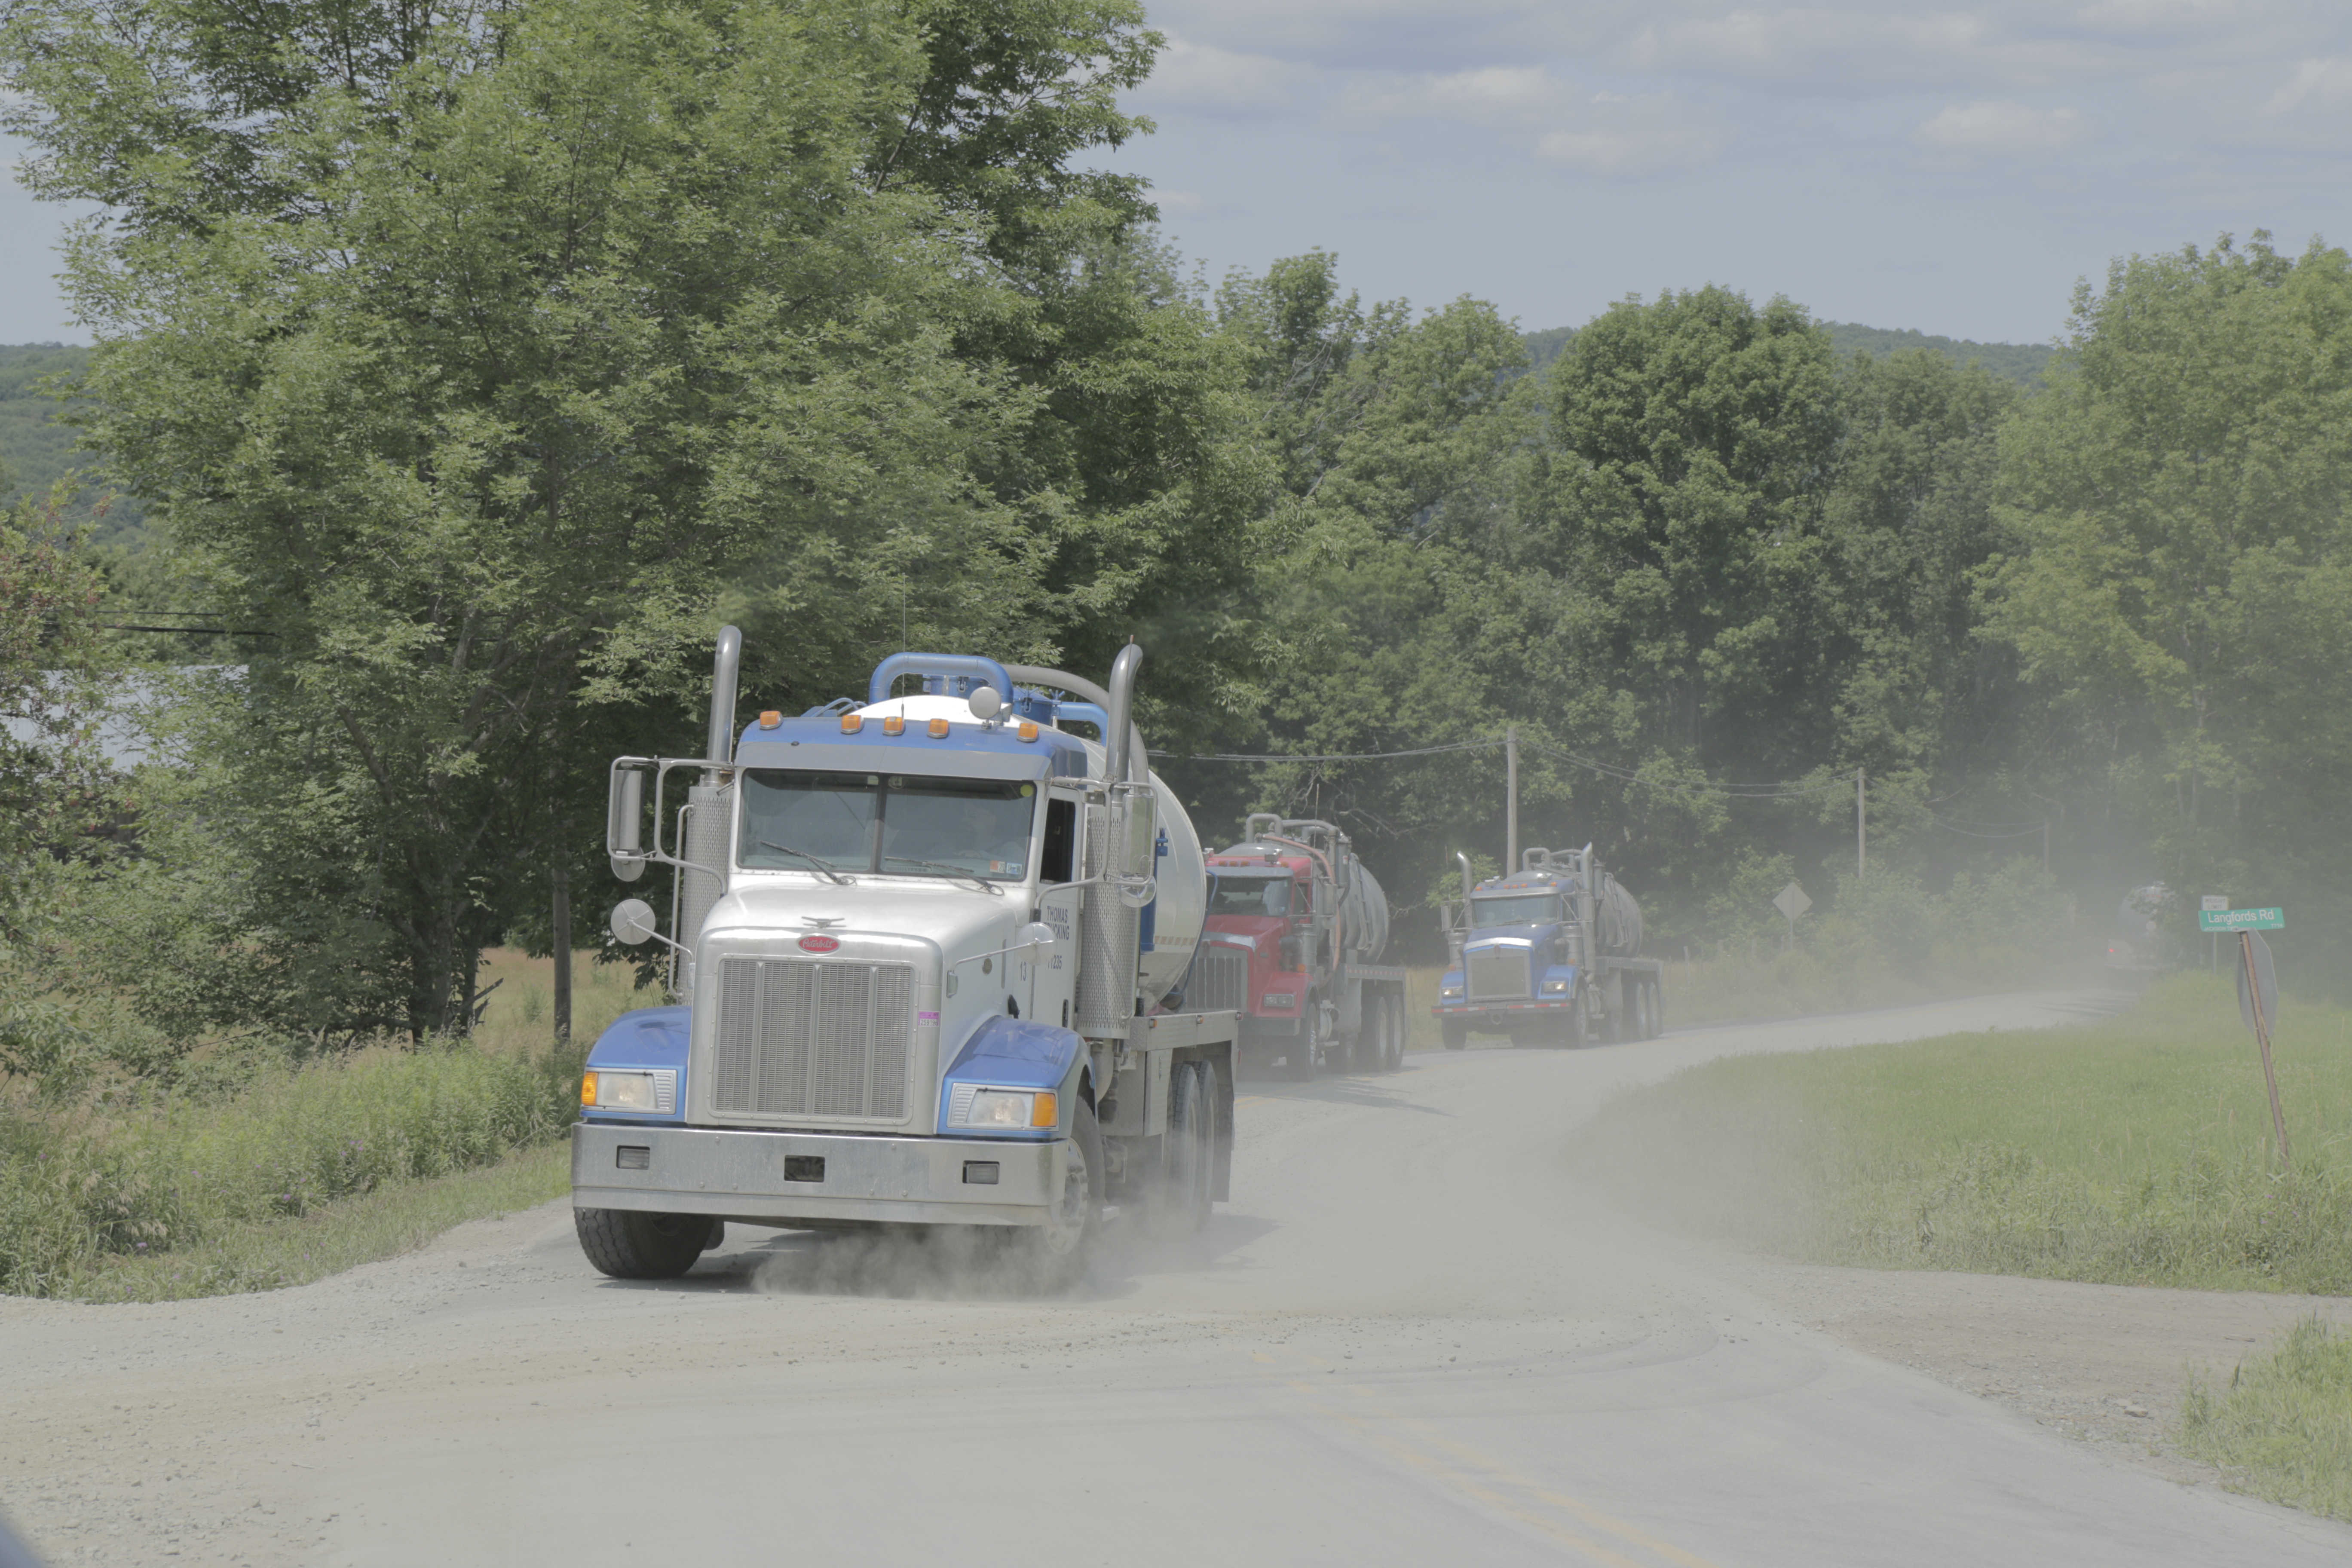
Caravan of trucks. Photo by Savanna Lenker, 2014.
Along with public safety and infrastructure costs, increased truck traffic associated with unconventional oil and gas extraction is found to be a major contributor to public health costs due to elevated ozone and particulate matter levels from increased emissions of heavy truck traffic and the refining and processing activities required.
In addition to ozone and particulate matter in the air, chemicals used for extraction and development also pose a serious risk. A recent study in the journal of Human and Ecological Health Assessment found that 37% of the chemicals used in drilling operations are volatile and could become airborne. Of those chemicals, more than 89% can cause damage to the eyes, skin, sensory, organs, respiratory and gastrointestinal tracts, or the liver, and 81% can cause harm to the brain and nervous system. Because these chemicals can vaporize, they can enter the body not only through inhalation, but also absorption through the skin.
The Union of Concerned Scientists note that air pollution from traffic may be worsened in North Dakota by the use of unpaved roads that incorporate gravel containing a fibrous mineral called erionite, which has properties similar to asbestos. Trucks driving over such gravel roads can release harmful dust plumes into the air, which could present health risks for workers and area residents
To address and solve these problems associated with heavy truck traffic, information is needed to assess both qualitatively and quantitatively the scope of the increased truck traffic and its impacts on communities. Collection and analysis of data, as well as community input, are needed to both understand the scope of the problem and to inform effective solutions.
Joining FracTracker’s Truck Counts
In response to community concerns about the impacts of increased truck traffic in their community, FracTracker has developed the Truck Count project to document the intensity of oil and gas traffic in your region, map heavy traffic locations, and offer networking opportunities for impacted communities.
Participation in FracTracker’s Truck Counts can provide grassroots organizations with a valuable opportunity to collect local data, engage volunteers, and educate stakeholders and the public. The data, pictures and narratives collected can be used to support concerned citizens’ efforts to reroute traffic from schools, playgrounds and other sensitive areas; to inform decision makers, public health researchers, and transportation agencies; to serve as a potential launching point for more detailed, targeted studies on public health and safety along with economic development analyses; to compare costs and benefits of oil and gas energy sources to the cost and benefits of energy conservation, efficiency and renewable energy.
Also, by sharing your community’s counts and stories on FracTracker.org, you serve other communities by increasing the awareness of the impacts of oil and gas truck traffic nationwide.
FracTracker’s Truck Counts provides the following resources to conduct the counts:
information and education on gas and oil truck identification,
data sheets for easy counting, and
tips for selecting safe and accessible counting locations in your community.
We look forward to working with you and supporting your community. If you are interested in working on this important crowdsourcing project with us, please contact:
In addition, a 2013 study from Resources for the Future found that shale gas development is linked to traffic accidents in Pennsylvania with a significant increase in the number of total accidents and accidents involving a heavy truck in counties with a relatively large degree of shale gas development as compared to counties with less (or no) development.
The 2013 Food and Water Watch Report finds similar correlations. Shale gas drilling was associated with higher incidents of traffic accidents in Pennsylvania. This trend was strongest in counties with the highest density of fracking wells. The decrease in the average annual number of total vehicle crashes was 39% larger in unfracked rural counties than in heavily fracked counties. (analysis based on data from US Census Bureau, PA DEP and PennDOT).
In a recent Karnes County, Texas analysis “Traffic accidents and fatalities have skyrocketed in the shale boom areas….with an increases of 1,000% in commercial motor vehicle accidents from 2008-2011.
According to a 2013 Texas Public Threat Safety Report, “In the three Eagle Ford Shale counties where drilling is most active, the number of crashes involving commercial vehicles rose 470 percent between 2009 and 2011. In the 17 counties that make up the Permian Basin, fatal car crashes involving commercial vehicles have nearly tripled from 14 in 2010 to 41 in 2012.
As a result of heavily using of publicly available infrastructure and services, fracking imposes both immediate and long-term costs on taxpayers. An Environment Texas study reveals that, “Trucks required to deliver water to a single fracking well cause as much damage to roads as 3.5 million car journeys, putting massive stress on roadways and bridges not constructed to handle such volumes of heavy traffic. Pennsylvania estimates that repairing roads affected by Marcellus Shale drilling would cost $265 million”.
Researchers from the RAND Corporation and Carnegie Mellon University looked at the design life and reconstruction cost of roadways in the Marcellus Shale formation in Pennsylvania. Their findings in Estimating the Consumptive Use Costs of Shale Natural Gas Extraction on Pennsylvania Roadways, note that local roads are generally designed to support passenger vehicles, not heavy trucks, and that “the useful life of a roadway is directly related to the frequency and weight of truck traffic using the roadway.” The study’s findings include:
“The estimated road-reconstruction costs associated with a single horizontal well range from $13,000 to $23,000. However, Pennsylvania often negotiates with drilling companies to rebuild smaller roads that are visibly damaged, so the researchers’ conservative estimate of uncompensated roadway damage is $5,000 and $10,000 per well.
While the per-well figure of $5,000-$10,000 appears small, the increasingly large number of wells being drilled means that substantial costs fall on the state: “Because there were more than 1,700 horizontal wells drilled [in Pennsylvania] in 2011, the statewide range of consumptive road costs for that year was between $8.5 and $39 million,” costs paid by state transportation authorities, and thus taxpayers.”
The feature photo at the top of the page was taken by Savanna Lenker, 2014.
https://www.fractracker.org/a5ej20sjfwe/wp-content/uploads/2014/09/TruckCounts.png400900FracTracker Alliancehttps://www.fractracker.org/a5ej20sjfwe/wp-content/uploads/2025/09/2025-Wordmark-Logo.pngFracTracker Alliance2014-09-11 15:18:072020-07-21 10:42:44Here They Come Again! The Impacts of Oil and Gas Truck Traffic
State Senator Joseph Scarnati III, from north-central Pennsylvania, has introduced a bill that would redefine the distinction between conventional and unconventional oil and gas wells throughout the state. In Section 1 of the bill, the sponsors try to establish the purpose of the legislation, making the case that:
Conventional oil and gas development has a benign impact on the Commonwealth
Many of the wells currently classified as conventional are developed by small businesses
Oil and gas regulations, “must permit the optimal development of oil and gas resources,” as well as protect the citizens and environment.
Previous legislation already does, and should, treat conventional and unconventional wells differently
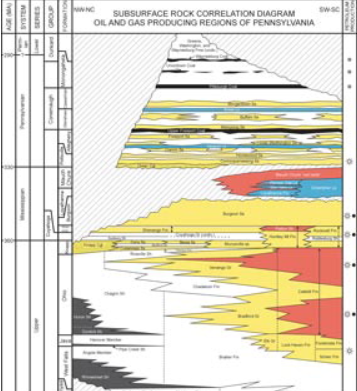
This diagram shows geologic stata in Pennsylvania. The Elk Group is between the Huron and Rhinestreet shale deposits from the Upper Devonian period. Click on the image to see the full version. Source: DCNR
Certainly, robust debate surrounds each of these points, but they are introductory in nature, not the meat and potatoes of Senate Bill 1378. What this bill does is re-categorize some of the state’s unconventional wells to the less restrictive conventional category, including:
All oil wells
All natural gas wells not drilled in shale formations
All shale wells above (shallower than) the base of the Elk Group or equivalent
All shale wells below the Elk Group from a formation that can be economically drilled without the use of hydraulic fracturing or multi-lateral bore holes
All wells drilled into any formation where the purpose is not production, including waste disposal and other injection wells
The current distinction is in fact muddled, with one DEP source indicating that the difference is entirely due to whether or not the formation being drilled into is above or below the Elk Group, and another DEP source indicates that the difference is much more nuanced, and really depends on whether the volumes of hydraulic fracturing fluid required to profitably drill into a given formation are generally high or low.
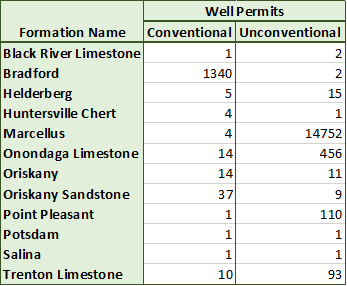
This table shows the number of distinct wells in each producing formation in Pennsylvania that has both conventional and unconventional wells drilled into it. Data source: DEP, downloaded 7/9/2014.
As one might expect, this ambiguity is represented in the data. The chart at the left shows the number of distinct number of wells by formation, for each producing formation that has both conventional and unconventional wells in the dataset. Certainly, there could be some data entry errors involved, as the vast majority of Bradford wells are conventional, and almost all of the Marcellus wells are unconventional. But there seems to be some real confusion with regards to the Oriskany, for example, which is not only deeper than the Elk Group, but the Marcellus formation as well.
While an adjustment to the distinction of conventional and unconventional wells in Pennsylvania is called for, one wonders if the definitions proposed in SB 1378 is the right way to handle it. If the idea of separating the two is based on the relative impact of the drilling operation, then a much more straightforward metric might be useful, such as providing a cutoff in the amount of hydraulic fracturing fluid used to drill a well. Further, each of the five parts of the proposed definition serve to make the definition of unconventional wells less inclusive, meaning that additional wells would be subject to the less stringent regulations, and that the state would collect less money from the impact fees that were a part of Act 13 of 2012.
Instead, it is worth checking to see whether the definition of unconventional is inclusive enough. In May of this year, FracTracker posted a blog about conventional wells that were drilled horizontally in Pennsylvania.
Conventional, non-vertical wells in Pennsylvania. Please click the expanding arrows icon at the top-right corner to access the legend and other map controls. Please zoom in to access data for each location.
These wells require large amounts of hydraulic fracturing fluids, and are already being drilled at depths of only 3,000 feet, and could go as shallow as 1,000 feet. It’s pretty easy to argue that due to the shallow nature of the wells, and the close proximity to drinking water aquifers, these wells are deserving of even more rigorous scrutiny than those drilled into the Marcellus Shale, which generally ranges from 5,000 to 9,000 feet deep throughout the state.
A summary of the different regulations regarding conventional and unconventional wells can be found from PennFuture. In general, unconventional wells must be further away from water sources and structures than their conventional counterparts, and the radius of presumptive liability for the contamination of water supplies is 2,500 feet instead of 1,000.
SB 1378 has been re-referred to the Appropriations Committee.
https://www.fractracker.org/a5ej20sjfwe/wp-content/uploads/2014/07/formations_ConUnc_07092014.png286347Matt Kelso, BAhttps://www.fractracker.org/a5ej20sjfwe/wp-content/uploads/2025/09/2025-Wordmark-Logo.pngMatt Kelso, BA2014-07-09 15:04:362020-07-21 10:42:41What’s in PA Senate Bill 1378?
By Brook Lenker, Executive Director, FracTracker Alliance
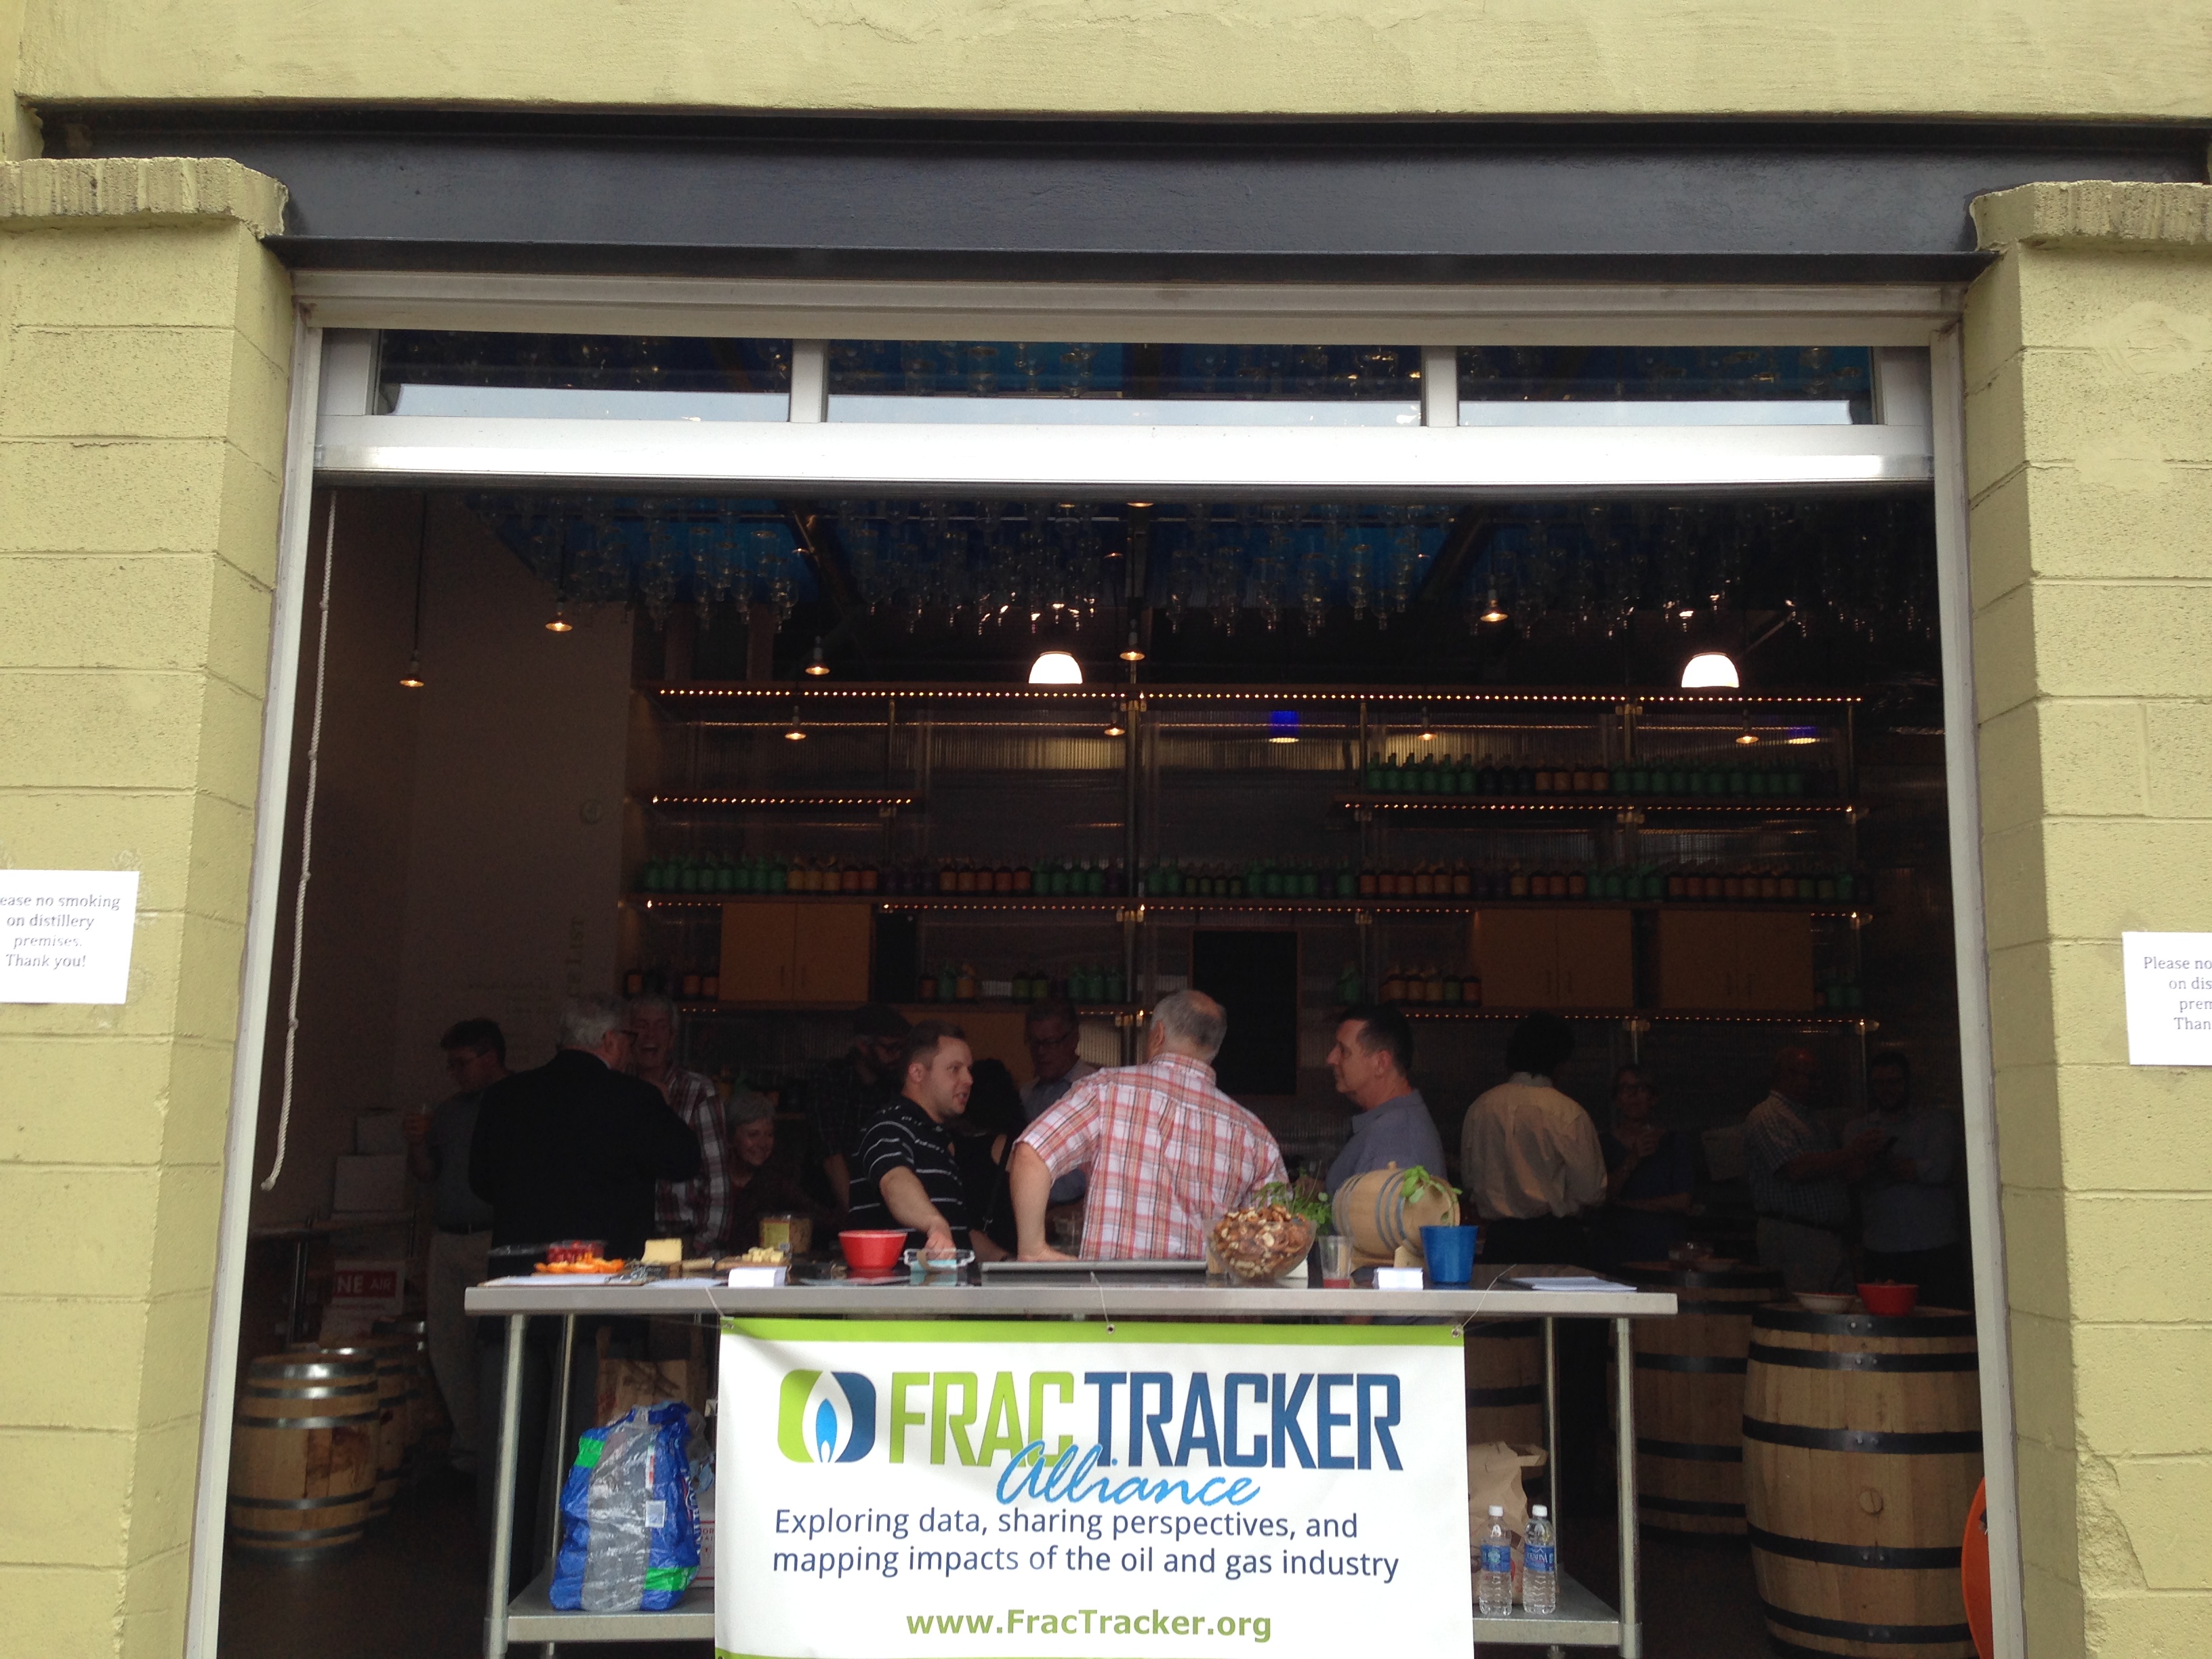
Enjoying some whiskey in Pittsburgh
It’s almost July, but just a few weeks ago, FracTracker wrapped up the last of three fundraising events. From a site in San Francisco overlooking the Pacific to a budding distillery in Pittsburgh’s Strip District, friends and colleagues came together to show their support for our work and their concern about the effects of unconventional drilling. If you were able to join us for these events – whatever the motivation, we appreciated your collective, deliberate act of kindness. Thank you!
The gatherings were generally small but lots of fun – full of conversation, positive energy, and, yes, good spirits. At the Cleveland Heights event, we even had live music thanks to the jazzy guitar of Alan Brooks and at all three venues a colorful exhibit of thought-provoking, conversation-stoking maps entitled “Cartography on Canvas.” These events were our first foray into fundraisers. From the experience they’ll be improved and made even more memorable, unique, extraordinary. That’s our goal.
We aim to entice more attendees, enhance our revenue, and, most importantly, grow the network of the informed – not just informed about the activities of FracTracker but of all the groups, efforts, and learnings related to the impacts of extreme hydrocarbon extraction. Soon, another round of events – guaranteed to be mood improving, mind expanding affairs – will be rolled out. Prepare to mark your calendars, join the fun, and make your own social statement!
A special thank you goes out to FracTracker staff, interns, and board members who put in extra time and effort to help ensure the success of these initial fundraisers. Thank you, too, to our incredible door prize and auction item contributors:
https://www.fractracker.org/a5ej20sjfwe/wp-content/uploads/2014/06/IMG_6508.jpg15001500FracTracker Alliancehttps://www.fractracker.org/a5ej20sjfwe/wp-content/uploads/2025/09/2025-Wordmark-Logo.pngFracTracker Alliance2014-06-30 11:08:202020-07-21 10:42:28Putting the “Fun” in Fundraisers
By Karen Edelstein, NY Program Coordinator, FracTracker Alliance
Background
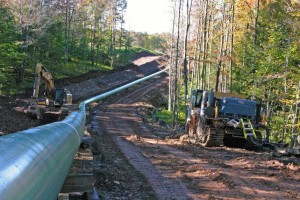
Over the past month and a half, a new pipeline controversy has been stirring in Pennsylvania. The proposed $2 billion “Central Penn Pipeline” will be built to carry shale gas throughout the country. Starting in Susquehanna County, the 178 mile pipeline will run through Lebanon and Lancaster counties to connect the existing Tennessee Pipeline in the north with the Transco Pipeline in the south.
Oklahoma-based Williams Partners, the company proposing the pipeline, says that the project would help move gas from PA to locations as far south as Georgia and Alabama, in addition to adding relief from higher energy bills. The “Atlantic Sunrise Project,” as it is formally known, would also require the construction of two new 30,000 horse-power compressor stations: “Station 605” along the northern leg of the pipeline in Susquehanna County, as well as “Station 610” on the southern part of the pipeline. The northern part of the proposed pipeline will be 30 inches in diameter and run for about 56 miles; the southern portion will be 42 inches in diameter and about 122 miles long.
According to the US Energy Information Agency (EIA), in 2008, PA had over 8,700 miles of pipeline. Since then, that figure has increased significantly as the shale plays in PA continue to be exploited. Industry maintains that pipelines are the safest method for moving gas from the well to market, and has noted that for safety concerns they have intentionally co-located 36% of the northern part of the pipeline within the rights-of-way of Transco’s or other utility’s pipelines.
Despite the sanguine view of this project by industry, residents have rallied against the pipeline since mid-April, when landowners started getting information packets in the mail about the proposal.
Pipeline Proposal Map
While the exact route of the pipeline has yet to be determined, FracTracker has adapted documents from Oklahoma-based Williams Partners Company to provide this interactive map below. The proposed pipeline is shown in red.
For a full-screen version of this map (with legend), click here.
Proposal Concerns
Public awareness and concern about the pipeline continues to build, as was evident when 1,100 residents attended an open house in Millersville, PA on June 10th hosted by Williams. For more information see this article in Lancaster Online.
The Lancaster County Conservancy has advocated moving the pipeline away from various sensitive habitats including the Tucquan Glen Nature Preserve, Shenk’s Ferry Wildflower Preserve, Fishing Creek, Kelly’s Run, and Rock Springs to preserve the wildlife and beauty of those areas. According to Williams:
The pipeline company must evaluate a number of environmental factors, including potential impacts on residents, threatened and endangered species, wetlands, water bodies, groundwater, fish, vegetation, wildlife, cultural resources, geology, soils, land use, air and noise quality… More
Despite what the website says, Williams admitted to not analyzing the pipeline route for possible sensitive habitat encroachment, and instead, they will simply follow the existing utility routes.
Williams, according to a report by WGAL Channel 8 in PA “relies on the communities affected to bring up any potential problems.” His statement was backed up when residents in a packed hearing room in Lancaster County voiced their opposition, resulting in Williams Partners now considering extending their pipeline by 2 ½ miles to get around the sensitive natural area at Tucquan Glen. An alternate route to avoid Shenk’s Ferry, however, had not been put forward.
Lancaster Farmland Trust is concerned about the plan for the pipeline to pass through several protected farms, and Lebanon County Commissioner Jo Ellen Litz has also taken a strong stand against the current proposed route. The proposed pipeline would not only go through farmlands, but it is also expected to cross the Appalachian Trail, Swatara State Park, and Lebanon Valley Rails to Trails.
Pipeline impacts are not limited to conservation and agriculture. There is increasing concern that the risks posed by large-diameter, high pressure pipelines such as this one may prevent nearby homeowners from keeping their mortgage loans or homeowner’s insurance. Future purchasers of the property may also encounter difficulty being approved for a mortgage loan or homeowner’s insurance.
While the pipeline company can purchase pipeline easements from property owners, industry can also petition the government to take the land by eminent domain from unwilling property owners. Pipeline rights-of-way acquired through eminent domain for these pipelines could potentially complicate a private property owner’s mortgage financing and homeowner’s insurance.
The final decisions about the siting of the pipeline is ultimately up to FERC, the Federal Energy Regulatory Commission.
Resources
Williams’ original maps of the pipelines can be viewed here: SOUTH | NORTH
https://www.fractracker.org/a5ej20sjfwe/wp-content/uploads/2014/06/5550c-Pipeline-Marc-1-e1403196615466.jpg200300Karen Edelsteinhttps://www.fractracker.org/a5ej20sjfwe/wp-content/uploads/2025/09/2025-Wordmark-Logo.pngKaren Edelstein2014-06-20 10:17:192020-07-21 10:42:27Central Penn Pipeline Under Debate
Like most states, the data from the Pennsylvania Department of Environmental Protection do not explicitly tell you which wells have been hydraulically fractured. They do, however, designate some wells as unconventional, a definition based largely on the depth of the target formation:
An unconventional gas well is a well that is drilled into an Unconventional formation, which is defined as a geologic shale formation below the base of the Elk Sandstone or its geologic equivalent where natural gas generally cannot be produced except by horizontal or vertical well bores stimulated by hydraulic fracturing.
Naturally occurring karst in Cumberland County, PA. Photo by Randy Conger, via USGS.
While Pennsylvania has been producing oil and gas since before the Civil War, the arrival of unconventional techniques has brought greater media scrutiny, and at length, tougher regulations for Marcellus Shale and other deep wells. We know, however, that some companies are increasingly looking at using the combination of horizontal drilling and hydraulic fracturing in much shallower formations, which could be of greater concern to those reliant upon well water than wells drilled into deeper unconventional formations, such as the Marcellus Shale. The chance of methane or fluid migration through karst or other natural fissures in the underground rock formations increase as the distance between the hydraulic fracturing activity and groundwater sources decrease, but the new standards for unconventional wells in the state don’t apply.
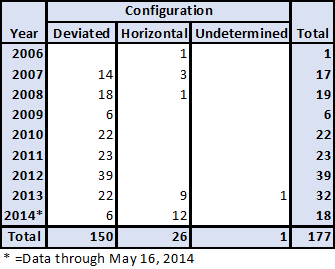
The following chart summarizes data for wells through May 16, 2014 that are not drilled vertically, but that are considered to be conventional, based on depth:
These wells are listed as conventional, but are not drilled vertically.
Note that there have already been more horizontal wells in this group drilled in 2014 than any previous year, showing that the trend is increasing sharply.
Of the 26 horizontal wells, 12 are considered oil wells, five are gas wells, five are storage wells, three are combination oil and gas, and one is an injection well. These 177 wells have been issued a total of 97 violations, which is a violation per well ratio of 62 percent. 429 permits in have been issued in Pennsylvania to date for non-vertical wells classified as conventional. Greene county has the largest number of horizontal conventional wells, with eight, followed by Bradford (5) and Butler (4) counties.
We can also take a look at this data in a map view:
Conventional, non-vertical wells in Pennsylvania. Please click the expanding arrows icon at the top-right corner to access the legend and other map controls. Please zoom in to access data for each location.
https://www.fractracker.org/a5ej20sjfwe/wp-content/uploads/2014/05/PA_CNV_BlogFeature.png5151004Matt Kelso, BAhttps://www.fractracker.org/a5ej20sjfwe/wp-content/uploads/2025/09/2025-Wordmark-Logo.pngMatt Kelso, BA2014-05-19 16:10:222020-07-21 10:42:26Conventional, Non-Vertical Wells in PA
Water Resource Reporting and Water Footprint from Marcellus Shale Development in West Virginia and Pennsylvania
Report and summary by Meghan Betcher and Evan Hansen, Downstream Strategies; and Dustin Mulvaney, San Jose State University
The use of hydraulic fracturing for natural gas extraction has greatly increased in recent years in the Marcellus Shale. Since the beginning of this shale gas boom, water resources have been a key concern; however, many questions have yet to be answered with a comprehensive analysis. Some of these questions include:
What are sources of water?
How much water is used?
What happens to this water following injection into wells?
With so many unanswered questions, we took on the task of using publically available data to perform a life cycle analysis of water used for hydraulic fracturing in West Virginia and Pennsylvania.
Summary of Findings
Some of our interesting findings are summarized below:
In West Virginia, approximately 5 million gallons of fluid are injected per fractured well, and in Pennsylvania approximately 4.3 million gallons of fluid are injected per fractured well.
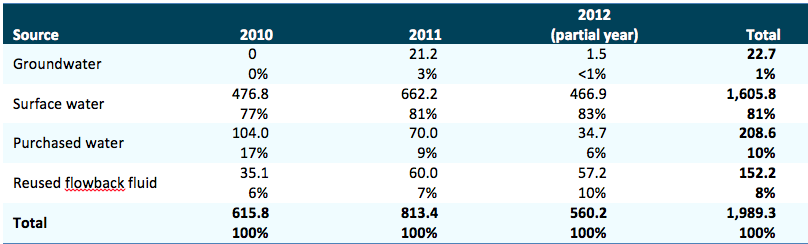
Surface water taken directly from rivers and streams makes up over 80% of the water used in hydraulic fracturing in West Virginia, which is by far the largest source of water for operators. Because most water used in Marcellus operations is withdrawn from surface waters, withdrawals can result in dewatering and severe impacts on small streams and aquatic life.
Most of the water pumped underground—92% in West Virginia and 94% in Pennsylvania—remains there, lost from the hydrologic cycle.
Reused flowback fluid accounts for approximately 8% of water used in West Virginia wells.
Approximately one-third of waste generated in Pennsylvania is reused at other wells.
As Marcellus development has expanded, waste generation has increased. In Pennsylvania, operators reported a total of 613 million gallons of waste, which is approximately a 70% increase in waste generated between 2010 and 2011.
Currently, the three-state region—West Virginia, Pennsylvania, and Ohio—is tightly connected in terms of waste disposal. Almost one-half of flowback fluid recovered in West Virginia is transported out of state. Between 2010 and 2012, 22% of recovered flowback fluid from West Virginia was sent to Pennsylvania, primarily to be reused in other Marcellus operations, and 21% was sent to Ohio, primarily for disposal via underground injection control (UIC) wells. From 2009 through 2011, approximately 5% of total Pennsylvania Marcellus waste was sent to UIC wells in Ohio.
The blue water footprint for hydraulic fracturing represents the volume of water required to produce a given unit of energy—in this case one thousand cubic feet of gas. To produce one thousand cubic feet of gas, West Virginia wells require 1-3 million gallons of water and Pennsylvania wells required 3-4 million gallons of water.
Table 1. Reported water withdrawals for Marcellus wells in West Virginia (million gallons, % of total withdrawals, 2010-2012)
Source: WVDEP (2013a). Note: Surface water includes lakes, ponds, streams, and rivers. The dataset does not specify whether purchased water originates from surface or groundwater. As of August 14, 2013, the Frac Water Reporting Database did not contain any well sites with a withdrawal “begin date” later than October 17, 2012. Given that operators have one year to report to this database, the 2012 data are likely very incomplete.
As expected, we found that the volumes of water used to fracture Marcellus Shale gas wells are substantial, and the quantities of waste generated are significant. While a considerable amount of flowback fluid is now being reused and recycled, the data suggest that it displaces only a small percentage of freshwater withdrawals. West Virginia and Pennsylvania are generally water-rich states, but these findings indicate that extensive hydraulic fracturing operations could have significant impacts on water resources in more arid areas of the country.
While West Virginia and Pennsylvania have recently taken steps to improve data collection and reporting related to gas development, critical gaps persist that prevent researchers, policymakers, and the public from attaining a detailed picture of trends. Given this, it can be assumed that much more water is being withdrawn and more waste is being generated than is reported to state regulatory agencies.
Data Gaps Identified
We encountered numerous data gaps and challenges during our analysis:
All data are self-reported by well operators, and quality assurance and quality control measures by the regulatory agencies are not always thorough.
In West Virginia, operators are only required to report flowback fluid waste volumes. In Pennsylvania, operators are required to report all waste fluid that returns to the surface. Therefore in Pennsylvania, flowback fluid comprises only 38% of the total waste which means that in West Virginia, approximately 62% of their waste is not reported, leaving its fate a mystery.
The Pennsylvania waste disposal database indicates waste volumes that were reused, but it is not possible to determine exactly the origin of this reused fluid.
In West Virginia, withdrawal volumes are reported by well site rather than by the individual well, which makes tracking water from withdrawal location, to well, to waste disposal site very difficult.
Much of the data reported is not publically available in a format that allows researchers to search and compare results across the database. Many operators report injection volumes to FracFocus; however, searching in FracFocus is cumbersome – as it only allows a user to view records for one well at a time in PDF format. Completion reports, required by the Pennsylvania Department of Environmental Protection (PADEP), contain information on water withdrawals but are only available in hard copy at PADEP offices.
In short, the true scale of water impacts can still only be estimated. There needs to be considerable improvements in industry reporting, data collection and sharing, and regulatory enforcement to ensure the data are accurate. The challenge of appropriately handling a growing volume of waste to avoid environmental harm will continue to loom large unless such steps are taken.
https://www.fractracker.org/a5ej20sjfwe/wp-content/uploads/2014/04/GasWellWaterWithdrawals.png732975FracTracker Alliancehttps://www.fractracker.org/a5ej20sjfwe/wp-content/uploads/2025/09/2025-Wordmark-Logo.pngFracTracker Alliance2014-04-04 09:31:062020-07-21 10:42:24Water Use in WV and PA


 The use of hydraulic fracturing for natural gas extraction has greatly increased in recent years in the Marcellus Shale. Since the beginning of this shale gas boom, water resources have been a key concern; however, many questions have yet to be answered with a comprehensive analysis. Some of these questions include: