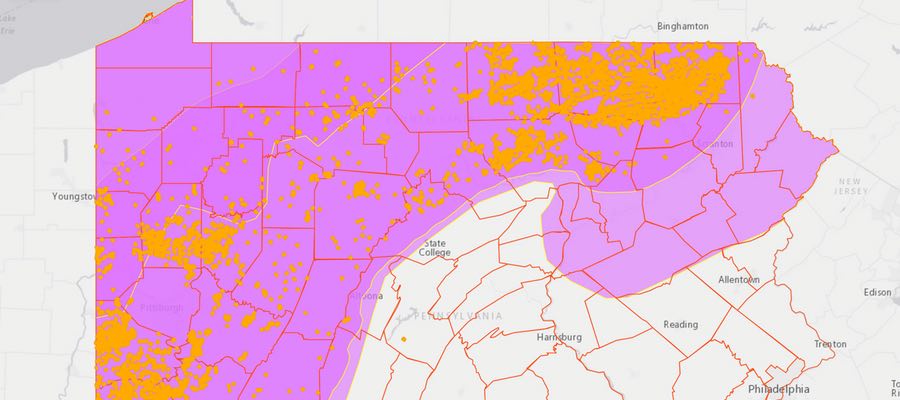
Pennsylvania’s Drake Well is known for sparking the first oil boom in the United States in 1859. In more recent history, the industry has resurrected hydrocarbon extraction in the Commonwealth through unconventional oil and gas drilling – or fracking. Between 2002 and October 28, 2015, at least 16,826 of these high-impact wells have been approved statewide, and 9,508 drilled.
While standard maps can be useful to show the reach of the industry in aggregate, they aren’t the best way to show how drilling activity has changed over time. Luckily, we have other tools in the toolbox to show the trend. See drilling by year in this time sequence map below.
PA Unconventional Drilling Time Sequence Map
This representation starts slowly, just as the industry did in the state. Activity begins to pick up around 2008. In later years, watch exploration expand throughout the Marcellus and Utica shale plays. Eventually the activity concentrates in the northeastern and southwestern portions in the state.
https://www.fractracker.org/a5ej20sjfwe/wp-content/uploads/2015/11/PAViewer-Feature.jpg400900Matt Kelso, BAhttps://www.fractracker.org/a5ej20sjfwe/wp-content/uploads/2025/09/2025-Wordmark-Logo.pngMatt Kelso, BA2015-11-05 17:03:292020-03-12 17:37:38Time Sequence Map of PA Drilling Available
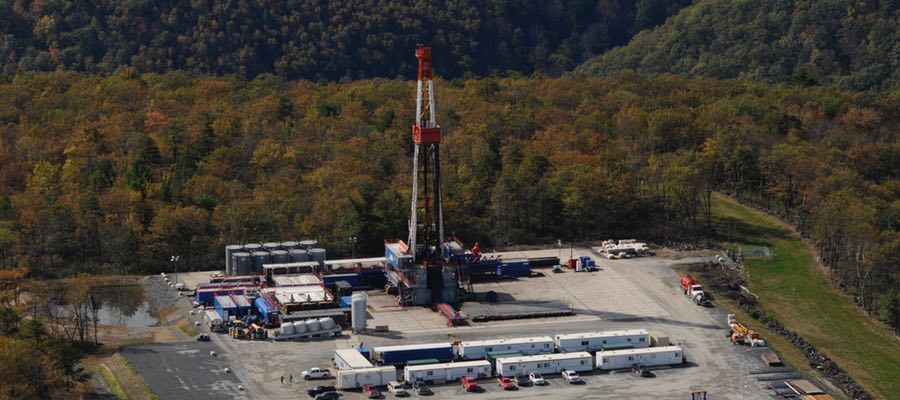
PA DCNR recently released a draft State Forest Resource Management Plan. The draft plan, last revised in 2007, is an important tool that the Bureau of Forestry (BOF) uses to help manage Pennsylvania’s approximately 2.2 million acre state forest system. Approximately 1.5 million acres of state forest lands lie within the shale gas fairway and gas extraction – along with related issues like water resources – is among the numerous subjects addressed in the document.
In total, approximately 673,000 acres are available for oil and gas development in PA state forests, either because private interests own the mineral rights below the land or because DCNR has opened up state-lands for drilling where it controls the mineral rights.
Approximately 386,000 acres have been leased by DCNR to allow drilling. DCNR’s shale gas monitoring report in 2014 said that only 16% of available state forest lands have been developed, which means that 84% (or 328,700 acres) could still be accessed for oil and gas through DCNR leases. Another 287,000 acres of state forest land sits atop private mineral rights. Mineral rights supersede – or overrule – those of the surface rights.
By some estimates, the projected “drillout” of state forest lands may include an additional 2,000 to 3,000 unconventional natural gas wells. There are concerns that the draft plan also does not adequately address the full scale and scope of such drilling and the serious impacts associated with it.
Derived from available data, FracTracker has prepared the following portrait of the projected impact to Pennsylvania’s state forest estate with emphasis on the resource-intensive nature of hydraulic fracturing and its extensive footprint on this sensitive landscape.
Table 1. Projected land use needed to add 2,000 to 3,000 more wells on PA state forestlands
Facility Type
Unit
Projected Drilled Wells
2,000
3,000
Well Pads
#
606
909
Acres
2,477
3,716
Limit Of Disturbance (LOD)*
Acres
7,130
10,695
Gathering Lines
Acres
20,189
30,284
Addtl. Mid/Down-stream Facilities
Acres
2,847
4,271
Compressor Stations**
#
126-210
189-316
Acres
2,978-4,976
4,466-7,464
ESTIMATED TOTAL
Acres
36,621
54,931
*Limit of Disturbance includes infrastructure, mounded earth, etc. needed to access and service the well pads. **1 compressor station is needed for every 25-30 miles of gathering lines, at 15-30 acres per station.
In Ohio, well pads average 4-5 acres, 3.4 laterals per well pad, and 8.5 acres of gathering line per acre of well pad. However, each pad has what we are calling a “Limit of Disturbance,” which includes infrastructure, mounded earth, etc. LOD likely represents a conservative estimate of miscellaneous land disturbance as it does not include the access roads; it was not possible with our current datasets to discern which roads were specifically added to access the well pads. LODs are averaging 10-14 acres.
Using the 2,000-3,000 wells proposed, the total acreage that could be disturbed by new well pads, well pad LODs, gathering lines, compressor stations, and related mid/downstream facilities in PA’s state forests would be between and 36,621 and 54,931 acres depending on the number and size of compressor stations (i.e., averaging 24 acres) (Table 1).
Water Use
Table 2. Projected resource use and waste produced per well based on OH, WV, and PA historical figures.
Variable
Unit
Avg
Increase / Quarter
Water Needed
Gallons
3.5 MGs
–
PA Stats
Gallons
4.4 MGs
–
OH Stats*
Gallons
6.2-7.0 MGs
405-410 K
WV Stats
Gallons
7.9 MGs
450 K
Drill Cuttings**
Tons
1,050
4.96
OH Stats
Tons
700+ (estimate)
4.7-5.2
PA Stats
Tons
1,400
–
Landfill Waste (Drilling Muds)
Tons / Facility
28,098
15,319
Silica Sand
Tons
4,303
86
Injection Waste
Gallons / Quarter
117 MGs
5.4 MGs
* 7-9% of injected fluids returns to the surface as fracking waste ** significantly dependent upon lateral length
https://www.fractracker.org/a5ej20sjfwe/wp-content/uploads/2015/10/Forest-PA-Feature.jpg400900FracTracker Alliancehttps://www.fractracker.org/a5ej20sjfwe/wp-content/uploads/2025/09/2025-Wordmark-Logo.pngFracTracker Alliance2015-11-04 10:40:372020-03-12 13:44:21The Ultimate Price of PA State Forest Drilling
Kirk Jalbert, FracTracker’s Manager of Community Based Research & Engagement, interviews Dorina Hippauf, one of FracTracker’s 2015 Community Sentinels Award Winners.
Dorina Hippauf is the Chair of the Research Committee for the Gas Drilling Awareness Coalition (GDAC) of Luzerne County, Pennsylvania, and a contributing member of the Shale Justice Coalition. When a landman came knocking on her door in 2010, offering riches in exchange for a gas lease, Dory took the old saying of “if it sounds too good to be true, it probably isn’t” to heart. This was the starting point that led to her dedicated exploration of the industry’s practices and the creation of the Shale Players project, which now contains over 10,000 entries of who is connected to who in the industry. Dorina is one of three recipients of the 2015 FracTracker Community Sentinels Award. Here we talk with Dory about her work to connect the dots between board rooms, lobbyists, PR firms, astroturf organizations, and government agencies that promote the agendas of the gas industry.
Q: Dorina, perhaps we can begin by your telling me a bit about what brought you to advocacy work related to oil and gas development?
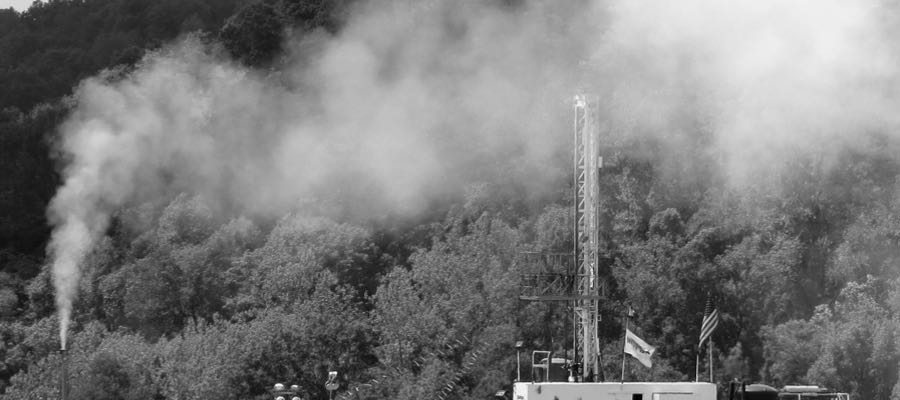
Dorina: What got me into the whole issue of gas drilling was, one, when I was driving to work, I would see flares on hillsides and I didn’t really understand what was going on. You know, there were big, large flames and my first thought was, something is on fire. Then I realized that from the way it was flaming, it was contained. But I still didn’t know what was going on. And then we had a land man come knock on our door and start offering us a lease. And we only have three quarters of an acre. Originally he was offering $1,000 an acre and when we said we only have three quarters of an acre, he dropped the price to $750. Everything just didn’t sound right. So I started doing some online investigating. I came across the GDAC, which is a local grassroots group in our area. I started attending meetings and I got involved from there.
The big driller here that was signing everybody up was Encana, which is of course based out of Canada. They did three test wells in our area. All three came up dry. Basically we are right at the edge of the productive end of the Marcellus Shale. Encana, shortly after they finished up the last test well, released everybody from their leases and left town in 2011. But I remained active with GDAC because I realized they have to get the gas to market. We’re located along the Transcontinental Pipeline, an ideal place for them to connect to gas hubs for gathering lines. So I knew the whole issue of gas drilling wasn’t going to be over with just Encana leaving our area.
Q: I know that one of the projects that you were instrumental in founding was the Shale Players project. Tell me more about that project, how it began, and what its status is presently?
A: I was at a GDAC meeting and somebody was talking about Encana and the question was asked, who is Encana? So I started Googling them and getting some information and this lead to other connections and I realized that just jotting things down on a piece of paper wasn’t going to give the whole picture. A lot of these companies are all interconnected one way or the other. I created this spreadsheet that grew into the Shale Players project. I have lists of the executives that work at these companies, the Board of Directors, politicians that are connected to them, other front groups, trade agencies, Astroturf, PR firms, and lobbying groups. It has grown to over 10,000 entries now.
Dorina explains Shale Players in her video “Connecting the Dots”
Q: How have you disseminated your findings and what are some of the results that you have seen come from this research?
A: Anyone who wants it, I give it to them. It’s also online on Google Docs. What I hope to do eventually is find someone that is able to put this into a format so it’s searchable online. So that when you type in somebody’s name or a company, it shows all of those connections. I update the online version every three or four months. As for what we’ve done with the results, the Public Accountability Initiative used it when they did their expose on Pennsylvania and gas drilling. Walter Brasch also cited a lot of my work in his book Fracking Pennsylvania. Other groups are using it because they go looking for information on a company that they may be dealing with.
Q: You also do a fair amount of blogging too, correct?
A: Yes, my blog is Frackorporation. When I blog, I usually try to show the connections to the genealogy of some of these organizations to give people a better idea of who they are really dealing with. So many people are looking for a single villain to blame. But it’s all interconnected. And that’s what I’m trying to show people, that this is more than just drilling and fracking and dealing with one company, it also extends to the whole issue of lobbying, the citizen united decision, and with unlimited donations to candidates. A lot of money gets passed around. Alec is involved, the Koch brothers are involved. A lot of big names.
Q: How do you think your work has made a difference in the public’s understanding of the political and economic landscape of the gas industry?
A: Well, to some extent, it discourages people because they see how large and involved it is. But on the other hand, it also makes them angry and they realize that you have to deal with this issue on a lot of different levels, both in terms of environmental impact, getting the community involved, and that its important to get involved politically. Also, it helps them to determine who to contact if they want to write a letter to a company. Too often we will just send it to the spokesperson who is just reading a script, but that is not whose attention you want to get. Also, the shareholders, they often don’t realize what the company is really doing. If you own one share of a company, you can go to their meetings and make a lot of noise.
Q: So this really is about building community and not just about collecting data. This relates to another project you are involved in called the Shale Justice Coalition. Can you tell me more about the Coalition?
A: The Shale Justice Coalition is a coalition of grassroots groups. Our overall objective is to stop the practice of fracking and to promote alternative energy as a better option. We have members in four or five in the states now as well as some from England and Ireland. Lots of information gets passed around as a result of the coalition — things that are going on in Ohio that we may not know about, things that are going on in New York — we try to share the information, get people interested and make them more aware of the bigger picture of the industry. Many of these groups will get a hold of me personally and ask me to write up a blog post about what is going on in their area. The media is not paying attention. With the Seneca Lake gas storage project there was some emails that were uncovered where Crestwood was telling its employees to boycott all businesses in the towns surrounding the lake that opposed the storage facility. Local groups had tried to get it to reporters who put it on the back burner and didn’t follow-up. I blogged about it, then it got picked up on social media, then the papers finally picked it up. Yeah, I mean, sometimes you have to rattle the cages.
Q: How has this work changed your perspective on the role of making information and data available to the public, in terms of making for better environmental protection?
A: It’s important to get this information out there, to make it readily accessible, easy for people to find and to use. I always thought when I first started this, that I could find one website where I could do a search on companies specifically for fracking and gas and oil drilling. But there wasn’t any. So in a way, with the Shale Players project, I’ve had to fill that niche. Also, a lot of the information I tend to find online I don’t know where they got their information. I take great pains to make sure whatever I put out there has the source link to it, so people can go and look for it themselves.
Q: So what is next for you Dory? What kind of new projects are you planning?
A: At the moment we are fighting the pipelines. I’ve been going around doing presentations at the request of organizations. Talking about what is going on with FERC and how the FERC process works. Letting people know what they need to be aware of the easement agreements and that they do have to negotiate. Just saying “no” to the easement and taking it to the point of imminent domain, if that is the course the company takes, isn’t enough. You have to show good faith and some attempt at negotiating an easement. Otherwise, when you go before the judge, he’s going to side with the company. Unfortunately, I think with these pipelines, unless we get more action from people, these pipelines are going to go through.
Truth-Out.org article by Dorina Hippauf and Ellen Cantarow
Q: Is there anything that you would communicate to other people and groups that are trying to get off the ground to deal with issues related to oil and gas?
A: Yes. One of the biggest things I keep hearing from people is that, when we have meetings or presentations or newspaper articles or whatever, we are only preaching to the choir. But what these groups have to realize is that the choir is growing. Every pipeline and every gas well sparks a new group of concerned people. So, the choir is growing and people are listening. It does get discouraging. It feels like you are losing at Whack-a-Mole. You are not going to get your cookies right now. And there is no one magic bullet that is going to fix everything. You have to deal with FERC, you have to deal with DEP, you have to deal with the government agencies that are involved. You have to consider who your legislators are. And you just can’t get discouraged. Take a break, stay off the computer for a week, recharge your batteries, and get back into it. You are in it for the long haul and you have to be able to make that commitment.
Q: Do you have any concluding thoughts for our readers?
A: People need to get local and be vocal. Tip O’Neil said, all politics are local and that is where it’s going to start. It’s like that movie, Groundswell. That’s grassroots. It starts from the bottom up to make real change. You can’t look at the federal government to fix it for you and the state government isn’t going to fix it either. You have to start locally and building the momentum there. And don’t give up.
https://www.fractracker.org/a5ej20sjfwe/wp-content/uploads/2015/04/Fracking-Most-Wanted-Feature1.jpg400900FracTracker Alliancehttps://www.fractracker.org/a5ej20sjfwe/wp-content/uploads/2025/09/2025-Wordmark-Logo.pngFracTracker Alliance2015-10-19 15:47:092020-03-12 13:45:26Interview with Dorina Hippauf – Sentinel Award Winner
By Matt Kelso, Manager of Data & Technology
Kirk Jalbert, Manager of Community Based Research & Engagement
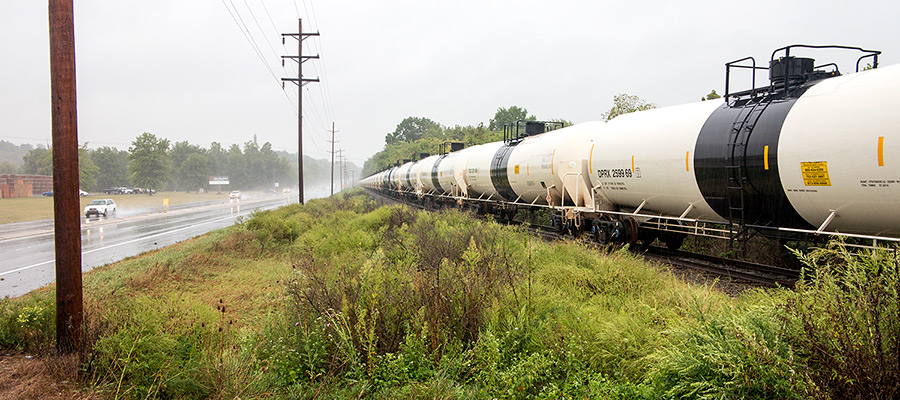
The Risks of Crude Oil Trains
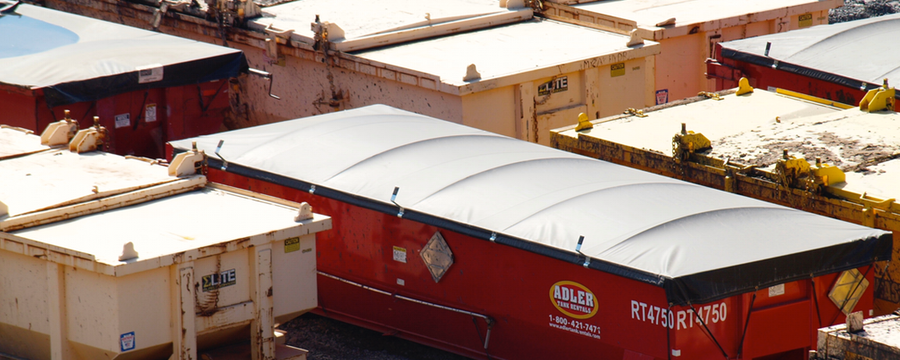
As new oil fields boomed across North America in recent years, drillers looked for ways to get the product to refineries thousands of miles away. One solution was to use the nation’s rail infrastructure to ship hundreds of thousands of barrels of crude oil per day. The flow of oil was so great that thousands of additional tanker cars were ordered to get the oil to market. And yet, this solution of transporting crude by rail brought additional problems. Shipping large quantities of highly volatile and combustible crude oil on often antiquated rail lines has resulted in numerous accidents, at times spectacular in scale. In recent months, however, thousands of these oil tankers have been sitting idle on the tracks around the country, partially due to dropping oil prices, leading refineries to opt for cheaper imported oil and less expensive ways to get the domestic product to market such as through pipelines.
Communities Along the Tracks
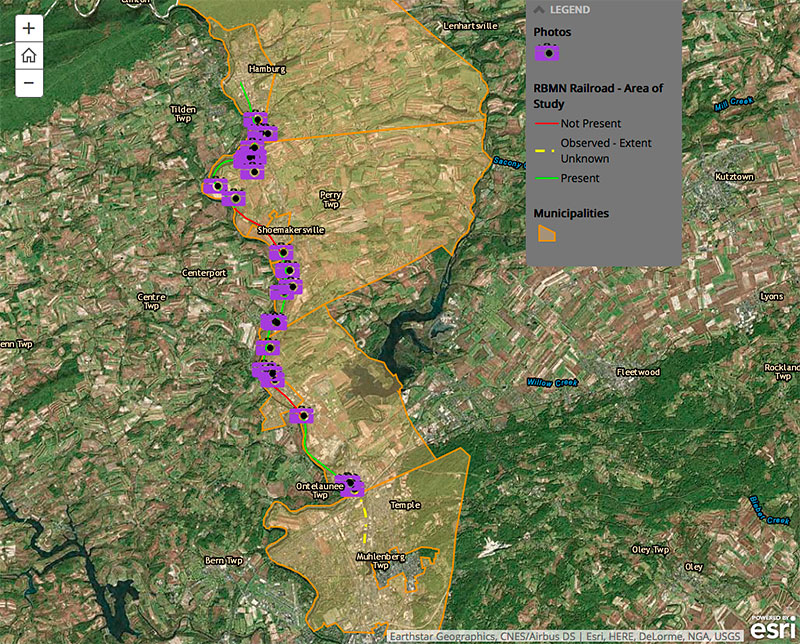
The interactive story map below investigates a stretch of oil trains that have been parked for months in close proximity to homes, schools, and busy intersections in Berks County, Pennsylvania. Altogether, 30,494 people live in the seven communities through which the tracks in question pass. We began this project in response to concerns from residents who contacted FracTracker for assistance in understanding why these trains were located in their community, what hazards they might pose, and to help people bring this story to the public to foster meaningful discussions about the risks of parked oil trains.
FracTracker has covered the risks of oil trains in a series of other articles. Click here to learn more.
https://www.fractracker.org/a5ej20sjfwe/wp-content/uploads/2015/10/Berks_BlogImage.jpg400900FracTracker Alliancehttps://www.fractracker.org/a5ej20sjfwe/wp-content/uploads/2025/09/2025-Wordmark-Logo.pngFracTracker Alliance2015-10-08 11:22:372026-04-28 15:37:07Parked Oil Trains in Berks County, PA
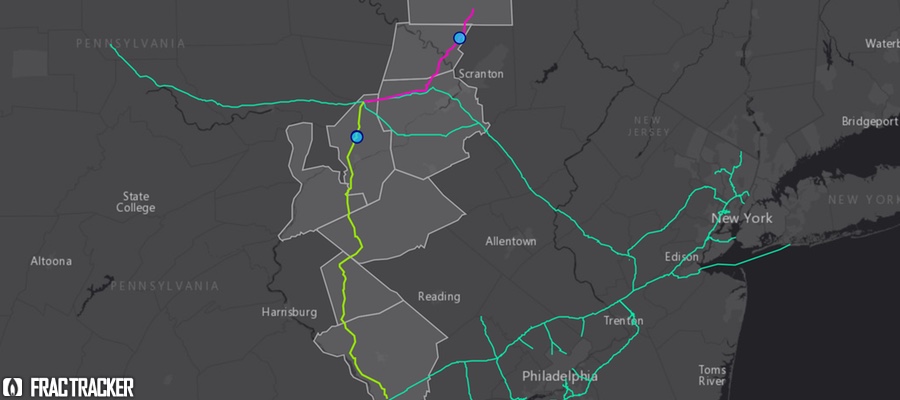
The Atlantic Sunrise Project or Central Penn Line is a natural gas pipeline Williams Companies has proposed for construction through eight counties of Central Pennsylvania. Williams intends to connect the Atlantic Sunrise to their two Transco pipelines, which extend from the northeast to the Gulf of Mexico. FracTracker discussed and mapped this controversial project as part of a blog entry in June of 2014; since then, the Atlantic Sunrise Project has been, and continues to be, a focus of unprecedented opposition. While supporters of the pipeline stress how it may enhance energy independence, economic growth, and job opportunities, opponents cite Williams’ poor safety records, their threats of eminent domain, and environmental hazards. This article provides details and maps pertaining to these threats and concerns.
Atlantic Sunrise: Project Overview
The Atlantic Sunrise Project would add 183 miles of new pipeline through the construction of the Central Penn Line North and the Central Penn Line South. The proposed Central Penn Line North (CPLN) begins in Susquehanna County, continues through Wyoming and Luzerne counties, and meets with the Transco Pipeline in Columbia County. With a 30 inch in diameter, it would allow for a maximum pressure of 1,480 psi (pounds per square inch). The proposed Central Penn Line South (CPLS) begins at the Transco Pipeline in Columbia County, and continues through Northumberland, Schuylkill, and Lebanon counties, ending in Lancaster. It would be 42 inches in diameter with a maximum pressure of 1,480 psi. The Atlantic Sunrise project also involves the construction of two new compressor stations, one in Clinton Township, Wyoming County, and the other in Orange Township, Columbia County. Finally, to accommodate the daily 1.7 million dekatherms (1 dekatherm equals 1,000 cubic feet of gas or slightly more than 1 million BTUs in energy) of additional natural gas that would flow through the system, the project proposes the expansion of 10 existing compressor stations along the Transco Pipeline in Pennsylvania, Maryland, Virginia, and North Carolina. Although the Atlantic Sunrise Pipeline would be entirely within Pennsylvania, it is permitted and regulated by the Federal Energy Regulatory Committee (FERC) because through its connection to the Transco Pipeline, it transports natural gas over state lines.
Updated Central Penn Pipeline Route
On March 31, 2015, Williams filed their formal application to FERC docket #CP15-138. Along with the formal application came changes to the pre-filing route of the pipeline that was submitted in the spring of 2014. The route of the Central Penn Line North has been modified since then by 21%, while the Central Penn Line South has been rerouted by 57%.
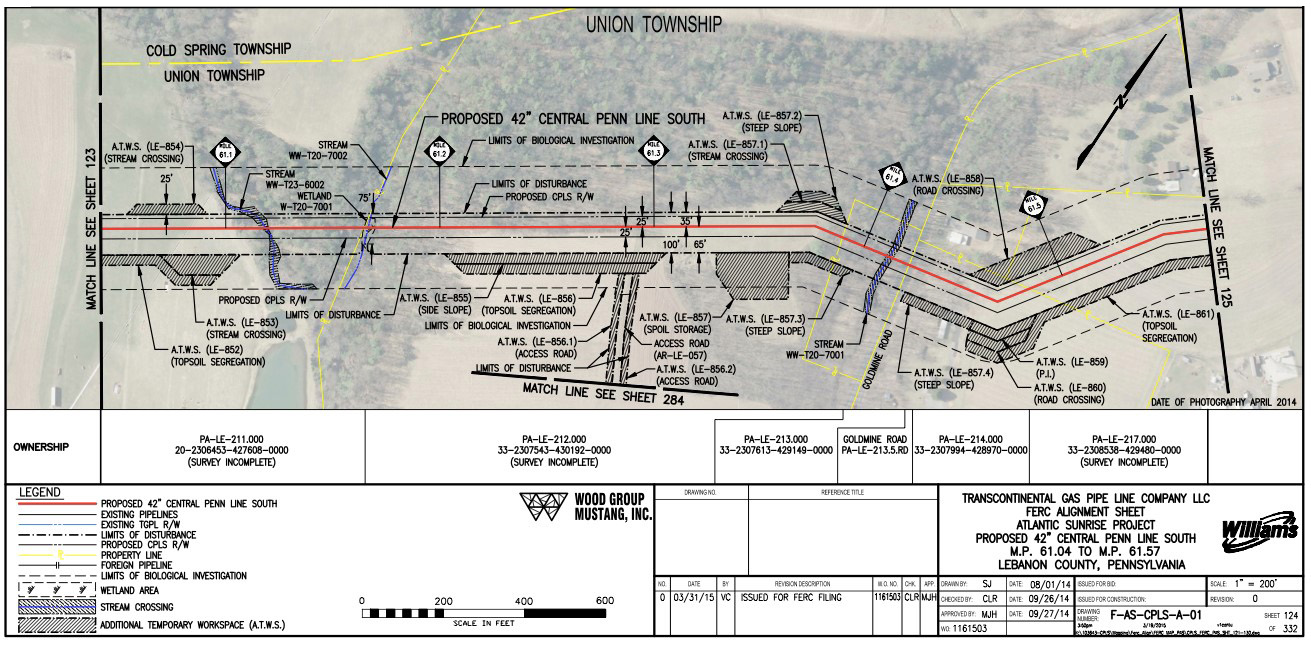
Williams’ application comprised of hundreds of attached documents, including pipeline alignment sheets for the entire route. Here is one example:
These alignment sheets show the extent of William’s biological investigation, the limits of disturbance, the occurrence of stream and wetland crossings, and any road or foreign pipeline crossings. Absent from the alignment sheets, however, is the area around the right-of-way that will be endangered by the presence of the pipeline. This is colloquially known as the “burn zone” or “hazard zone”.
What are “Hazard Zones”?
A natural gas pipeline moves flammable gas under extreme pressure, creating a risk of pipeline rupture and potential explosion. The “potential impact radius” or “hazard zone” is the approximate area within which there will be immediate damage in the case of an explosion. Should this occur, everything within the hazard zone would be incinerated and there would be virtually no chance of escape or survival. Based on pipeline diameter and pressure, the hazard zone can be calculated using the formula: potential impact radius = 0.69 * pipeline diameter * (√max pressure ).
Based on this formula, the hazard zone for the Central Penn Line North, with its diameter of 30 inches and maximum pressure of 1,480 psi, is approximately 796 feet (243 meters) on either side of the pipeline. The hazard zone for Central Penn Line South, with its diameter of 42 inches and maximum pressure of 1480 psi, is 1,115 feet (340 meters) on either side.
Many residents are unaware that their homes, workplaces, and schools are located within the hazard zone of the proposed Atlantic Sunrise Pipeline. Williams does not inform the public about this risk, primarily communicating with landowners along the right-of-way. The interactive, zoomable map (below) of the currently proposed route of the Atlantic Sunrise, Central Penn North and South pipelines depicts the pipeline right-of-way, as well as the hazard zones. The pipeline route was digitized using the alignments sheets included in Williams’ documents submitted to FERC. You can use this map to search home, work, and school addresses to see how the pipeline will affect residents’ lives and the lives of their communities.
Click in the upper right-hand corner of the map to expand to full-screen view, with a map legend.
Affected Communities
Landowners & Eminent Domain
Landowners along the right-of-way are among the most directly and most negatively impacted by the Atlantic Sunrise Pipeline, and other similar projects. Typically, people first become aware that a pipeline is intended to pass through their property when they receive a notice in the mail. Landowners faced with this news are on their own to negotiate with the company, navigate the FERC permitting and public comment process, and access unbiased and pertinent information. They face on-going stress, experiencing pressure from Williams to sign easement agreements, concern about the effects of construction on their property, and fear of living near explosive infrastructure. They must also consider costs of legal representation, decreases in property value, and limited options for mortgage and refinancing.
Sometimes, landowners in a pipeline’s right-of-way choose to not allow the company onto their property to conduct a survey. Landowners may also refuse to negotiate an agreement with the pipeline company. In response, the pipeline company can threaten to seize the property through the power of eminent domain, the federal power allowing private property to be taken if it is for the “public use.”
The law of eminent domain states that landowners whose properties are condemned must be fairly compensated for their loss. However, most landowners feel that in order to be fairly compensated by the company, they must hire their own land appraiser and attorney. This decision can be costly, however, and may not be an option for many people. The legitimacy of Williams’ intent to use eminent domain is contested by opponents of the project, who cite how “public use” of the property provides no positive local impacts. The Atlantic Sunrise Pipeline is intended to transport gas out of Pennsylvania through the Transco, so the landowners in its path will not benefit from it at all. Further, it connects to a network of pipelines leading to current export terminals in the Gulf of Mexico, as well as controversial planned export facilities like Cove Point, MD .
Throughout Pennsylvania, communities have responded to the expansion of pipelines, and to the threats of large companies like Williams. The need for landowner support has been addressed by organizations such as the Shalefield Organizing Committee, Energy Justice Network, the Clean Air Council, the Gas Drilling Awareness Coalition, and We Are Lancaster County. These organizations have worked to provide information, increase public awareness, engage with FERC, and develop resistance to the exploitation of Pennsylvania’s resources and residents. Director Scott Cannon of the Gas Drilling Awareness Coalition has documented firsthand the impacts of unconventional drilling in Pennsylvania through a short film series called the Marcellus Shale Reality Tour. The most recent in the series relates the stories of two landowners impacted by the Atlantic Sunrise Pipeline in the short film Atlantic Sunrise Surprise.
Environmental Review
Theoretically, environmental review of this proposed pipeline would be extensive. Primary decision-making on the future of the Atlantic Sunrise rests with FERC. Due to the National Environmental Policy Act of 1969 (NEPA), all projects overseen by federal agencies are required to prepare environmental assessments (EAs) or environmental impact assessments (EIAs). Because FERC regulates interstate pipelines, EA’s or EIA’s are required in their approval process. These assessments are conducted to accurately assess the environmental impacts of projects and to ensure that the proposals comply with federal environmental laws such as the Endangered Species Act, and the Clean Air and Water Acts. On the state level, the Pennsylvania Department of Environmental Protection (PA DEP) issues permits for wetlands and waterways crossings and for compressor stations on regional basis.
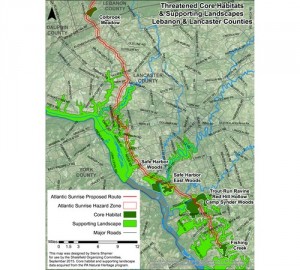
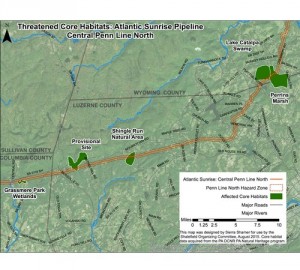
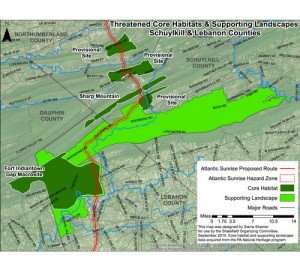
Core Habitats, Supporting Landscapes
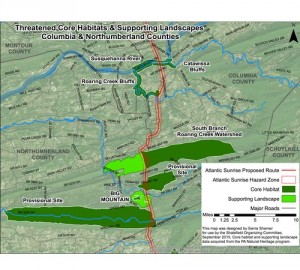
The route of the Atlantic Sunrise Pipeline will disturb numerous areas of ecological importance, including many documented in the County Natural Heritage Inventory (CNHI). The PA Department of Conservation and Natural Resources conducted the inventory to be used as a planning, economic, and infrastructural development tool, intending to avoid the destruction of habitats and species of concern. The following four maps show the CNHI landscapes affected by the current route of the Atlantic Sunrise pipeline (Figures 1-4).
Figure 1. Columbia & Northumberland counties
Figure 2. Lebanon & Lancaster counties
Figure 3. Threatened Core Habitats
Figure 4. Schuyklill & Lebanon counties
The proposed pipeline would disrupt core habitats, supporting landscapes, and provisional species-of-concern sites. According to the Natural Heritage Inventory report, core habitats “contain plant or animal species of state or federal concern, exemplary natural communities, or exceptional native diversity.” The inventory notes that the species in these habitats will be significantly impacted by disturbance activities. Supporting landscapes are defined as areas that “maintain vital ecological processes or habitat for sensitive natural features.” Finally, the provisional species of concern sites are regions where species have been identified outside of core habitat and are in the process of being evaluated. The Atlantic Sunrise intersects 16 core habitats, 12 supporting landscapes, and 6 provisional sites.
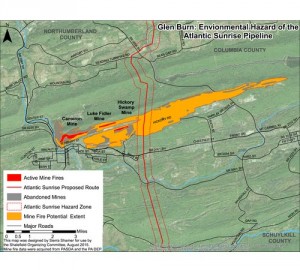
Active Mine Fires
Figure 5. Glen Burn Mine Fires
The current route of the Atlantic Sunrise intersects the Cameron/Glen Burn Colliery, considered to be the largest man-made mountain in the world and composed entirely of waste coal. This site also includes a network of abandoned mines, three of which are actively burning (Figure 5).
The pipeline right-of-way is roughly a half-mile from the closest burning mine, Hickory Swamp. These mine fire data were sourced from a 1988 report by GAI Consulting Inc. The time frame for the spread of the mine fires is unknown, and dependent on environmental factors. Mine subsidence — when voids in the earth created by mines cause the surface of the earth to collapse — is another issue of concern. Routing the pipeline through this unstable area adds to the risk of constructing the pipeline through the Glen Burn region.
Looking Ahead
The Atlantic Sunrise Project has received an unprecedented level of resistance that continues to grow as awareness and information about the threats and hazards develops. While Williams, FERC, and the PA DEP negotiate applications and permits, work is also being done by many non-profit, research, and grassroots organizations to investigate the environmental, cultural, and social costs of this pipeline. We will follow up with more information about this project as it becomes available.
This article was written by Sierra Shamer, an environmental mapper and activist. Sierra is a member of the Shalefield Organizing Committee and holds two degrees from the University of Maryland, Baltimore County: a B.A. in environmental studies and an M.S. in geography and environmental systems.
https://www.fractracker.org/a5ej20sjfwe/wp-content/uploads/2015/10/Atlantic-Shamer-Feature.jpg400900Guest Authorhttps://www.fractracker.org/a5ej20sjfwe/wp-content/uploads/2025/09/2025-Wordmark-Logo.pngGuest Author2015-10-07 09:31:152020-03-12 17:39:30Maps of Updated Central Penn Pipeline Emphasize Threats to Residents and Environment
According to data published by the Pennsylvania Department of Environmental Protection (DEP), Pennsylvania’s unconventional oil and gas waste that was generated in the first half of 2015 found its way to treatment facilities, disposal wells, and landfills in eight different states. While the majority of the waste stayed in-state, neighboring Ohio, New York, and West Virginia all received significant quantities of both solid and liquid waste, and additional disposals were made in the non-contiguous states of Michigan, Texas, Utah, and Idaho.
Waste generated by Pennsylvania’s unconventional oil and gas wells was disposed of in a variety of ways and over a large geographic area. Click on a facility to learn more, or zoom in to access waste generated by individual wells. Click here to access the full screen map with a legend and additional controls.
Unconventional drillers in the state are now required to report production data monthly, rather than in six month increments, but waste quantities generated by the wells is still supposed to be reported biannually. However, a small number of operators have been reporting waste monthly, as well, and those figures have been included in this analysis, after spot-checking for duplication. Each record includes data on how the waste was processed and where it was shipped, so we were able to map the receiving facilities as well, and aggregate their waste totals.
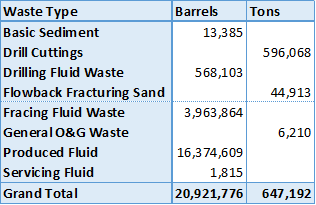
Types of Waste
Waste generated by unconventional wells in Pennsylvania from January to June 2015 by type.
There are eight types of waste detailed in the Pennsylvania data, including:
Basic Sediment (Barrels) – Impurities that accompany the desired product
Drill Cuttings (Tons) – Broken bits of rock produced during the drilling process
Flowback Fracturing Sand (Tons) – Sand used to prop open cracks made during hydraulic fracturing that return to the surface
Fracing Fluid Waste (Barrels) – Fluid pumped into the well for hydraulic fracturing that returns to the surface. This includes chemicals that were added to the well.
Produced Fluid (Barrels) – Naturally occurring brines encountered during drilling that contain various contaminants, which are often toxic or radioactive
Servicing Fluid (Barrels) – Various other fluids used in the drilling process
Spent Lubricant (Barrels) – Oils used in engines as lubricants
General O&G Waste (Tons) – Solid waste types other than drill cuttings or fracturing sand
For the sake of simplicity, this analysis will at times aggregate the waste types into two categories, with all types reporting in tons as solid waste, while those listed in 42 gallon barrels will be considered liquid waste.
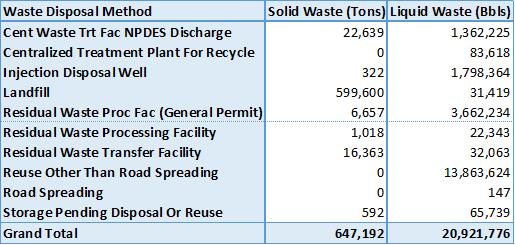
Waste Disposal
Waste disposal method for unconventional wells in PA, January to June 2015
This PA waste gets disposed of in a variety of ways. About 93 percent of all solid waste ends up in landfills. 29 of the 58 operators reporting waste during this cycle reported drill cuttings. In a separate report, the DEP has records for unconventional wells drilled by 28 different operators during the same time frame, so these results seem reasonable, since drill cuttings are generated during the drilling process, whereas other types of waste are produced throughout the life cycle of the well.
Statewide, there over 596,000 tons of drill cuttings produced during a period which saw 422 wells spudded, an average of 1,412 tons of cuttings per well. Not all operators generated the same amount of cuttings per well, however. Vantage Energy reports 3,089 tons of cuttings per well, while Hilcorp Energy manages to average just 119 tons over 23 wells drilled in the six month period. It is worth noting that some wells that were spudded just prior to the reporting period likely still generated drill cuttings during the six months in question, and some wells spudded during the cycle will continue to produce cuttings into the next one.
In terms of liquid waste, nearly two thirds of the amount reported is reused for purposes other than road spreading. This is, unfortunately, a dead end in terms of being able to follow the waste stream in the data, as there are no facilities associated with the 13.8 million barrels of waste that falls into this category. 225,000 barrels are specified as being reused for hydraulic fracturing, while the remainder is simply destined for, “Reuse without processing at a permitted facility.”
The amount used for road spreading, 147 barrels, is relatively small, and all of this waste is reported as going to private roads in Greene County. The total amount of liquid waste produced in the six month period is almost 879 million gallons, or enough to fill 1,331 Olympic-sized swimming pools.
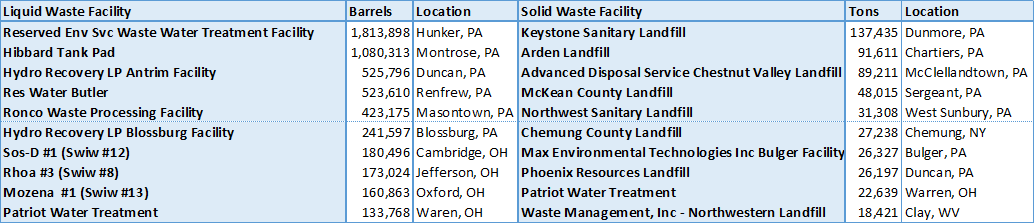
PA Waste Receiving Facilities
Altogether, we know where roughly 7 million of the nearly 21 million barrels of reported liquid waste wound up, as well as 640,000 of the 647,000 tons of solid waste. The top ten destinations for each waste type are as follows:
Top 10 reported recipients of unconventional O&G waste produced in PA during the first half of 2015.
Six of the top destinations for liquid waste were located in-state, while seven of the top ten facilities for solid waste stayed in Pennsylvania. The only facility to appear on both lists is Patriot Water Treatment in Warren, Ohio.
https://www.fractracker.org/a5ej20sjfwe/wp-content/uploads/2014/10/Waste-Data-Feature.png400900Matt Kelso, BAhttps://www.fractracker.org/a5ej20sjfwe/wp-content/uploads/2025/09/2025-Wordmark-Logo.pngMatt Kelso, BA2015-09-18 11:02:512020-03-12 13:49:50Pennsylvania’s Drilling Waste Distributed to Eight States
FracTracker Alliance worked with Public Herald this spring to update and map oil and gas complaints filed by citizens to the Pennsylvania Department of Environmental Protection (PA DEP) as of March 2015. The result is the largest release of oil and gas records on water contamination due to fracking in PA. Additionally, Public Herald’s investigation revealed evidence of Pennsylvania state officials keeping water contamination related to fracking “off the books.”
The mission of Public Herald, an investigative news non-profit formed in 2011, is two-fold: truth + creativity. Their work uses investigative journalism and art to empower readers and hold accountable those who put the public at risk. For this project, Public Herald aims to improve the public’s access to oil and gas information in PA by way of file reviews and data digitization. Public Herald maintains an open source website called #fileroom, where people can access a variety of digital information originally housed on paper within the PA DEP. This information is collected and synthesized with the help of donors, journalists and researchers in a collective effort with the community. To date, these generous volunteers have already donated more than 2,000 hours of their time collecting records.
The site includes complaints, permits, waste, legal cases, and gas migration investigations (GMI) conducted by the PA DEP. Additionally, there is a guide on how to conduct file reviews and how to access information through the “Right-to-Know” law at the PA DEP. They have broken down complaints and permits by county; wastes and GMI categories by cases, all of which include test results from inspections; and correspondence and weekly reports.
Some partners and contributors to the file team include Joshua Pribanic as the co-founder and Editor-in Chief, Melissa Troutman as co-founder and Executive Director, John Nicholson, who collects and researches for several databases, Nadia Steinzor as a contributor through Earthworks, and many more. Members of FracTracker working on this project include Matt Kelso, Samantha Rubright, and Kirk Jalbert.
#fileroom’s update expands the number of complaint data records collected to 18 counties – and counting!
Over the past few years, oil train traffic across the continent has increased rapidly with more than 500,000 rail cars moving oil in 2014 alone, according to the Association of American Railroads. The recent Lac-Mégantic, Quebec disaster and subsequent accidents illustrate the severity of this issue. There is a pressing need to determine true hazards facing our communities and to develop solutions to prevent further disasters. Across the United States and Canada, the issue of oil trains has quickly risen onto the agenda of community leaders, safety experts, researchers, and concerned citizens. There is much to discover and share about protecting people and vulnerable places from the various risks these trains pose. Oil Train Response 2015 provides two invaluable forums on this most pressing problem and provides information and insights for every audience.
November 13, 2015
Community Risks & Solutions Conference Presented by The Heinz Endowments
November 14 & 15, 2015
Activist Training Weekend Presented by ForestEthics
The one-day conference presented by The Heinz Endowments invites all interest groups to hear from experts about the scale and scope of this challenge, as well as updates on the current regulatory and legal frameworks; consider case studies about the actions/measures taken by various communities in response; and, participate in discussion sessions to explore solutions to better safeguard communities. Elected officials, regulators, and emergency response professionals from Pennsylvania and beyond are especially encouraged to attend to take advantage of this important learning and networking opportunity.
Training – November 14-15th
Saturday, Nov. 14th: Training 7:30 AM – 5:00 PM. Reception 6:00 – 8:00 PM
Sunday, Nov. 15th: Training 7:30 AM – 2:00 PM
A two-day training presented by ForestEthics will equip grassroots and NGO leaders from across the nation with better skills to take back to their communities, and provide critical opportunities for attendees to share winning strategies with each other. In the process of sharing, the conference will help to build both the oil train movement and support the broader environmental and social justice movements. Areas of strategic focus will include: organizing, communications, spokesperson training, data management for organizers, legal strategies, and crowd-sourced train tracking. It will also provide a structured forum for advocates fighting specific oil terminal proposals in places like Philadelphia, Baltimore, and Albany to develop shared strategies and tactics and provide all participants with the skills, knowledge and contacts they will need to carry on this work once they return home.
Oil trains are a major environmental justice issue. The conference and training will speak directly to environmental justice concerns and be inclusive of communities of color, economically disadvantaged urban and rural regions, and communities already experiencing environmental inequities. To this end, need-based travel scholarships will be provided. We are committed to developing the agenda in close consultation with our allies and attendees so that it meets their needs.
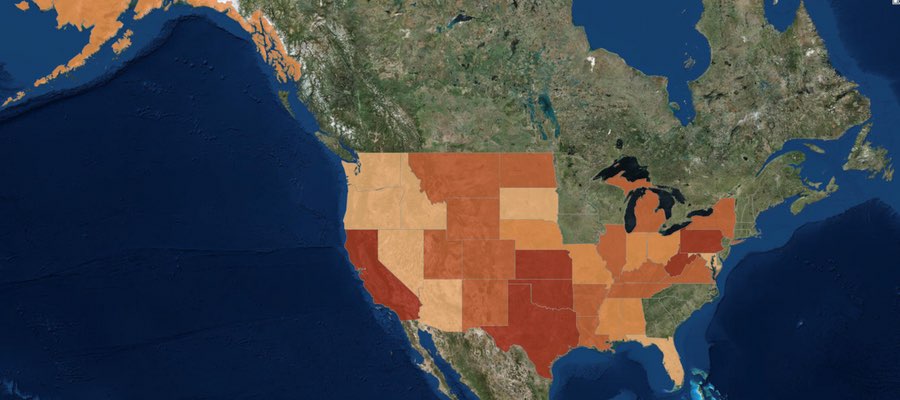
In February 2014, the FracTracker Alliance produced our first version of a national well data file and map, showing over 1.1 million active oil and gas wells in the United States. We have now updated that data, with the total of wells up to 1,666,715 active wells accounted for.
Density by state of active oil and gas wells in the United States. Click here to access the legend, details, and full map controls. Zoom in to see summaries by county, and zoom in further to see individual well data. Texas contains state and county totals only, and North Carolina is not included in this map.
While 1.7 million wells is a substantial increase over last year’s total of 1.1 million, it is mostly attributable to differences in how we counted wells this time around, and should not be interpreted as a huge increase in activity over the past 15 months or so. Last year, we attempted to capture those wells that seemed to be producing oil and gas, or about ready to produce. This year, we took a more inclusive definition. Primarily, the additional half-million wells can be accounted for by including wells listed as dry holes, and the inclusion of more types of injection wells. Basically anything with an API number that was not described as permanently plugged was included this time around.
Data for North Carolina are not included, because they did not respond to three email inquiries about their oil and gas data. However, in last year’s national map aggregation, we were told that there were only two active wells in the state. Similarly, we do not have individual well data for Texas, and we use a published list of well counts by county in its place. Last year, we assumed that because there was a charge for the dataset, we would be unable to republish well data. In discussions with the Railroad Commission, we have learned that the data can in fact be republished. However, technical difficulties with their datasets persist, and data that we have purchased lacked location values, despite metadata suggesting that it would be included. So in short, we still don’t have Texas well data, even though it is technically available.
Wells by Type and Status
Each state is responsible for what their oil and gas data looks like, so a simple analysis of something as ostensibly straightforward as what type of well has been drilled can be surprisingly complicated when looking across state lines. Additionally, some states combine the well type and well status into a single data field, making comparisons even more opaque.
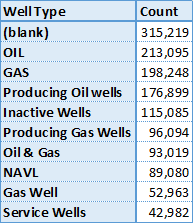
Top 10 of 371 published well types for wells in the United States.
Among all of the oil producing states, there are 371 different published well types. This data is “raw,” meaning that no effort has been made to combine similar entries, so “gas, oil” is counted separately from “GAS OIL,” and “Bad Data” has not been combined with “N/A,” either. Conforming data from different sources is an exercise that gets out of hand rather quickly, and utility over using the original published data is questionable, as well. We share this information, primarily to demonstrate the messy state of the data. Many states combine their well type and well status data into a single column, while others keep them separate. Unfortunately, the most frequent well type was blank, either because states did not publish well types, or they did not publish them for all of their wells.
There are no national standards for publishing oil and gas data – a serious barrier to data transparency and the most important takeaway from this exercise…
Wells by Location
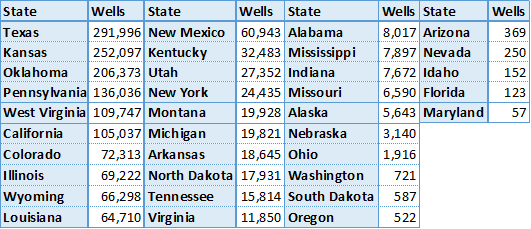
Active oil and gas wells in 2015 by state. Except for Texas, all data were aggregated published well coordinates.
There are oil and gas wells in 35 of the 50 states (70%) in the United States, and 1,673 out of 3,144 (53%) of all county and county equivalent areas. The number of wells per state ranges from 57 in Maryland to 291,996 in Texas. There are 135 counties with a single well, while the highest count is in Kern County, California, host to 77,497 active wells.
With the exception of Texas, where the data are based on published lists of well county by county, the state and county well counts were determined by the location of the well coordinates. Because of this, any errors in the original well’s location data could lead to mistakes in the state and county summary files. Any wells that are offshore are not included, either. Altogether, there are about 6,000 wells (0.4%) are missing from the state and county files.
Wells by Operator
There are a staggering number of oil and gas operators in the United States. In a recent project with the National Resources Defense Council, we looked at violations across the few states that publish such data, and only for the 68 operators that were identified previously as having the largest lease acreage nationwide. Even for this task, we had to follow a spreadsheet of which companies were subsidiaries of others, and sometimes the inclusion of an entity like “Williams” on the list came down to a judgement call as to whether we had the correct company or not.
No such effort was undertaken for this analysis. So in Pennsylvania, wells drilled by the operator Exco Resources PA, Inc. are not included with those drilled by Exco Resources PA, Llc., even though they are presumably the same entity. It just isn’t feasible to systematically go through thousands of operators to determine which operators are owned by whom, so we left the data as is. Results, therefore, should be taken with a brine truck’s worth of salt.
Top 10 wells by operator in the US, excluding Texas. Unknown operators are highlighted in red.
Texas does publish wells by operator, but as with so much of their data, it’s just not worth the effort that it takes to process it. First, they process it into thirteen different files, then publish it in PDF format, requiring special software to convert the data to spreadsheet format. Suffice to say, there are thousands of operators of active oil and gas wells in the Lone Star State.
Not counting Texas, there are 39,693 different operators listed in the United States. However, many of those listed are some version of “we don’t know whose well this is.” Sorting the operators by the number of wells that they are listed as having, we see four of the top ten operators are in fact unknown, including the top three positions.
Summary
The state of oil and gas data in the United States is clearly in shambles. As long as there are no national standards for data transparency, we can expect this trend to continue. The data that we looked for in this file is what we consider to be bare bones: well name, well type, well status, slant (directional, vertical, or horizontal), operator, and location. In none of these categories can we say that we have a satisfactory sense of what is going on nationally.
Click on the above button to download the three sets of data we used to make the dynamic map (once you are zoomed in to a state level). The full dataset was broken into three parts due to the large file sizes.
https://www.fractracker.org/a5ej20sjfwe/wp-content/uploads/2015/08/2015Update-Feature.jpg400900Matt Kelso, BAhttps://www.fractracker.org/a5ej20sjfwe/wp-content/uploads/2025/09/2025-Wordmark-Logo.pngMatt Kelso, BA2015-08-03 14:19:532020-07-21 10:30:051.7 Million Wells in the U.S. – A 2015 Update
This article was originally posted on 10 July 2015, and then updated on 22 January 2016 and 16 February 2016.
Proposed Pipeline to Funnel Marcellus Gas South
In early fall 2014, Dominion Energy proposed a $5 billion pipeline project, designed provide “clean-burning gas supplies to growing markets in Virginia and North Carolina.” Originally named the “Southeast Reliability Project,” the proposed pipeline would have a 42-inch diameter in West Virginia and Virginia. It would narrow to 36 inches in North Carolina, and narrow again to 20 inches in the portion that would extend to the coast at Hampton Roads. Moving 1.5 billion cubic feet per day of gas, with a maximum allowable operating pressure of 1440 psig (pounds per square inch gage), the pipeline would be designed for larger customers (such as manufacturers and power generators) or local gas distributors supplying homes and businesses to tap into the pipeline along the route, making the pipeline a prime mover for development along its path.
The project was renamed the Atlantic Coast Pipeline (ACP) when a coalition of four major US energy companies—Dominion (45% ownership), Duke Energy (40%), Piedmont Natural Gas (15%), and AGL Resources (5%)— proposed a joint venture in building and co-owning the pipeline. Since then, over 100 energy companies, economic developers, labor unions, manufacturers, and civic groups have joined the new Energy Sure Coalition, supporting the ACP. The coalition asserts that the pipeline is essential because the demand for fuel for power generation is predicted more than triple over the next 20 years. Their website touts the pipeline as a “Path to Cleaner Energy,” and suggests that the project will generate significant tax revenue for Virginia, North Carolina, and West Virginia.
Lew Ebert, president of the North Carolina Chamber of Commerce, optimistically commented:
Having the ability to bring low-cost, affordable, predictable energy to a part of the state that’s desperately in need of it is a big deal. The opportunity to bring a new kind of energy to a part of the state that has really struggled over decades is a real economic plus.
Unlike older pipelines, which were designed to move oil and gas from the Gulf Coast refineries northward to meet energy demands there, the Atlantic Coast Pipeline would tap the Marcellus Shale Formation in Ohio, West Virginia and Pennsylvania and send it south to fuel power generation stations and residential customers. Dominion characterizes the need for natural gas in these parts of the country as “urgent,” and that there is no better supplier than these “four homegrown companies” that have been economic forces in the state for many years.
In addition to the 550 miles of proposed pipeline for this project, three compressor stations are also planned. One would be at the beginning of the pipeline in West Virginia, a second midway in County Virginia, and the third near the Virginia-North Carolina state line. The compressor stations are located along the proposed pipeline, adjacent to the Transcontinental Pipeline, which stretches more than 1,800 miles from Pennsylvania and the New York City Area to locations along the Gulf of Mexico, as far south as Brownsville, TX.
In mid-May 2015, in order to avoid requesting Congressional approval to locate the pipeline over National Park Service lands, Dominion proposed rerouting two sections of the pipeline, combining the impact zones on both the Blue Ridge Parkway and the Appalachian Trail into a single location along the border of Nelson and Augusta Counties, VA. National Forest Service land does not require as strict of approvals as would construction on National Park Service lands. Dominion noted that over 80% of the pipeline route has already been surveyed.
Opposition to the Pipeline on Many Fronts
The path of the proposed pipeline crosses topography that is well known for its karst geology feature—underground caverns that are continuous with groundwater supplies. Environmentalists have been vocal in their concern that were part of the pipeline to rupture, groundwater contamination, along with impacts to wildlife could be extensive. In Nelson County, VA, alone, 70% of the property owners in the path of the proposed pipeline have refused Dominion access for survey, asserting that Dominion has been unresponsive to their concerns about environmental and cultural impacts of the project.
On the grassroots front, 38 conservation and environmental groups in Virginia and West Virginia have combined efforts to oppose the ACP. The group, called the Allegany-Blue Ridge Alliance (ABRA), cites among its primary concerns the ecologically-sensitive habitats the proposed pipeline would cross, including over 49.5 miles of the George Washington and Monongahela State Forests in Virginia and West Virginia. The “alternative” version of the pipeline route would traverse 62.7 miles of the same State Forests. Scenic routes, including the Blue Ridge Parkway and the Appalachian Scenic Trail would also be impacted. In addition, it would pose negative impacts on many rural communities but not offset these impacts with any longer-term economic benefits. ABRA is urging for a programmatic environmental impact statement (PEIS) to assess the full impact of the pipeline, and also evaluate “all reasonable, less damaging” alternatives. Importantly, ABRA is urging for a review that explores the cumulative impacts off all pipeline infrastructure projects in the area, especially in light of the increasing availability of clean energy alternatives.
Environmental and political opposition to the pipeline has been strong, especially in western Virginia. Friends of Nelson, based in Nelson County, VA, has taken issue with the impacts posed by the 150-foot-wide easement necessary for the pipeline, as well as the shortage of Department of Environmental Quality staff that would be necessary to oversee a project of this magnitude.
Do gas reserves justify this project?
Dominion, an informational flyer, put forward an interesting argument about why gas pipelines are a more environmentally desirable alternative to green energy:
If all of the natural gas that would flow through the Atlantic Coast Pipeline is used to generate electricity, the 1.5 billion cubic feet per day (bcf/d) would yield approximately 190,500 megawatt-hours per day (mwh/d) of electricity. The pipeline, once operational, would affect approximately 4,600 acres of land. To generate that much electricity with wind turbines, utilities would need approximately 46,500 wind turbines on approximately 476,000 acres of land. To generate that much electricity with solar farms, utilities would need approximately 1.7 million acres of land dedicated to solar power generation.
Nonetheless, researchers, as well as environmental groups, have questioned whether the logic is sound, given production in both the Marcellus and Utica Formations is dropping off in recent assessments.
Both Nature, in their article Natural Gas: The Fracking Fallacy, and Post Carbon Institute, in their paper Drilling Deeper, took a critical look at several of the current production scenarios for the Marcellus Shale offered by EIA and University of Texas Bureau of Economic Geology (UT/BEG). All estimates show a decline in production over current levels. The University of Texas report, authored by petroleum geologists, is considerably less optimistic than what has been suggested by the Energy Information Administration (EIA), and imply that the oil and gas bubble is likely to soon burst.
Natural Gas Production Projections for Marcellus Shale
David Hughes, author of the Drilling Deeper report, summarized some of his findings on Marcellus productivity:
Field decline averages 32% per year without drilling, requiring about 1,000 wells per year in Pennsylvania and West Virginia to offset.
Core counties occupy a relatively small proportion of the total play area and are the current focus of drilling.
Average well productivity in most counties is increasing as operators apply better technology and focus drilling on sweet spots.
Production in the “most likely” drilling rate case is likely to peak by 2018 at 25% above the levels in mid-2014 and will cumulatively produce the quantity that the Energy Information Administration (EIA) projected through 2040. However, production levels will be higher in early years and lower in later years than the EIA projected, which is critical information for ongoing infrastructure development plans.
Five out of more than 70 counties account for two-thirds of production. Eighty-five percent of production is from Pennsylvania, 15% from West Virginia and very small amounts from Ohio and New York. (The EIA has published maps of the depth, thickness and distribution of the Marcellus shale, which are helpful in understanding the variability of the play.)
The increase in well productivity over time reported in Drilling Deeper has now peaked in several of the top counties and is declining. This means that better technology is no longer increasing average well productivity in these counties, a result of either drilling in poorer locations and/or well interference resulting in one well cannibalizing another well’s recoverable gas. This declining well productivity is significant, yet expected, as top counties become saturated with wells and will degrade the economics which have allowed operators to sell into Appalachian gas hubs at a significant discount to Henry hub gas prices.
The backlog of wells awaiting completion (aka “fracklog”) was reduced from nearly a thousand wells in early 2012 to very few in mid-2013, but has increased to more than 500 in late 2014. This means there is a cushion of wells waiting on completion which can maintain or increase overall play production as they are connected, even if the rig count drops further.
Current drilling rates are sufficient to keep Marcellus production growing on track for its projected 2018 peak (“most likely” case in Drilling Deeper).
Post Carbon Institute estimates that Marcellus predictions overstate actual production by 45-142%. Regardless of the model we consider, production starts to drop off within a year or two after the proposed Atlantic Coast Pipeline would go into operation. This downward trend leads to some serious questions about whether moving ahead with the assumption of three-fold demand for gas along the Carolina coast should prompt some larger planning questions, and whether the availability of recoverable Marcellus gas over the next twenty years, as well as the environmental impacts of the Atlantic Coast Pipeline, justify its construction.
Next steps
The Federal Energy Regulatory Commission, FERC, will make a final approval on the pipeline route later in the summer of 2015, with a final decision on the pipeline construction itself expected by fall 2016.
UPDATE #1: On January 19, 2016, the Richmond Times-Dispatch reported that the United States Forest Service had rejected the pipeline, due to the impact its route would have on habitats of sensitive animal species living in the two National Forests it is proposed to traverse.
UPDATE #2: On February 12, 2016, Dominion Pipeline Company released a new map showing an alternative route to the one recently rejected by the United States Forest Service a month earlier. Stridently condemned by the Dominion Pipeline Monitoring Coalition as an “irresponsible undertaking”, the new route would not only cross terrain the Dominion had previously rejected as too hazardous for pipeline construction, it would–in avoiding a path through Cheat and Shenandoah Mountains–impact terrain known for its ecologically sensitive karst topography, and pose grave risks to water quality and soil erosion.


