The Pennsylvania Department of Environmental Protection (DEP) logs incoming complaints from residents about drilling activity in the Commonwealth, and Public Herald has spent a great deal of time aggregating and making that information public. A recent investigation by Public Herald into that data, with help from FracTracker, has highlighted a number of concerning issues related to fracking in Pennsylvania unfortunately.
Concerning Complaints
Firstly, the data they reviewed indicate that complaints from residents about unconventional drilling (how most fracked wells are designated) are more common than those about traditional wells. Secondly, it seems that complaints about fracked wells are increasing over time, even though the number of new wells has decreased.
There may be several reasons for such trends, and Public Herald discusses some of them in their new report. Are fracking wells more likely to fail, resulting in a higher proportion of complaints from nearby residents? Or has tracking simply improved in recent years? What these trends undoubtably indicate, however, is that the impacts from drilling have been systemic, according to Drs. Ingraffea and Stolz, who also reviewed the data.
Probably the most troubling finding unearthed in this investigation is that the PA DEP was not transparent about complaint data. The information they released to Public Herald differed wildly from the spreadsheets previously obtained by other requestors. Learn more about this and other issues in Public Herald’s Hidden Data Report.
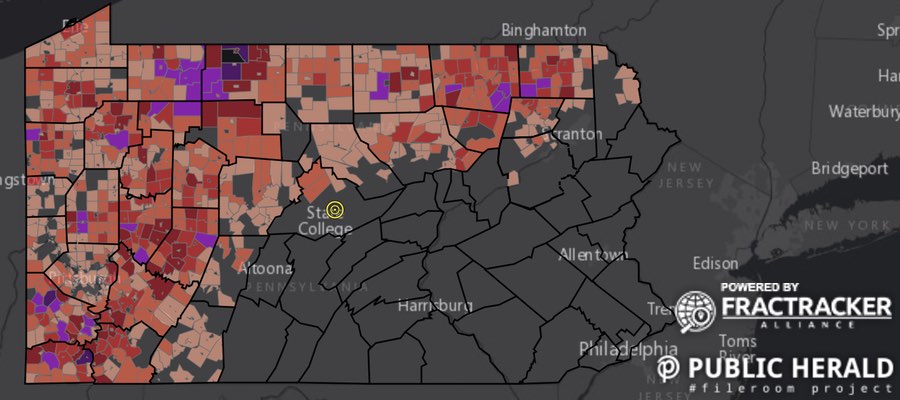
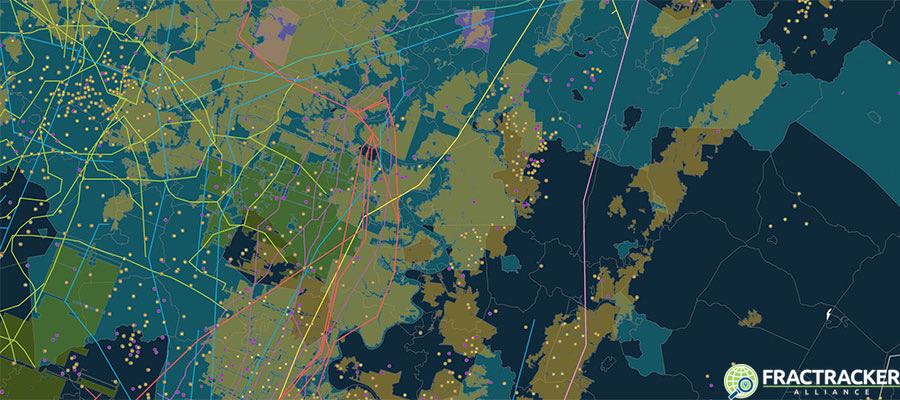
The above map by Public Herald and FracTracker Alliance shows the density of citizen complaints reported to the Department of Environmental Protection from 2004 – 2016. It includes conventional and unconventional well complaints. Clicking on a township reveals a database of complaints where viewers can download files.
In addition to the report issued by Public Herald, you can explore the data mapped above in the table below. It fleshes out how many complaints have been issued by residents, where these complaints originated, and how many are specific to water issues.
Table 1. PA Unconventional Well Complaint Statistics Logged by the PA DEP
DEP Office
County
Total Complaints (#)
Water Complaints (#)
Municipalities w/Complaints (#)
Drilled Unconventional Wells, Jan 2004 – Nov 29 2016
The result of this year’s presidential election has sent shock waves through all levels of government. Many are now wondering what the next four years will look like in terms of funding and policy decisions. Just a few days after the inauguration, the next administration’s cabinet choices have many worried. For example, the person President-Elect Trump has selected to lead the transition at the Environmental Protection Agency (EPA), Myron Ebell, has connections to the fossil fuel industry, suggesting national energy policy may embrace fossil fuel development. Of equal concern are the industry connections of former ExxonMobil CEO Rex Tillerson as Secretary of State and former Texas governor Rick Perry as Secretary of Energy.
While these transformations are happening at the federal level, Pennsylvania has its own long history of revolving doors between government and industry that deserve attention. Examination of data collected by citizen advocate, Dorina Hippauf, as well as my own independent research, shows a state government with extensive ties to the oil and gas industry. This relationship is a concern given that state responses to national energy policy and climate change will become particularly important in coming years.
The Governor’s Office
Former Governor Ed Rendell, who served from 2003-2011, has multiple ties to the natural gas industry and was governor during the initial stages of the shale gas boom in PA. During this time, Governor Rendell leased 130,000 acres of state land to gas extraction companies (he later imposed a ban on leasing state lands). After leaving office, Rendell joined Element Partners, an equity firm with investments in the gas industry. Currently, Rendell is Co-chair of Building America’s Future, a bipartisan coalition of elected officials advocating for investment in the nation’s infrastructure. As recently as August 2016, Rendell has said he makes no apologies and remains a “strong advocate” of unconventional gas extraction, also stating that weaknesses in regulation were “cured” in 2010.
Pennsylvania’s shale gas industry saw its beginnings under Governor Rendell, but the industry truly boomed under Governor Tom Corbett. Corbett, a Republican, served a single term from 2011 to 2015. One of Corbett’s first acts as governor was to sign Act 13, which revised oil and gas laws and implemented the controversial impact fee in lieu of a severance tax. Corbett overturned Rendell’s ban on leasing public lands to gas companies. Corbett accepted $1.8 million in campaign contributions from gas companies. These contributions came not only from the companies themselves but also individual contributions from industry executives. Many of the companies that donated to Corbett’s campaign also found themselves appointed to the Marcellus Shale Advisory Commission.
Pennsylvania’s current Governor, Democrat Tom Wolf, campaigned on a platform of tougher restrictions on natural gas companies, as well as a 5% severance tax. However, the severance tax has failed to be implemented due to contentious budget negotiations with the Republican-held General Assembly. There were also concerns during Wolf’s campaign when it was revealed he had received $273,000 in donations from members of the gas industry. Many environmental advocates called on Wolf to return the funds.
Another important point to consider in these transitions is that, as elected officials move through various offices, their staffers often move with them or are appointed to influential positions. For example, K. Scott Roy served as Rendell’s chief of staff while in Harrisburg. After leaving politics, Roy joined Range Resources, one of the largest gas extraction companies in Pennsylvania. In the past he has also served as Treasurer for the Marcellus Shale Coalition.
The DEP: Regulating in the Public Interest?
The Department of Environmental Protection (DEP) is the state agency responsible for enforcing and regulating the natural gas industry in PA. However, research shows a consistent thread of secretaries with ties to the oil and gas industry dating as far back as secretaries James Seif (1995-2001) and David Hess (2001-2003). Both joined lobbying firms after leaving government. Seif joined Ridge Global, LLC, a lobbying firm founded by former governor Tom Ridge, which has had contracts with the Marcellus Shale Coalition, and where Seif currently serves as Principal of Energy and Environment. Hess joined Crisci, a lobbying firm with many gas companies as clients, where he is currently the Director of Policy and Communication at Crisci.
Katie McGinty was appointed by Governor Rendell and served from 2003 to 2008. Since leaving the agency she has worked for a number of energy-related companies including NRG Energy (operator of natural gas plants), Element Partners (the same firm Ed Rendell joined), and has been senior vice-president at Westen Solutions (a consulting firm with several natural gas companies as clients). During her Senate campaign, McGinty faced criticism for the significant campaign donations she received from the natural gas industry, as well as her employment past. McGinty was succeeded by John Hanger, who served from 2008 to 2011. Hanger left the DEP to join the law and lobbying firm Eckert Seamans Cherin and Mellott, LLC, which is a member of the Marcellus Shale Coalition. One of their clients is the Pennsylvania Independent Oil and Gas Association (PIOGA).
Perhaps the most infamous DEP secretary was Michael Krancer (2011-2013), who once notoriously said, “At the end of the day, my job is to get gas done.” Prior to joining the DEP, Krancer worked for Blank Rome, a law and lobbying firm that represents gas companies and is also a member of the Marcellus Shale Coalition, where he now currently works once again. Krancer also served as a member of the Marcellus Shale Advisory Commission, the panel that advised Governor Corbett on unconventional gas drilling regulations. Krancer’s father, Ronald, was also a significant contributor to Corbett’s 2010 gubernatorial campaign. After Krancer left the DEP, Corbett appointed Christopher Abruzzo, who served for about a year, followed by Dana Ankust, who also served a single year.
When Tom Wolf took office in 2015, he appointed John Quigley to head the DEP. Due to his past working with environmental advocacy group PennFuture, there was optimism that Quigley’s appointment would take the DEP in a different direction. Quigley had also previously served as secretary of the Department of Conservation and Natural Resources. In 2014, the Pennsylvania Environmental Defense Council sued the Commonwealth to try and stop the leasing of state lands to gas companies. Quigley testified that he had felt pressure to allow the lease of public land. Quigley dramatically resigned as secretary of the DEP in May, 2016, as a result of a leaked email voicing frustration with environmental advocacy groups and gridlock in the General Assembly. Quigley is an interesting counterpoint to the trend of DEP secretaries being influenced by the shale gas industry — an environmental advocate entering a political arena hostile to the DEP’s mission.
If one looks deeper at the DEP, there is further evidence of the revolving door between the oil and gas industry and the agency. For example, Barbara Sexton served as executive deputy secretary before leaving to join Chesapeake Energy, where she is currently Director of Government Relations. Another former deputy secretary, John Hines, left the agency to work for Shell. Michael Arch, who was an inspection supervisor, left to work for PIOGA. And finally, L. Richard Adams was formerly the DEP watershed manager before joining Chief Oil and Gas.
Conclusion
These findings suggest that multiple aspects of the Pennsylvania state government have historical and presently revolving-door relationships with the oil and gas industry. In a sense, this situation is not entirely surprising. PA is one of the largest natural gas producing states in the country, and the rhetoric of energy policy sells natural gas as a cleaner, cheaper, domestically-produced alternative to coal or oil. Historically, states have acted as “laboratories of policy,” as the federal government has been slow to pass legislation addressing energy and climate change. The incoming Trump administration has shown itself to be enthusiastic about expanding the fossil fuel market. However, it’s impossible to predict what changes will happen to the EPA and federal regulations. Such unpredictability makes states all the more important in shaping environmental protection policy in the next few years. We need to be aware of these revolving doors so we can be prepared for what’s coming in the future.
https://www.fractracker.org/a5ej20sjfwe/wp-content/uploads/2017/01/PA_Capitol_header.jpg400900FracTracker Alliancehttps://www.fractracker.org/a5ej20sjfwe/wp-content/uploads/2025/09/2025-Wordmark-Logo.pngFracTracker Alliance2017-01-24 01:22:562021-04-15 15:03:48Revolving Doors & the PA Natural Gas Industry
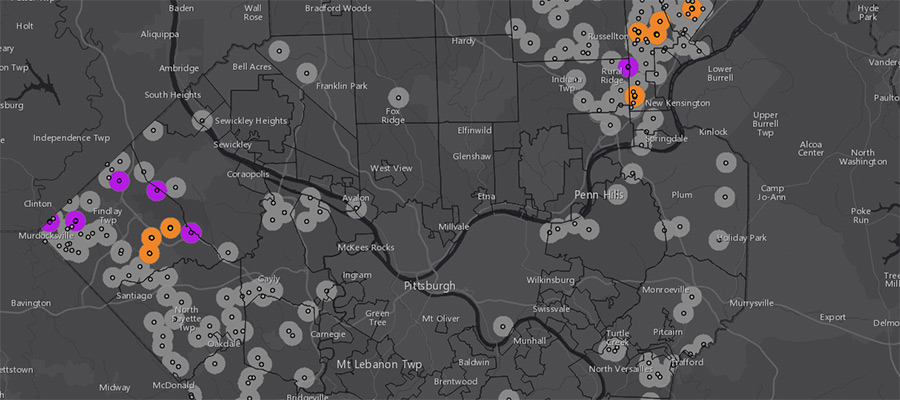
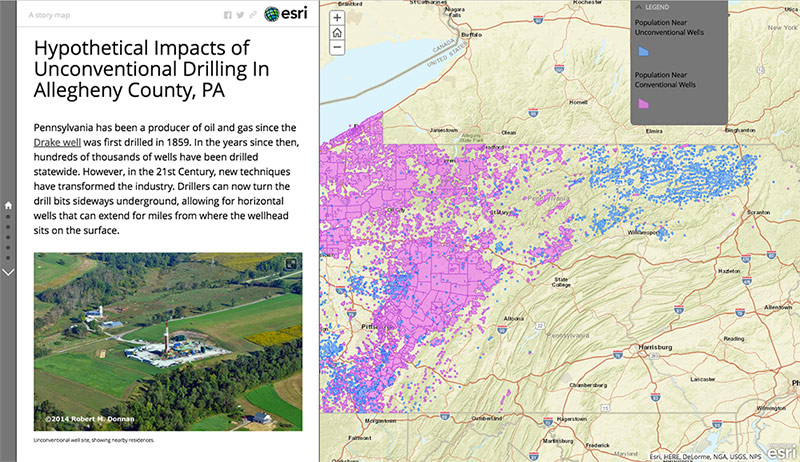
With tens of thousands of wells scattered across the countryside, Southwestern Pennsylvania is no stranger to oil and gas development. New, industrial scale extraction methods are already well entrenched, with over 3,600 of these unconventional wells drilled so far in that part of the state, mostly from the well known Marcellus Shale formation.
Southwestern Pennsylvania is also home to the Pittsburgh Metropolitan Area, a seven county region with over 2.3 million people. Just over half of this population is in Allegheny County, where unconventional drilling has become more common in recent years, along with all of its associated impacts. In the following interactive story map, the FracTracker Alliance takes a look at current impacts in more urban and suburban environments, plus projects what future impacts could look like, based on leasing activity.
https://www.fractracker.org/a5ej20sjfwe/wp-content/uploads/2016/12/AC_hypothetical_drilling_header.jpg400900Matt Kelso, BAhttps://www.fractracker.org/a5ej20sjfwe/wp-content/uploads/2025/09/2025-Wordmark-Logo.pngMatt Kelso, BA2016-12-30 10:03:102021-04-15 15:04:18Hypothetical Impacts of Unconventional Drilling In Allegheny County
By Karen Edelstein, Eastern Program Coordinator, FracTracker Alliance
In an apparent move to step around compliance with comprehensive regulations outlined in the Endangered Species Act (ESA), a coalition of nine oil and gas corporations has filed a draft plan entitled the Oil & Gas Coalition Multi-State Habitat Conservation Plan (O&G HCP). The proposed plan, which would relax regulations on five species of bats, is unprecedented in scope in the eastern United States, both temporally and spatially. If approved, it would be in effect for 50 years, and cover oil and gas operations throughout the states of Ohio, Pennsylvania, and West Virginia—covering over 110,000 square miles. The oil and gas companies see the plan as a means of “streamlining” the permit processes associated with oil and gas exploration, production, and maintenance activities. Others outside of industry may wonder whether the requested permit is a broad over-reach of an existing loophole in the ESA.
Habitat fragmentation, air, and noise pollution that comes with oil and gas extraction and fossil fuel delivery activities have the potential to incidentally injure or kill bat species in the three-State plan area that are currently protected by the Endangered Species Act (ESA) of 1973. In essence, the requested “incidental take permit”, or ITP, would acknowledge that these companies would not be held to the same comprehensive regulations that are designed to safeguard the environment, particularly the flora and fauna at most risk to extirpation. Rather, they would simply be asked to insure that their impacts are “minimized and mitigated to the maximum extent practicable.”
Section 10(a)(2)(B) of the ESA contains provisions for issuing an ITP to a non-Federal entity for the take of endangered and threatened species, provided the following criteria are met:
The taking will be incidental
The applicant will, to the maximum extent practicable, minimize and mitigate the impact of such taking
The applicant will develop an HCP and ensure that adequate funding for the plan will be provided
The taking will not appreciably reduce the likelihood of survival and recovery of the species in the wild
The applicant will carry out any other measures that the Secretary may require as being necessary or appropriate for the purposes of the HCP
What activities would be involved?
The Northern Long-eared Bat is a federally-listed threatened species, also included in the ITP
The proposed plan, which would seek to exempt both upstream development activities (oil & gas wells) and midstream development activities (pipelines). Upstream activities include the creation of access roads, staging areas, seismic operations, land clearing, explosives; the development and construction of well fields, including drilling, well pad construction, disposal wells, water impoundments, communication towers; and other operations, including gas flaring and soil disturbance; and decommissioning and reclamation activities, including more land moving and excavation.
Midstream activities include the construction of gathering, transmission, and distribution pipeline, including land grading and stream construction, construction of compressor stations, meter stations, electric substations, storage facilities, and processing plants, and installation of roads, culverts, and ditches, to name just a few.
Companies involved in the proposed “Conservation Plan” represent the major players in fossil fuel extraction, refinement, and delivery in the region, and include:
Antero Resources Corporation
Ascent Resources, LLC
Chesapeake Energy Corporation
EnLink Midstream L.P.
EQT Corporation
MarkWest Energy Partners, L.P., MPLX L.P., and Marathon Petroleum Corporation (all part of same corporate enterprise)
Rice Energy, Inc.
Southwestern Energy Company
The Williams Companies, Inc.
Focal species of the request
Populations of federally-endangered Indiana Bats could be impacted by the proposed Incidental Take Permit (ITP)
The five species listed in the ITP include the Indiana Bat (a federally-listed endangered species) and Northern Long-eared Bat (a federally-listed threatened species), the Eastern Small-footed Bat (a threatened species protected under Pennsylvania’s Game and Wildlife Code), as well as the Little Brown Bat and Tri-colored Bat. Populations of all five species are already under dire threats due to white-nose syndrome, a devastating disease that, since 2008, has killed an estimated 5.7 million bats in North America. In some cases, entire local populations have succumbed to this deadly disease. Because bats already have a naturally low birthrate, bat populations that do survive this epidemic will be slow to rebound. Only recently, wildlife biologists have begun to see hope for a treatment in a beneficial bacterium that may save affected bats. However, production and deployment details of this treatment are still under development. Best summarized in a recent article in the Pittsburgh Post-Gazette:
This [ITP] would be a huge deal because we are dealing with species in a precipitous decline,” said Jared Margolis, an attorney with the Center for Biological Diversity, a national nonprofit conservation organization headquartered in Tucson, Ariz. “I don’t see how it could be biologically defensible. Even without the drilling and energy development we don’t know if these species will survive.
In 2012, Bat Conservation International produced a report for Delaware Riverkeeper, entitled Impacts of Shale Gas Development on Bat Populations in the Northeastern United States. The report focuses on landscape scale impacts that range from water quality threats, to disruption of winter hibernacula, the locations where bats hibernate during the winter, en masse. In addition, because bats have strong site fidelity to roosting trees or groups of trees, forest clearing for pipelines, well pads or other facilities may disproportionately impact local populations.
The below map, developed by FracTracker Alliance, shows the population ranges of all five bat species, as well as the current areas impacted by existing development by the oil and gas industry through well sites, pipelines, and other facilities.
To learn more details about the extensive oil and gas development in each of the impacted states, follow these links:
Oil and gas threat map for Pennsylvania. Currently, there are ~104,000 oil and gas wells, compressors, and other related facilities here.
Oil and gas threat map for Ohio. Currently, there are ~90,000 oil and gas wells, compressors, and other related facilities here.
Oil and gas threat map for West Virginia. Currently, there are ~16,000 oil and gas wells, compressors, and other related facilities here.
Public input options
The U.S. Fish and Wildlife Service (USFWS) announced in the Federal Register in late November 2016 its intent to prepare an environmental impact statement (EIS) and hold five public scoping sessions about the permit, as well as an informational webinar. In keeping with the parameters of an environmental impact statement, USFWS is particularly interested in input and information about:
Aspects of the human environment that warrant examination such as baseline information that could inform the analyses.
Information concerning the range, distribution, population size, and population trends concerning the covered species in the plan area.
Additional biological information concerning the covered species or other federally listed species that occur in the plan area.
Direct, indirect, and/or cumulative impacts that implementation of the proposed action (i.e., covered activities) will have on the covered species or other federally listed species.
Information about measures that can be implemented to avoid, minimize, and mitigate impacts to the covered species.
Other possible alternatives to the proposed action that the Service should consider.
Whether there are connected, similar, or reasonably foreseeable cumulative actions (i.e., current or planned activities) and their potential impacts on covered species or other federally listed species in the plan area.
The presence of archaeological sites, buildings and structures, historic events, sacred and traditional areas, and other historic preservation concerns within the plan area that are required to be considered in project planning by the National Historic Preservation Act.
Any other environmental issues that should be considered with regard to the proposed HCP and potential permit issuance.
The public comment period ends on December 27, 2016. Links to more information about locations of the public hearings, as well as instructions about how to sign up for the December 20, 2016 informational webinar can be found at this website. In addition, you can electronically submit comments about the “conservation plan” by following this link.
https://www.fractracker.org/a5ej20sjfwe/wp-content/uploads/2016/12/Eastern-small-footed-bat-header.jpg4301500Karen Edelsteinhttps://www.fractracker.org/a5ej20sjfwe/wp-content/uploads/2025/09/2025-Wordmark-Logo.pngKaren Edelstein2016-12-12 14:22:072021-04-15 15:04:19“Taking” Wildlife in PA, OH, WV
by Kirk Jalbert, Manager of Community-Based Research & Engagement with technical assistance from Seth Kovnant
In September, the Pennsylvania Department of Environmental Protection (DEP) rejected a number of permits for wetland crossings and sedimentation control that were required for Sunoco Pipeline’s proposed “Mariner East 2” pipeline. According to Sunoco, the proposed Mariner East 2 is a $2.5 billion, 350-mile-long pipeline that would be one of the largest pipeline construction projects in Pennsylvania’s history.
If built, Mariner East 2 could transport up to 450,000 barrels (18,900,000 gallons) per day of propane, ethane, butane, and other liquefied hydrocarbons from the shale fields of western Pennsylvania to export terminals in Marcus Hook, located just outside Philadelphia. A second proposed pipeline, if constructed, could carry an additional 250,000 barrels (10,500,000 gallons) per day of these same materials. Sunoco submitted revised permit applications to PADEP on Tuesday, December 6th.
The industry often refers to ethane, propane and butane collectively as “natural gas liquids.” They are classified by the federal government as “hazardous, highly volatile liquids,” but that terminology is also misleading. These materials, which have not been transported through densely populated southeast Pennsylvania previously, are liquid only at very high pressure or extremely cold temperatures. At the normal atmospheric conditions experienced outside the pipeline, these materials volatilize into gas which is colorless; odorless; an asphyxiation hazard; heavier than air; and extremely flammable of explosive. This gas can travel downhill and downwind for long distances while remaining combustible. It can collect (and remain for long periods of time) in low-lying areas; and things as ordinary as a cell phone, a doorbell or a light switch are capable of providing an ignition source.
Many who have followed the proposed Mariner East 2 project note that, while much has been written about the likely environmental impacts, insufficient investigation has been conducted into safety risks to those who live, work and attend schools in the proposed pipeline’s path. We address these risks in this article, and, in doing so, emphasize the importance of regulatory agencies allowing public comments on the project’s resubmitted permit applications.
The Inherent Risks of Artificially Liquified Gas
Resident of Pennsylvania do not need to look far for examples of how pipeline accidents pose serious risk. For instance, the 2015 explosion of the Enterprise ATEX (Appalachia to Texas) pipeline near Follansbee, WV, provides a depiction of what a Mariner East 2 pipeline failure could look like. This 20-inch diameter pipeline carrying liquid ethane is similar in many ways to the proposed Mariner East 2. When it ruptured in rural West Virginia, close to the Pennsylvania border, it caused damage in an area that extended 2,000 feet—about ½ square mile—from the place where the pipeline failed.
In another recent instance, the Spectra Energy Texas Eastern methane natural gas pipeline ruptured in Salem, PA, this April as a result of corroded welding. The explosion, seen above (photo by PA NPR State Impact), completely destroyed a house 200ft. away. Another house, 800ft. away, sustained major damage and its owner received 3rd degree burns. These incidents are not unique. FracTracker’s recent analysis found that there have been 4,215 pipeline incidents nation-wide since 2010, resulting in 100 reported fatalities, 470 injuries, and property damage exceeding $3.4 billion (“incident” is an industry term meaning “a pipeline failure or inadvertent release of its contents.” It does not necessarily connote “a minor event”).
Calculating Immediate Ignition Impact Zones
It is difficult to predict the blast radius for materials like ethane, propane and butane. Methane, while highly flammable or explosive, is lighter than air and so tends to disperse upon release into the atmosphere. Highly volatile liquids like ethane, propane and butane, on the other hand, tend to concentrate close to the ground and to spread laterally downwind. A large, dispersed vapor cloud of these materials may quickly spread great distances, even under very light wind conditions. A worst-case scenario would by highly variable since gas migration and dispersion is dependent on topography, leak characteristics, and atmospheric conditions. In this scenario, unignited gas would be allowed to migrate as an unignited vapor cloud for a couple miles before finding an ignition source that causes an explosion that encompasses the entire covered area tracing back to the leak source. Ordinary devices like light switches or cell phones can serve as an ignition source for the entire vapor cloud. One subject matter expert recently testified before a Municipal Zoning Hearing board that damage could be expected at a distance of three miles from the source of a large scale release.
The federal government’s “potential impact radius” (PIR) formula, used for natural gas (methane) isn’t directly applicable because of differences in the characteristics of the material. It may however be possible to quantify an Immediate Ignition Impact Zone. This represents the explosion radius that could occur if ignition occurs BEFORE the gas is able to migrate.
The Pipeline and Hazardous Materials Safety Administration (PHMSA) provides instructions for calculating the PIR of a methane natural gas pipeline. The PIR estimates the range within which a potential failure could have significant impact on people or property. The PIR is established using the combustion energy and pipeline-specific fuel mass of methane to determine a blast radius: PIR = 0.69*sqrt(p*d^2). Where: PIR = Potential Impact Radius (in feet), p = maximum allowable operating pressure (in pounds per square inch), d = nominal pipeline diameter (in inches), and 0.69 is a constant applicable to natural gas
The Texas Eastern pipeline can use the PIR equation as-is since it carries methane natural gas. However, since Mariner East 2 is primarily carrying ethane, propane, and butane NGLs, the equation must be altered. Ethane, propane, butane, and methane have very similar combustion energies (about 50-55 MJ/kg). Therefore, the PIR equation can be updated for each NGL based on the mass density of the flow material as follows: PIR = 0.69*sqrt(r*p*d^2). Where: r = the density ratio of hydrocarbons with similar combustion energy to methane natural gas. At 1,440 psi, methane remains a gas with a mass density 5 times less than liquid ethane at the same pressure:
The methane density relationships for ethane, propane, and butane can be used to calculate an immediate-ignition blast radius for each hydrocarbon product. The below table shows the results assuming a Mariner East 2-sized 20-inch diameter pipe operating at Mariner East 2’s 1,440psi maximum operating pressure:
Using these assumptions, the blast radius can be derived as a function of pressure for each hydrocarbon for the same 20in. diameter pipe:
ME2 Immediate Ignition Blast Radius
Note the sharp increase in blast radius for each natural gas liquid product. The pressure at which this sharp increase occurs corresponds with the critical pressure where each product transitions to a liquid state and becomes significantly denser, and in turn, contains more explosive power. These products will always be operated above their respective critical pressures when in transport, meaning their blast radius will be relatively constant, regardless of operating pressure.
Averaging the “Immediate Ignition Blast Radius” for ethane, propane, and butane gives us a 1,300 ft (about 0.25 mile) potential impact radius. However, we must recognize that this buffer represents a best case scenario in the event of a major pipeline accident.
FracTracker has created a new map of the Mariner East 2 pipeline using a highly-detailed GIS shapefile recently supplied by the DEP. On this map, we identify a 0.5 mile radius “buffer” from Mariner East 2’s proposed route. We then located all public and private schools, environmental justice census tracts, and estimated number of people who live within this buffer in order to get a clearer picture of the pipeline’s hidden risks.
Proposed Mariner East 2 and At-Risk Schools and Populations
In order to estimate the number of people who live within this 0.5 mile radius, we first identified census blocks that intersect the hazardous buffer. Second, we calculated the percentage of that census block’s area that lies within the buffer. Finally, we used the ratio to determine the percentage of the block’s population that lies within the buffer. In total, there are an estimated 105,419 people living within the proposed Mariner East 2’s 0.5 mile radius impact zone. The totals for each of the 17 counties in Mariner East 2’s trajectory can be found in the interactive map. The top five counties with the greatest number of at-risk residents are:
Chester County (31,632 residents in zone)
Delaware County (17,791 residents in zone)
Westmoreland County (11,183 residents in zone)
Cumberland County (10,498 residents in zone)
Berks County (7,644 residents in zone)
Environmental Justice Areas
Environmental justice designations are defined by the DEP as any census tract where 20% or more of the population lives in poverty and/or 30% or more of the population identifies as a minority. These numbers are based on data from the U.S. Census Bureau, last updated in 2010, and by the federal poverty guidelines. Mariner East 2 crosses through four environmental justice areas:
Census Tract 4064.02, Delaware County
Census Tract 125, Cambria County
Census Tract 8026, Westmoreland County
Census Tract 8028, Westmoreland County
DEP policies promise enhanced public participation opportunities in environmental justice communities during permitting processes for large development projects. No additional public participation opportunities were provided to these communities. Furthermore, no public hearings were held whatsoever in Cambria County and Delaware County. The hearing held in Westmoreland County took place in Youngwood, nine miles away from Jeanette. Pipelines are not specified on the “trigger list” that determines what permits receive additional scrutiny, however the policy does allow for “opt-in permits” if the DEP believes they warrant special consideration. One would assume that a proposed pipeline project with the potential to affect the safety of tens of thousands of Pennsylvanians qualifies for additional attention.
At-Risk Schools
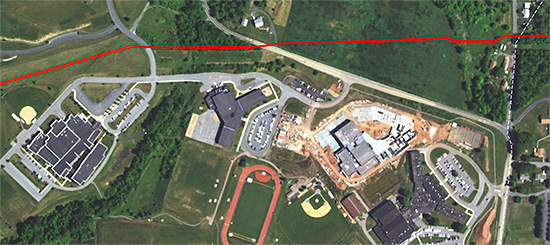
One of the most concerning aspects of our findings is the astounding number of schools in the path of Mariner East 2. Based on data obtained from the U.S. Department of Education on the locations of schools in Pennsylvania, a shocking 23 public (common core) schools and 17 private schools were found within Mariner East 2’s 0.5 mile impact zone. In one instance, a school was discovered to be only 7 feet away from the pipeline’s intended path. Students and staff at these schools have virtually no chance to exercise their only possible response to a large scale release of highly volatile liquids, which is immediate on-foot evacuation.
Middletown High School in Dauphin County in close proximity to ME2
One reason for the high number of at-risk schools is that Mariner East 2 is proposed to roughly follow the same right of way as an older pipeline built in the 1930s (now marketed by Sunoco as “Mariner East 1.”). A great deal of development has occurred since that time, including many new neighborhoods, businesses and public buildings. It is worth noting that the U.S. Department of Education’s data represents the center point of schools. In many cases, we found playgrounds and other school facilities were much closer to Mariner East 2, as can be seen in the above photograph. Also of note is the high percentage of students who qualify for free or reduced lunch programs at these schools, suggesting that many are located in disproportionately poorer communities.
Now that PADEP has received revised permit applications from Sunoco, presumably addressing September’s long list of technical deficiencies, the agency will soon make a decision as to whether or not additional public participation is required before approving the project. Given the findings in our analysis, it should be clear that the public must have an extended opportunity to review and comment on the proposed Mariner East 2. In fact, public participation was extremely helpful to DEP in the initial review process, providing technical and contextual information.
It is, furthermore, imperative that investigations into the potential impacts of Mariner East 2 extend to assess the safety of nearby residents and students, particularly in marginalized communities. Thus far, no indication has been made by the DEP that this will be the case. However, the Pennsylvania Sierra Club has established a petition for residents to voice their desire for a public comment period and additional hearings.
Seth Kovnat is the chief structural engineer for an aerospace engineering firm in Southeastern PA, and regularly consults with regard to the proposed Mariner East 2 pipeline. In November, Seth’s expertise in structural engineering and his extensive knowledge of piping and hazardous materials under pressure were instrumental in providing testimony at a Pennsylvania Senate and House Veterans Affairs and Emergency Preparedness Committee discussion during the Pennsylvania Pipeline Infrastructure Citizens Panel. Seth serves on the board of Middletown Coalition for Community Safety and is a member of the Mariner East 2 Safety Advisory Committee for Middletown Township, PA. He is committed to demonstrating diligence in gathering, truth sourcing, and evaluating technical information in pipeline safety matters in order to provide data driven information-sharing on a community level.
NOTE: This article was modified on 12/9/16 at 4pm to provide additional clarification on how the 1,300ft PIR was calculated, and the map was modified on 11/4/2021 to add the 1,300 ft Thermal Impact Zone Buffer, which was previously mislabeled as the half-mile Buffer
https://www.fractracker.org/a5ej20sjfwe/wp-content/uploads/2016/12/ME2_schools_header.jpg400900FracTracker Alliancehttps://www.fractracker.org/a5ej20sjfwe/wp-content/uploads/2025/09/2025-Wordmark-Logo.pngFracTracker Alliance2016-12-09 08:36:102021-11-04 15:58:45Mariner East 2: At-Risk Schools and Populations
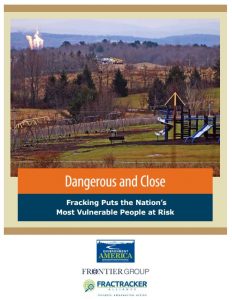
Cover of Dangerous and Close report. Click to view report
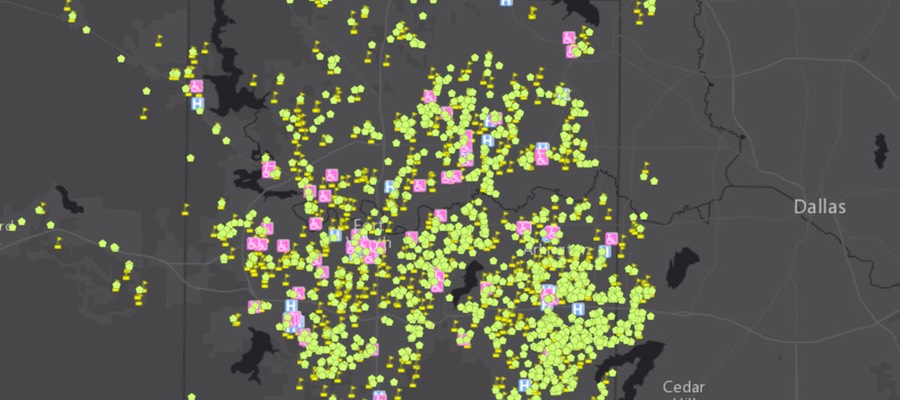
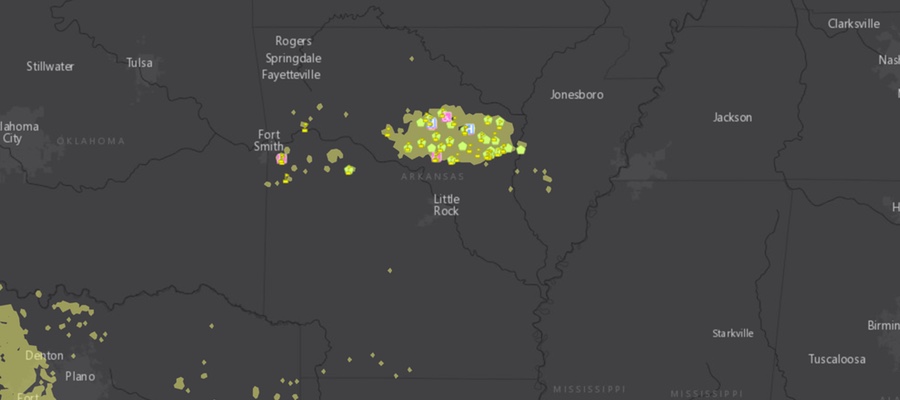
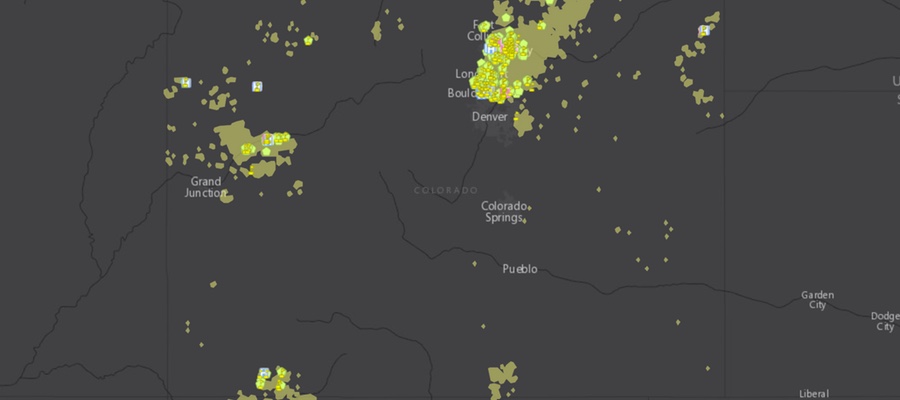
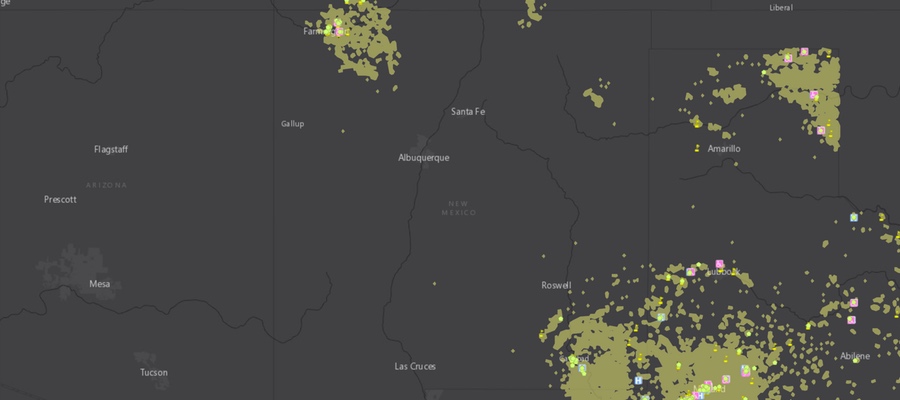
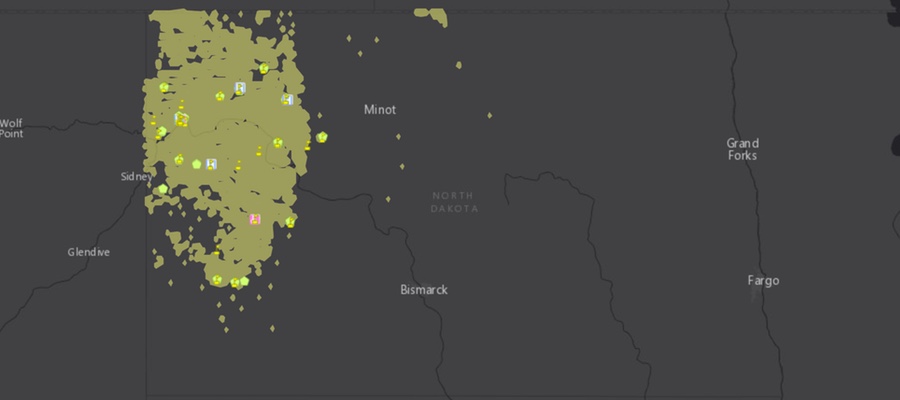
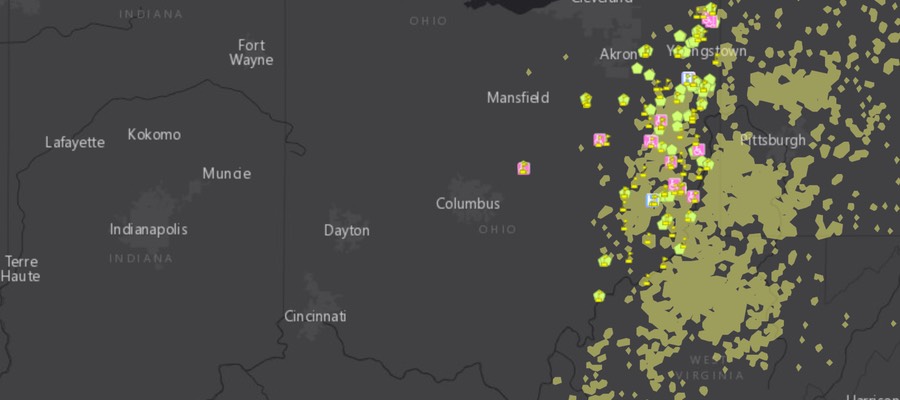
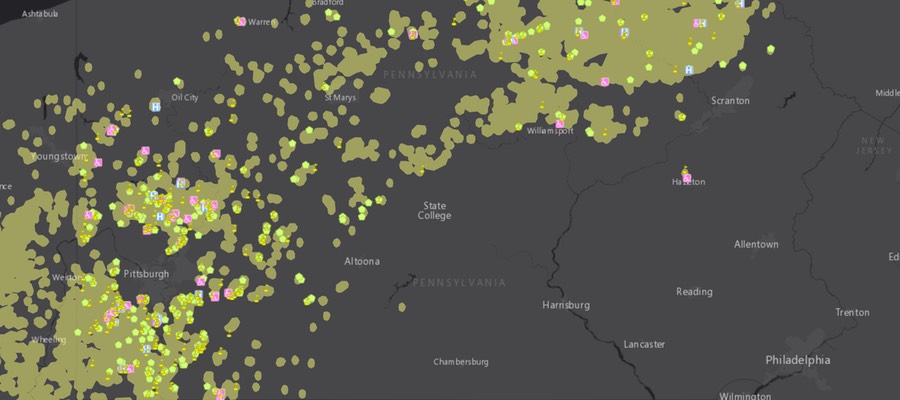
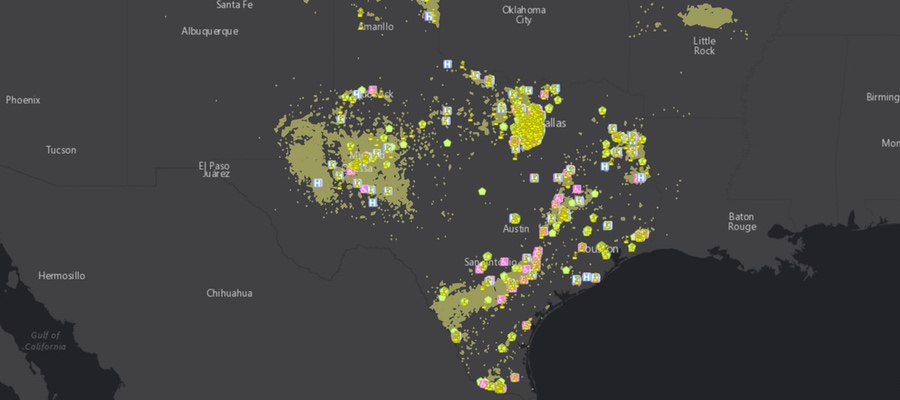
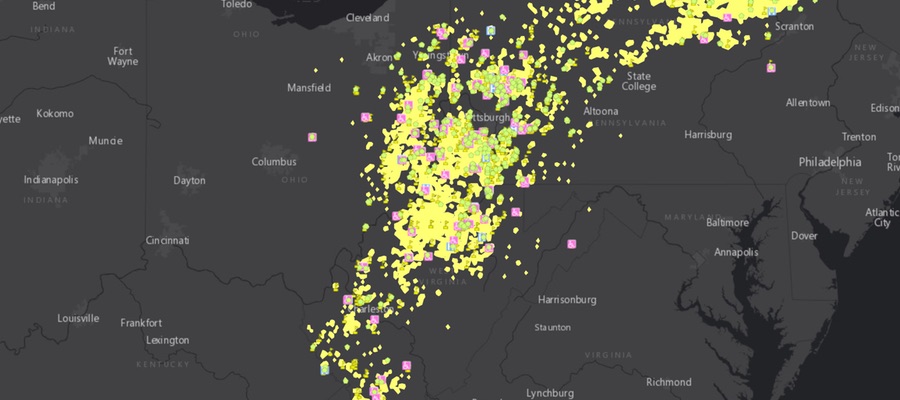
FracTracker Alliance has been working with the Frontier Group and Environment America on a nationwide assessment of “fracked” oil and gas wells. The report is titled Dangerous and Close, Fracking Puts the Nation’s Most Vulnerable People at Risk. The assessment analyzed the locations of fracked wells and identified where the fracking has occurred near locations where sensitive populations are commonly located. These sensitive sites include schools and daycare facilities because they house children, hospitals because the sick are not able to fight off pollution as effectively, and nursing homes where the elderly need and deserve clean environments so that they can be healthy, as well. The analysis used data on fracked wells from regulatory agencies and FracFocus in nine states. Maps of these nine states, as well as a full national map are shown below.
No one deserves to suffer the environmental degradation that can accompany oil and gas development – particularly “fracking” – in their neighborhoods. Fracked oil and gas wells are shown to have contaminated drinking water, degrade air quality, and sicken both aquatic and terrestrial ecosystems. Additionally, everybody responds differently to environmental pollutants, and some people are much more sensitive than others. In fact, certain sects of the population are known to be more sensitive in general, and exposure to pollution is much more dangerous for them. These communities and populations need to be protected from the burdens of industries, such as fracking for oil and gas, that have a negative effect on their environment. Commonly identified sensitive groups or “receptors” include children, the immuno-compromised and ill, and the elderly. These groups are the focus of this new research.
National Map
National interactive map of sensitive receptors near fracked wells
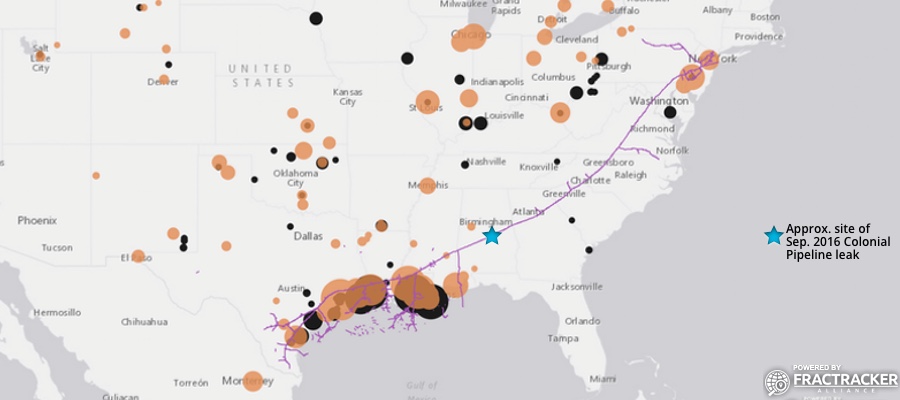
On September 9, 2016 a pipeline leak was detected from the Colonial Pipeline by a mine inspector in Shelby County, Alabama. It is estimated to have spilled ~336,000 gallons of gasoline, resulting in the shutdown of a major part of America’s gasoline distribution system. As such, we thought it timely to provide some data and a map on the Colonial Pipeline Project.
Figure 1. Dynamic map of Colonial Pipeline route and related infrastructure
The Colonial Pipeline was built in 1963, with some segments dating back to at least 1954. Colonial carries gasoline and other refined petroleum projects throughout the South and Eastern U.S. – originating at Houston, Texas and terminating at the Port of New York and New Jersey. This ~5,000-mile pipeline travels through 12 states and the Gulf of Mexico at one point. According to available data, prior to the September 2016 incident for which the cause is still not known, roughly 113,382 gallons had been released from the Colonial Pipeline in 125 separate incidents since 2010 (Table 1).
Table 1. Reported Colonial Pipeline incident impacts by state, between 3/24/10 and 7/25/16
State
Incidents (#)
Barrels* Released
Total Cost ($)
AL
10
91.49
2,718,683
GA
11
132.38
1,283,406
LA
23
86.05
1,002,379
MD
6
4.43
27,862
MS
6
27.36
299,738
NC
15
382.76
3,453,298
NJ
7
7.81
255,124
NY
2
27.71
88,426
PA
1
0.88
28,075
SC
9
1639.26
4,779,536
TN
2
90.2
1,326,300
TX
19
74.34
1,398,513
VA
14
134.89
15,153,471
Total**
125
2699.56
31,814,811
*1 Barrel = 42 U.S. Gallons
** The total amount of petroleum products spilled from the Colonial Pipeline in this time frame equates to roughly 113,382 gallons. This figure does not include the September 2016 spill of ~336,000 gallons.
Unfortunately, the Colonial Pipeline has also been the source of South Carolina’s largest pipeline spill. The incident occurred in 1996 near Fork Shoals, South Carolina and spilled nearly 1 million gallons of fuel into the Reedy River. The September 2016 spill has not reached any major waterways or protected ecological areas, to-date.
Additional Details
Owners of the pipeline include Koch Industries, South Korea’s National Pension Service and Kohlberg Kravis Roberts, Caisse de dépôt et placement du Québec, Royal Dutch Shell, and Industry Funds Management.
For more details about the Colonial Pipeline, see Table 2.
Table 2. Specifications of the Colonial and/or Intercontinental pipeline
https://www.fractracker.org/a5ej20sjfwe/wp-content/uploads/2016/09/ColonialPipeline-Feature.jpg400900FracTracker Alliancehttps://www.fractracker.org/a5ej20sjfwe/wp-content/uploads/2025/09/2025-Wordmark-Logo.pngFracTracker Alliance2016-09-26 13:35:032021-04-15 15:04:25A Proper Picture of the Colonial Pipeline’s Past
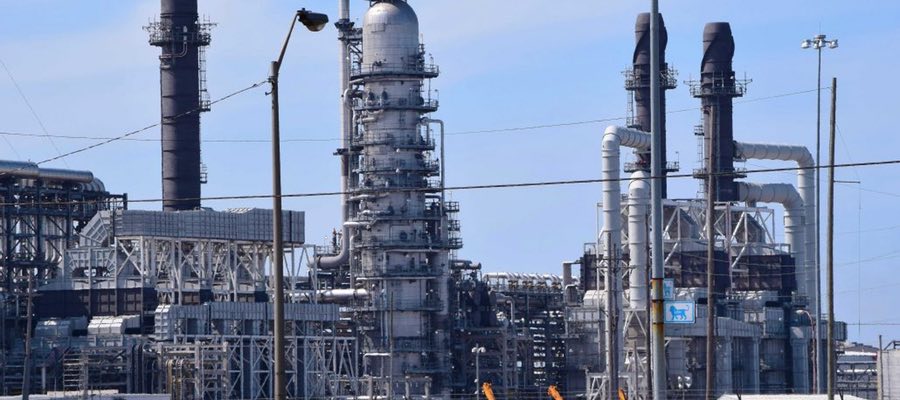
How annual incomes in the shadow of oil refineries compare to state and regional prosperity
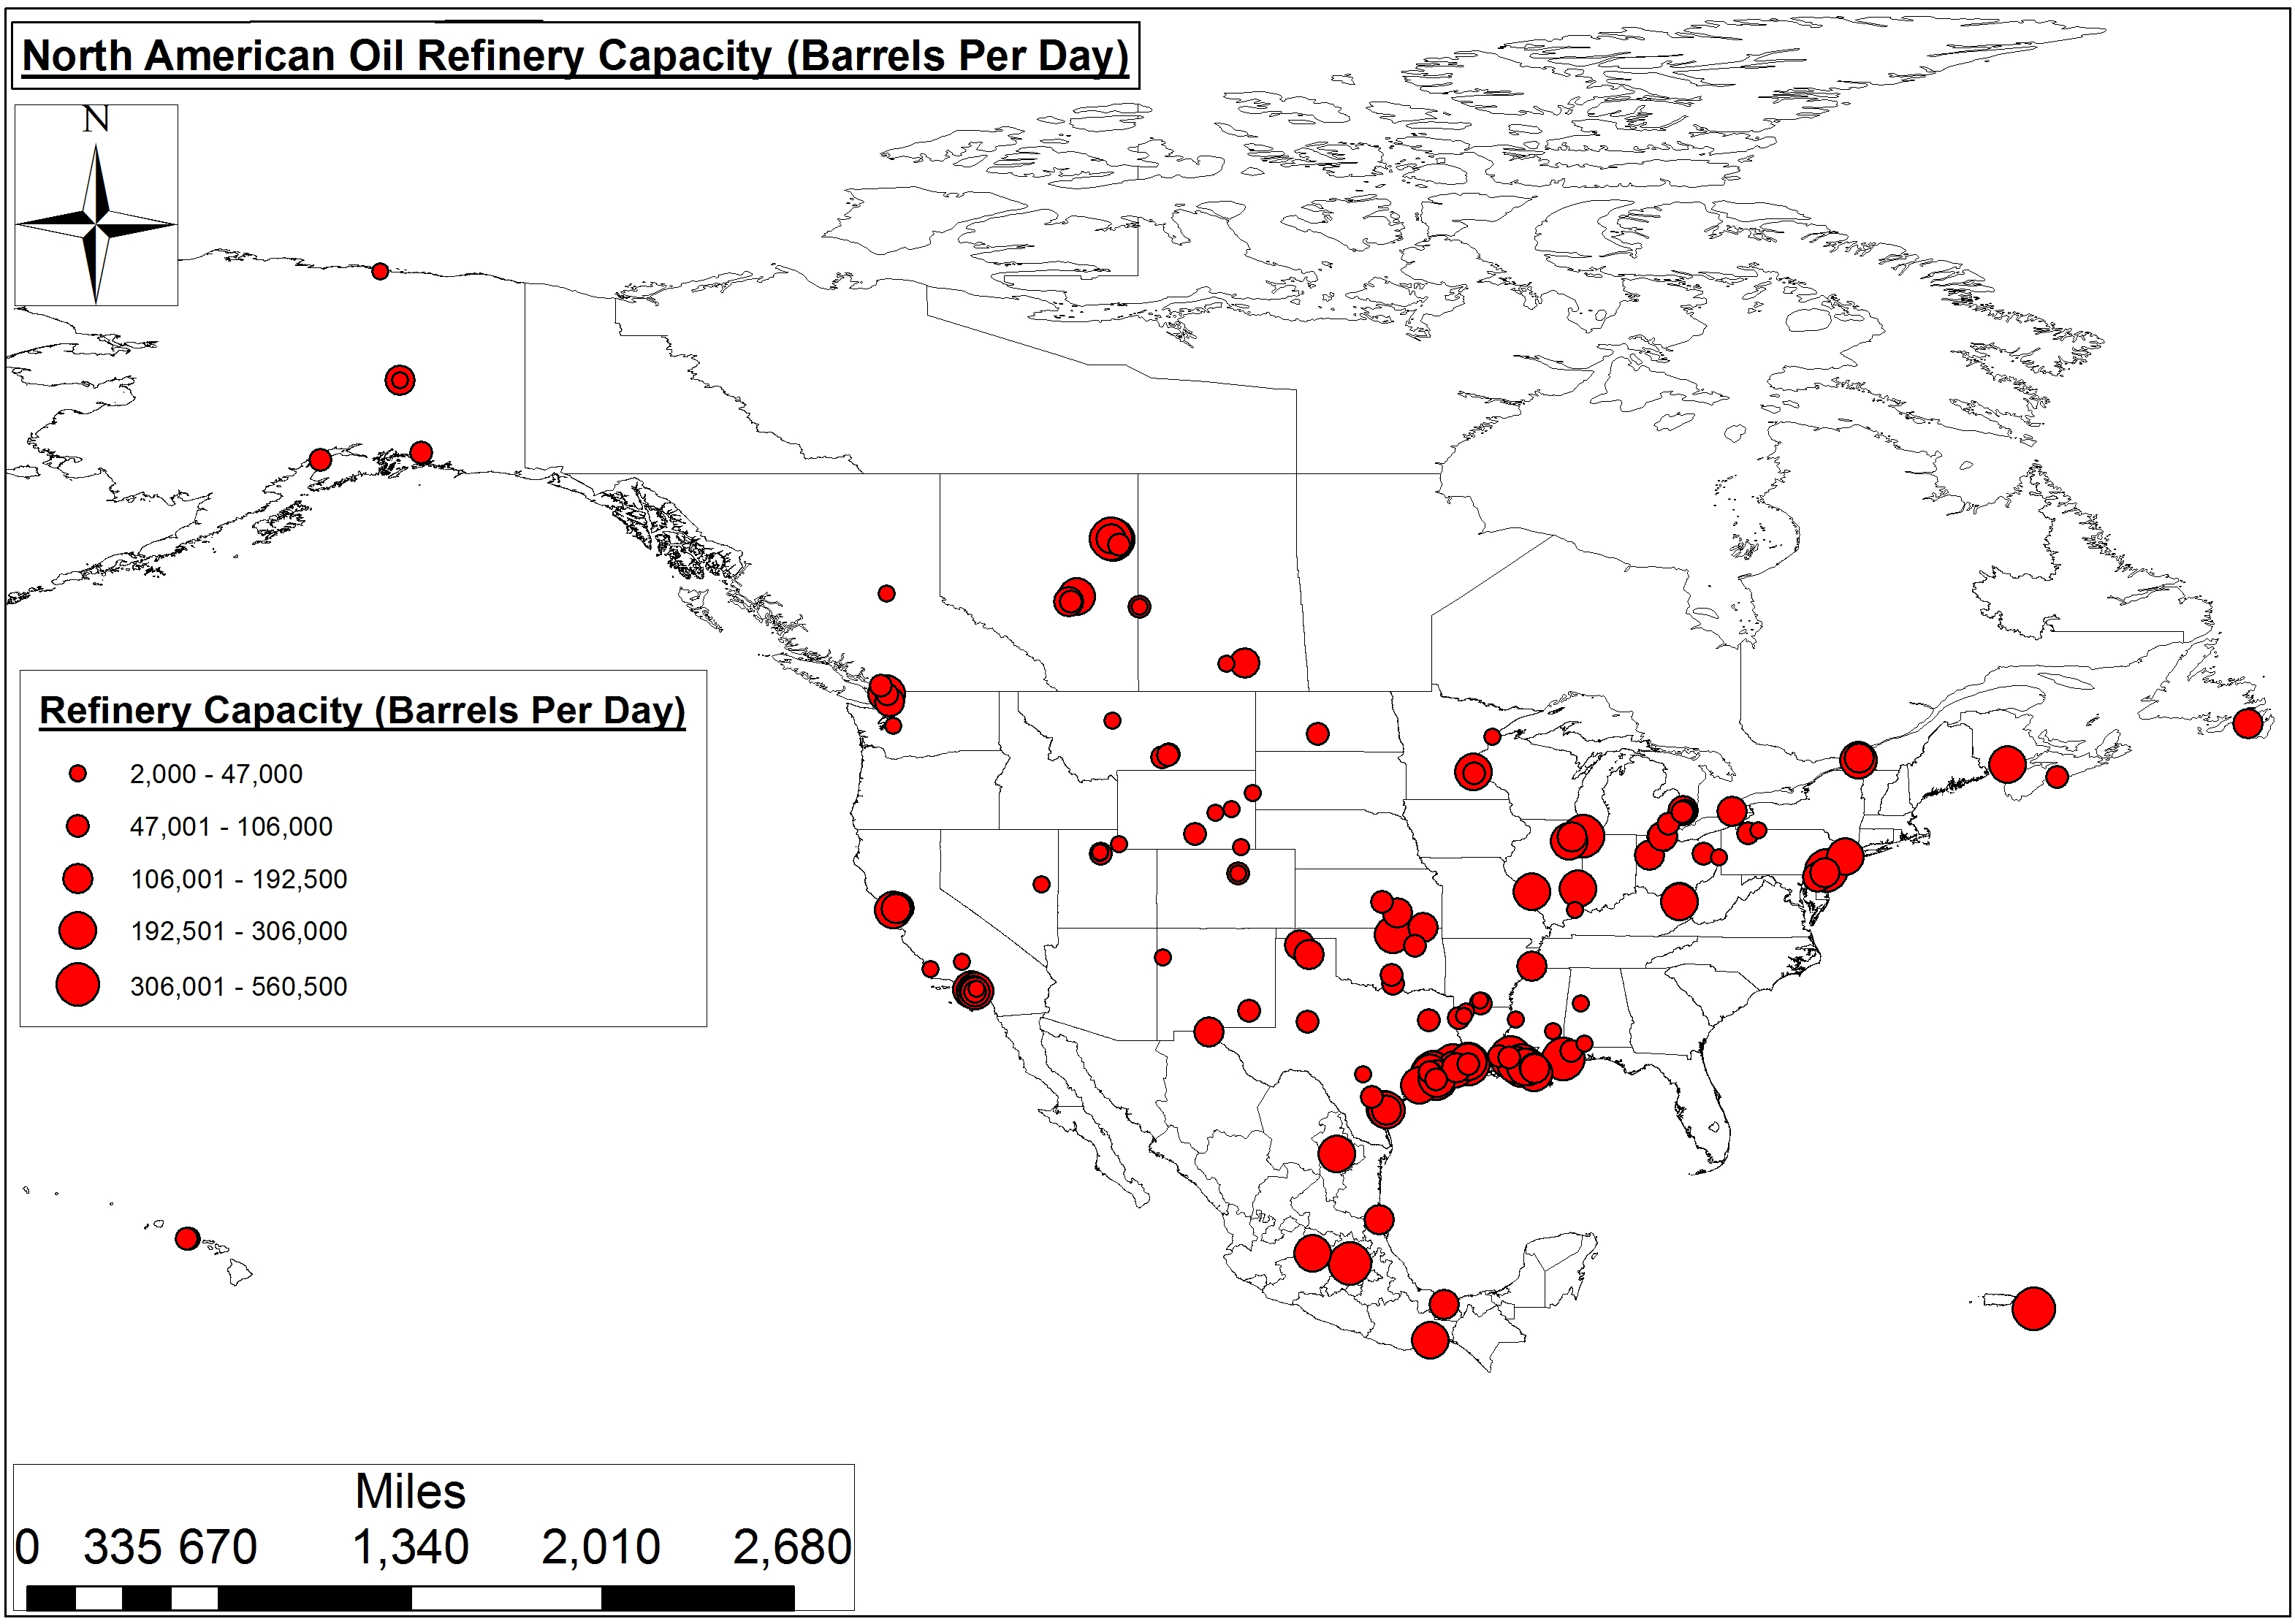
Figure 1. North American Oil Refinery Capacity
Typically, we analyze the potential economic impacts of oil refineries by simply quantifying potential and/or actual capacity on an annual or daily basis. Using this method, we find that the 126 refineries operating in the U.S. produce an average of 100,000-133,645 barrels per day (BPD) of oil – or 258 billion gallons per year.
In all of North America, there are 158 refineries. When you include the 21 and 27 billion gallons per year produced by our neighbors to the south and north, respectively, North American refineries account for 23-24% of the global refining capacity. That is, of course, if you believe the $113 dollar International Energy Agency’s 2016 “Medium-Term Oil Market Report” 4.03 billion gallon annual estimates (Table 1 and Figure 1).
Table 1. Oil Refinery Capacity in the United States and Canada (Barrels Per Day (BPD))
Prince George & Moose Jaw Refining in BC and SK, 12-15K BPD
Pemex’s Ciudad Madero Refinery, 152K BPD
—
High
Exxon Mobil in TX & LA, 502-560K BPD
Valero and Irving Oil Refining in QC & NS, 265-300K BPD
Pemex’s Tula Refinery, 340K BPD
—
Median
100,000 BPD
85,000 BPD
226,500
109,000
Total Capacity
16.8 MBPD
1.8 MBPD
1.4 MBPD
22.1 MBPD
Census Tract Income Disparities
However, we would propose that an alternative measure of a given oil refinery’s impact would be neighborhood prosperity in the census tract(s) where the refinery is located. We believe this figure serves as a proxy for economic justice. As such, we recently used the above refinery location and capacity data in combination with US Census Bureau Cartographic Boundaries (i.e., Census Tracts) and the Census’ American FactFinder clearinghouse to estimate neighborhood prosperity near refineries.
Methods
Our analysis involved merging oil refineries to their respective census tracts in ArcMAP 10.2, along with all census tracts that touch the actual census tract where the refineries are located, and calling that collection the oil refinery’s sphere of influence, for lack of a better term. We then assigned Mean Income in the Past 12 Months (In 2014 Inflation-Adjusted Dollars) values for each census tract to the aforementioned refinery tracts – as well as surrounding regional, city, and state tracts – to allow for a comparison of income disparities. We chose to analyze mean income instead of other variables such as educational attainment, unemployment, or poverty percentages because it largely encapsulates these economic indicators.
In today’s world, the enormous gap in the distribution of wealth, income and public benefits is growing ever wider, reflecting a general trend that is morally unfair, politically unwise and economically unsound… excessive income inequality restricts social mobility and leads to social segmentation and eventually social breakdown…In the modern context, those concerned with social justice see the general increase in income inequality as unjust, deplorable and alarming. It is argued that poverty reduction and overall improvements in the standard of living are attainable goals that would bring the world closer to social justice.
Environmental regulatory agencies like to separate air pollution sources into point and non-point sources. Point sources are “single, identifiable” sources, whereas non-point are more ‘diffuse’ resulting in impacts spread out over a larger geographical area. We would equate oil refineries to point sources of socioeconomic and/or environmental injustice. The non-point analysis would be far more difficult to model given the difficulties associated with converting perceived quality of life disturbance(s) associated with infrastructure like compressor stations from the anecdotal to the empirical.
Results
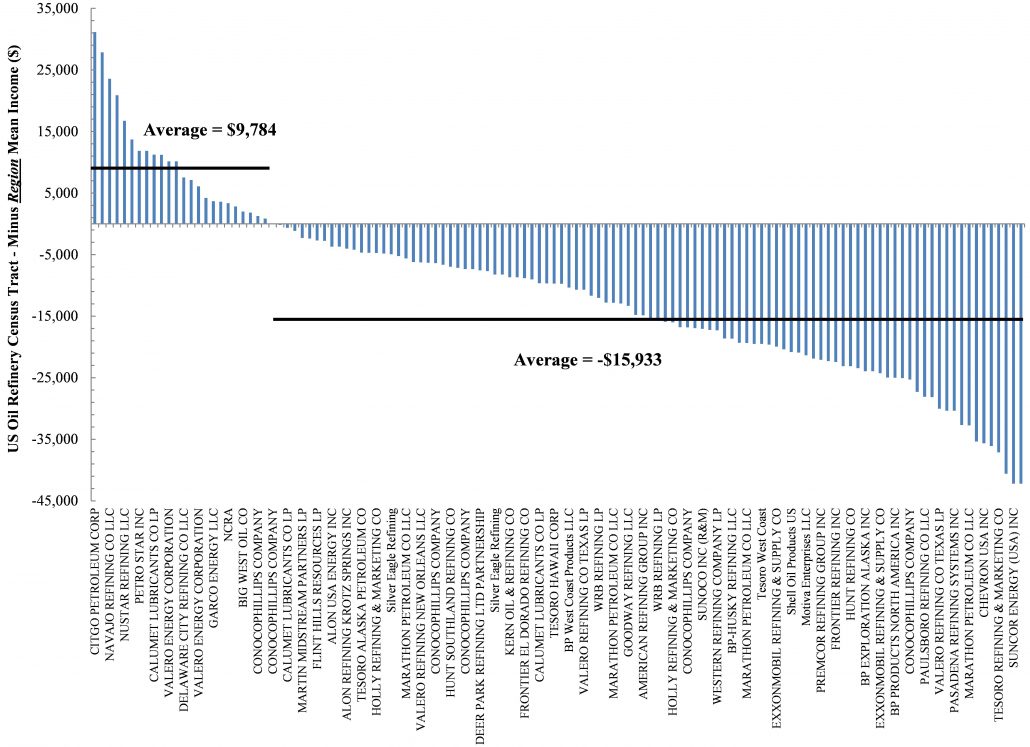
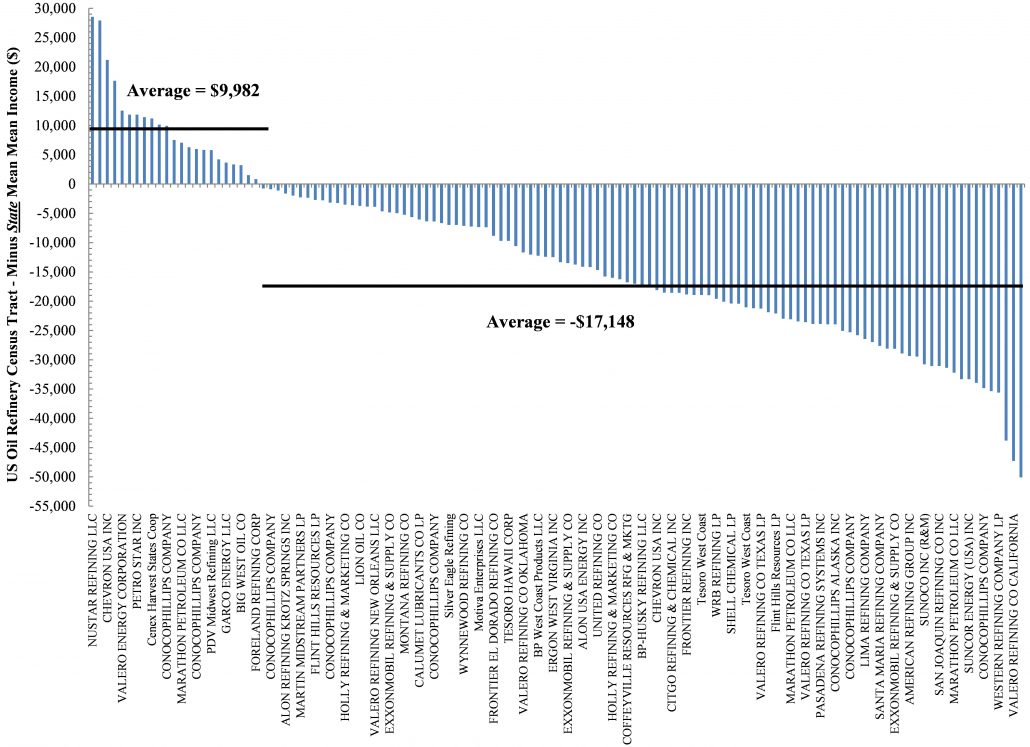
Primarily, residents living in the shadow of 80% of our refineries earn nearly $16,000 less than those in the surrounding region – or, in the case of urban refineries, the surrounding Metropolitan Statistical Areas (MSAs). Only residents living in census tracts within the shadow of 25 of our 126 oil refineries earn around $10,000 more annually than those in the region.
On average, residents of census tracts that contain oil refineries earn 13-16% less than those in the greater region and/or MSAs (Figure 2). Similarly, in comparing oil refinery census tract incomes to state averages we see a slightly larger 17-21% disparity (Figure 3).
Digging Deeper
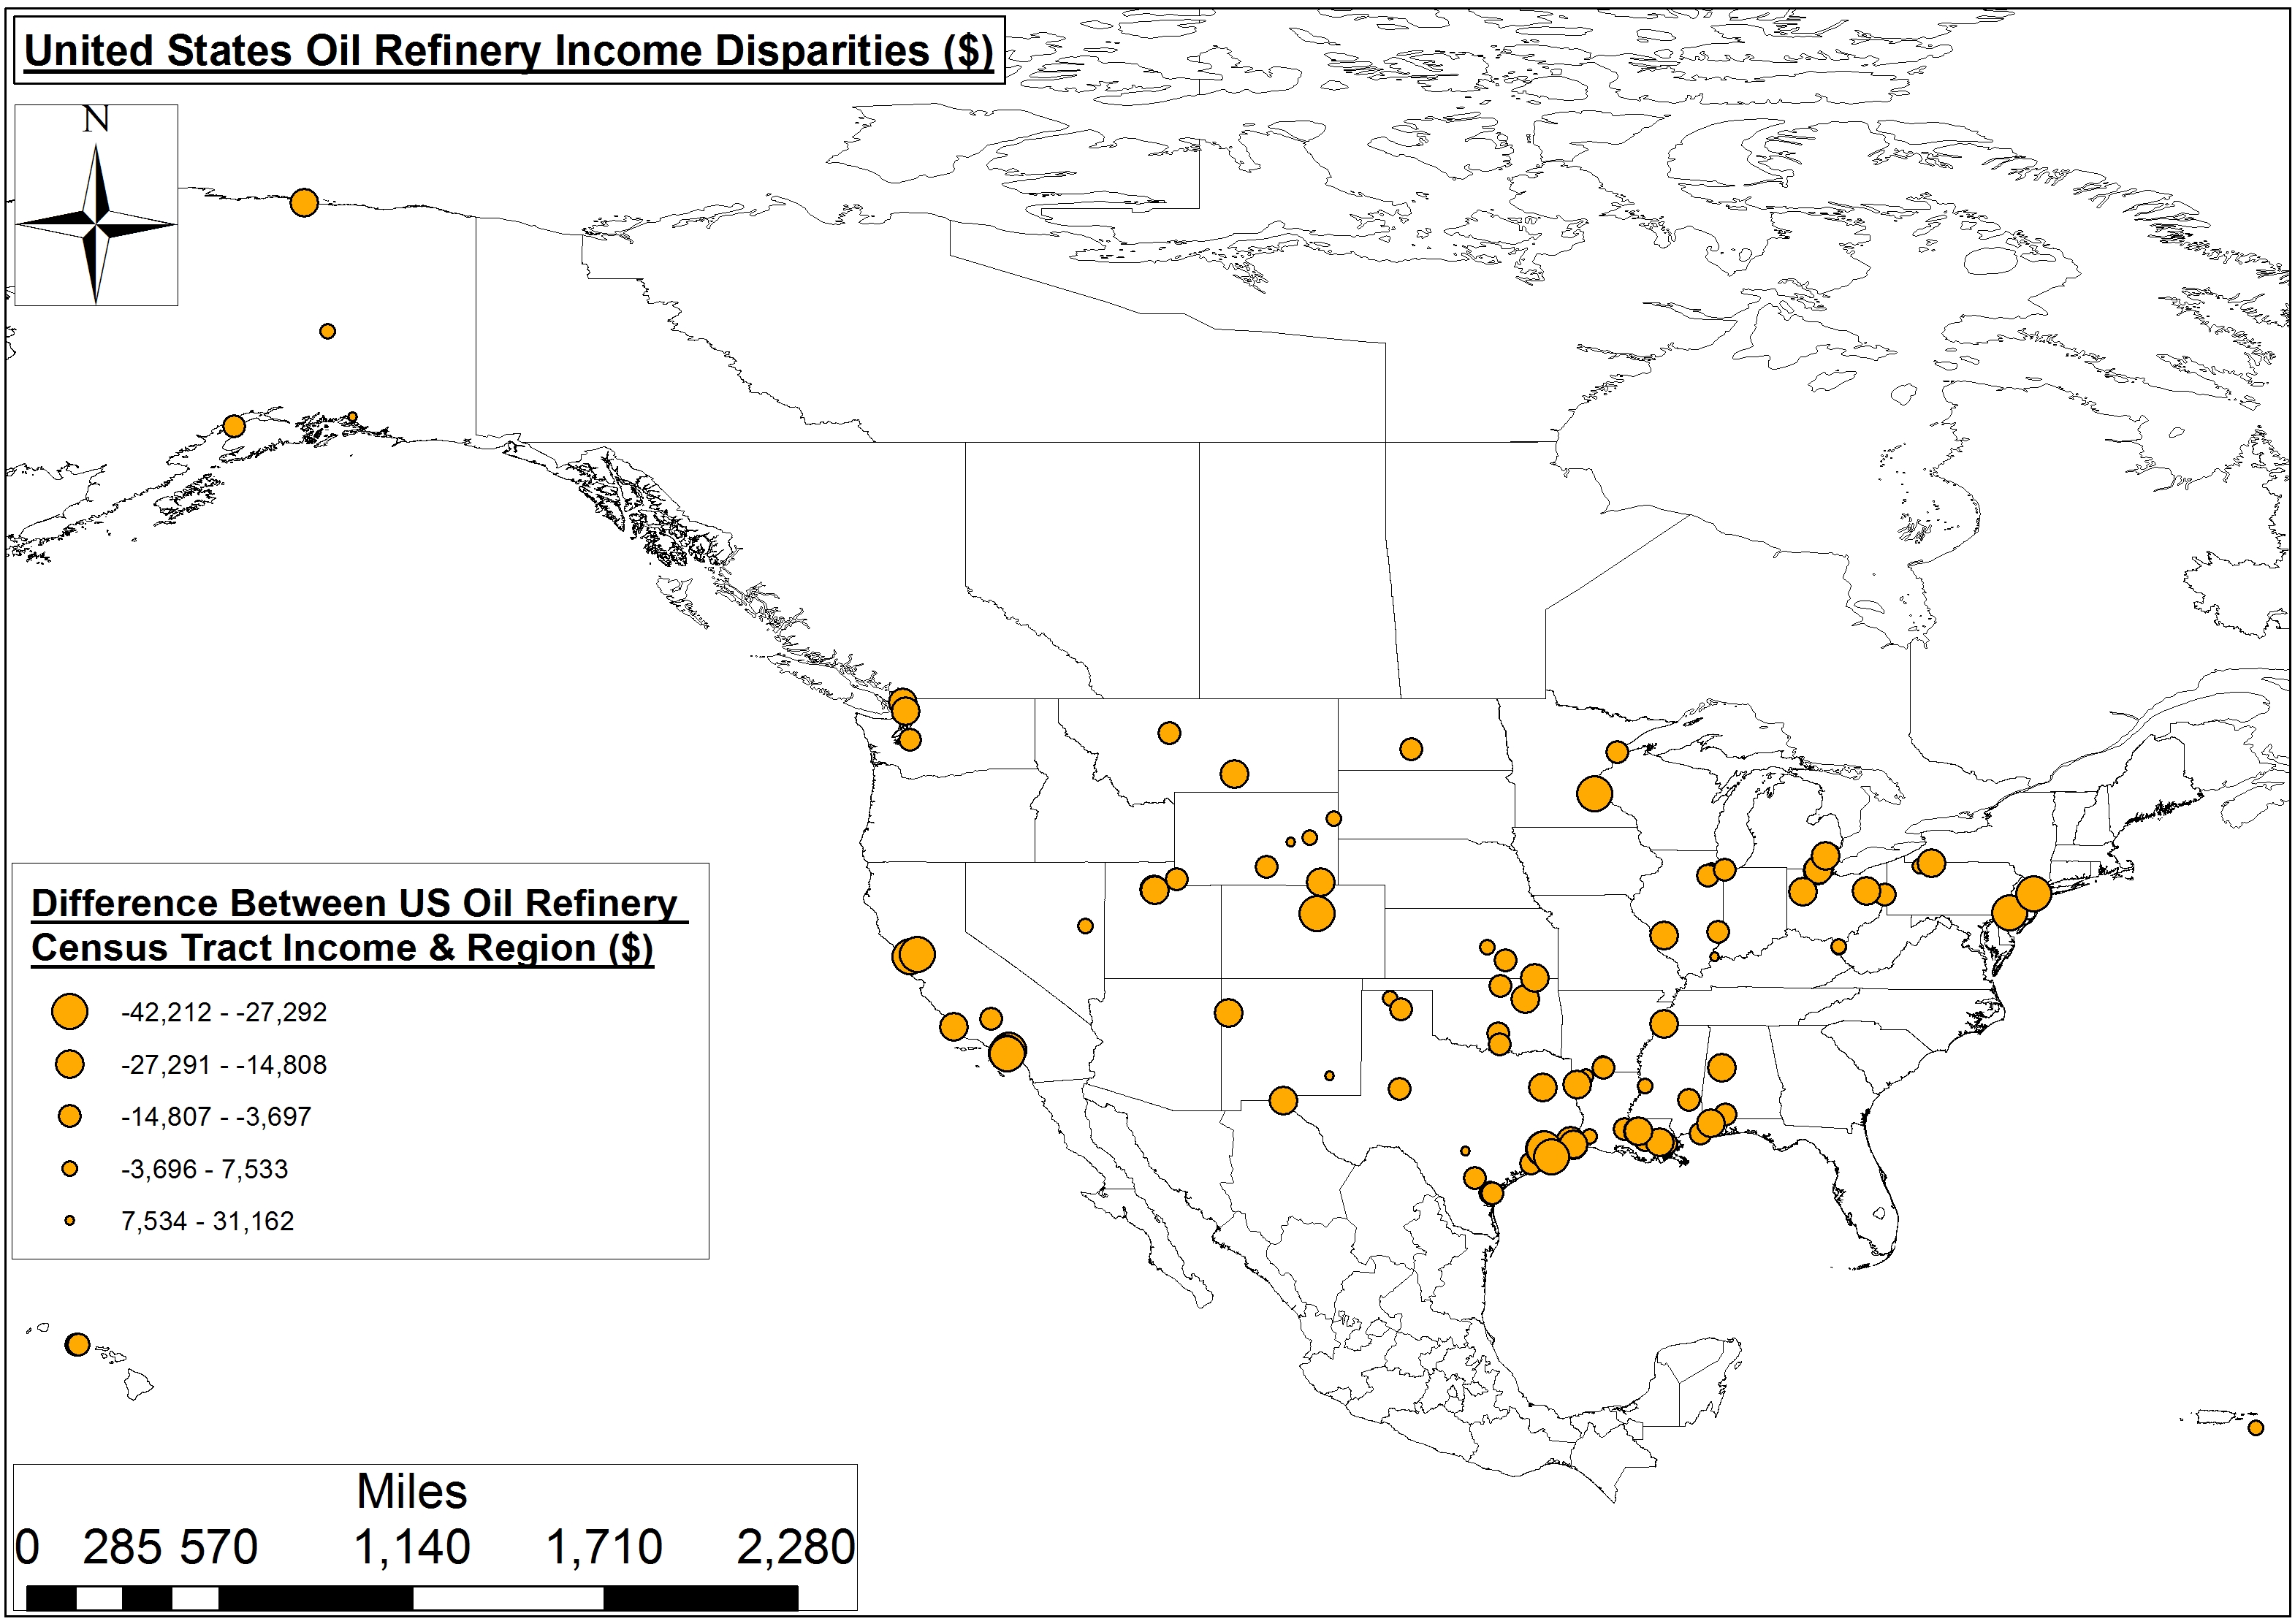
Figure 4. United States Oil Refinery Income Disparities (Note: Larger points indicate oil refinery census tracts that earn less than the surrounding region or city.)
Oil refinery income disparities seem to occur not just in one region, but across the U.S. (Figure 4).
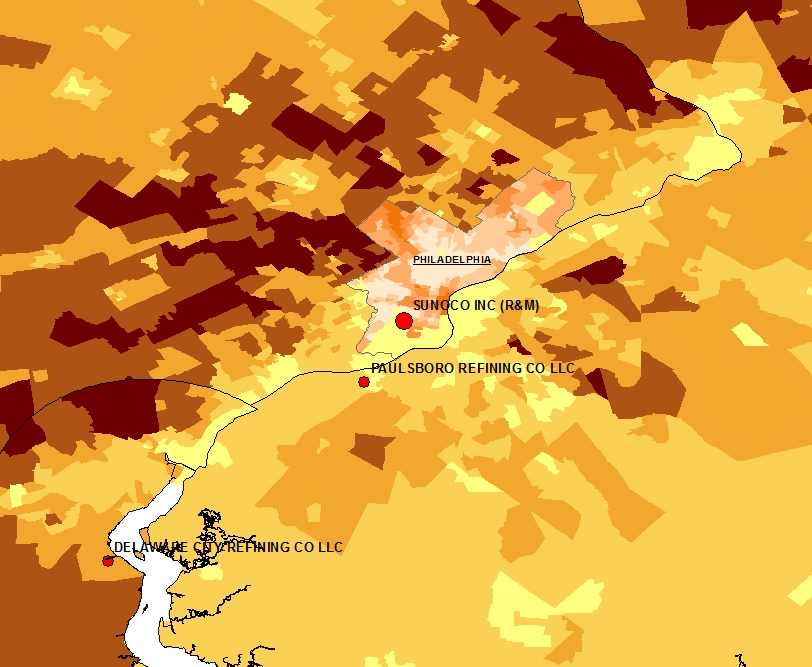
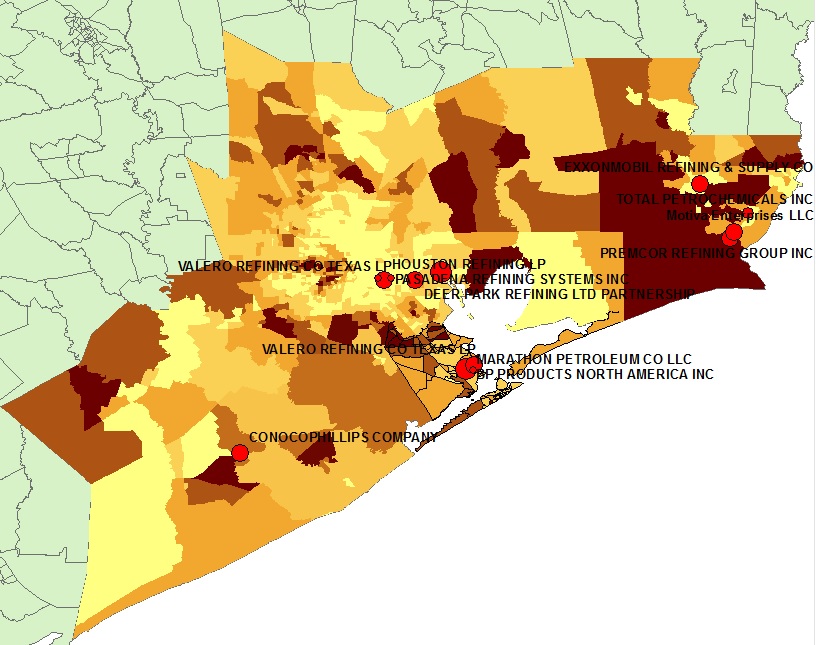
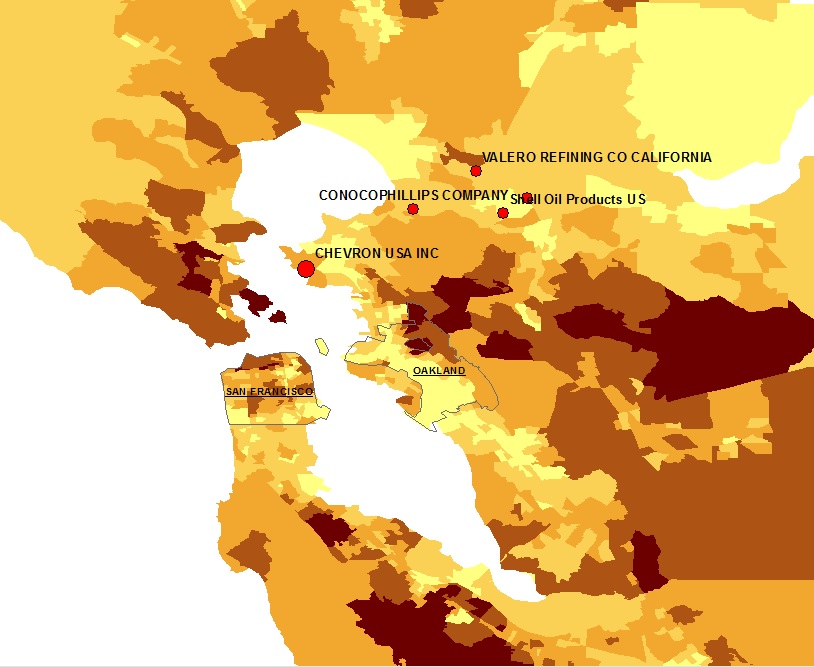
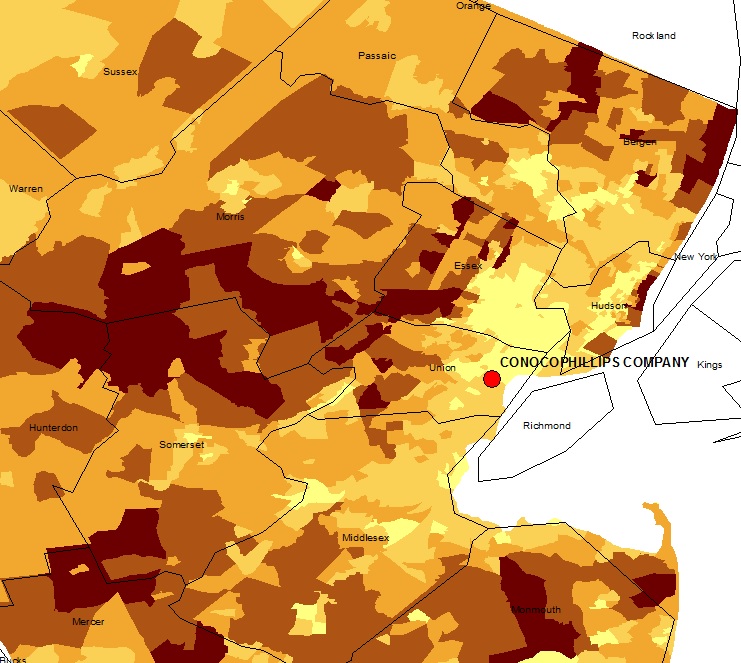
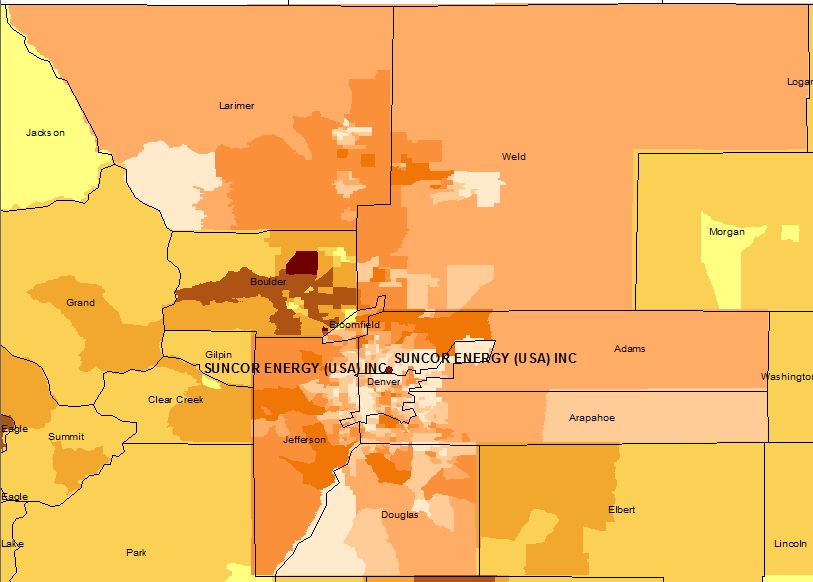
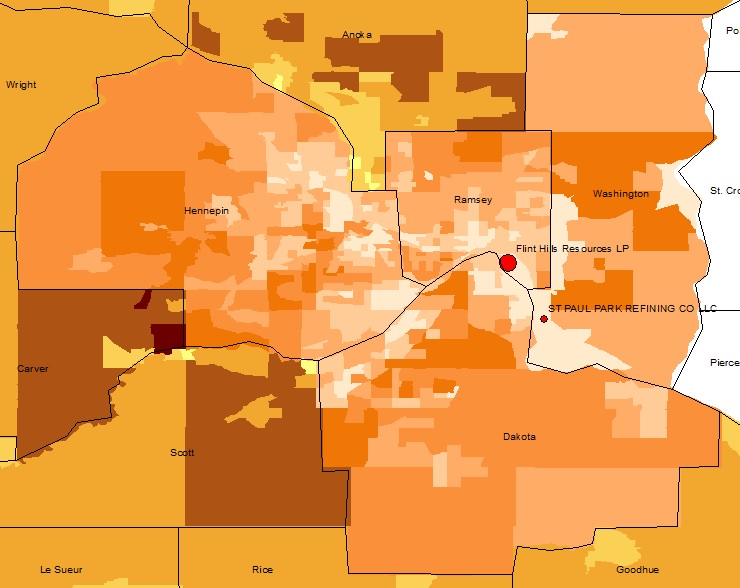
The biggest regional/MSA disparities occur in northeastern Denver neighborhoods around the Suncor Refinery complex (103,000 BPD), where the refinery’s census tracts earn roughly $42,000 less than Greater Denver residents1. California, too, has some issues near its Los Angeles’ Valero and Tesoro Refineries and Chevron’s Bay Area Refinery, with a combined daily capacity of nearly 600 BPD. There, two California census associations in the shadow of those refineries earn roughly $38,000 less than Contra Costa and Los Angeles Counties, respectively. In the Lone Star state Marathon’s Texas City, Galveston County refinery resides among census tracts where annual incomes nearly $33,000 less than the Galveston-Houston metroplex. Linden, NJ and St. Paul, MN, residents near Conoco Phillips and Flint Hills Resources refineries aren’t fairing much better, with annual incomes that are roughly $35,000 and nearly $33,000 less than the surrounding regions, respectively.
Click on the images below to explore each of the top disparate areas near oil refineries in the U.S. in more detail. Lighter shades indicate census tracks with a lower mean annual income ($).
Conclusion
Clearly, certain communities throughout the United States have been essentially sacrificed in the name of Energy Independence and overly-course measures of economic productivity such as Gross Domestic Product (GDP). The presence and/or construction of mid- and downstream oil and gas infrastructure appears to accelerate an already insidious positive feedback loop in low-income neighborhoods throughout the United States. Only a few places like Southeast Chicago and Detroit, however, have even begun to discuss where these disadvantaged communities should live, let alone how to remediate the environmental costs.
Internally Displaced People
There exists a robust history of journalists and academics focusing on Internally Displaced People (IDP) throughout war-torn regions of Africa, the Middle East, and Southeast Asia – to name a few – and most of these 38 million people have “become displaced within their own country as a result of violence.” However, there is a growing body of literature and media coverage associated with current and potential IDP resulting from rising sea levels, drought, chronic wildfire, etc.
The issues associated with oil and gas infrastructure expansion and IDPs are only going to grow in the coming years as the Shale Revolution results in a greater need for pipelines, compressor stations, cracker facilities, etc. We would propose there is the potential for IDP resulting from the rapid, ubiquitous, and intense expansion of the Hydrocarbon Industrial Complex here in the United States.


