What is the Life Expectancy of the Marcellus Shale?
We have recently updated the PA Shale Viewer, our map of unconventional wells in Pennsylvania. As I updated the statistics to reflect the updated data, I noticed that the number of wells with an active status ticked downward, just as it had for the previous update.
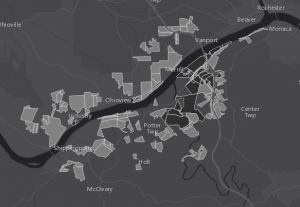
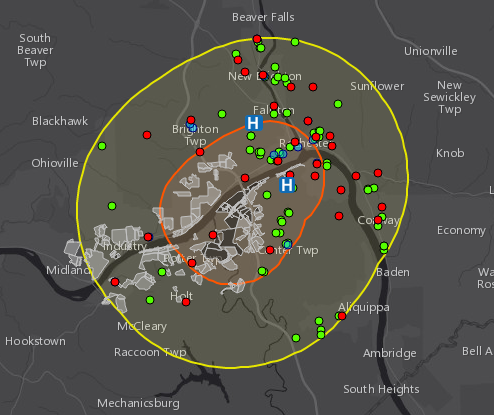
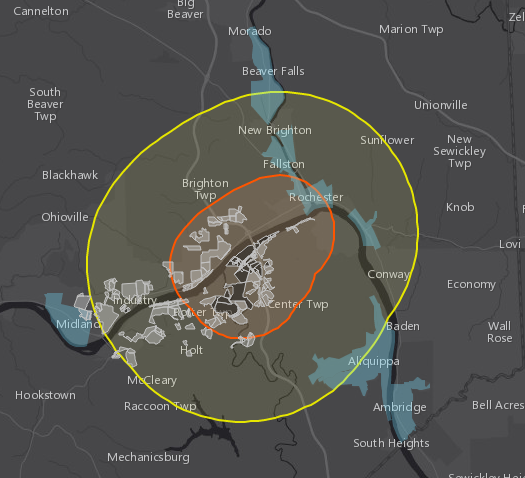
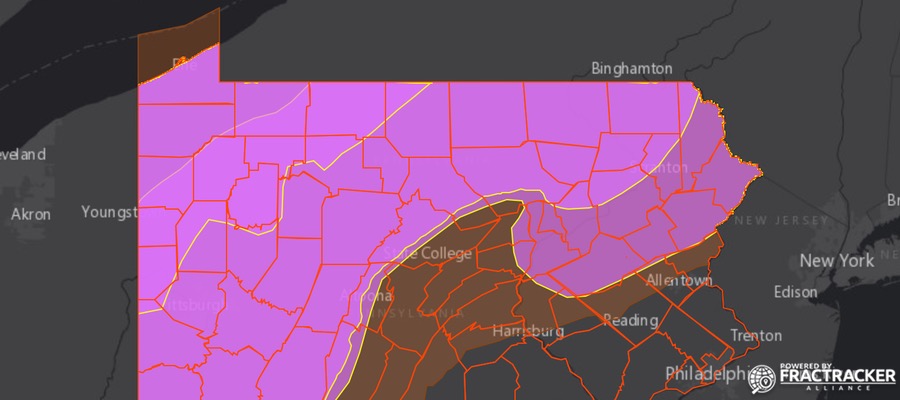
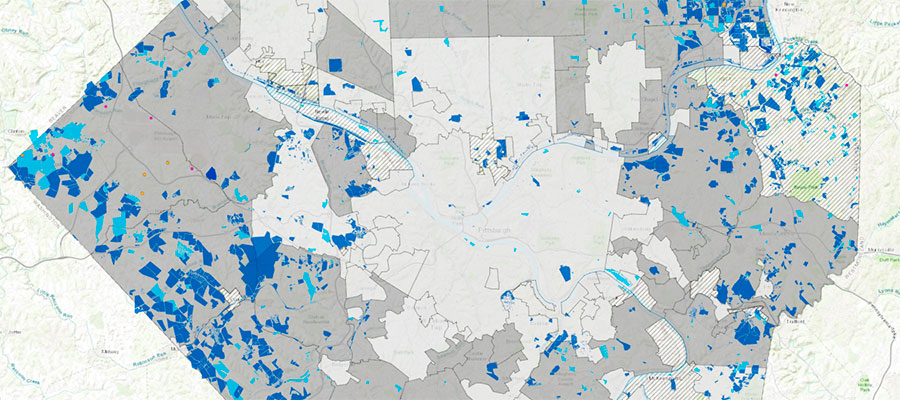
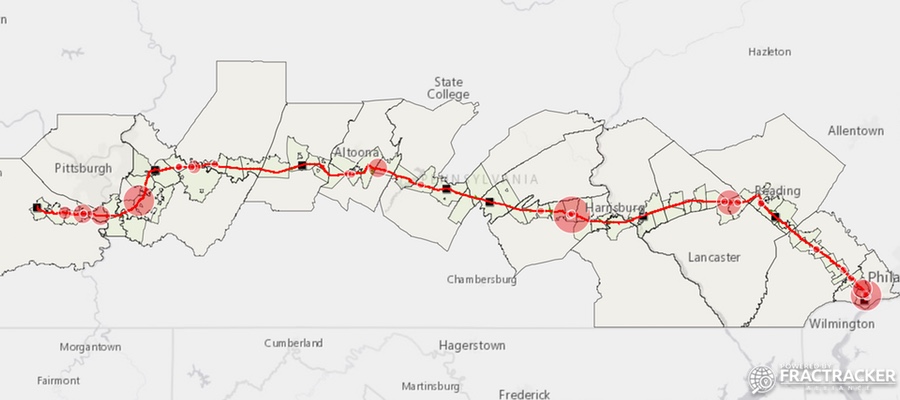
Pennsylvania Shale Viewer
View map fullscreen | How FracTracker maps work | Data Sources Listed Below
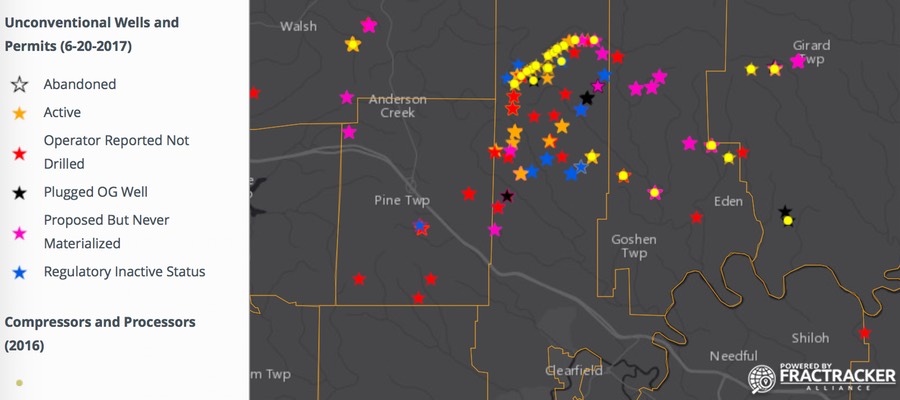
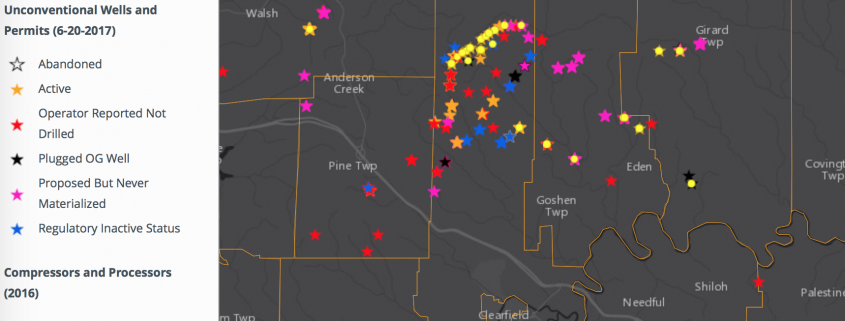
Wells on this map are shown in purple when zoomed out, but are organized by status as you continue to zoom in. The various statuses are shown below, as defined by the Pennsylvania Department of Environmental Protection (DEP).
- Active – permit has been issued and well may or may not have been drilled or producing, but has not been plugged.
- Proposed but Never Materialized – permit was issued, but expired prior to the commencement of drilling.
- Plugged OG Well – permit issued and well has been plugged by well operator.
- Operator Reported Not Drilled – permit issued, but operator reported to DEP that they never drilled the well.
- DEP Abandoned List – an abandoned well that has been inspected by DEP.
- DEP Orphan List – A well abandoned prior to April 18, 1985, that has not been affected or operated by the present owner or operator and from which the present owner, operator or lessee has received no economic benefit other than as a land.
- DEP Plugged – a DEP Abandoned or DEP Orphan well that has been plugged by DEP,
- Regulatory Inactive Status – a well status that is requested by well operator and has been granted by DEP. Well is capable of producing, but is temporarily shut in. Granted for initial 5 years and must be renewed yearly after first 5 years.
- Abandoned – a well that has not been used to produce, extract or inject any gas, petroleum or other liquid within the preceding 12 months; for which equipment necessary for production, extraction or injection has been removed; or considered dry and not equipped for production.
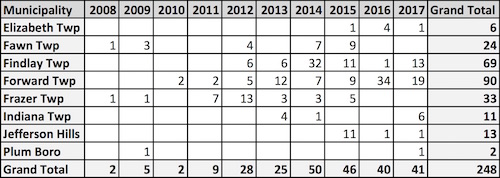
Life Expectancy Stats
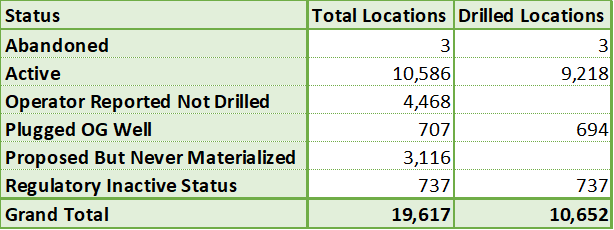
Table 1: Unconventional well locations in Pennsylvania by status. The determination of drilled locations was made by the presence of a spud date in the DEP dataset.
Currently, there are 10,586 well locations with an active status, 9,218 of which have been drilled. There 19,617 unconventional well locations in Pennsylvania when considering all status types, 10,652 of which have been drilled. The drill status was determined by whether or not there was an associated spud date in the dataset. The 13 plugged wells that lack spud dates likely represent some minor data entry errors of one sort or another, as a well would logically need to be drilled prior to being plugged.
Using the available data, we can see that 6.5% of drilled unconventional wells have been plugged, and an additional 6.9% have a regulatory inactive status, more commonly known as “shut-in” wells, leaving 86.5% of the drilled wells with an active status. Three wells are classified as abandoned, including two in Washington County attributed to Atlas Resources, LLC, and one operated by EQT Production Co. in Jefferson County. EQT submitted a request to convert the status of this latter well to inactive status in February 2016, but DEP has not made a decision on the application as of yet.
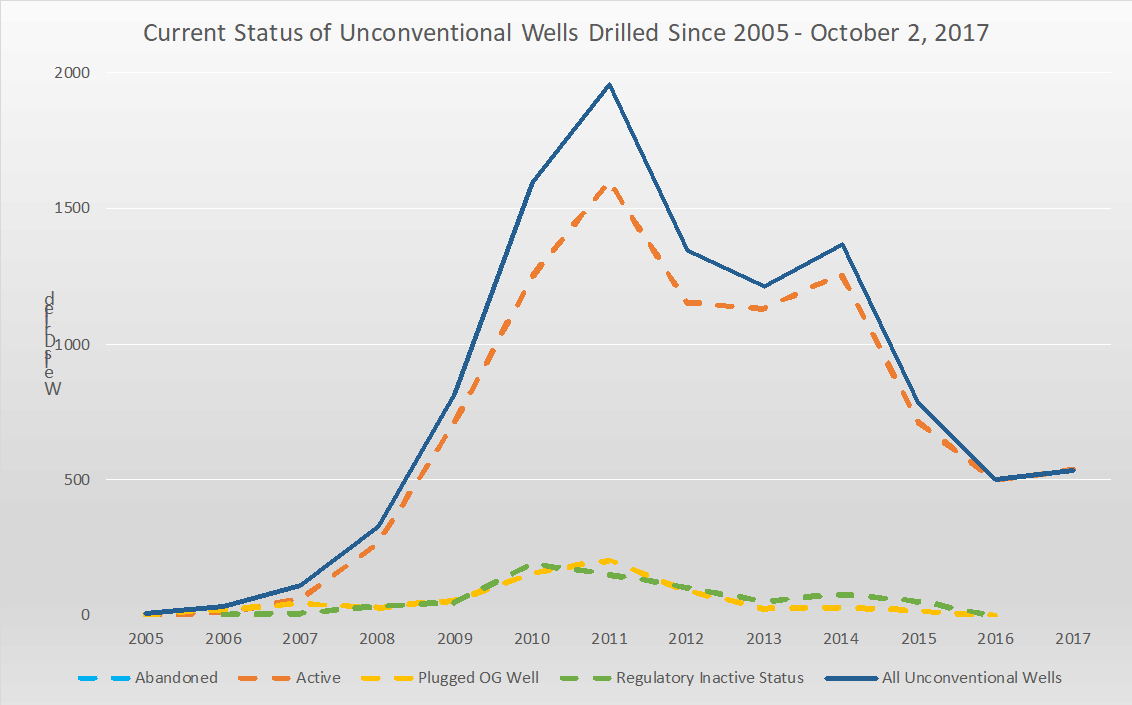
Chart 1: This chart shows the current status of unconventional wells in Pennsylvania, arranged by the year the well was drilled. Note that there are two abandoned wells in 2009 and one more in 2014, although those totals are not visible at this scale.
The top, solid blue line in Chart 1 shows the total number of unconventional wells drilled in Pennsylvania, which is based on the available spud date in the dataset. Focusing on this line for a moment, we can see a huge spike in the number of wells drilled in the early part of this decade. In fact, over 46% of the unconventional wells in the state were drilled between 2010 and 2012, and over 70% were drilled between 2010 and 2014. The 504 unconventional wells drilled in 2016 represents just over one quarter the total from 2011, when 1,959 wells were drilled. The 2017 totals are already slightly higher than 2016, with two months left to go in the year, but will not approach the totals from 2010 to 2014.
This drop-off in drilling since the 2011 peak is usually attributed to the glut of natural gas that these wells produced, and the Marcellus remains a highly productive formation, despite the considerable decline in new wells. Eventually, however, the entire formation will go into decline, which is already happening to the Barnett Shale in Texas and Haynesville Shale, among others, where peak production was several years ago in each case.
While all of three of these formations still produce significant quantities of gas, it is worth remembering that production is only half of the equation. In the Marcellus region, average costs were $6.6 million in 2014, which was projected to decrease to $6.1 million per well in 2015 according to a 2016 EIA document.
With the supply in the northeast outpacing demand, the gas prices stay low, and therefore production per well needs to be considerable to make a given well worthwhile.
Plugging Trends

Chart 2: Average days between spud date and plug date for unconventional wells in PA. Regulatory Inactive wells also include a plug date, and are included here.
Chart 2 shows the average number of days between the spud date and the plug date for wells that currently have either a plugged (n=694) or regulatory inactive (n=737) status. The regulatory inactive wells are relatively consistent in the days between when the well is drilled and temporarily plugged, which makes sense, as the operators of these wells typically intend for these wells to be shut-in upon completion.
However, it is interesting to note that wells are being plugged much more rapidly than they had been in the early part of the Marcellus boom.
Plugged unconventional wells that were drilled in 2005 (n=6) had an average of 3,081 days between these dates, while those drilled in 2016 (n=2) had and average span of 213 days.
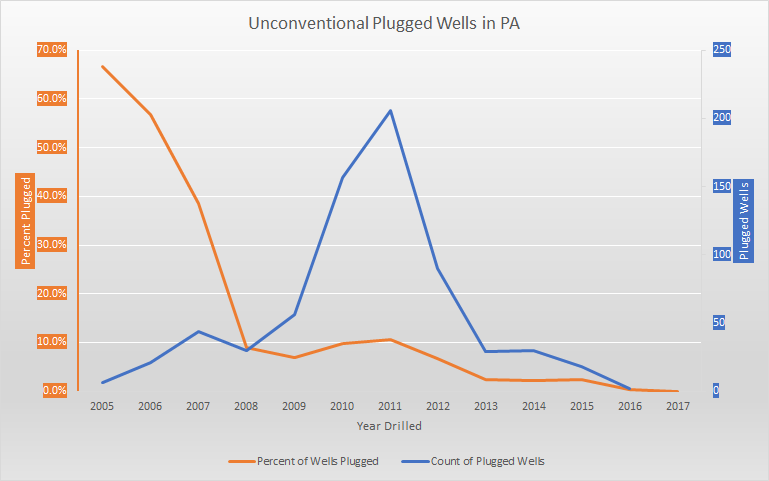
The left (orange) axis represents the percentage of wells drilled in each year that are currently drilled. The right (blue) axis marks the total number of wells drilled in each year that are currently drilled.
Obviously there would be no way for a well drilled in 2016 to have been online for 3,081 days before being plugged. However, each of the six plugged wells drilled in 2005 were active for at least 1,899 days before being sealed, which is over five years of activity. In contrast, 99 of the 4,966 unconventional wells drilled in the previous 1,899 days have already been plugged, representing 5.2% of the total wells drilled during that time. This means that we are seeing more “misses” at this point in the formation’s history, where the amount of gas being produced doesn’t justify keeping the well open and offsetting the $6 million or more that it cost to drill the well.
We can also see that the rate of plugged wells increases dramatically after about ten years in operation. Forty-four out of 114 (39%) of unconventional wells that were drilled in 2007 are now plugged. That ratio grows two thirds of the nine wells drilled in 2005. In the industry’s boom period of 2010 to 2010, the raw number of plugged wells are elevated, peaking at 206 in 2011, but the percentage of plugged wells during those years remains proportional to the rest of the trend. The overall trend shows that an unconventional well in Pennsylvania that lasts 11 or more years is unusual.
The data show that older Marcellus wells in Pennsylvania are certainly in a state of decline, and are rapidly being plugged. While the overall production of the field remains high, it remains to be seen what will happen as the boom cycle wells drilled from 2010 to 2012 start to go offline in considerable numbers. Given that more and more wells are being drilled with very short production lives, will it continue to make sense for the industry to drill expensive wells in a formation where a return on investment is increasingly questionable? This course is difficult to predict, but economic models that take plentiful natural gas supplies for granted should consider taking a second look.
PA Shale Viewer Data Sources
Unconventional Violations
Source: PADEP
Date Range: 1-1-2000 through 10-2-2017
Notes: For the original data, follow link above to “Oil and Gas Compliance Report”. Latitude and longitude data obtained by matching with permits data (see below). There are 7,655 rows of violations data, including 6,576 distinct Violation IDs issued to 2,253 distinct unconventional wells. Due to the large number of records, this layer isn’t visible until users zoom in to 1:500,000, or about the size of a small county.
Unconventional Wells and Permits
Source: PADEP Open Data Portal
Date Range: 1-1-2000 through 10-2-2017
Notes: This data layer contains unconventional well data in Pennsylvania. However, not all of these wells have been drilled yet. This layer is categorized by well status, which includes Abandoned, Active, Operator Reported Not Drilled, Plugged OG Well, Proposed but Never Materialized, and Regulatory Inactive Status. To determine whether the well has been permitted, drilled, or plugged, look for the presence of an entry in the Permit Date, Spud Date, and Plug Date field, respectively. Altogether, there are 19,617 wells in this inventory, of which 10,586 currently have an active status. Due to the large number of records, this layer isn’t visible until users zoom in to 1:500,000, or about the size of a small county.
SkyTruth Pits (2013)
Source: SkyTruth
Date Range: 2013
Notes: Prior to December 2014, this map contained a layer of pits that were contained in Oil and Gas Locations file available on PASDA. However, that layer was far from complete – for example, it included only one pit in Washington County at a time which news reports mentioned that seven pits in the county were scheduled to be closed. Therefore, we have opted to include this crowdsourced layer developed by SkyTruth, where volunteers analyzed state aerial imagery data from 2013. SkyTruth’s methodology for developing the dataset is detailed in the link above. 529 pits have been identified through this effort.
Compressors and Processors (2016)
Source: EDF, CATF, Earthworks, FracTracker Alliance, EPA, PADEP, EIA
Date: 2016
Notes: This layer is based off of publicly available data, but is not published by any agency as a dataset. It is the result of a collaborative effort, and the data first appeared in map format on the Oil and Gas Threat Map (oilandgasthreatmap.com). Original sources include PADEP, US EPA, and US EIA. Compiling, processing, and geocoding by Environmental Defense Fund, Clean Air Task Force, Earthworks, and FracTracker Alliance. Contact Matt Kelso for more information: kelso [at] fractracker.org.
Environmental Justice Areas
Source: PADEP, via PASDA
Date: 2015
Notes: Environmental Justice (EJ) areas are Census Tracts where over 20 percent of the population is in poverty, or over 30 percent of the population is non-white. The program is designed to monitor whether there is a fair distribution of environmental benefits and burdens. In Pennsylvania, EJ areas tend to be clustered in urbanized areas, particularly near Philadelphia and Pittsburgh.
Counties
Source: US Census Bureau, FracTracker Alliance
Date Range: 2011
Notes: This file was created by dissolving the Municipalities layer (below) to the county level. This method allows for greater detail than selecting the Pennsylvania counties from a national file.
Municipalities
Source: US Census Bureau
Date Published: 2011
Notes: Viewer must be zoomed into scales of 1:1,500,000 (several counties) or larger to access.
Watersheds – Large
Source: USDA/USGS
Date Published: 2008
Notes: Clipped to outline of Pennsylvania.
Watersheds – Small
Source: USDA/USGS
Date Published: 2008
Notes: Clipped to outline of Pennsylvania. Viewer must be zoomed into scales of 1:1,500,000 (several counties) or larger to access.
By Matt Kelso, Manager of Data and Technology, FracTracker Alliance


 The Pennsylvania Department of Environmental Protection (DEP) posted information on potential regulatory violations associated with these IRs on the