By Alison Grass, Senior Researcher at Food & Water Watch
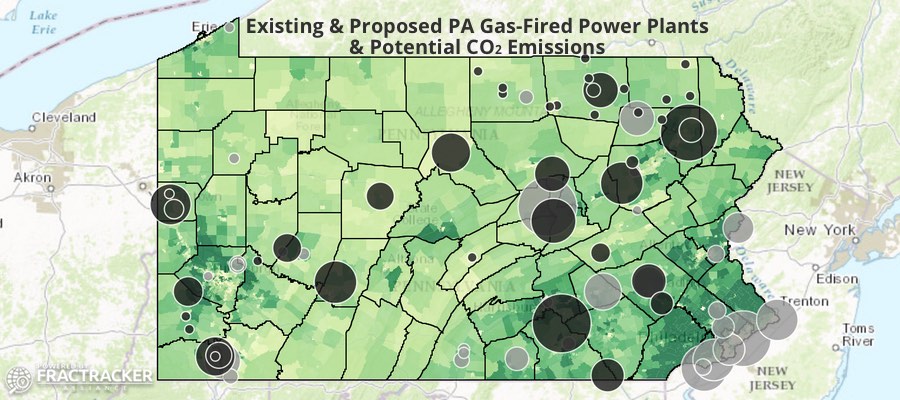
Over the past decade, the natural gas industry has experienced a renaissance that has been a boon to energy company profits. But it has altered the quality of life for the rural communities where most new gas wells have been drilled. Now, fracking is fueling a gas-fired power plant boom in Pennsylvania, with 47 new facilities. Most have already been approved, with a handful in commercial operation (see map below).
New research by Pennsylvanians Against Fracking shows, in vivid detail, the scale of this buildout, and the impacts it will have on Pennsylvania communities.
Current & Potential PA Gas-Fired Power Plants & their Emissions
Approximately half of the new gas power plants are located in northeastern region of Pennsylvania, a part of the state already overburdened by the lingering environmental maladies of coal mining and the more recent dangers associated with fracking. These rural communities may see increased drilling, fracking and pipeline construction to support the power plants — and the siting could be strategic. In a StateImpact Pennsylvania article about the first Marcellus shale gas power plant, for example, a company representative admitted that the location was chosen specifically due to its convenient access to shale gas. “This plant was sited precisely where it is because of its access to the abundant, high-quality natural gas that’s found a mile to two miles beneath our feet.”
Drilling Trends
The first modern Marcellus well was drilled in Pennsylvania by Range Resources in 2003, and commercial production began in 2005. Although fracking expanded rapidly in several areas across the country, Pennsylvania has been ground zero of the fracking boom, with just over 10,000 shale gas wells drilled between 2005 and 2016. Since then, however, there has been a rapid downturn in new wells drilled. After the early and dramatic increase in drilling – from 9 shale wells in 2005 to 1,957 shale wells in 2011 – the number dropped to 504 in 2016.
According to Natural Gas Intelligence, natural gas from the Appalachian Basin “…hit a roadblock in 2016, as pipeline projects struggled to move forward and a storage glut slowed the region’s previously rapid production growth.” Thus, it appears that in order to maintain fracking’s profitability, the gas industry is relying on new gas-fired power plants to alleviate the storage glut, while potentially increasing demand for shale gas (which could propagate more drilling and fracking).
Gas-Fired Power Plant Siting
The siting of these power plants also enables companies to use Pennsylvanian fracked gas to generate power for larger regional markets. This is because northeastern Pennsylvania is close to dense populations, including New York City. In Luzerne County, for instance, the new Caithness Moxie Freedom Generating Station gas-fired power plant will supply electricity to not just Pennsylvania residents, but also to New Jersey and New York State. And in the more central region of the state in Snyder County, the Panda Hummel Station will send “much of its power to the New York City market.”
Siting gas-fired power plants in the northeast may also increase drilling and fracking in the region, where gas is predominantly “dry” and less profitable than the “wet” gas found in southwest PA. This trend is largely due to a resurgence in North American petrochemical markets and increased ethane exports that rely on wet gas. (Dry natural gas contains primarily methane and smaller amounts of other hydrocarbons, while wet natural gas has higher concentrations of natural gas liquids. Natural gas liquids — predominantly ethane but also propane, butane, isobutane and pentanes — are the raw materials for manufacturing petrochemicals.)
Well Integrity and Other Risks
However, increased drilling and fracking mean more pollution for the Marcellus shale region of Pennsylvania, where shale gas wells have proven to be more prone to well construction “impairments” and well integrity problems, compared to conventional wells. This risk is especially true in the northeastern part of the state, where over nine percent of shale gas wells have indications of compromised well integrity.
Overall, fracking causes many public health and environmental problems. Methane, fracking fluids, and wastewater can pollute water supplies and imperil the livelihoods of farmers, who rely on clean water. Increased truck traffic and drilling emissions reduce air quality, and methane leaks contribute to global warming. Meanwhile, the proliferation of natural gas derricks and associated infrastructure destroys pristine landscapes (and related tourism and recreation industries).
The last thing that Pennsylvanians need is another way for the oil and gas industry to capitalize on shale at the expense of residents’ health and well-being.
https://www.fractracker.org/a5ej20sjfwe/wp-content/uploads/2017/03/Power-Plants-PA-Feature.jpg400900Guest Authorhttps://www.fractracker.org/a5ej20sjfwe/wp-content/uploads/2025/09/2025-Wordmark-Logo.pngGuest Author2017-04-21 13:34:192021-04-15 15:03:09Wanted: More Places to Burn Natural Gas
In March 2017, FracTracker Alliance conducted a review of the available Pennsylvania oil and gas fine data released publicly by the PA Department of Environmental Protection (DEP) to identify trends in industry-related fines over time and by particular operators. In total, the DEP has assessed nearly $36 million in fines to oil and gas extraction and pipeline operators since January 1, 2000. Such fines are associated with over 42,000 violations issued1 by DEP in that time frame, covering 204,000 known oil and gas locations,2 as well as 91,000 miles of pipelines3 within the Commonwealth.
Understanding the Data Structure
The amount of money that the Pennsylvania Department of Environmental Protection (DEP) fines oil and gas (O&G) operations is included in the DEP’s compliance report published on their website. Even though fines data are made available, they are not necessarily straight-forward, and caution must be taken not to over-estimate the total number of assessed fines.
Records of fines are associated with enforcement identification codes on the compliance report. A single fine is often applied to numerous violations, and the full amount of the fine is listed on every record in this subset. Therefore, the total dollar amount of fines assessed to O&G companies appears overstated. For example, if a $400,000 fine were assessed to settle a group of 10 violations, that figure will appear on the report 10 times, for an apparent aggregate of $4,000,000 in fines. To get an accurate representation of fines assessed, we need to isolate fines associated with particular enforcement ID numbers, which are used administratively to resolve the fines.
This process is further complicated by the fact that, on occasion, such enforcement ID numbers are associated with more than one operator. This issue could result from a change in the well’s operator (or a change of the operator’s name), a group of wells in close proximity that are run by different operators, or it might point to an energy extraction company and a midstream company sharing responsibility for an incident. Sometimes, the second operator listed under an enforcement ID is in fact “not assigned.” The result is that we cannot first summarize by operator and then aggregate those subtotals without overstating the total amount of the assessed fines. In all, 62 of the enforcement ID numbers apply to more than one operator, but this figure amounts to less than one percent of the nearly 15,000 distinct enforcement ID numbers issued by DEP.
Conventional & Unconventional Violations & Fines
Oil and gas wells in Pennsylvania are categorized as either conventional or unconventional, with the latter category intended to represent the modern, industrial-scaled operations that are commonly referred to as “fracking wells.” Contrastingly, conventional wells are supposed to be the more traditional O&G wells that have been present in Pennsylvania since 1859. The actual definition of these wells leaves some blurring of this distinction, however, as almost all O&G wells now drilled in Pennsylvania are stimulated with hydraulic fracturing to some degree, and some of the conventional wells are even drilled horizontally – just not into formations that are technically defined as unconventional. For the most part, however, unconventional remains a useful distinction indicating the significant scale of operations.
Table 1. Summary of oil and gas wells, violations, and fines in Pennsylvania
Category
Conventional
Unconventional
(blank)
Total
Wells
193,655
10,291
0
203,946
Violations
27,223
6,126
9,026
42,375
Fines
$7,000,203
$13,689,032
$21,563,722
$35,949,495*
Fines per Violation
257
2,235
2,389
848
Fines per Well
36
1330
–
176.27
Violations per Well
0.14
0.60
–
0.21
Wells per Violation
7.11
1.68
–
4.81
* The total fine amount issued is not a summary of the three preceding categories, as some of the fines appear in multiple categories
Ninety-five (95)% of the state’s 204,000 O&G wells are classified as conventional, so it should not be surprising to see that this category of wells accounts for a majority of violations issued by the department. However, fines associated with these violations are less frequent, and often less harsh; the $7 million in fines for this category accounts for only 19% of the total assessed penalties. In contrast, the total penalties that have been assessed to unconventional wells in the state are nearly twice that of conventional wells, despite accounting for just 5% of the state’s well inventory
On the 54,412 records on the compliance report, 10,518 (19%) do not indicate whether or not it is an unconventional well. The list of operators includes some well-known conventional and unconventional drilling operators, and hundreds of names of individuals or organizations where O&G drilling is not their primary mode of business (such as municipal authorities and funeral homes). This category also contains violations for midstream operations, such as pipelines and compressor stations. Altogether, 3,795 operators have entries that were not categorized as either conventional or unconventional on the compliance report, and 124 of these operators were issued fines. One additional complication is that some of the violations and fines that fall into this category are cross-referenced in the conventional and unconventional categories, as well.
The resulting impact of these factors is that the blank category obscures the trends for violations and fines in the other two categories. While tempting to reclassify well data in this category as either conventional or unconventional, this would be a tall task due to the sheer number of records involved, and would likely result in a significant amount of errors. Therefore, the FracTracker Alliance has decided to present the data as is, along with an understanding of the complexities involved.
Most Heavily Fined Operators
Despite the numerous caveats listed above, we can get a clear look at the aggregated fines issued to the various O&G operators in the state by constructing our queries carefully. Table 2 shows the top 12 recipients of O&G-related fines assessed by DEP since 2000. Ten of these companies are on the extraction side of the business, and the total number of well permits issued4 to these companies since 2000 are included on the table. By looking at the permits instead of the drilled wells, we discover the operator that was originally associated with the drilling location, whereas the report of drilled wells associates the current operator associated with the site, or most recent operator in the event that the location is plugged and abandoned.
Stonehenge Appalachia and Williams Field Services operate in the midstream sector. Combining the various business name iterations and subsidiaries would be an enormous task, which we did not undertake here, with the exception of those near the top of the list. This includes Vantage Energy Appalachia, which was combined with records from Vantage Energy Appalachia II, and the compliance history of Rice Energy is the sum of three subsidiaries, the drilling company Rice Drilling B, and two pipeline companies, Rice Midstream Holdings and Rice Poseidon Midstream.
Table 2. Top 12 operators that have been assessed oil and gas-related fines by DEP since 2000
Operator
Total Fines
Conventional Permits
Unconventional Permits
Violations
Fines / Violation
Fines / Permit
Range Resources Appalachia LLC
$5,717,994
2,104
2,206
819
$6,982
$1,327
Chesapeake Appalachia LLC
$3,120,123
18
3,072
754
$4,138
$1,010
Rice Energy*
$2,336,552
442
165
$14,161
$5,286
Alpha Shale Res LP
$1,681,725
3
62
31
$54,249
$25,873
Stonehenge Appalachia LLC
$1,500,000
–
–
294
$5,102
–
Cabot Oil & Gas Corp
$1,407,275
19
902
726
$1,938
$1,528
CNX Gas Co LLC
$1,274,330
1,613
677
387
$3,293
$556
WPX Energy Appalachia LLC
$1,232,500
347
159
$7,752
$3,552
Chevron Appalachia LLC
$1,077,553
2
604
113
$9,536
$1,778
Vantage Energy Appalachia LLC**
$1,059,766
3
300
35
$30,279
$3,498
Williams Field Services Co, LLC
$872,404
–
–
158
$5,522
–
XTO Energy Inc
$739,712
1,962
461
383
$1,931
305
* Fines for Rice Energy here represent the sum of three subsidiaries, the drilling company Rice Drilling B, and two pipeline companies, Rice Midstream Holdings and Rice Poseidon Midstream.
** Fines for Vantage Energy Appalachia were combined with records from Vantage Energy Appalachia II.
Predictably, many of the entries on this list are among the most active drillers in the state, including Range Resources and Chesapeake Appalachia. However, Alpha Shale Resources has the dubious distinction of leading the pack with the highest amount of fines per violation, as well as the highest amount of fines per permit. Fitting in with the theme, the story here is complicated by the fact that Alpha had a joint venture with Rice, before selling them their stake in a group of wells and midstream operations that were fined $3.5 million by DEP.5 On this compliance report, the fines from this incident are split between the two companies.
Fines Issued Over Time
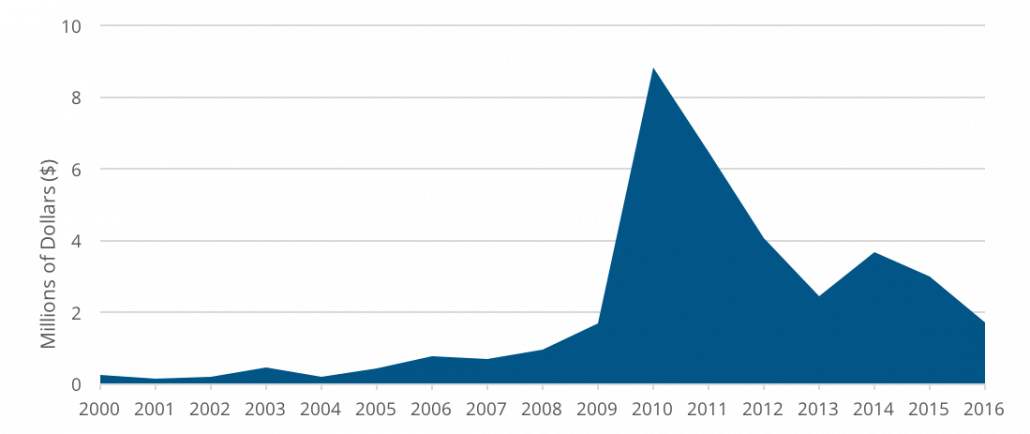
It is worth taking a look at how O&G related fines have varied over time, as well (Figure 1, shown in millions of dollars). Numerous factors could contribute to changes in trends, such as the number of available DEP inspectors,6 the amount of attention being paid to the industry in the media, differing compliance strategies employed by various political administrations, or changes in practices in the field, which could in turn be impacted by significant fines issued in the past.
Figure 1. O&G Fines Issued by DEP, 2000 through 2016
The notable spike in fines issued from 2010 to 2012 corresponds with the peak of unconventional drilling in the state – 4,908 of these industrial scaled wells were drilled during those three years, amounting to 48% of all unconventional wells in PA. In contrast, only 504 unconventional wells were drilled in 2016, or around a quarter of the total for 2011. In this context, the reduction in fines since the early part of the decade seems reasonable.
The association with the number of unconventional wells falls apart a bit in the years 2013 to 2014, however. These two years saw an average of 1,293 unconventional wells drilled, but the fines issued amounted to only 35% of the 2011 total.
Considerable strides have been made in the public accessibility of oil and gas data available from the PA DEP since FracTracker started requesting and reviewing this information in 2009. Still, there are many gaps in the datasets, such as geolocation details for 10 of the 20 largest fines issued by the department. FracTracker hopes external analyses like this one will help to close such gaps and identify operators who, too, need to improve their compliance records.
The Pennsylvania Department of Environmental Protection (DEP) will be hosting a nine-stop “listening tour” to hear residents’ perspectives on environmental justice (EJ). These sessions begin in the western part of the state on April 12th and 13th. The complete list of dates and locations of these meetings can be found here. The DEP will also be accepting written comments, which can be either mailed or emailed to DEP-OEJ@pa.gov.
The EJ listening tour follows on the heels of events in May 2016, when environmental advocacy groups questioned the well pad siting practices of oil and gas drilling company Range Resources, causing the DEP to announce it would revisit its EJ policies. Such changes would include reassessing how EJ zones are designated and what kinds of development triggers additional scrutiny by the DEP’s Office of Environmental Justice. We wrote about this story, and detailed how present EJ rules fail to account for oil and gas development in June 2016.
The following guide is meant to provide helpful information to residents in preparing for the listening tour. We first offer a summary of PA’s present EJ policies, followed by a commentary on what gaps we believe exist in those policies, and conclude with some reflections on EJ policies in other U.S. states and what we might learn from them in reassessing our own state’s EJ laws.
Listening Sessions Format
Each environmental justice listening tour will include opening remarks from Acting Secretary McDonnell, followed by a brief presentation from the Office of Environmental Justice, and then will open to receive testimony from the public. Verbal testimony is limited to 3 minutes for each witness. Organizations are asked to designate one witness to present testimony on their behalf. Verbal comments will be recorded by a court stenographer, and transcripts will be made available to the public at a later date.
The DEP Office of Environmental Justice has offered a set of eight questions to guide comments in the listening tour sessions. They are as follows:
What environmental justice concerns are most pressing in your community?
Do you feel that the current definition of an environmental justice community (20% poverty and/or 30% minority) properly represents the needs of your community and the Commonwealth at large?
Do you feel the DEP is engaged with marginalized communities to ensure that they have a voice in the decision making process? How can the DEP be more engaged with these communities?
What tools have you used to find out information on DEP permitting/enforcement actions?
What ways can the DEP be more effective at sharing information with the public?
How can the DEP be more effective at receiving public input?
What resource(s) is your community lacking that the DEP can provide that would assist in efforts to ensure environmental equity?
What additional steps can be taken by the Department to effectively reach out to these vulnerable communities to ensure that their concerns are taken into consideration?
Summary of Existing EJ Policies
According to the U.S. Environmental Protection Agency, environmental justice is “the fair treatment and meaningful involvement of all people regardless of race, color, national origin, or income with respect to the development, implementation, and enforcement of environmental laws, regulations, and policies.” This same definition is used by the DEP.
In 2004, the DEP codified this EJ definition in the Environmental Justice Public Participation Policy. EJ designations are defined by the DEP as any census tract where 20% or more of the population lives in poverty and/or 30% or more of the population identifies as a minority. Designations are based on the U.S. Census Bureau and by the federal poverty guidelines.
Below is a map of current EJ designated census tracts in PA that also shows the counties where listening tour sessions will be held. When zoomed in to regional scale, EJ areas can be clicked to see their current poverty and minority percentages. The locations of oil and gas wells and permits are also visible at the regional scale.
Map of current EJ areas (based on 2015 census data) shown in teal, with listening tour counties outlined in red
Of note in the 2004 policy are the kinds of permits that trigger a potential EJ review – specifically: industrial wastewater facilities, air permits for new major source of hazardous air pollution, waste permits for landfills and incinerators, coal mining permits and coal refuse facilities, and/or concentrated animal feeding operations. The policy also allows for review of “opt-in permits” the DEP believes warrant special consideration, but we have found no evidence to suggest that this option has been historically used.
When a project triggers EJ review, the DEP “strongly encourages” the applicant meets with community stakeholders prior to submitting their permit, with the idea that additional public outreach makes project details more apparent. The applicant is also encouraged to produce “plain language” information sheets, online and in print form, regarding the proposed activity.
Issues with Existing PA EJ Policies
A complete list of what may occur when a project triggers EJ review can be found here. The following table is a breakdown of where we see deficiencies in PA EJ policies that need to be addressed:
Existing Policy
Issue
Possible Solutions
EJ Definition EJ areas defined by 20% poverty/30% minority indicators.EJ ensures meaningful involvement of all people regardless of race, color, national origin, or income.
Many communities are just outside poverty/minority thresholds, or are spread across multiple census tracts experiencing concentrated industrial activities.
Disproportionate exist due to other factors besides poverty and race.
DEP should go beyond the census tracts, as well as account for other factors such as the “working poor”, homeownership rates, assisted school lunches rate, disability and elderly populations, and language barriers.
Reviews should factor in “cumulative impacts” of more developing relative to existing industrial burdens.
Regardless of “age and gender” should be added to EJ protection language.
Trigger Permits Limited kinds of “trigger” permit types are listed in the Public Participation Policy as eligible for EJ review.
Permits outside of these categories are also degrading the communities and being targeted to environmental justice communities. Oil and gas extractions, pipelines, and other infrastructure are not currently considered trigger permits but are impacting many environmental justice areas.
DEP should oil and gas permits to the trigger list. All permits, even of seemingly lesser severity, should trigger review to see if they contribute to cumulative impacts to already burdened community.
Permit Notifications DEP program staff must notify the Office of EJ when a permit “trigger” EJ review and report the details of the proposed activity.
Currently not all DEP program staff are alerting the EJ office of trigger permits, and many are not education on EJ policies.
More training and funding needs to be allocated to make sure that trigger permits are not overlooked or mishandled.
Public Education
Requiring the distribution of “plain language” information sheets regarding the proposed activity and permit conditions. Public notices are to be placed in widely read publications in print and online.
Does not always happen or the information produced is inadequately written or poorly distributed. Public notices are put in the legal sections of paper, often initial meetings are not even publicly noticed if the company is the only one organizing the meeting.
Enforce this requirement and include real infographics as much as possible. Consult with local community groups to determine what communication tools work best.
Publish additional notice outside of newspaper in widely read publications, flyers in local businesses, community centers, and church bulletins. Require applicants to do direct mailing.
Updated the “eFacts notification system to include more information and send email notices to interested parties when updates in non-technical language.
Applicant Public Meetings
DEP “strongly suggests” applicants meet with all stakeholders, before applying for permit, as well as throughout the permitting process.
Not all stakeholders are being brought into conversations and often DEP allows the applicant to decide who these people should be. Applicants are often not transparent about their plans. Meetings do not occur at all stages of the process.
It should not be up to the applicant to control the process and do outreach. DEP should ensure that all interested parties are engaged in the permitting process.
Meeting should be held during the entire permitting process. This should be required, not “strongly suggested.” A meeting should occur after a permit is administratively complete and again after technical review is done but before a decision is made. Many changes happened during technical review and this gives communities the opportunity to weigh in on the final project and understand its timeline.
DEP should always participate in these meetings and make themselves available to answer questions from the community.
DEP Public Meetings
DEP holds an informal public conference within 30 days of receiving the application to inform residents of EJ area designation and the nature of project.
These meetings frequently are not able to answer people questions and residents are told to wait for additional information. The format of these meetings do not allow for dialogue, which prevents the community from learning from each other.
The DEP needs to hold the informal public conferences in discussion formats so residents can ask questions together and receive answers in person, not just take notes and tell residents they will receive a written response. DEP staff responsible for reviewing the proposal must be present at the meetings to answer questions.
Public Comments
DEP accepts comments from EJ communities.
These comments are often not taken into consideration, or given very little weight during the permitting process. Instead, the comments are merely noted for the record.
Create a formal process for integrating comments from community experts who are often best able to provide information about how a project will impact their community.
DEP Availability
DEP will maintain presence and be availability to residents throughout permitting process.
DEP staff are available during public meetings but are otherwise unavailable until there is a permit decision.
Inadequate continuing public oversight of how EJ policies are administered across the state.
Actively provide updates on the permitting process and changes to the application. The burden should not be on an EJ community to stay up date on the permit, but should be the DEP and applicant’s responsibility.
DEP staff responsible for reviewing the proposal must be available to the community to answer questions. DEP should also prioritize filling its regional Environmental Advocate staff positions currently vacant in many of its districts.
Convert the DEP Citizen Environmental Justice Advisory Board (EJAB) to a full committee, with the power to oversee EJ permits under review and influence state EJ policies. Hold quarterly EJAB meetings in different DEP regions on a rotating basis.
Reflections on other states’ EJ policies
States that use poverty and race indicators differently:
Connecticut: Uses income below 200% of the federal poverty level (“working poor”).
Illinois: indicates low-income and/or minority population as being “greater than twice the statewide average.”
Massachusetts: Defines by census “block group” rather than census tract, which can identify pocket EJ areas that might be lost in larger census tracts.
Texas: For income indicator, uses census block group and income below 200% of the federal poverty level.
States that go beyond poverty and race indicators:
California: Considers existing disproportionate environmental burden. Also, demographics include “low levels of homeownership, high rent burden…or low levels of educational attainment.”
Connecticut: includes a “distressed community” indicator, defined as whether it is eligible for HUD grants, or experienced layoffs/tax loss due to a major plant closing.
Georgia: includes language for elderly and disabled populations “The Americans with Disabilities Act (ADA) encourages the involvement of people with disabilities in the development and improvement of transportation and paratransit plans and services.”
Massachusetts: Uses linguistic isolation, defined as “25% or more of households having no one over the age of 14 who speaks English only, or very well.”
New Jersey: Communities can file a petition to be recognized as a vulnerable.
Example of better public participation affordances:
New Jersey: When a community is designated EJ, a task force is formed to develop a unique “Action Plan” after consultation with residents, local, and county government, that will address environmental, social and economic factors affecting their health or environment. This task force monitors Action Plan implementation, and advises development projects to reduce impacts.
Conclusions
Environmental justice rules came into existence in order to deal with the burdens of large polluting facilities like landfills, incinerators, and coal mines. Race and poverty measures are, without question, two very important indicators that have provided for the fair treatment of people of all races, income, and cultures in these instances. However, if we are to properly assess how residents are disproportionately impacted across a range of environmental burdens in the state, other indicators of marginalization should be included. The Center for Coalfield Justice suggests a few in a report titled Community Indicators of Environmental Justice: A Baseline Report Focusing on Greene and Washington Counties, Pennsylvania.
Fair treatment in EJ communities should also mean offering mechanisms for meaningful input that allow residents to shape the ultimate direction of proposed projects, as well. Finally, current EJ policies are very limited in only addressing future projects, whereas issues such as how disadvantaged communities, struggling with legacy problems such water, air, and soil pollution, are left to other agencies to deal with.
We encourage residents of Pennsylvania to attend an environmental justice listening tour session to share their perspectives, and how the DEP can better fulfill its mandates to protect vulnerable communities.
https://www.fractracker.org/a5ej20sjfwe/wp-content/uploads/2017/04/EJ_tour_header.jpg400900FracTracker Alliancehttps://www.fractracker.org/a5ej20sjfwe/wp-content/uploads/2025/09/2025-Wordmark-Logo.pngFracTracker Alliance2017-04-10 11:06:352021-04-15 15:03:12PA DEP Environmental Justice Listening Tour
https://www.fractracker.org/a5ej20sjfwe/wp-content/uploads/2017/04/Dead-of-Spring-Feature.jpg400900Guest Authorhttps://www.fractracker.org/a5ej20sjfwe/wp-content/uploads/2025/09/2025-Wordmark-Logo.pngGuest Author2017-04-06 11:30:422021-04-15 15:03:12Interview with Sherry Knowlton, Author of Dead of Spring
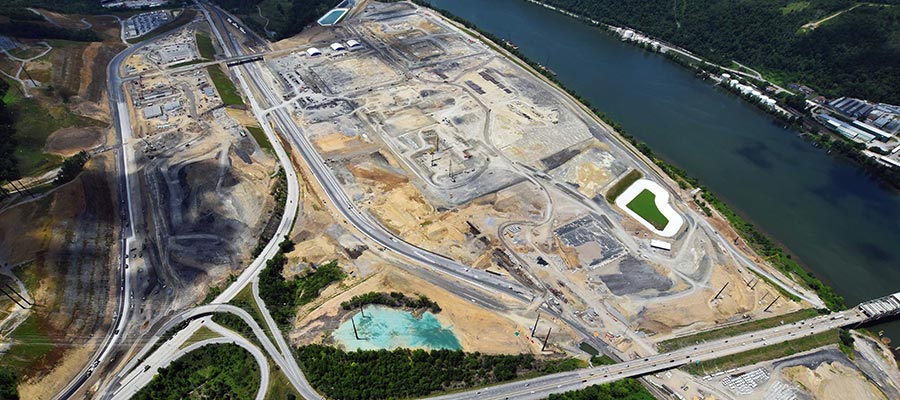
At a Re-Imagine Beaver County gathering in Pennsylvania earlier this month, static maps became dynamic in the hands of those who live in and around the region depicted. Residents of this area in the greater Pittsburgh region gathered to depict a new vision for Beaver County, PA. This county is currently faced with the proposal of a massive Shell-owned petrochemical facility – also called a “cracker” – and further build-out that could render the area a northern version of Louisiana’s “Chemical Corridor.” Participants at this event, from Beaver County and beyond, were encouraged to collectively envision a future based on sustainable development. The picture they created was one that welcomes change – but requires it to be sustainable and for the benefit of the community that makes it happen.
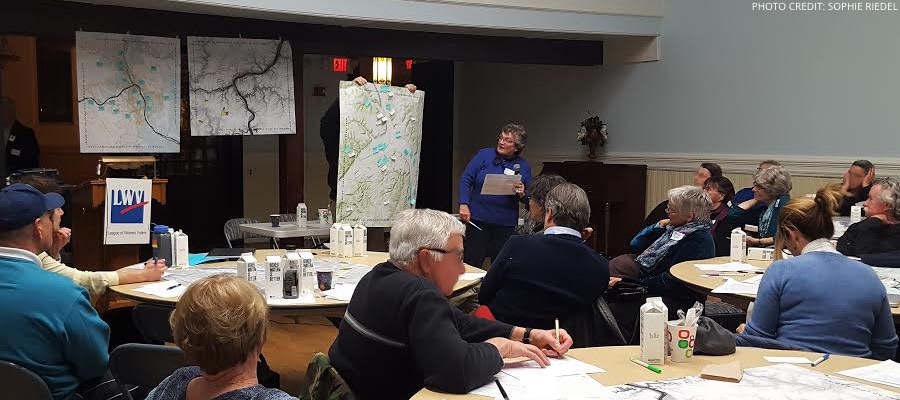
Figure 1: Participants study a map of Beaver County. Photo credit: Sophie Riedel.
Re-Imagine Beaver County Participants
Panelists from municipal government, organic agriculture, and leaders and entrepreneurs of sustainable initiatives started off the event, sponsored by the League of Women Voters of Pennsylvania and endorsed by the Beaver County Marcellus Awareness Committee. After an hour, the room of 60 or so participants dove into the lively de- and re-construction of large format maps of the area. They were invited to markup the maps, created by Carnegie Mellon University graduate student of the School of Architecture, Sophie Riedel. Each table worked from a different base map of the same area – centering on the confluence of the Ohio and Beaver rivers, including the already heavily-industrialized riverside and the site of Shell’s proposed petrochemical facility.
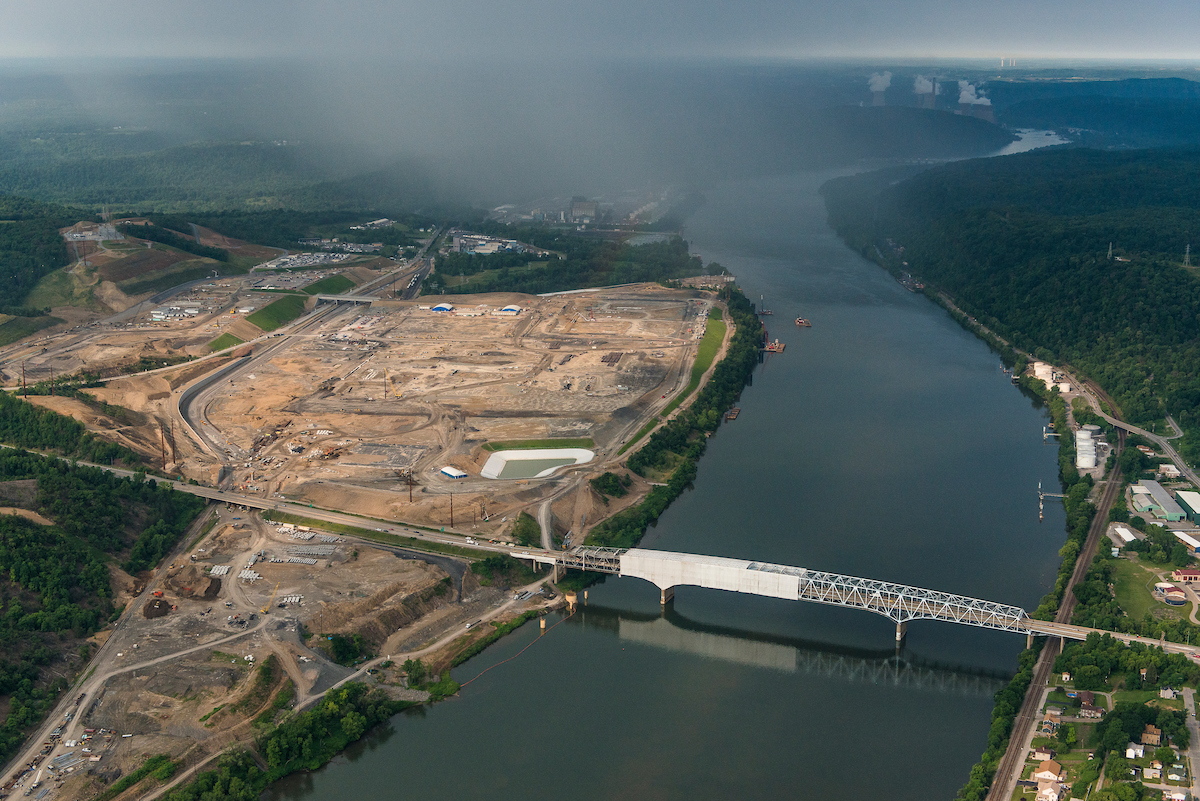
Figure 2: The site of the proposed petrochemical facility in Beaver County (on left) and the Ohio River that participants hope to see reinvented as a recreational waterway buttressed by public parks. Photo credit: Garth Lenz, iLCP.
Much more than a thought exercise, the gathering represented a timely response to a growing grassroots effort around the proposed petrochemical inundation. Changes are already underway at the site, and those who live in this region have the right to give input. This right is especially salient when considering the risks associated with the petrochemical industry – including detrimental health impacts on babies before they are even born, asthma exacerbation, and increased cancer rates.
Charting a new vision
The re-invented Beaver County would be one of increased connectivity and mobility, well-equipped to provide for local needs with local means.
Many ideas included on the maps reflected a longing for transportation options independent of personal vehicles – including better, safer, more connected bike trails and walking paths, use of existing rail lines for local travel, and even the inventive suggestion of a water taxi. These inherently lower-impact means of transport coincide with preferences of millennials, according to several of the panelists, who want more walkable, bikeable communities. Ushering in such sustainable suggestions would welcome more young families to an area with an aging population. More than just about moving people, transportation ideas also included ways to get locally grown foods to those who need it, such as the elderly.
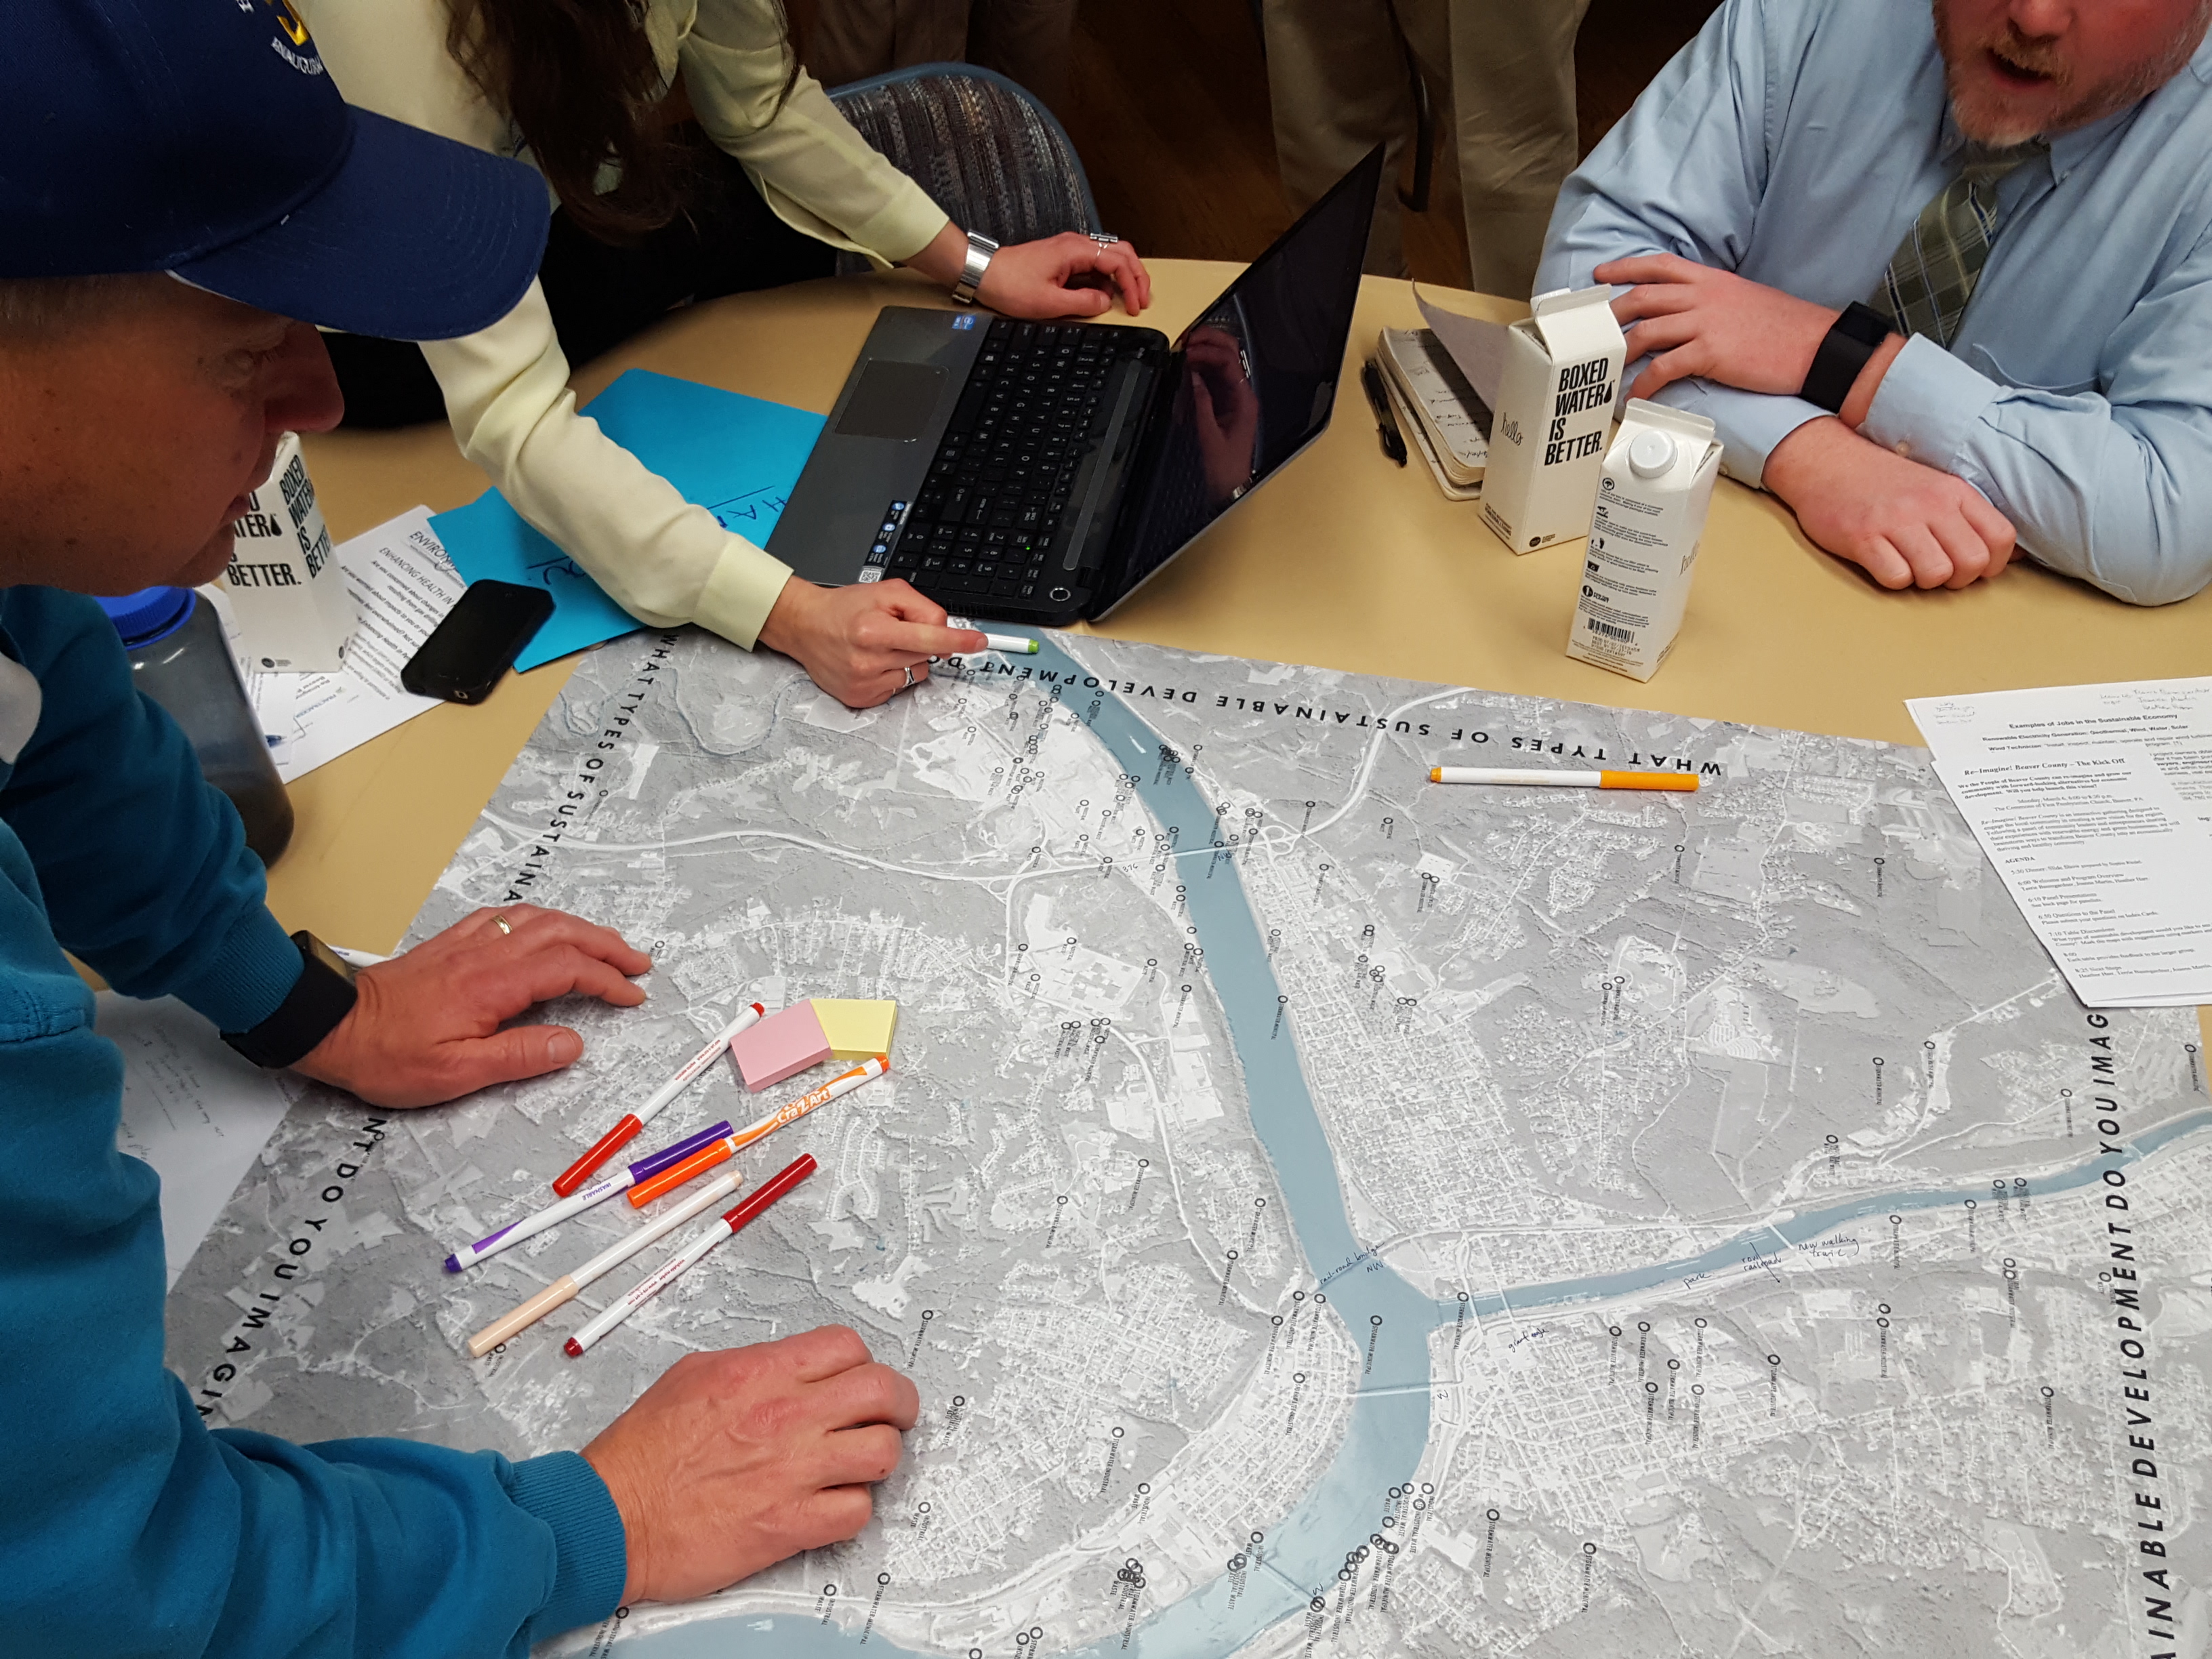
Figure 3: Participants modify maps to reflect a new vision. Photo credit: Sophie Riedel.
The value of beauty was a subtheme in many of the ideas to connect and mobilize the population and goods, ideas which often held a dual aim of protecting open space, creating new parks, and offering recreation possibilities. Participants ambitiously reimagined their river, the Ohio, from its current status as a closed-off corridor for industrial usage and waste, to a recreational resource for kayaking and fishing walleye.
Participants marked up the maps to show the resources that help sustain this community, and voiced a strong desire for development that would enable additional self-reliance. These forward-thinking changes included increased agriculture and use of permaculture techniques, and community gardens for growing food near the people who currently lack access. Ideas for powering the region abounded, like harnessing wind power and putting solar panels on every new building.
Participants were firm on local sourcing for another key resource: the labor required for these efforts, they insisted, must come from the local populace. Educational programs designed to channel learners into workers for sustainability might include training to rebuild homes to “greener” standards, and programs aimed at bringing a new generation of farmers to the fields. Perhaps a nod to the world-wide plastic glut that a petrochemical facility would add to, suggestions even included local ways of dealing with waste, like starting a composting program and establishing more recycling centers.
Whose vision?
Who is a part of this vision, both in creating it and living it out? Inevitably, the selection of panelists and the interests of the audience members themselves influenced the vision this group crafted. The question of inclusion and representation found articulation among many participants, and the hosts of the event welcomed suggestions on reaching a broader audience moving forward. Looking around the room, one man asked, “Where are all the young people, and families with kids?” Indeed, only several members of this demographic were present. Though indicative of the racial makeup of Beaver County, the audience appeared to be primarily white, meaning that the racially diverse communities in the region where not represented. Others pointed out that going forward, the audience should also include those residents struggling with un- and underemployment, who have a major stake in whatever vision of Beaver County comes to fruition. Another said he would like to see more elected officials and leaders present. Notably, Potter Township Board of Supervisors Chairperson, Rebecca Matsco, who is a strong advocate for the proposed petrochemical project in her township, was present for the first half of the event.
Local means for meeting local needs
People who welcome petrochemical development in Beaver County might believe that those who voice concerns about the proposed Shell plant aren’t forward-thinking, or simply oppose change. Quite in contrast, participants at Re-Imagine Beaver County went to work reinventing their community with optimism and enthusiasm. They didn’t seem to be resisting change, but instead, wanting to participate in the process of change and to ultimately see benefits to their community. For example, discussion of solar power generated substantial excitement. According to panel speaker Hal Saville, however, the biggest challenge is making it affordable for everyone, which suggests that the estimated $1.6 billion in tax breaks going to Shell for the petrochemical plant could be better allocated.
A key narrative from supporters of the ethane cracker centers on the pressing need for jobs in this area, though some locals have expressed concern about how many of Shell’s promised jobs would go to residents. Whoever gets hired, these jobs come with serious dangers to workers. Participants at this event proposed alternative initiatives – both ambitious and small – for creating jobs within the community, like providing “sprout funds” to encourage new business start-ups, and launching a coordinated effort to rehab aging housing stock. These ideas suggest that the people of this region feel their energy and ingenuity would be best spent making Beaver County a better place to live and work, in contrast to producing disposable petrochemical products for export around the world. The fact that so many participants emphasized local means for meeting their needs in no way downplays the need for good jobs. Rather, it points to the fact that people want jobs that are good for them and for the future of their community.
Moving the vision forward
Where do we go from here? Can the momentum of this event draw in greater representation from the region to have a voice in this process? Will these visions become animated and guide the creation of a new reality? Broader and deeper planning is in order; participants and panelists alike pointed to tools like comprehensive community plans and cleaner, “greener” industrial policies. More than anything, the group articulated a need for more deliberation and participation. As panelist and farm co-owner Don Kretschmann put it, when it comes to change, we need to “think it through before we go ahead and do it.”
The maps themselves, bearing the inspirations scrawled out during the event, have not reached the end of the road. From here, these maps will accompany an upcoming exhibition of the artworks in Petrochemical America, which locals hope to bring to the greater Pittsburgh area in the coming months. League of Women Voters, for their part, continue to move the vision forward, inviting input from all on next steps, with an emphasis on pulling in a broader cross-section of the community.
To voice your vision, and to stay in the loop on future Re-Imagine Beaver County events, contact reimaginelwvpa@gmail.com.
https://www.fractracker.org/a5ej20sjfwe/wp-content/uploads/2017/03/Re-Imagine-Beaver-Feature-Riedel.jpg400900FracTracker Alliancehttps://www.fractracker.org/a5ej20sjfwe/wp-content/uploads/2025/09/2025-Wordmark-Logo.pngFracTracker Alliance2017-03-24 09:11:252021-04-15 15:03:37Mapping a new vision in PA: Alternatives to petrochemical development
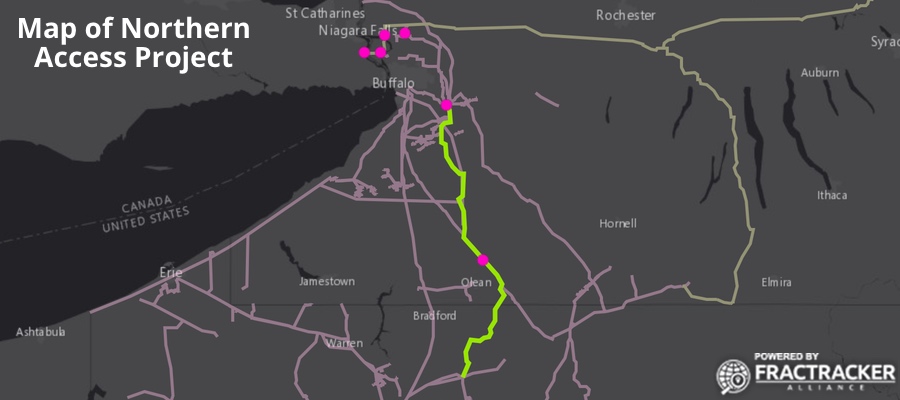
In March 2015, the National Fuel Gas Supply Corporation and Empire Pipeline Company filed a joint application with the Federal Energy Resource Commission (FERC) to construct a new natural gas pipeline and related infrastructure, known collectively as the Northern Access Project (NAPL). The pricetag on the project is $455 million, and is funded through international, as well as local, financial institutions. The Public Accountability Initiative recently produced a report detailing the funding for this pipeline project, entitled “The Power Behind the Pipeline“.
The proposed Northern Access Project consists of a 97-mile-long, 24” pipe that would carry Marcellus Shale gas from Sergeant Township (McKean County), PA, to the Porterville Compressor Station in the Town of Elma (Erie County), NY. Nearly 69% of the proposed main pipeline will be co-located in existing pipeline and power line rights-of-way, according to FERC. The agency says this will streamline the project and reduce the need to rely on eminent domain to most efficiently route the project.
A $42 million, 15,400 horsepower Hinsdale Compressor Station along the proposed pipeline route was completed in 2015. In addition to the pipeline itself, the proposed project includes:
Additional 5,350 HP compression at the existing Porterville Compressor Station, a ten-fold increase of the capacity of that station
A new 22,214 HP compressor station in Pendleton (Niagara County), NY
Two miles of pipeline in Pendleton (Niagara County), NY
A new natural gas dehydration facility in Wheatfield (Niagara County), NY
An interconnection with the Tennessee Gas Pipeline in Wales (Erie County), NY, as well as tie-ins in McKean, Allegany, and Cattaraugus counties
A metering, regulation and delivery station in Erie County
Mainline block valves in McKean, Allegany, Cattaraugus and Erie counties; and
Access roads and contractor/staging yards in McKean, Allegany, Cattaraugus and Erie counties
The above map shows the proposed pipeline (green) and related infrastructure (bright pink). The pale yellow and pink lines on the map are the existing pipelines that the Northern Access Project would tie into. Click here to explore the map fullscreen.
Project Purpose
National Fuel maintains that the goal of the proposed project would be to supply multiple markets in Western New York State and the Midwest. The project would also supply gas for export to Canada via the Empire Pipeline system, and New York and New England through the Tennessee Gas Pipeline 200 Line. The company anticipates that the project would be completed by late 2017 or early 2018. Proponents are hoping that NAPL will keep fuel prices low, raise tax revenues, and create jobs.
Push-back against this project has been widespread from citizens and environmental groups, including Sierra Club and RiverKeeper. This is despite an environmental assessment ruling in July 2016 that FERC saw no negative environmental impacts of the project. FERC granted a stamp of approval for the project on February 4, 2017.
Concerns about the Proposed Pipeline
The Bufffalo-Niagara Riverkeeper, asserts that the project presents multiple threats to environmental health of the Upper Lake Erie and Niagara River Watersheds. In their letter to FERC, they disagreed with the Commission’s negative declaration that the project would result in “no significant impact to the environment.” The pipeline construction will require crossings of 77 intermittent and 60 perennial streams, 19 of which are classified by the New York State Department of Environmental Conservation (NYS DEC) as protected trout streams. Twenty-eight of the intermittent streams impacted also flow into these protected streams. Resulting water quality deterioration associated with bank destabilization, increased turbidity, erosion, thermal destabilization of streams, and habitat loss is likely to impact sensitive native brook trout and salamanders. Riverkeeper found that National Fuel’s plan on how to minimize impacts to hundreds of wetlands surround the project area was insufficient. FERC’s Environmental Assessment of the project indicated that approximately 1,800 acres of vegetation would affected by the project.
Several groups have also taken issue with the proposed project’s plan to use the “dry crossing” method of traversing waterways. Only three crossings will be accomplished using horizontal directional drilling under the stream bed — a method that would largely protect the pipes from dynamic movement of the stream during floods. The rest will be “trenched” less than 5 feet below the stream bed. Opponents of the project point out that NYSDEC, federal guidelines, and even industry itself discourage pipe trenching, because during times of high stream flow, stream scour may expose the pipes to rocks, trees, and other objects. This may lead to the pipes leaking, or even rupturing, impacting both the natural environment, and, potentially, the drinking water supply.
A December 2016 editorial to The Buffalo News addressed the impacts that the proposed Northern Access Project could have to the Cattaraugus Creek Basin Aquifer, the sole source of drinking water for 20,000 residents in surrounding Cattaraugus, Erie, and Wyoming counties in New York. In particular, because the aquifer is shallow, and even at the surface in some locations, it is particularly vulnerable to contamination. The editorial took issue with the absence of measures in the Environmental Assessment that could have explored how to protect the aquifer.
Other concerns include light and noise pollution, in addition to well-documented impacts on climate change, created by fugitive methane leakage from pipelines and compressors.
NYSDEC has held three public hearings about the project already: February 7th at Saint Bonaventure University (Allegany, NY), February 8th at Iroquois High School (Elma, NY), February 9th at Niagara County Community College (Sanborn, NY). The hearing at Saint Bonaventure was attended by nearly 250 people.
While FERC approved the project on February 4, 2017, the project still requires approvals from NYSDEC – including a Section 401 Water Quality Certification. These decisions have recently been pushed back from March 1 to April 7.
Proponents for the project – particularly the pipefitting industry – have emphasized that it would create up to 1,700 jobs during the construction period, and suggested that because of the experience level of the construction workforce, there would be no negative impacts on the streams. Other speakers emphasized National Fuel’s commitment to safety and environmental compliance.
Seneca Nation President Todd Gates expressed his concerns about the gas pipeline’s impacts on Cattaraugus Creek, which flows through Seneca Nation land (Cattaraugus Indian Reservation), and is downstream from several tributaries traversed by the proposed pipeline. In addition, closer to the southern border of New York State, the proposed pipeline cuts across tributaries to the Allegheny River, which flows through the Allegany Indian Reservation. One of New York State’s primary aquifers lies beneath the reservation. The closest that the proposed pipeline itself would pass about 12 miles from Seneca Nation Territory, so National Fuel was not required contact the residents there.
Concerns about Wheatfield dehydration facility & Pendleton compressor station
According to The Buffalo News, National Fuel has purchased 20 acres of land from the Tonawanda Sportsmen’s Club. The company is building two compressors on this property, totaling 22,000 HP, to move gas through two miles of pipeline that are also part of the proposed project, but 23 miles north of the primary stretch of newly constructed pipeline. Less than six miles east of the Pendleton compressor stations, a dehydration facility is also proposed. The purpose of this facility is to remove water vapor from the natural gas, in accordance with Canadian low-moisture standards. According to some reports from a National Fuel representative, the dehydration facility would run only a few days a year, but this claim, has not been officially confirmed.
Residents of both Pendleton and Wheatfield have rallied to express their concerns about both components of the project, citing potential impacts on public health, safety, and the environment relating to air and water quality.
Northern Access Project Next Steps
The deadline for public comment submission is 5 pm on February 24, 2017 — less than two weeks away. To file a comment, you can either email NYS DEC directly To Michael Higgins at NFGNA2016Project@dec.ny.gov, or send comments by mail to NYS DEC, Attn. Michael Higgins, Project Manager, 625 Broadway, 4th Floor, Albany, NY 12233.
Note: this article originally stated that the Porterville Compressor Station would double its capacity as a result of the NAPL project. In fact, the capacity increase would be ten-fold, from 600 hp to about 6000 hp. We regret this error.
by Karen Edelstein, Eastern Program Coordinator, FracTracker Alliance
In the summer of 2015, Sunoco Logistics submitted applications to the Pennsylvania Department of Environmental Protection (DEP) to build its massive Mariner East 2 pipeline. The ME 2 pipeline would have the capacity to transport 275,000 barrels a day of propane, ethane, butane, and other hydrocarbons from the shale fields of Western Pennsylvania to the Marcus Hook export terminal, located on the Delaware River.
Sunoco’s applications were to satisfy the state’s Chapter 105 (water obstruction and encroachment) and Chapter 102 (erosion/sediment control and earth disturbance) permitting requirements. The DEP responded to Sunoco’s application, issuing 20 deficiency letters totaling more than 550 pages. Sunoco resubmitted their application in the summer of 2016 and the DEP again rejected many of its plans to disturb streams, ponds, and wetlands. In December, Sunoco resubmitted its revised application for a third time, hoping for final approval.
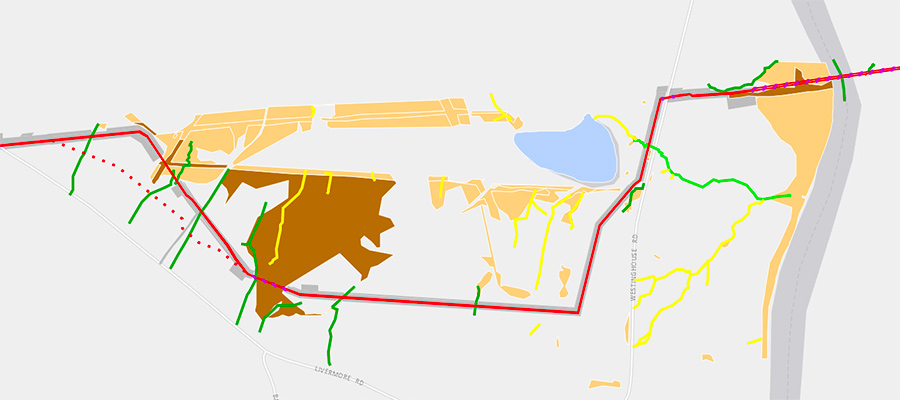
FracTracker Alliance first wrote about ME 2’s risks to watershed in August 2016, following Sunoco’s second application. Readers who want a general overview of the issues may find that article worth reading. In this new article, we dig deeper into the subject. Along with its December application, Sunoco also supplied the DEP with revised GIS files illustrating ME 2’s new route and documents summarizing its impacts to nearby water bodies. We have created a new map utilizing newly available data and provide contextual analysis valuable in determining how Sunoco responds to the DEP’s review of its prior rejected applications.
Detailed Mapping of Water Body Impacts
At the end of December, the DEP finally released Sunoco’s GIS files detailing water bodies that will be impacted by ME 2, as well as Sunoco’s data tables outlining alternative methods that might mitigate certain impacts. Our map (below) combines these new datasets to show the locations where ME 2’s route has changed since Sunoco’s initial application, presumably in response to the DEP’s technical deficiency letter.
Also on this map are water bodies: 1) implicated in ME 2’s environmental impact assessment, 2) determined by the DEP as likely impacted by construction, and 3) identified by Sunoco as having viable construction alternatives to mitigate impacts.
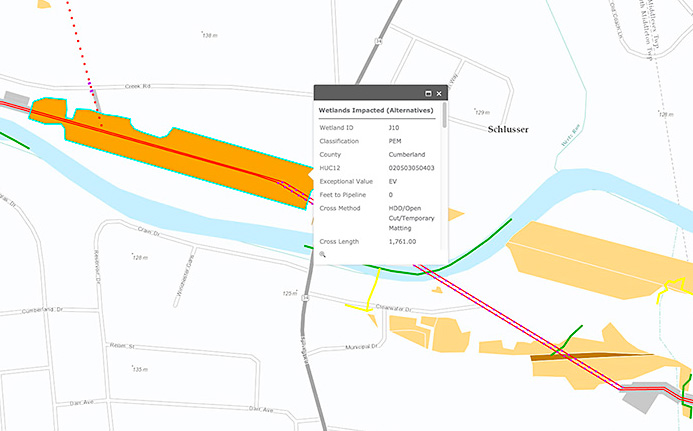
By viewing the map fullscreen and zooming in, one can click on a water feature to reveal its data tables (see below example). These tables contain information on the water body’s flow regime, the extent of permanent and temporary impacts, alternative crossing methods that could be used, and what benefits might come from those alternate methods. Also in the tables are a number of designations such as:
USGS Fish and Wildlife wetland classification (see guide). Most common are PEM (palustrine emergent wetland), PSS (palustrine scrub-shrub wetland), PFO (palustrine forested wetland), and PuB (palustrine unconsolidated bottom – i.e. ponds).
PA DEP stream designation (see guide). Most common are WWF (warm water fishes), CWF (cold water fishes), HQ (high quality), and EV (exceptional value).
PA Fish and Boat Commission classifications (see guide). Most common are ATW (approved trout water), STS (stocked trout stream), Class A (class A water), and WTS (wilderness trout stream).
An example water body data table that can be found on the map:
Our analysis of this new data reveals the number of water crossings in question is significantly higher than what we estimated in August: now totaling 1,222 streams, 34 ponds, and 708 wetlands crossings. This increase is primarily due to Sunoco’s data also containing information on ephemeral and intermittent waters that are not typically accounted for in USGS data (all that was available at the time of our prior analysis).
Defining Impacts
The DEP’s Chapter 105 Joint Permit Application Instructions break down “impacts” into two broad categories: permanent and temporary. These are primarily used to assess environmental impact fees, but are also valuable in determining what parameters Sunoco will be held to during and after ME 2’s construction.
Permanent impacts: are “areas affected by a water obstruction or encroachment that consist of both direct and indirect impacts that result from the placement or construction of a water obstruction or encroachment and include areas necessary for the operation and maintenance of the water obstruction or encroachment located in, along or across, or projecting into a watercourse, floodway or body of water.”
Permanent impacts are calculated using the pipeline’s 50-foot permanent right-of-way. For streams, all bed and banks are to be restored to pre-construction conditions. For ponds and wetlands, permanent impacts are assumed to remain even if the area is considered restored.
Temporary impacts: are “areas affected during the construction of a water obstruction or encroachment that consists of both direct and indirect impacts located in, along or across, or projecting into a watercourse, floodway or body of water that are restored upon completion of construction.” Temporary impacts consist of areas such as temporary workspaces and access roads.
The below table lists the total impacted acres broken down by county. Of interest here is that more than 175 acres would be permanently impacted — equivalent to 134 football fields — with an additional 82 acres temporarily impacted.
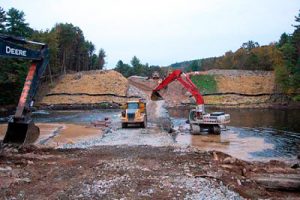
Pipeline companies cross water bodies using a variety of methods depending on their classification. The DEP maintains three general categories for water crossings: minor (in streams less than or equal to 10 feet wide at the water’s edge at the time of construction), intermediate (perennial stream crossings greater than 10 feet wide but less than 100 feet wide at the water’s edge at the time of construction), and major (crossings of more than 100 feet at the water’s edge at the time of construction).
Minor and intermediate crossings often employ rudimentary trenching along “open cut” crossings where the water is either temporarily diverted (wet crossing) or allowed to flow during construction (wet crossing). After the cuts, the company attempts to repair damage done in the process of trenching.
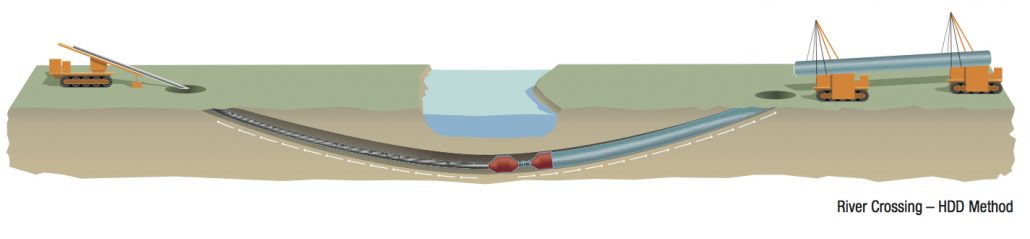
In more sensitive places, such as in exceptional value streams, wetlands, and always in major crossings, a company uses conventional boring to tunnel under a water feature. When boring over long distances, such as under a lake or river, a company turns to Horizontal Directional Drilling (HDD), a more engineered form of boring. An example of HDD boring is seen below (image source):
We were surprised by the number of water crossings identified by Sunoco as having options to minimize impact. As the table below shows, more than 44% (869) of Sunoco’s crossings have an alternate method identified in the resubmitted applications. In most of these instances, the intended crossing method is either trenching through open cuts or dry crossings. The majority of identified alternatives would reduce impacts simply by altering the trenching route. 53 of the 869 were shown to have feasible conditions for conventional or HDD boring, but Sunoco categorized all of these as impracticable options despite their environmental benefits.
Table 2. Number of Crossings With and Without Viable Alternate Methods
Crossings
Assessed but Unimpacted
Impacted with No Alternative
Impacted with Alternatives
Total
Streams
313
925
297
1,535
Ponds
66
3
31
100
Wetlands
963
167
541
1,671
1,342
1,095
869
3,306
Absorbing the Costs of Environmental Impacts
If executed, these alternative methods would decrease the length of crossings, limit right-of-way encroachments, prevent land fragmentation, and significantly reduce risks to larger water bodies. More likely, Sunoco will pay the impact fees associated with the less complicated crossing methods. We’ve summarized these fees (found in Sunoco’s resubmitted application) in the table below. In total, Sunoco would pay roughly $1.8 million in exchange for nearly 2,000 water body crossings – a fraction of the project’s $2.5 billion estimated cost:
Table 3. Impact Fees for Sunoco’s Preferred Crossings
County
Permanent Impacts area (fees)
Temporary Impact area (fees)
Admin Fees
Total Fees
Allegheny
$15,200
$1,600
$1,750
$18,550
Berks
$89,600
$19,600
$1,750
$110,950
Blair
$94,400
$27,200
$1,750
$123,350
Cambria
$162,400
$34,000
$1,750
$198,150
Chester
$83,200
$16,000
$1,750
$100,950
Cumberland
$192,800
$30,800
$1,750
$225,350
Dauphin
$65,600
$26,400
$1,750
$93,750
Delaware
$40,800
$13,600
$1,750
$56,150
Huntingdon
$150,400
$32,400
$1,750
$184,550
Indiana
$92,000
$19,200
$1,750
$112,950
Juniata
$42,400
$12,400
$1,750
$56,550
Lancaster
$37,600
$6,800
$1,750
$46,150
Lebanon
$52,000
$10,400
$1,750
$64,150
Perry
$44,800
$10,800
$1,750
$57,350
Washington
$75,200
$12,000
$1,750
$88,950
Westmoreland
$142,400
$50,000
$1,750
$194,150
York
$28,000
$8,800
$1,750
$38,550
$1,408,800
$332,000
$29,750
$1,770,550
Conclusion
This week, acting DEP Secretary Patrick McDonnell met with residents who voiced frustration that the agency failed to provide an additional public comment period following Sunoco’s application resubmission. Nevertheless, the DEP is expected to greenlight Sunoco’s plans any day now, adding another to the list of recent pipeline approvals in the region. Sunoco needs its permits now in order to begin clearing trees prior to endangered species bat nesting season, which begins in April.
Meanwhile, communities along the pipeline’s path are preparing for the sudden wave of disruption that may ensue. Some have threatened lawsuits, arguing that the resubmitted application still contains many deficiencies including missing wetlands and private drinking wells that must be accounted for. Indeed, the map and data presented in this article confirms that there is still a lot that the general public does not know about ME 2 – in particular, the extent of water impacts the DEP seems willing to accept and the range of options at Sunoco’s disposal that might mitigate those impacts if it were forced to do so.
Finally, it is encouraging to see that the DEP is becoming more transparent in sharing datasets, compared to other pipeline projects. However, this data is complex and not easily understood without sufficient technical expertise. We are discouraged to think that it is unlikely the public will learn about additional changes to the construction plan until after permits are issued. In order for data to be useful, it must be made available throughout the process, not at the end stages of planning, and done so in a way that it becomes integrated into the agency’s public participation responsibilities.
by Kirk Jalbert, Manager of Community-Based Research & Engagement
https://www.fractracker.org/a5ej20sjfwe/wp-content/uploads/2017/02/ME2_technical_def_header.jpg400900FracTracker Alliancehttps://www.fractracker.org/a5ej20sjfwe/wp-content/uploads/2025/09/2025-Wordmark-Logo.pngFracTracker Alliance2017-02-09 11:47:092021-04-15 15:03:45Remaining Questions on Mariner East Technical Deficiencies
by Leann Leiter, Environmental Health Fellow
map & analysis by Kirk Jalbert, Manager of Community-Based Research & Engagement
in partnership with the Environmental Integrity Project
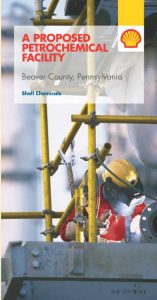
On January 18, 2016, Potter Township Supervisors approved conditional use permits for Shell Chemical Appalachia’s proposed ethane cracker facility in Beaver County, PA. A type of petrochemical facility, an ethane cracker uses energy and the by-products of so-called natural gas to make ethylene, a building block of plastics. FracTracker Alliance has produced informative articles on the jobs numbers touted by the industry, and the considerable negative air impacts of the proposed facility. In the first in a series of new articles, we look at the potential hazards of ethane cracker plants in order to begin calculating the risk of a disaster in Beaver County.
As those who stand to be affected by — or make crucial decisions on — the ethane cracker contemplate the potential risks and promised rewards of this massive project, they should also carefully consider what could go wrong. In addition to the serious environmental and human health effects, which might only reveal themselves over time, what acute events, emergencies, and disasters could potentially occur? What is the disaster risk, the potential for “losses, in lives, health status, livelihoods, assets and services,” of this massive petrochemical facility?
Known Ethane Cracker Risks
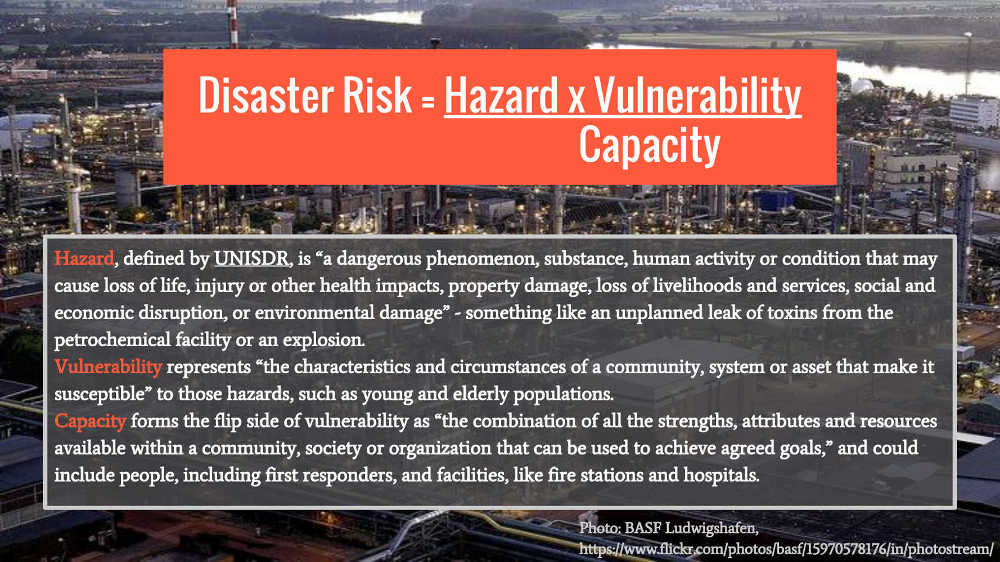
A well-accepted formula in disaster studies for determining risk, cited by, among others, the United Nations International Strategy for Disaster Reduction (UNISDR), is Disaster Risk = (Hazard x Vulnerability)/Capacity, as defined in the diagram below. In this article, we consider the first of these factors: hazard. Future articles will examine the remaining factors of vulnerability and capacity that are specific to this location and its population.
Applied to Shell’s self-described “world-scale petrochemical project,” it is challenging to quantify the first of these inputs, hazard. Not only would a facility of this size be unprecedented in this region, but Shell has closely controlled the “public” information on the proposed facility. What compounds the uncertainty much further is the fact that the proposed massive cracker plant is a welcome mat for further development in the area—for a complex network of pipelines and infrastructure to support the plant and its related facilities, and for a long-term commitment to continued gas extraction in the Marcellus and Utica shale plays.
U.S. Chemical Safety and Hazard Investigation Board, Williams Geismar Case Study, No. 2013-03-I-LA, October 2016.
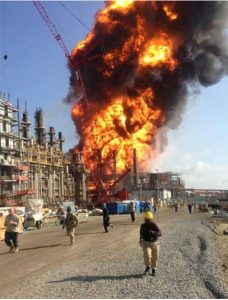
We can use what we do know about the hazards presented by ethane crackers and nearby existing vulnerabilities to establish some lower limit of risk. Large petrochemical facilities of this type are known to produce sizable unplanned releases of carcinogenic benzene and other toxic pollutants during “plant upsets,” a term that refers to a “shut down because of a mechanical problem, power outage or some other unplanned event.” A sampling of actual emergency events at other ethane crackers also includes fires and explosions, evacuations, injuries, and deaths.
For instance, a ruptured boiler at the Williams Company ethane cracker plant in Geismar, Louisiana, led to an explosion and fire in 2013. The event resulted in the unplanned and unpermitted release of at least 30,000 lbs. of flammable hydrocarbons into the air, including ethylene, propylene, benzene, 1-3 butadiene, and other volatile organic chemicals, as well as the release of pollutants through the discharge of untreated fire waters, according to the Louisiana Department of Environmental Quality. According to the Times-Picayune, “workers scrambl(ed) over gates to get out of the plant.” The event required the evacuation of 300 workers, injured 167, and resulted in two deaths.
The community’s emergency response involved deployment of hundreds of personnel and extensive resources, including 20 ambulances, four rescue helicopters, and buses to move the injured to multiple area hospitals. The U.S. Chemical Safety and Hazard Investigation Board chalked up the incident to poor “process safety culture” at the plant and “gaps in a key industry standard by the American Petroleum Institute (API).” The accident shut the plant down for a year and a half.
Potential Risks & Shell’s Mixed Messages
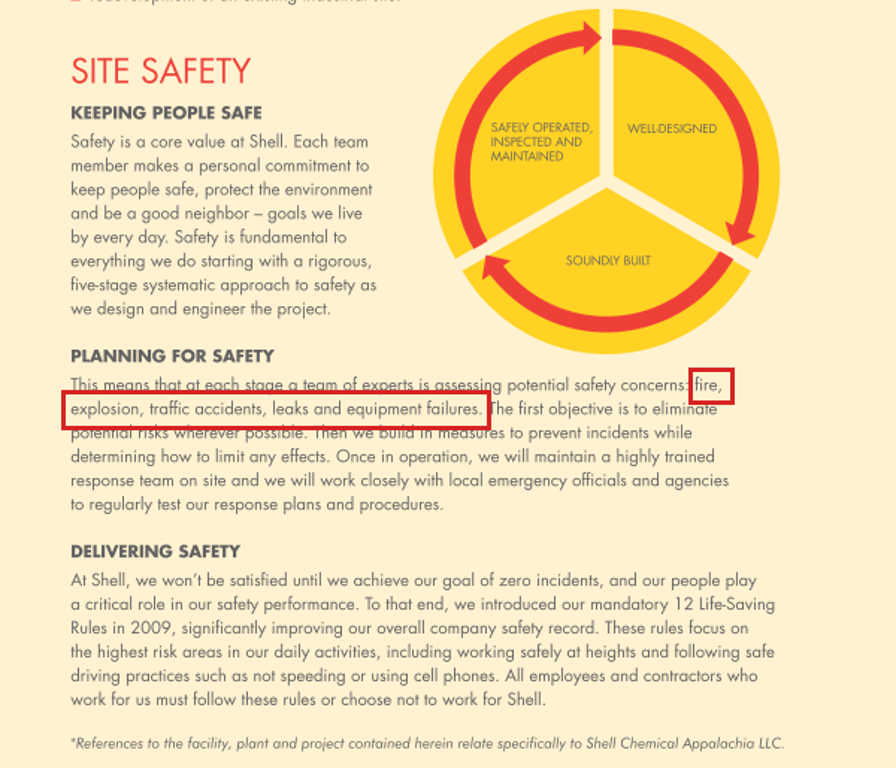
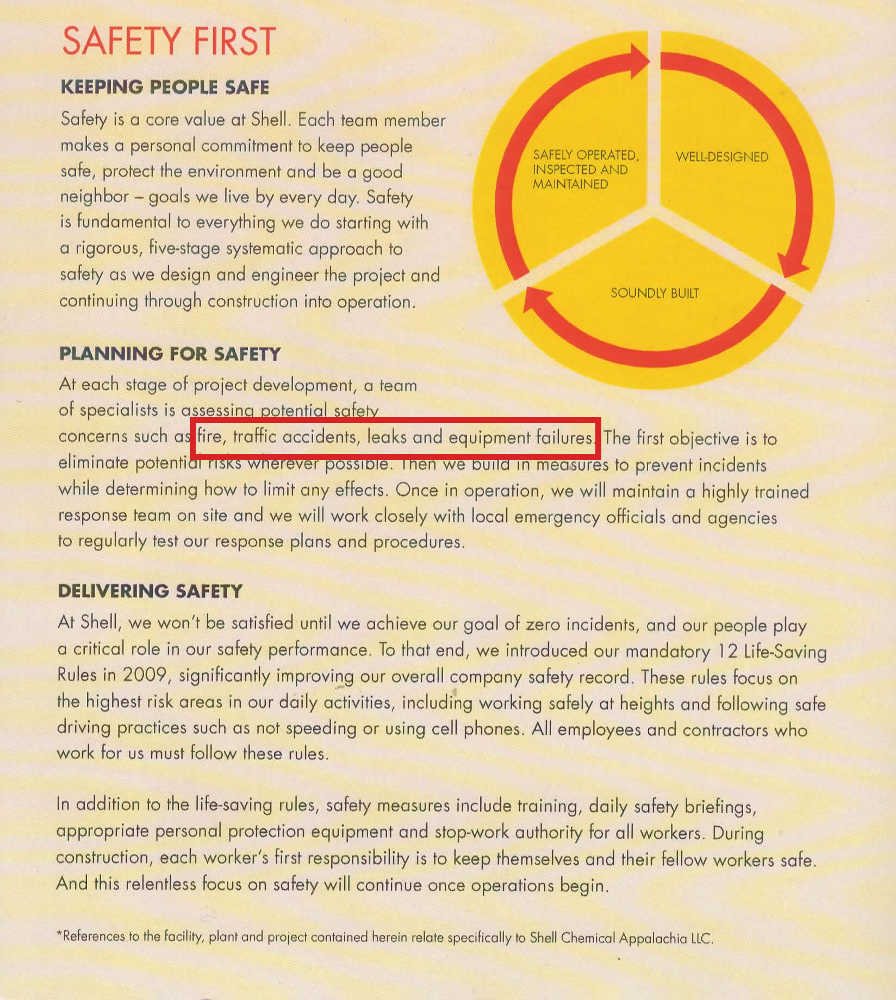
Shell has done little to define the potential for emergencies at the proposed Beaver County ethane cracker plant, at least in materials made available to the public. Shell has revealed that general hazards include “fire, explosion, traffic accidents, leaks and equipment failures.”
However, we located numerous versions of Shell’s handout and found one notable difference among them—the brochure distributed to community members at a December 2016 public hearing held by the Pennsylvania Department of Environmental Protection (PA DEP) excluded the word “explosion” from the list of “potential safety concerns.” The difference is seen in comparing the two documents.
Figure #1 below: Excerpt of online version of a handout for Beaver County, dated May 2015, with “explosion” included in list of “potential safety concerns.” (Other Shell-produced safety documents, like the one included as an exhibit in the conditional use permit application on file with the township, and Shell’s webpage for the project, also include “explosion” in the list of hazards.)
Figure #2 below: Excerpt of handout, dated November 2016 and provided to the community at December 15, 2016 meeting, with the word “explosion” no longer included.
Additional hints about risks are peppered throughout the voluminous permit applications submitted by Shell to the PA DEP and Potter Township, such as references to mitigating acts of terror against the plant, strategies for reducing water contamination, and the possibility of unplanned upsets. But the sheer volume of these documents, coupled with their limitedaccessibility challenge the public’s ability to digest this information. The conditional use permit application submitted by Shell indicates the existence of an Emergency Response Plan for the construction phase, but the submission is marked as confidential.
Per Pennsylvania law, and as set forth in PA DEP guidelines, Shell must submit a Preparedness, Prevention, and Contingency Plan (PPC Plan) at an unspecified point prior to operation. But at that likely too-late stage, who would hear objections to the identified hazards, when construction of the plant is already a done deal? Even then, can we trust that the plan outlined by that document is a solid and executable one?
Shell’s defense of the Beaver County plant is quick to point out differences between other plants and the one to come, making the case that technical advances will result in safety improvements. But it is noteworthy that the U.S. Chemical Safety and Hazard Investigation Board attributes failures at the Williams Geismar plant, in part, to “the ineffective implementation of…process safety management programs… as well as weaknesses in Williams’ written programs themselves.” The Geismar explosion demonstrates some of the tangible hazards that communities experience in living near ethane cracker plants. It is worth noting that the proposed Beaver County facility will have about 2½ times more ethylene processing capacity than the Geismar plant had at the time of the 2013 explosion.
Opening the Floodgates
In an effort to expand our understanding of risk associated with the proposed Beaver County ethane cracker and the extent of related developments promised by industry leaders, FracTracker Alliance has constructed the below map. It shows the site of the Shell facility and nearby land marked by Beaver County as “abandoned” or “unused.” These land parcels are potential targets for future build-out of associated facilities. Two “emergency planning zones” are indicated—a radius of 2 miles and a radius of 5 miles from the perimeter of Shell’s site. These projections are based upon FracTracker’s discussions with officials at the Saint Charles Parish Department of Homeland Security and Emergency Preparedness, who are responsible for emergency planning procedures in Norco, Louisiana, the site of another Shell ethane cracker facility. The emergency zones are also noted in the 2015 Saint Charles Hazard Mitigation Plan.
Also shown on the map is an estimated route of the Falcon pipeline system Shell intends to build, which will bring ethane from the shale gas fields of Ohio and Pennsylvania. Note that this is an estimated route based on images shown in Shell’s announcement of the project. Finally, our map includes resources and sites of vulnerability, including schools, fire stations, and hospitals. The importance of these sites will be discussed in the next article of this series.
While the site of the Shell cracker is worth attending to, it would be a mistake to limit assessments of disaster risk to the site of the facility alone. Shell’s proposed plant is but one component in a larger plan to expand ethane-based processing and use in the region, with the potential to rival the Gulf Coast as a major U.S. petrochemical hub. An upcoming conference on petrochemical construction in the region, scheduled for June 2017 in Pittsburgh, shows the industry’s commitment to further development. These associated facilities (from plants producing fertilizers to plastics) would utilize their own mix of chemicals, and their potential interactions would produce additional, unforeseen hazards. Ultimately, a cumulative impact assessment is needed, and should take into account these promised facilities as well as existing resources and vulnerabilities. The below Google Earth window gives a sense of what this regional build-out might look like.
What might an ethane cracker and related petrochemical facilities look like in Beaver County? For an idea of the potential build-out, take a tour of Norco, Louisiana, which includes Shell-owned petrochemical facilities.
Final Calculations
As discussed in the introduction, “hazard,” “vulnerability,” and “capacity” are the elements of the formula that, in turn, exacerbate or mitigate disaster risk. While much of this article has focused on drastic “hazards,” such as disastrous explosions or unplanned chemical releases, these should not overshadow the more commonplace public health threats associated with petrochemical facilities, such as detrimental impact on air quality and the psychological harm of living under the looming threat of something going wrong.
The second and third articles in this series will dig deeper into “vulnerability” and “capacity.” These terms remind us of the needs and strengths of the community in question, but also that there is a community in question.
Formulas, terminology, and calculations should not obscure the fact that people’s lives are in the balance. The public should not be satisfied with preliminary and incomplete risk assessments when major documents that should detail the disaster implications of the ethane cracker are not yet available, as well as when the full scale of future build-out in the area remains an unknown.
Much gratitude to Lisa Graves-Marcucci and Lisa Hallowell of the Environmental Integrity Project for their expertise and feedback on this article.
The Environmental Integrity Project is a nonpartisan, nonprofit watchdog organization that advocates for effective enforcement of environmental laws.
https://www.fractracker.org/a5ej20sjfwe/wp-content/uploads/2017/02/ethane-cracker-hazards-1-header.jpg400900FracTracker Alliancehttps://www.fractracker.org/a5ej20sjfwe/wp-content/uploads/2025/09/2025-Wordmark-Logo.pngFracTracker Alliance2017-02-08 13:30:042021-04-15 15:03:46A Formula for Disaster: Calculating Risk at the Ethane Cracker
These agencies differ greatly in how they oversee protections of their respective watersheds, particularly in the context of oil and gas development. For instance, the DRBC engages in a range of activities related to water quantity protection (like water supply allocation and water conservation), water quality, regulatory review and permitting, watershed-wide planning, flood mitigation and drought management, and recreational activities. Meanwhile, ORSANCO and the SRBC interpret their responsibilities very narrowly, primarily focusing on managing issues related to discharge standards in the case of ORSANCO, and water quantity in the case of the SRBC.
Major watershed boundaries in PA, with the Susquehanna River Basin shown in pale green. Source: DCNR
In this new series of articles, FracTracker Alliance, in partnership with the Sierra Club Pennsylvania Chapter and Clean Water Action, takes a closer look at the Susquehanna River Watershed and its many challenges related to industrial development, including deforestation and sedimentation issues, nutrient loading from poor agricultural practices, sewer and stormwater runoff. A significant component of Susquehanna River Basin impacts can be attributed to expanding oil and gas development. How will the Susquehanna River Watershed withstand future impacts from the oil and gas industry given the SRBC’s limited oversight? A first step in understanding the problem is to look at the state of the watershed today.
Oil & Gas in the Susquehanna River Watershed
As part of the ongoing Marcellus Shale oil and gas boom, nearly 5,500 unconventional wells on roughly 2,000 well pads have been drilled in the Susquehanna River Watershed since 2007. According to the Nature Conservancy, shale gas companies could drill 27,600 additional wells in the Susquehanna River basin by 2030, which would result in approximately 6,900 well pads (assuming four wells per pad, a relatively conservative number given recent trends where up to a dozen wells are being drilled on a single pad). These additional 4,900 well pads represent 31,850 acres of disturbed lands for the pads and access roads alone. Overall, the Nature Conservancy believes that up to 110,000 acres of forested land could be cleared in the Susquehanna River Watershed by 2030. In addition to well pads and access roads, one must also account for the impacts of associated pipelines. Estimates suggest that 12-15 acres of gathering line are installed per acre of well pad.
This explosive growth of the shale drilling industry, combined with declining resources for regulatory oversight, would complicate regional watershed management strategies. A growing body of evidence suggests that watersheds near hydraulic fracturing operations can be impacted by improper waste disposal, trucking accidents, migration of drilling fluids, as well as problems related to land disturbance such as pipeline and access road stream crossings, sedimentation and runoff (needs a reference). And while there are two major water monitoring programs operating in the Susquehanna River, one run by the Pennsylvania Department of Environmental Protection (PA DEP) and the other operated by the SRBC, significant questions remain about their ability to assess the Susquehanna River’s water quality. These concerns primarily stem from the infrequent and patchwork-like coverage of their sampling regimes, as well as inconsistencies in indicators measured at different sites.
Existing Water Monitoring Efforts
Watershed testing is key to understanding how industrial development affects water quality. It also significantly informs mitigation strategies. In this first map of the series (below), we have put together several layers to help illustrate the state of water testing in the Susquehanna River Basin. This map can be used to obtain summary information about unconventional oil and gas activity and monitoring efforts at the watershed level by clicking on individual features.
Note that there are two separate layers on this map depicting summary data — one outlined in dark green and one in light green, both at HUC-08 level. The dark green outlines are in PA only and contain oil and gas summaries of wells and violations. The light green outlines show agency-based monitoring activity, and are not restricted to PA boundaries. The reason for the two layers is that states classify oil and gas wells differently and so cannot be combined easily.
The Susquehanna River Basin has over 49,000 miles of waterways, according to the SRBC. While it may not be possible to fully document the impacts that the oil and gas industry has on the basin, there are some efforts underway to chronicle changes to the river system. In this map, we look at the efforts of governmental and quasi-governmental agencies to test the waters throughout the region, which range from periodic grab samples to automated data loggers that constantly evaluate several measures of water quality. There are advantages to both methods, as data loggers can capture short term spikes in conductivity, for example, that monthly sampling would likely miss altogether. However, grab sampling allows for a more in-depth analysis of the water in a laboratory than what the data loggers can provide.
While oil and gas is the focus of the map, it is not the only concern of the SRBC. Thus, considerable testing occurs in areas that are not seeing drilling activity. The drilling regions are shown on the map as a great orange arc, extending from Indiana County in the west-central part of Pennsylvania all the way to Susquehanna county in the Northern Tier. If you zoom in on this region, data for individual unconventional wells will become visible, along with permits for wells that have yet to be been drilled, and violations that have been issued by DEP.
Clusters of Development and Oversight
In some regions of the Susquehanna basin, there are significant clusters of oil and gas activity without a corresponding governmental monitoring regimen. Other areas have significant monitoring coverage. In many cases, periodic grab samples are taken from the same sites as data loggers – and may therefore appear twice on our map – to capture both aspects of monitoring activity. Our map can be used to find quick summary data for a given watershed. For example, the Upper Susquehanna-Tunkhannock watershed is being monitored with 53 testing sites and nine data loggers. The same region has 2,178 wells, and 2,347 violations associated with these wells.
We can also use the map to focus on concerns at different scales. The cluster of drilling activity in Ulysses Township, seen below, resulted in a number of violations (shown in yellow). Due to historical impact of the oil and gas industry in this sub-watershed, additional monitoring locations might be called for.
While we think that it is important to protect all the Susquehanna’s waters, certain areas are more fragile than others. For instance, headwater streams that are designated as high quality (HQ) or exceptional value (EV) are vital to the overall health of the river system and their protection is required by Pennsylvania law. However, many headwaters streams have no monitoring despite heavy oil and gas drilling, as can be seen in the below map. We have included HQ/EV designated streams on the map, although due to the large amount of data these streams are not displayed by default. They can be seen by activating the layer.
Broader Implications
The Susquehanna River provides drinking water to 4.1 million people, including residents in New York, Pennsylvania, and Maryland. In addition, through water that is diverted to areas outside the watershed, it is estimated that the Susquehanna also serves as a drinking water supply for 2 million people in more populated areas such as Baltimore, MD and Chester County, PA. With clean drinking water hanging in the balance, and the potential build-out of thousands more natural gas well pads in the watershed, it is more important than ever to understand how oil and gas activity could affect the watershed.
The Pennsylvania Constitution reminds us of our right to clean air, pure water, and the preservation of the environment. Prior to the adoption of the Environmental Rights Amendment — 80 years ago this year — and long before the federal Clean Water Act, the Pennsylvania legislature passed the state level Clean Streams Law in recognition of the need to protect the integrity of our valuable aquatic resources. In the spirit of this tradition to lead on clean water issues, the SRBC, Pennsylvania, and surrounding states must commit to putting the protection and preservation of the Susquehanna River watershed at the forefront of decision-making within the basin.
In future installments of this series, we seek to reveal gaps in watershed and land management plans in order to evaluate what these risks mean for the people and environments of the Susquehanna River Basin. The mapping and analysis provided in this series will be used to frame a series of conversations throughout the Basin with the goal of encouraging concerned residents to become more involved in public discussions about watershed management planning. Further, this project will result in recommendations for tangible solutions to filling oversight and management gaps and communicate these findings to relevant agencies. Only with adequate information can the public ensure strong protections for this life-sustaining waterway. Recognizing the important work that the SRBC has done in recent years, we also hope to identify areas where the Commission can direct additional resources to analyzing the cumulative impacts of shale gas development and expand their oversight strategies.
https://www.fractracker.org/a5ej20sjfwe/wp-content/uploads/2017/01/Susq_intro_header.jpg400900FracTracker Alliancehttps://www.fractracker.org/a5ej20sjfwe/wp-content/uploads/2025/09/2025-Wordmark-Logo.pngFracTracker Alliance2017-02-01 11:50:442021-04-15 15:03:47An Introduction to the Susquehanna River Basin Impacts Project
The Pennsylvania Department of Environmental Protection (DEP) logs incoming complaints from residents about drilling activity in the Commonwealth, and Public Herald has spent a great deal of time aggregating and making that information public. A recent investigation by Public Herald into that data, with help from FracTracker, has highlighted a number of concerning issues related to fracking in Pennsylvania unfortunately.
Concerning Complaints
Firstly, the data they reviewed indicate that complaints from residents about unconventional drilling (how most fracked wells are designated) are more common than those about traditional wells. Secondly, it seems that complaints about fracked wells are increasing over time, even though the number of new wells has decreased.
There may be several reasons for such trends, and Public Herald discusses some of them in their new report. Are fracking wells more likely to fail, resulting in a higher proportion of complaints from nearby residents? Or has tracking simply improved in recent years? What these trends undoubtably indicate, however, is that the impacts from drilling have been systemic, according to Drs. Ingraffea and Stolz, who also reviewed the data.
Probably the most troubling finding unearthed in this investigation is that the PA DEP was not transparent about complaint data. The information they released to Public Herald differed wildly from the spreadsheets previously obtained by other requestors. Learn more about this and other issues in Public Herald’s Hidden Data Report.
The above map by Public Herald and FracTracker Alliance shows the density of citizen complaints reported to the Department of Environmental Protection from 2004 – 2016. It includes conventional and unconventional well complaints. Clicking on a township reveals a database of complaints where viewers can download files.
In addition to the report issued by Public Herald, you can explore the data mapped above in the table below. It fleshes out how many complaints have been issued by residents, where these complaints originated, and how many are specific to water issues.
Table 1. PA Unconventional Well Complaint Statistics Logged by the PA DEP
DEP Office
County
Total Complaints (#)
Water Complaints (#)
Municipalities w/Complaints (#)
Drilled Unconventional Wells, Jan 2004 – Nov 29 2016