WASHINGTON, DC – As oil and gas representatives descend on Pittsburgh this week for the annual Shale Insight conference, four advocates working to protect their communities from the harms of oil and gas development have been selected to receive the 2018 Community Sentinel Award for Environmental Stewardship, coordinated by FracTracker Alliance:
Ellen Gerhart – Pennsylvania
Natasha Léger – Colorado
Rebecca Roter – Pennsylvania, now Georgia
Youth award: Nalleli Cobo – California
This year’s recipients have founded grassroots organizations to protect communities from nearby drilling, paired traditional advocacy with scientific savvy, protested pipelines on land taken by eminent domain, and organized to stop urban drilling despite persistent health problems related to the drilling activity.
“The impacts of the oil and gas industry are visible across the United States, but hope abounds in the volunteers working in their communities and cherished places to document, report, and confront fossil fuel harms,” remarked Brook Lenker, Executive Director of FracTracker Alliance. “We are proud to honor Ellen, Natasha, Rebecca, and Nalleli this year, whose noble actions exemplify the transformative power of caring, committed, and engaged people.”
These four steadfast advocates were nominated by peers and selected by a committee of community defense leaders: Raina Rippel of Southwest Pennsylvania Environmental Health Project (Pennsylvania); Dan Shaffer of Allegheny-Blue Ridge Alliance and Dominion Pipeline Monitoring Coalition (Virginia); Dan Xie of Student PIRG (Florida); Jill Hunkler- Native American activist (Ohio); and Elena Sorokina of Crude Accountability (Washington, DC).
The award recipients will each receive $1,000 for their efforts and be recognized at an evening reception at the Renaissance Pittsburgh Hotel in Pittsburgh, Pennsylvania on Monday, November 26, 2018. The reception will also recognize heroes of the movement who recently passed away. Purchase tickets ($40).
This year’s major Community Sentinel sponsors include 11th Hour Project, The Heinz Endowments, and Foundation for Pennsylvania Watersheds. Award partners (to date) include Allegheny-Blue Ridge Alliance, Breathe Project, Center for Coalfield Justice, Crude Accountability, Earthworks, Food & Water Watch, Halt the Harm Network, Ohio Valley Environmental Coalition, Pipeline and Property Rights Center, Save the Hills Alliance, Sierra Club, Southwest Pennsylvania Environmental Health Project, and Viable Industries. View current sponsors and partners.
To learn more about the fourth annual Community Sentinel Award for Environmental Stewardship and to purchase tickets to the reception on November 26th, please visit: fractracker.org/sentinel-award.
# # #
About FracTracker Alliance
FracTracker Alliance is a national non-profit with regional offices in California, New York, Ohio, Pennsylvania, Washington DC. The organization’s mission is to study, map, and communicate the risks of oil and gas development to protect our planet and support the renewable energy transformation. Learn more at fractracker.org.
Press Contact For Release on October 24, 2018
Samantha Rubright malone@fractracker.org (preferred)
(202) 630-6426
https://www.fractracker.org/a5ej20sjfwe/wp-content/uploads/2016/06/SentinelAward-Feature.jpg400900FracTracker Alliancehttps://www.fractracker.org/a5ej20sjfwe/wp-content/uploads/2025/09/2025-Wordmark-Logo.pngFracTracker Alliance2018-10-24 10:14:212021-04-15 14:57:35Four environmental stewards receive the 2018 Community Sentinel Award
In August 2016, Shell announced plans for the “Falcon Ethane Pipeline System,” a 97-mile pipeline network intended to feed Shell’s ethane cracker facility in Beaver County, Pennsylvania. In response to available data, FracTracker launched the Falcon Public EIA Project in January of 2018 to unearth the environmental and public health impacts of the proposed pipeline. As part of that project, today we explore Shell’s Chapter 105 application and the deficiencies the Pennsylvania Department of Environmental Protection (DEP) cited after reviewing Shell’s application.
Just a heads up… there are a lot.
Shell originally submitted a Chapter 105 application to the DEP to receive a permit for water obstruction and encroachment. The DEP began reviewing the application in January of 2018. On June 1st, they sent Shell technical deficiency letters listing several issues with the application. Shell responded to these deficiencies on August 1st.
Now, it’s up to the DEP to decide if Shell’s response is adequate, and if the department should go ahead and approve the application or require more work from Shell. Explore the technical deficiencies below for more information.
Technical Deficiencies
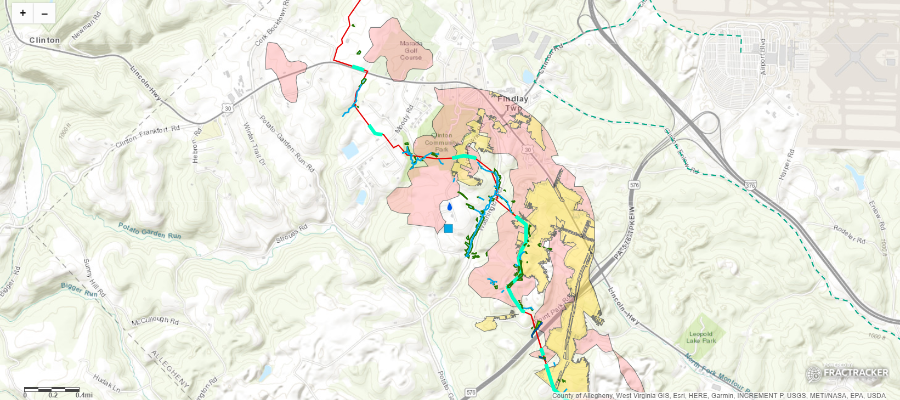
Below is a map that highlights several of the deficiencies the DEP found with Shell’s application and a brief explanation of each one. Expand the map full-screen to explore more layers – Some layers only become visible when you zoom in due to the level of detail they display.
Next, we’ll walk you through the technical deficiencies, which we have broken down into the following categories:
Wetlands, rivers, streams
Stormwater control
Public health and safety (drinking water & trails)
Conservation areas
Alternative routes
Geological concerns (including mining issues)
Documentation issues
Legend
A = Allegheny County, B = Beaver County, W = Washington County. The numbers reference the number listed in the deficiencies letter.
1. Wetlands, Rivers, & Streams
Water withdrawal from rivers and discharge
B2A2W2 The project will discharge waste water from an industrial activity to a dry swale, surface water, ground water, or an existing sanitary sewer system or separate storm water system. The DEP requested that Shell identify and describe this discharge, as the DEP’s Clean Water Program must authorize discharges. Shell stated that water will be discharged from hydrostatic testing, (which ensures a pipeline can withstand high pressure by pumping water through it to test for leaks), and a PAG-10 permit (needed for hydrostatic test water discharge) was submitted to the DEP July 27, 2018 with the locations of discharge. Drawings of the discharges are in Attachment O. (The locations of the discharges were not included in Shell’s public response to this deficiency.)
B33 A31 W31 Shell will be withdrawing water for hydrostatic testing. The DEP asked Shell to explain the intake and discharge methods so the DEP can decide if these should be included as impacts. The DEP also asked Shell to provide the location of intake and discharge. The DEP’s Clean Water Program must authorize discharges. In response, Shell stated that water will be withdrawn from Raccoon Creek and the Ohio River in West Virginia. The specific locations are listed in the PAG-10 permit, submitted to the DEP in July. Drawings of the discharges are included in Attachment O.
Wetlands and Streams
B5 A3 W4 The DEP asked Shell to identify the presence of wetlands within the project area that are identified by the US Fish & Wildlife Service’s National Wetlands Inventory (NWI) data system, and provide data on how they may be impacted by the proposed pipeline.Shell identified one NWI wetland in Beaver County, but did not delineate or provide information on it, due to safety concerns (it’s on a steep cliff). This wetland will be crossed via HDD (horizontal directional drill). In Allegheny County, there is an NWI wetland that Shell also did not provide data on. This wetland was not initially evident, and when staff returned to survey it, the property owner did not let them access the site becausethey did not want a pipeline on their property. According to Shell, this NWI wetland is not within the “Project’s Limit of Disturbance.” In Washington County, Shell stated that “all of the NWI-mapped wetlands that were determined not to be wetlands have been accounted for in Washington County. These NWI wetlands were all located in an area that had been previously strip-mined and due to mining activities, those wetlands are no longer there. Data were taken for these areas and included… separately as Attachment D.” Also in Washington County is an NWI wetland located above the Panhandle Trail, which Shell determined to be outside of the study area and therefore did not collect data on it. This wetland is not on the map, but Shell did provide this image of it.
B6 A4W5 The DEP requested that Shell match off-line wetland data with sampling point locations from study area maps. In response, Shell placed offline data sheets in the order that they are in Table 3 in the Wetlands Delineation Report and in Table 4 in the Watercourse Delineation Report.
B7 A5W6 Shell needed to discuss the types and conditions of riverine resources that the project impacts. Specifically, how the conditions of these resources relate to their hydrological functions, biogeochemical functions, and habitat attributes. These are discussed under question 7 for Beaver County, question 5 for Allegheny County, and question 6 for Washington County.
B8 A6 W7 Shell needed to discuss the types and conditions of wetlands that the project impacts. Specifically, how the conditions of these wetlands contribute to their hydrological functions, biogeochemical functions, and habitat attributes. Shell also needed to discuss impacts to wetlands that will be temporarily impacted, as it previously only discussed wetlands facing permanent impacts. These are discussed under question 8 for Beaver County, question 6 for Allegheny County, and question 7 for Washington County.
B9 A7 W8 The DEP asked Shell to evaluate the impact of open cut installation on wetlands with perched water tables and/or confining layers. Perched water tables have an impermeable confining layer (such as clay) between them and the main water table below. If open cut methods are used, the confining layer is destroyed and this water table will be lost. In Beaver County, Shell identified one wetland (W-PA-170222-MRK-002) will be open cut. If it is perched, Shell states it will replace the confining layer “along the same horizon during pipeline backfilling, and then [compact the layer] so that hydrology may be maintained.” Shell will also put trench plugs “on either side of the wetland on the ROW to prevent water from migrating out on the sides.” In Allegheny County, there are three wetlands potentially on perched water tables that will be open cut: W-PA-160401-MRK-006, W-PA-161220-MRK-001, and W-PA-161220-MRK-002.In Washington County, there are three wetlands potentially on perched water tables that will be open cut: W-PA-160407-JLK-002, W-PA-151203-MRK-005, and W-PA-151203-MRK-006.
A11 The DEP asked Shell to evaluate if any wetlands can be classified as “exceptional value” due to their proximity to nesting areas of the northern harrier (a threatened species in Pennsylvania). Wetlands are exceptional value if they serve as habitat for threatened or endangered species, or if they are hydrologically connected to or located within 0.5 miles of wetlands that maintain habitat for the species in the wetland. Shell determined that there are six wetlands that could be nesting areas for northern harriers, and therefore are exceptional value (W-PA-170207-MRK-002, W-PA-161205-WRA-001, W-PA-170207-MRK-003, W-PA-170207-MRK-001, W-PA-170113-MRK-008, W-PA-170113-MRK-001). Three of these wetlands are within the project’s LOD (W-PA-170207-MRK-002, W-PA-161205-WRA-001, W-PA-170207-MRK-003).
B13 A10W11 The DEP asked Shell to evaluate whether the proposed Falcon Pipeline will impact wetlands that are of “exceptional value” based on their proximity to public water systems. Wetlands can be considered “exceptional value” if they are located along public or private drinking water supplies (surface or ground water), and help maintain the quality or quantity of the supply. Shell stated that the (potentially man made) ponds near public water supply A could be considered exceptional value, however, they are located outside of the project’s study area and were not delineated, therefore Shell does not have information on them or their impact to this well. There were no other wetlands Shell considered to be exceptional value based on their proximity to public water systems.
B21 There were two protected plant species- harbinger of spring (PA threatened) and purple rocket (PA endangered)- located within the Raccoon Creek floodplain. The DEP asked Shell to evaluate whether there are wetlands in the project area that should be considered “exceptional value” due to their proximity to these species. Wetlands are considered “exceptional value” if they serve as habitat for a threatened or endangered plant or animal species. They are also exceptional value if they are hydrologically connected to or located within 0.5 miles of wetlands that maintain the habitat of the species. There are six wetlands near populations of these plant populations: W-PA-151014-MRK-001, W-PA-151013-MRK-002, -003, and -004, W-PA-170407-JLK-001, W-PA151013-MRK-001. However, Shell stated that the harbinger of spring is not dependent on wetland habitat for survival and the species is considered an upland plant species (because it is not listed on Eastern Mountains and Piedmont List or on the National Wetland Plant List). Purple rocket is listed as a “Facultative Wetland Plant” (FACW) on both lists. However, Shell stated that, “although it is a FACW, this plant is not one that occurs in wetlands,” and the population of purple rocket was found in an upland, disturbed area. Therefore, Shell determined that none of these wetlands are considered exceptional value.
B23 A21 W21 Shell needs to assess cumulative impacts to wetlands from the proposed pipeline and other existing projects and potential future projects. These are discussed in the Cumulative Impact Assessment document, Sections 4.1 and 4.2, and Tables B1 and B2.
B24 A22 W22 Shell needed to provide an explanation of how it will restore wetlands and streams disturbed during construction. The explanation needed to include information on seed mixes, shrubs, and trees that will restore stream banks and riparian areas.
B26 A24 W24 Shell needed to provide a table that lists, describes, and quantifies permanent impacts to wetlands and watercourses. Shell stated that there are no permanent fills associated with the project, but there will be permanent conversion impacts to the following wetlands. They total 10,862 ft2 or 0.25 acres in Beaver County, 5,166 ft2 (0.12 acres) in Allegheny County, and 4971 ft2 (0.11 acres) in Washington County. (W-PA-151013-JLK-005, W-PA-161202-MRK-001, W-PA-160404-MRK-001, W-PA-160412-CBA-004, W-PA-160412-CBA-001, W-PA-161205-WRA-003, W-PA-160401-MRK-005, W-PA-170213-JLK-003, W-PA-160406-MRK-001, W-PA-170413-RCL-005, W-PA-170214-CBA-005.)
B27 A25 W25 Shell needed to provide more information on the Neshannock Creek Restoration site, including a master restoration plan for the entire site. This mitigation is required to offset conversion impacts to wetlands along the pipeline route. The plan for the site is documented here.
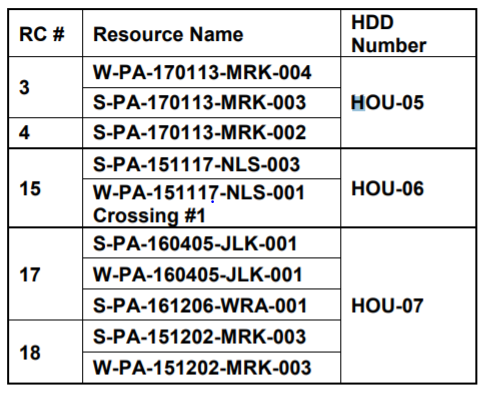
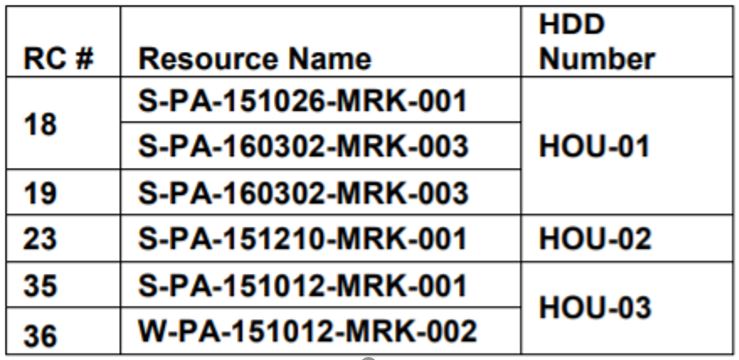
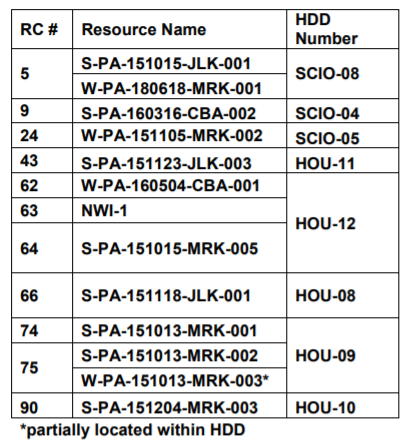
B28 A26 W26 Shell needed to provide the location and resource crossing number for the HDDs in PA. They are listed in these tables:
Allegheny County:
Washington County:
Beaver County:
2. Stormwater control
B3 A1 W1 Shell indicated that the project was in a floodplain project by the Commonwealth, a political subdivision of the commonwealth or a public utility. The DEP asked for an identification of this floodplain project, to which Shell responded that it misunderstood the question and the pipeline will not go through a floodplain project by one of these entities, but rather a floodway. The pipeline will pass many floodways, which are listed in Table 1 in separate documents for Beaver County, Allegheny County, and Washington County.
W3 The DEP requested that Shell provide an analysis of impact to Act 167 plans. Act 167 requires counties to create stormwater management plans and municipalities to adopt ordinances to regulate development in accordance with these plans. The pipeline route occurs in areas with Act 167 plans in Chartiers Township, Mount Pleasant Township, and Robinson Township.
3. Public health and safety
B1 The proposed pipeline does not meet the provisions of a zoning ordinance or have zoning approval in a particular area. Specifically, in Independence Township, the pipeline is within setback distances of places of congregation and/or of residences. One example is the Beaver County Conservation District, considered a place of congregation. Shell responded to this deficiency, saying it is working with Independence Township to obtain necessary approvals, and the township will “officially remove the pipeline ordinance from their records and no variances or permits will be required.”
B10 A8W9 The DEP requested that Shell evaluate and discuss how the pipeline may impact public water systems that are within 1 mile of the pipeline route. Shell located 12 sites within a mile, most of which are ground water wells. One site is the Ambridge Water Authority, which provides drinking water for an estimated 30,000 people. Shell stated that impacts “might include an Inadvertent Return (IR) causing a bentonite slurry mix to enter the supply, which might contaminate the supply for any wells that are located near an HDD site or construction equipment.” Shell stated that all wells are a minimum of 1000 feet outside construction zones and built in thick bedrock which will minimize threat on contamination. The sites within 1 mile include:
Youthtowne Barn
Beaver County Conservation District
Independence Elementary School
Independence Volunteer Fire Department
McConnell’s Farm and Market, Inc
Ambridge Water Authority- Independence Township
Ambridge Water Authority- Raccoon Township
Hookstown Free Methodist Church
Hookstown Fair
Hookstown Grange
South Side Memorial Post 952
Jack’s Diner
NOVA Chemical, Inc
B11 A9 W10 The DEP asked Shell to discuss efforts to avoid/minimize impacts to the above public water systems, and suggested that efforts “might include, but are not limited to, considering alternative locations, routings or design for the proposed pipeline; providing provisions for shut-off in the event of break or rupture; etc.” Shell stated that the route avoids direct impacts to groundwater wells and surface water intake. Shell will provide water buffalos if wells are contaminated, and drill new wells if necessary. There are mainline valves approximately 7 to 7.5 miles apart that can automatically shut off the flow of ethane. There will also be staff living within the project area that can quickly respond to issues.
B12 The pipeline crosses headwaters of the Ambridge Reservoir and the Reservoir’s raw water service pipeline, which supplies water to 30,000 residents. The DEP noted significant public concern regarding this crossing, and asked Shell to evaluate and discuss the pipeline’s potential to affect the Reservoir and public water supply service. The DEP also asked Shell to elaborate on efforts to avoid/minimize impacts, and what measures will be implemented to mitigate any unavoidable impacts. In response, Shell stated the pipeline will cross the raw water line via an HDD 31 feet below the line. Shell explained that the water service line is made of pre-stressed concrete, which cannot be retrofitted in the field if a break occurs. It can take six weeks for pipe joints to be made and delivered from Ohio if there is a rupture. Shell stated it will supply extra pipe joints so the Ambridge Water Authority can have pieces on deck in case of a break. Shell also outlined the protective coatings and design of the HDD portion of the pipeline that will cross the water line, and said valves that can shut off the pipeline are located 2.4 miles from one side of the water line and 3.5 on the other.
A17W17 The DEP asked Shell to consider the proposed pipeline’s effect on the Montour Trail, a multi-use, recreational trail, and to consider re-routes that would avoid impacts to the Trail. Shell determined that routing around the trail is not feasible. Shell will use conventional bore or HDD methods. If the trail needs to be temporarily closed during construction, operation, or maintenance, Shell will notify the trail owner and provide alternate temporary access for trail users. Shell will also cross the Panhandle Trail by HDD. The entrance and exit sights of the bore will not be on the trail’s property. Shell has “unlimited ingress and egress over Owners property” for inspections, repair and maintenance of the pipeline, and in case of emergency situations.
B29 A27 W27 Shell needed to revise the “Shell Pipeline HDD Procedure” to include HDD site feasibility analysis, inadvertent return risk assessment, water supply protection, agency contact information, etc. Shell’s response is included in the document, Inadvertent Returns from HDD: Assessment, Preparedness, Prevention and Response Plan.
B30 A28 W28 Shell needed to include a preboring geologic evaluation to determine if drinking water supplies will be impacted around boring locations. Shell also needed to discuss how it will verify that drinking water sources and aquifers are protected and what measures will be taken in the event that they are impacted. Shell’s response is included as Appendix C to this document.
4. Conservation
B19 A18 W18 19A 19W – There are many areas important for the region’s biodiversity and natural heritage that the proposed pipeline passes near or through. The DEP asked Shell to evaluate impacts to these areas. Information on them is available from the Pennsylvania Natural Heritage Program. They include:
Ambridge Reservoir Valleys Natural Heritage Area
Lower Raccoon Creek Natural Heritage Area
Raccoon Creek Valley and Wildflower Reserve Natural Heritage Area
Raccoon Creek Floodplain Biologically Diverse Area
Raccoon Creek Landscape Conservation Area
Clinton Wetlands Biologically Diverse Area
Raccoon Creek Landscape Conservation Area
Raccoon Creek Valley & State Park Important Bird Area – Regarding the Important Bird Area, Shell stated that 23 miles of the pipeline is located within this area. Shell has not been able to get in contact with the National Audobon SW PA office. Shell added that the only waterbody large enough in the project area to support the documented waterfowl is the open water at Beaver County Conservation District.Shell stated that “an outlet has been installed at the far end of the lake to restore it to more of a wetland and less of a lake, as it was originally designed.” Raccoon Creek Valley is also a passageway for migratory birds, which are protected under the Migratory Bird Treaty Act. Shell stated that less than 2% of this Important Bird Area will be permanently impacted by pipeline construction and installation.
5. Alternative locations
B17 A15 W15 The DEP asked Shell to revise its current alternatives and provide a more detailed “analysis of the alternative locations and routes that were considered to avoid or minimize adverse environmental impacts.” The alternatives are discussed in Section 9 of Shell’s Comprehensive Environmental Assessment.
B18 16A16W According to the DEP, “18.5 of the 45 miles (41%) of the proposed pipeline are parallel to or adjacent to existing right-of-ways (ROWs).” The DEP asked Shell to see if there are additional opportunities to build the pipeline within existing ROWs, with the hope of reducing environmental impacts. In response, Shell discussed the additional ROWs that were considered (along Mariner West) but ultimately rejected. Shell discusses these routes more in Section 9.1 of the Comprehensive Environmental Assessment.
B32 A30 W30 The DEP asked Shell to discuss the feasibility of several changes to the proposed pipeline’s route, including avoiding impacts to wetlands, relocating resource crossings, moving valve sites outside of wetlands, moving HDD locations, and evaluating the impact to a coal refuse pile (the pipeline crosses underneath at least one pile via HDD). These reroutes are discussed under question 32 for Beaver County, question 30 for Allegheny County, and question 30 for Washington County.
6. Geological concerns
B14 12A 12W The pipeline is located in previously coal mined areas. The DEP asked Shell to provide a map of the pipeline that showed these mining areas, and GIS shape files with this information. Shell’s response is included in the HDD Subsurface Investigation Reports, which includes the following table of the extent of mined areas along the pipeline route:
B15 A13 W13 The pipeline is located in coal mined areas, which could be susceptible to subsidence and/or mine water discharge. The DEP requested that Shell revise drawings to show the limits of previously mined areas, depth of cover over the mine workings in areas the proposed pipeline crosses through, and the distance between mine workings and the proposed pipeline. Furthermore, the DEP asked Shell to “evaluate and discuss the potential for a subsidence event compromising the utility line, and the potential to create a mine water discharge.” Shell discusses this in Appendix B of this this document and in the Mining Summary Report. Shell also identifies the following areas as being at risk for coal mine discharge: HOU MM 1.2, HOU MM 8.9 (proposed HDD), HOU MM 12.1, HOU MM 12.95, HOU MM 13.1, HOU MM 13.6, HOU MM 17.4, and HOU MM 17.65 (proposed HDD).
B16 A1414W The DEP requested that Shell include areas where the pipeline will cross active mining permit boundaries. There is one active mining permit boundary that intersects the proposed pipeline, the Rosebud Mine in Beaver County.
B31 A29 W29 Shell needed to evaluate the potential for the project to encounter areas underlain by carbonate bedrock and landslide prone areas. Carbonate bedrock is indicative of a karst landscape, meaning an area likely to have underground sinkholes and caves. The DEP also asked Shell to discuss precautionary methods taken during construction in these areas. Shell’s response is included in the Carbonate Rock Analysis and Slope Stability and Investigation Report. The Carbonate Rock Analysis report shows that carbonate bedrock was encountered in 20 out of 40 of the borings taken during the analysis.
7. Documentation
B4 The PA DEP asked Shell to describe the structures and activities that occur within junction sites. Shell responded that there will be a Junction Custody Transfer Meter Station at the site, and provided maps of the site.
B22 20A 20w The DEP requested that Shell revise their Comprehensive Environmental Assessment to include alternatives, impacts, and mitigation items that were previously included in other sections of their environmental assessment.
B25 A23W23 The DEP asked Shell to provide a copy of the Mitigation Bank Credit Availability Letter from First Pennsylvania Resource, LLC. In response, Shell stated the Letter is no longer needed because “the permanent stream and wetland fills have been removed from this project.”
B35 A33 W33 Shell needs to include all of the above modifications to the application in the Chapter 103 permit application.
Conclusion
As evidenced by the list above, the proposed Falcon Pipeline poses a variety of threats to Pennsylvania’s natural resources, wildlife, and public health – but this deficiencies list is likely not complete. The pipeline also passes through West Virginia and Ohio, and if completed, will likely attract more pipelines to the area. As it feeds Shell’s ethane cracker plant in Beaver County, it is a major step towards the region becoming a hub for plastic manufacturing. Therefore, the public response to the above deficiencies and the decision the DEP makes regarding them will have major implications for the Ohio River Valley’s future.
Of note: The DEP’s letters and Shell’s response to them are available to the public in separate documents for Allegheny, Beaver, and Washington Counties.
By Erica Jackson, Community Outreach and Communications Specialist
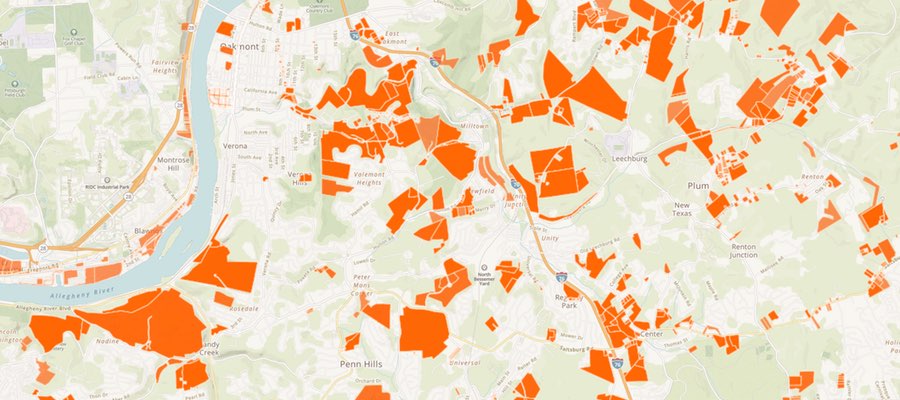
PITTSBURGH, PA – At last night’s County Council meeting, Councilwoman Anita Prizio unveiled a new bill to create an oil and gas lease registry for Allegheny County, which would help the area’s residents and municipalities better plan for oil and gas development within their communities.
The legislation, which has been referred to committee, would establish a publicly-available database of drilling leases across the county, organized by address, municipality, and company lease holder.
In 2016, FracTracker Alliance noted many issues with the county’s existing system during a lease mapping project and supports the move to make county lease data more transparent. For example, entries in the current database recorded after 2010 do not list street addresses or parcel IDs, which are necessary for proper mapping of local drilling activity.
“The proposed oil and gas lease registry would be a step in the right direction for improving the industry’s transparency and accountability in an area surrounded by extensive drilling,” remarked FracTracker’s Manager of Data and Technology and Allegheny County resident, Matt Kelso. “These agreements are already public data, but they’re burdensome to access and essentially impossible to analyze in any comprehensive fashion.”
Industrial-scaled oil and gas development has steadily increased in Allegheny County, with permits for 258 unconventional wells, more than half of which are now operational. Based on its earlier mapping work, FracTracker estimates that 63,014 acres – roughly 18% of the county – are already under some kind of mineral rights lease or pipeline rights-of-way agreement, a calculation that did not include parcels that were not identified due to missing data.
The lease registry, which would disclose permitting statuses and well type, would also play a large part in supporting local zoning efforts and helping public safety officials prepare for incidents that could put residents and infrastructure at risk.
# # #
About FracTracker Alliance
FracTracker Alliance is a national organization with regional offices across the United States in Pennsylvania, Washington DC, New York, Ohio, and California. Our mission is to study, map, and communicate the risks of oil and gas development to protect our planet and support the renewable energy transformation. We accomplish this by supporting advocacy groups at the local, regional, and national level – informing actions to positively shape our nation’s energy future. Check out FracTracker’s 2016 Allegheny Lease Mapping Project.
https://www.fractracker.org/a5ej20sjfwe/wp-content/uploads/2018/09/AlleghenyCounty-Map-Feature.jpg400900FracTracker Alliancehttps://www.fractracker.org/a5ej20sjfwe/wp-content/uploads/2025/09/2025-Wordmark-Logo.pngFracTracker Alliance2018-09-26 12:40:032021-04-15 14:57:37Supporting accessible oil and gas lease data in Allegheny County
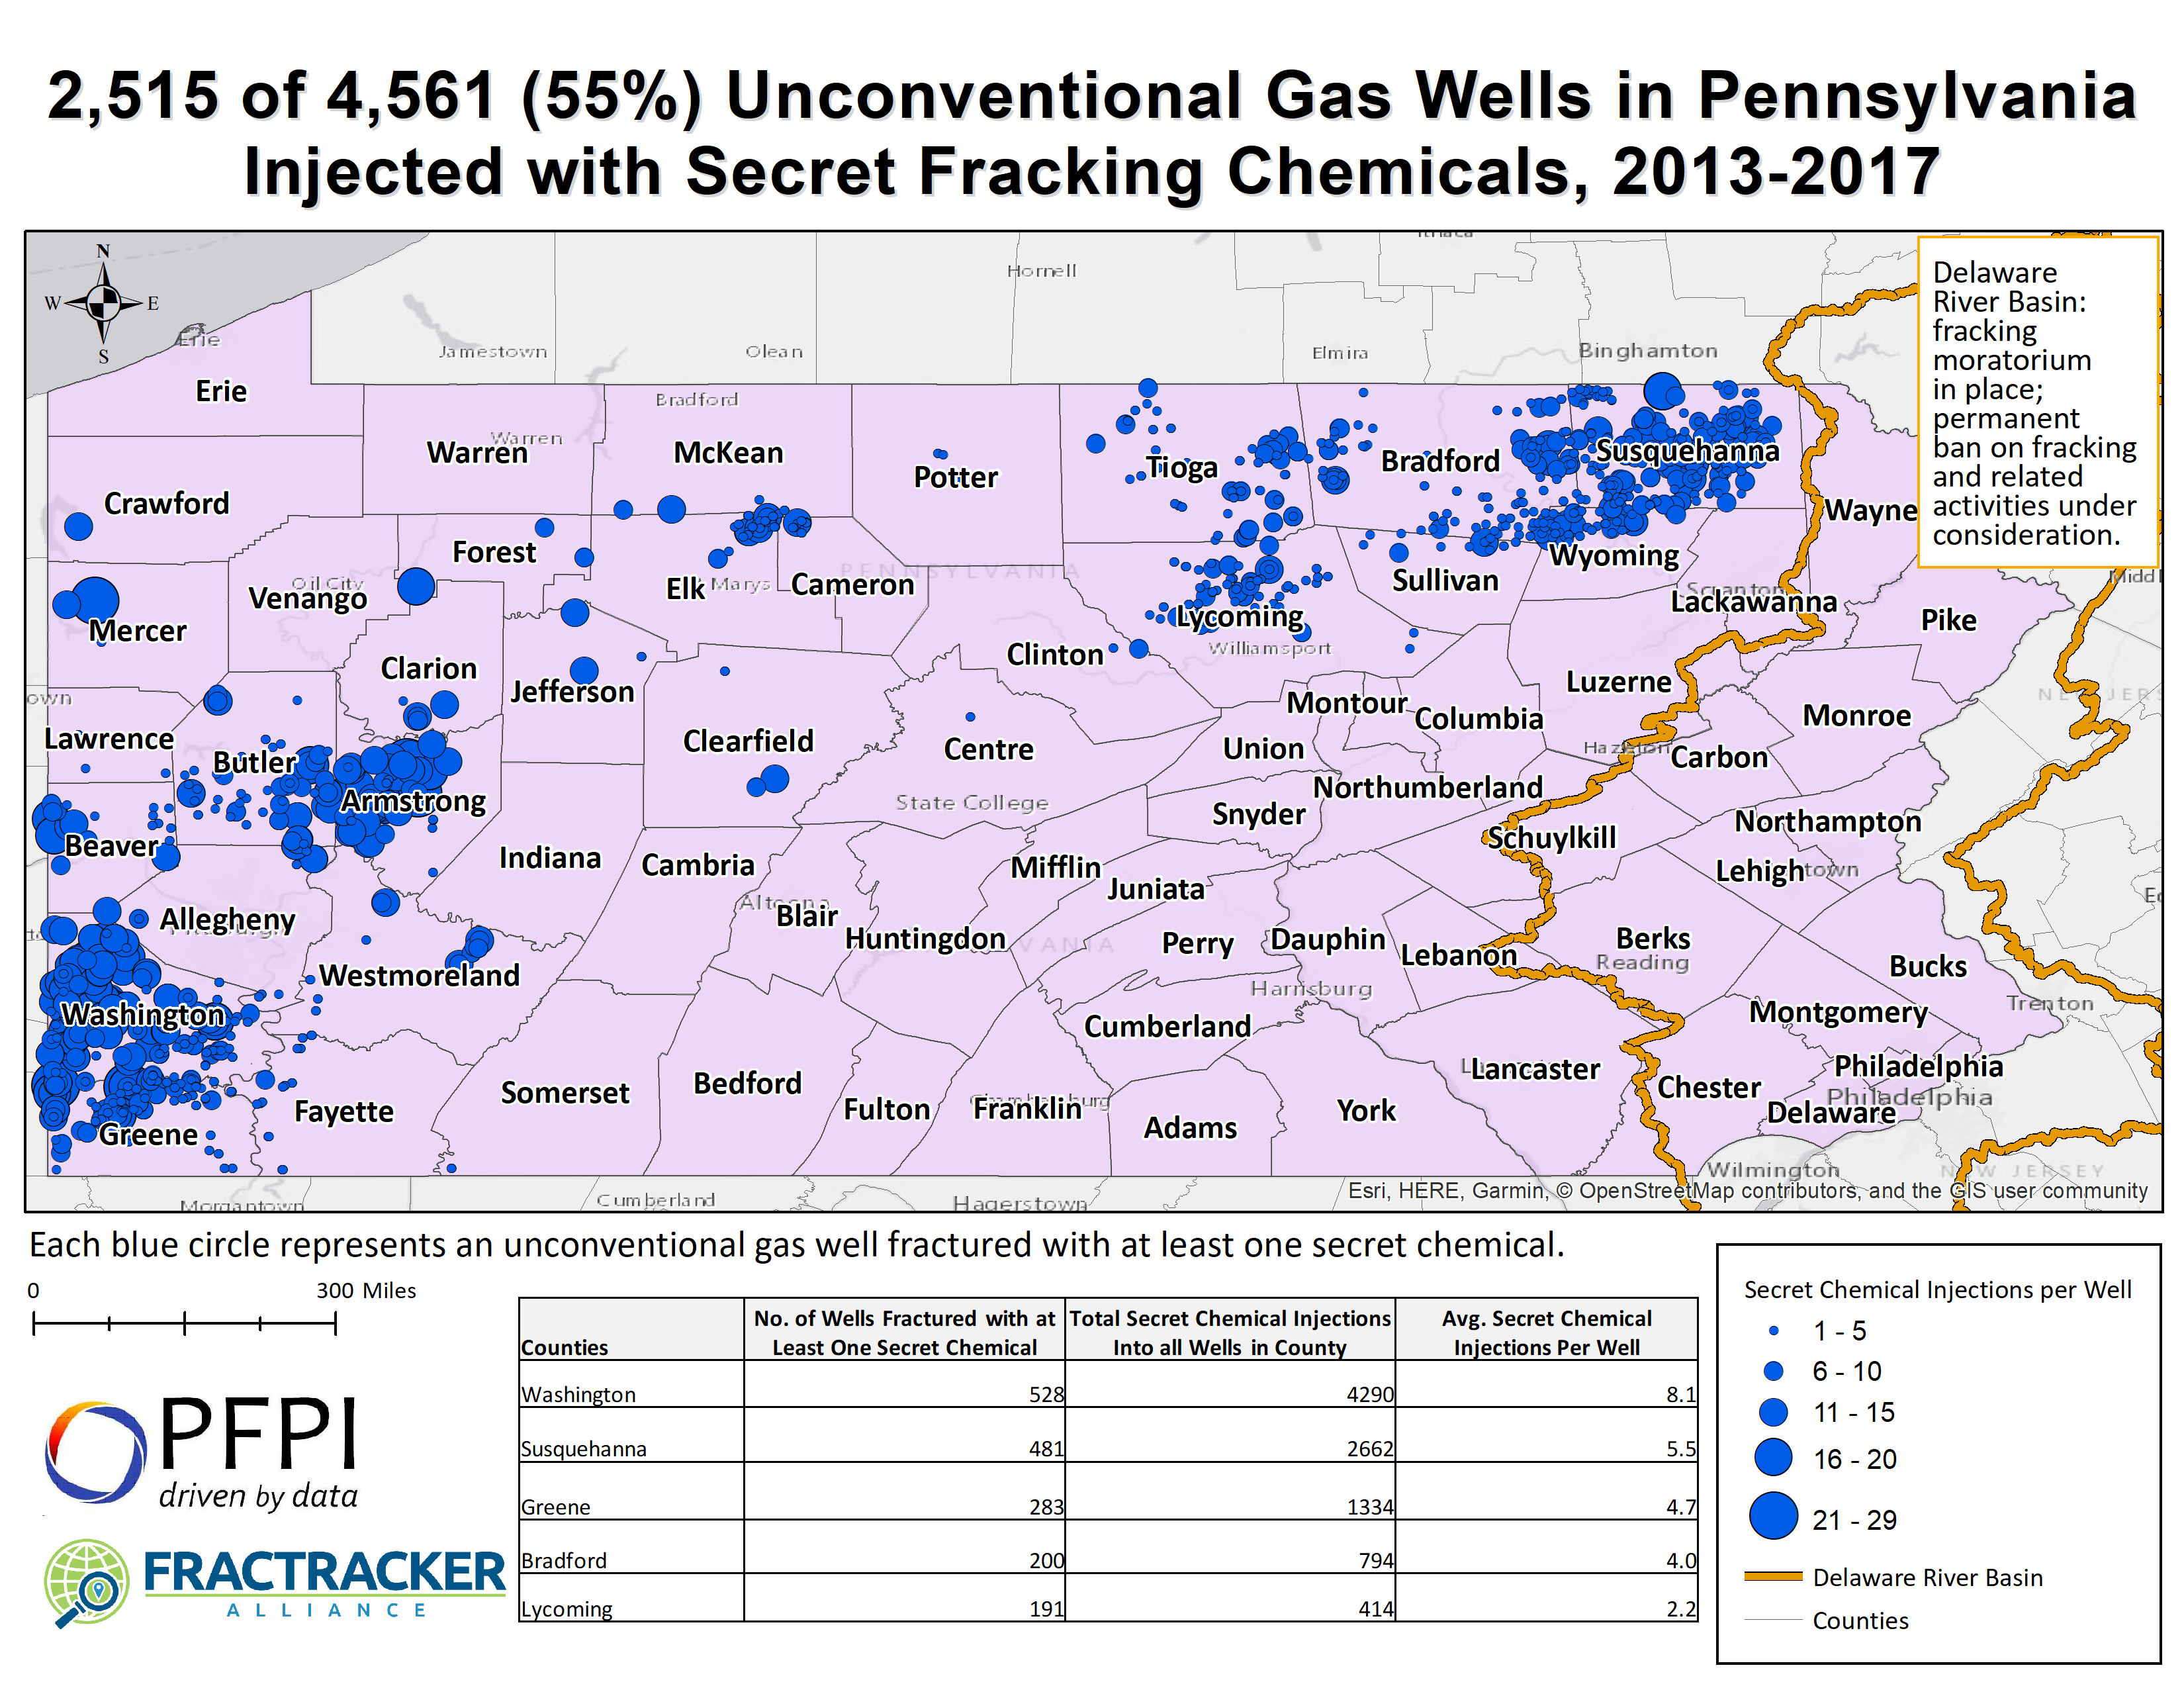
Keystone Secrets: Records Show Widespread Use of Secret Fracking Chemicals is a Looming Risk for Delaware River Basin, Pennsylvania Communities
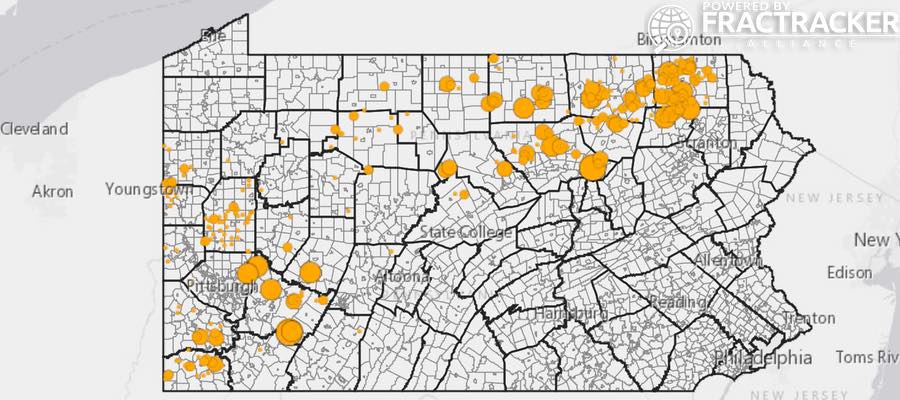
A report released today by the Partnership for Policy Integrity (PFPI) found that between 2013 and 2017, drilling companies injected at least one hydraulic fracturing (“fracking”) chemical with an identity kept hidden from the public into more than 2,500 unconventional natural gas wells drilled in Pennsylvania. The report, KeyStone Secrets, found companies injected secret fracking chemicals 13,632 times into 2,515 wells in total (explore map below).
Fracking in unconventional formations has significantly increased oil and gas extraction, making Pennsylvania the nation’s second-largest natural gas producer. The process has also sparked concerns about pollution and health effects, especially related to unidentified fracking chemicals. In response, Pennsylvania and 28 other states have enacted rules that require some public disclosure of these chemicals. However, most if not all of these rules have exceptions that allow companies to withhold chemical identities as trade secrets.
This report by Massachusetts-based Partnership for Policy Integrity (PFPI), with analysis of fracking chemical disclosure data by FracTracker Alliance, illustrates that drilling companies have used these exceptions extensively.
Records obtained by PFPI from the US Environmental Protection Agency (EPA) show that non-disclosure of fracking chemical identities may leave people unknowingly exposed to harmful substances. Between 2003 and 2014, the EPA identified health concerns for 109 of 126 new chemicals proposed for use in oil and gas drilling and fracking. The manufacturers submitted information about the chemicals for review under a program that requires EPA to screen and regulate new chemicals for health and environmental impacts before they are used commercially.
Despite concerns by EPA scientists about the chemicals’ health effects, EPA approved most of the 109 chemicals for use, and 62 were later used in or likely used in oil and gas wells. Manufacturers took advantage of trade secret protections that are permitted by federal law to conceal 41 of the 62 chemicals’ identities. It is possible that some of these chemicals declared secret at the federal level are some of the same chemicals being used under trade secret protection in Pennsylvania.
Mapping of secret fracking chemical injection sites (above) show that use is heaviest in southwest Pennsylvania near Pittsburgh and in northeast Pennsylvania near the Delaware River Basin, tracking areas of intensive drilling.
The use of secret chemicals in Pennsylvania’s oil and gas wells is likely even higher than detailed in this report because of exemptions in Pennsylvania law, including:
No disclosure requirements for the chemicals used in drilling oil and gas wells – the portion of the oil and gas extraction process that precedes fracking;
No requirement that fracking chemicals for so-called “conventional” oil and gas wells be reported to an easily searchable electronic database; and
A reporting exemption for chemical manufacturers who are not required to disclose trade secret chemical identities even to emergency responders cleaning up a leak or spill.
In the coming months, the Delaware River Basin Commission is expected to consider a ban on fracking in the basin – fracking that would be most likely to occur in unconventional gas wells in Pennsylvania’s portion of the four-state area. There is currently a de facto moratorium on fracking in the basin that provides drinking water for New York City and Philadelphia – among other cities. The commission is also expected to consider whether to allow related activities inside the basin, including the treatment and discharge into waterways of fracking wastewater from outside the basin. Any fracking or discharges of wastewater would be likely to include some of the secret fracking chemicals discussed in this report.
People have a right to know the identities of chemicals used in oil and gas operations so that citizens, first responders, regulators, and scientists can determine the chemicals’ risks and act to protect health and the environment. Learn more about the proprietary fracking chemicals used in PA by reading the full report:
Report Author: Dusty Horwitt, Partnership for Policy Integrity
https://www.fractracker.org/a5ej20sjfwe/wp-content/uploads/2018/09/SecretChemicalsReport-Rig-Feature.jpg400900FracTracker Alliancehttps://www.fractracker.org/a5ej20sjfwe/wp-content/uploads/2025/09/2025-Wordmark-Logo.pngFracTracker Alliance2018-09-11 06:00:092021-04-15 14:57:38New report finds widespread use of proprietary fracking chemicals in PA
When people think about oil and gas extraction in Pennsylvania, they think about the tens of thousands of oil and gas wells in the state. It makes sense, because that’s where the process starts. However, while oil and other liquids can be shipped in tanker trucks, all of the producing gas wells in the state – whether they are small conventional wells or the giants of the Marcellus and Utica – must be connected by a network of pipelines.
Moving hydrocarbons from the well to processing facilities to power plants and residential customers all occurs within this giant midstream system, and the cumulative impact that pipelines have on the state is formidable. Let’s take a closer look at where the oil and gas pipelines are located in PA, their safety records, and major data gaps. Additionally, we’ve made available a detailed, interactive map of Pennsylvania pipelines and other important features such as water crossings.
Pipeline routes are everywhere in Pennsylvania
According to the Pipeline and Hazardous Materials Safety Administration (PHMSA), there were 92,407 miles of pipelines carrying natural gas and liquid petroleum products in Pennsylvania in 2017. That distance is equivalent to 151 round trips between Philadelphia and Pittsburgh on the Pennsylvania Turnpike, or more than three trips around the globe at the equator. This figure includes 78,022 miles of distribution lines (which takes gas from public utilities to consumers), 10,168 miles of transmission lines (which move gas between various processing facilities), 3,111 miles of petroleum liquid routes, and 1,105 miles of natural gas gathering lines (which take the gas from wells to midstream processing facilities).
Of note – The last category’s estimate is almost certainly a drastic underestimation. As of June 7th, there were 3,781 unconventional well pads in Pennsylvania, according the Pennsylvania Department of Environmental Protection (DEP), and all of the pads need to be connected to gathering lines. A 2014 report by the Nature Conservancy estimates that 19 acres of land are cleared for each well pad, which would work out to 3.1 miles of gathering lines for a typical 50-foot right-of-way. Multiplied out, 3,781 wells pads would require a total of 11,721 miles of gathering lines – well over PHMSA’s estimate of a 1,105 miles (See Table 1 for estimate comparisons).
Table 1. Varying estimates of gathering lines in Pennsylvania.*
Source
Unconventional Well Pads
Average Gathering Line Length (Miles)
Statewide Total Estimated Miles
Nature Conservancy
3,781
3.1
11,721
Bradford County
3,781
3.5
13,234
PHMSA
3,781
0.3
1,105
*Estimates based on Nature Conservancy and Bradford County data are based on calculating the average length of segments, then multiplying by the number of well pads in the state to find the statewide total. The PHMSA estimate was calculated in reverse, by dividing the purported total of gathering lines by the number of well pads to find the average mileage.
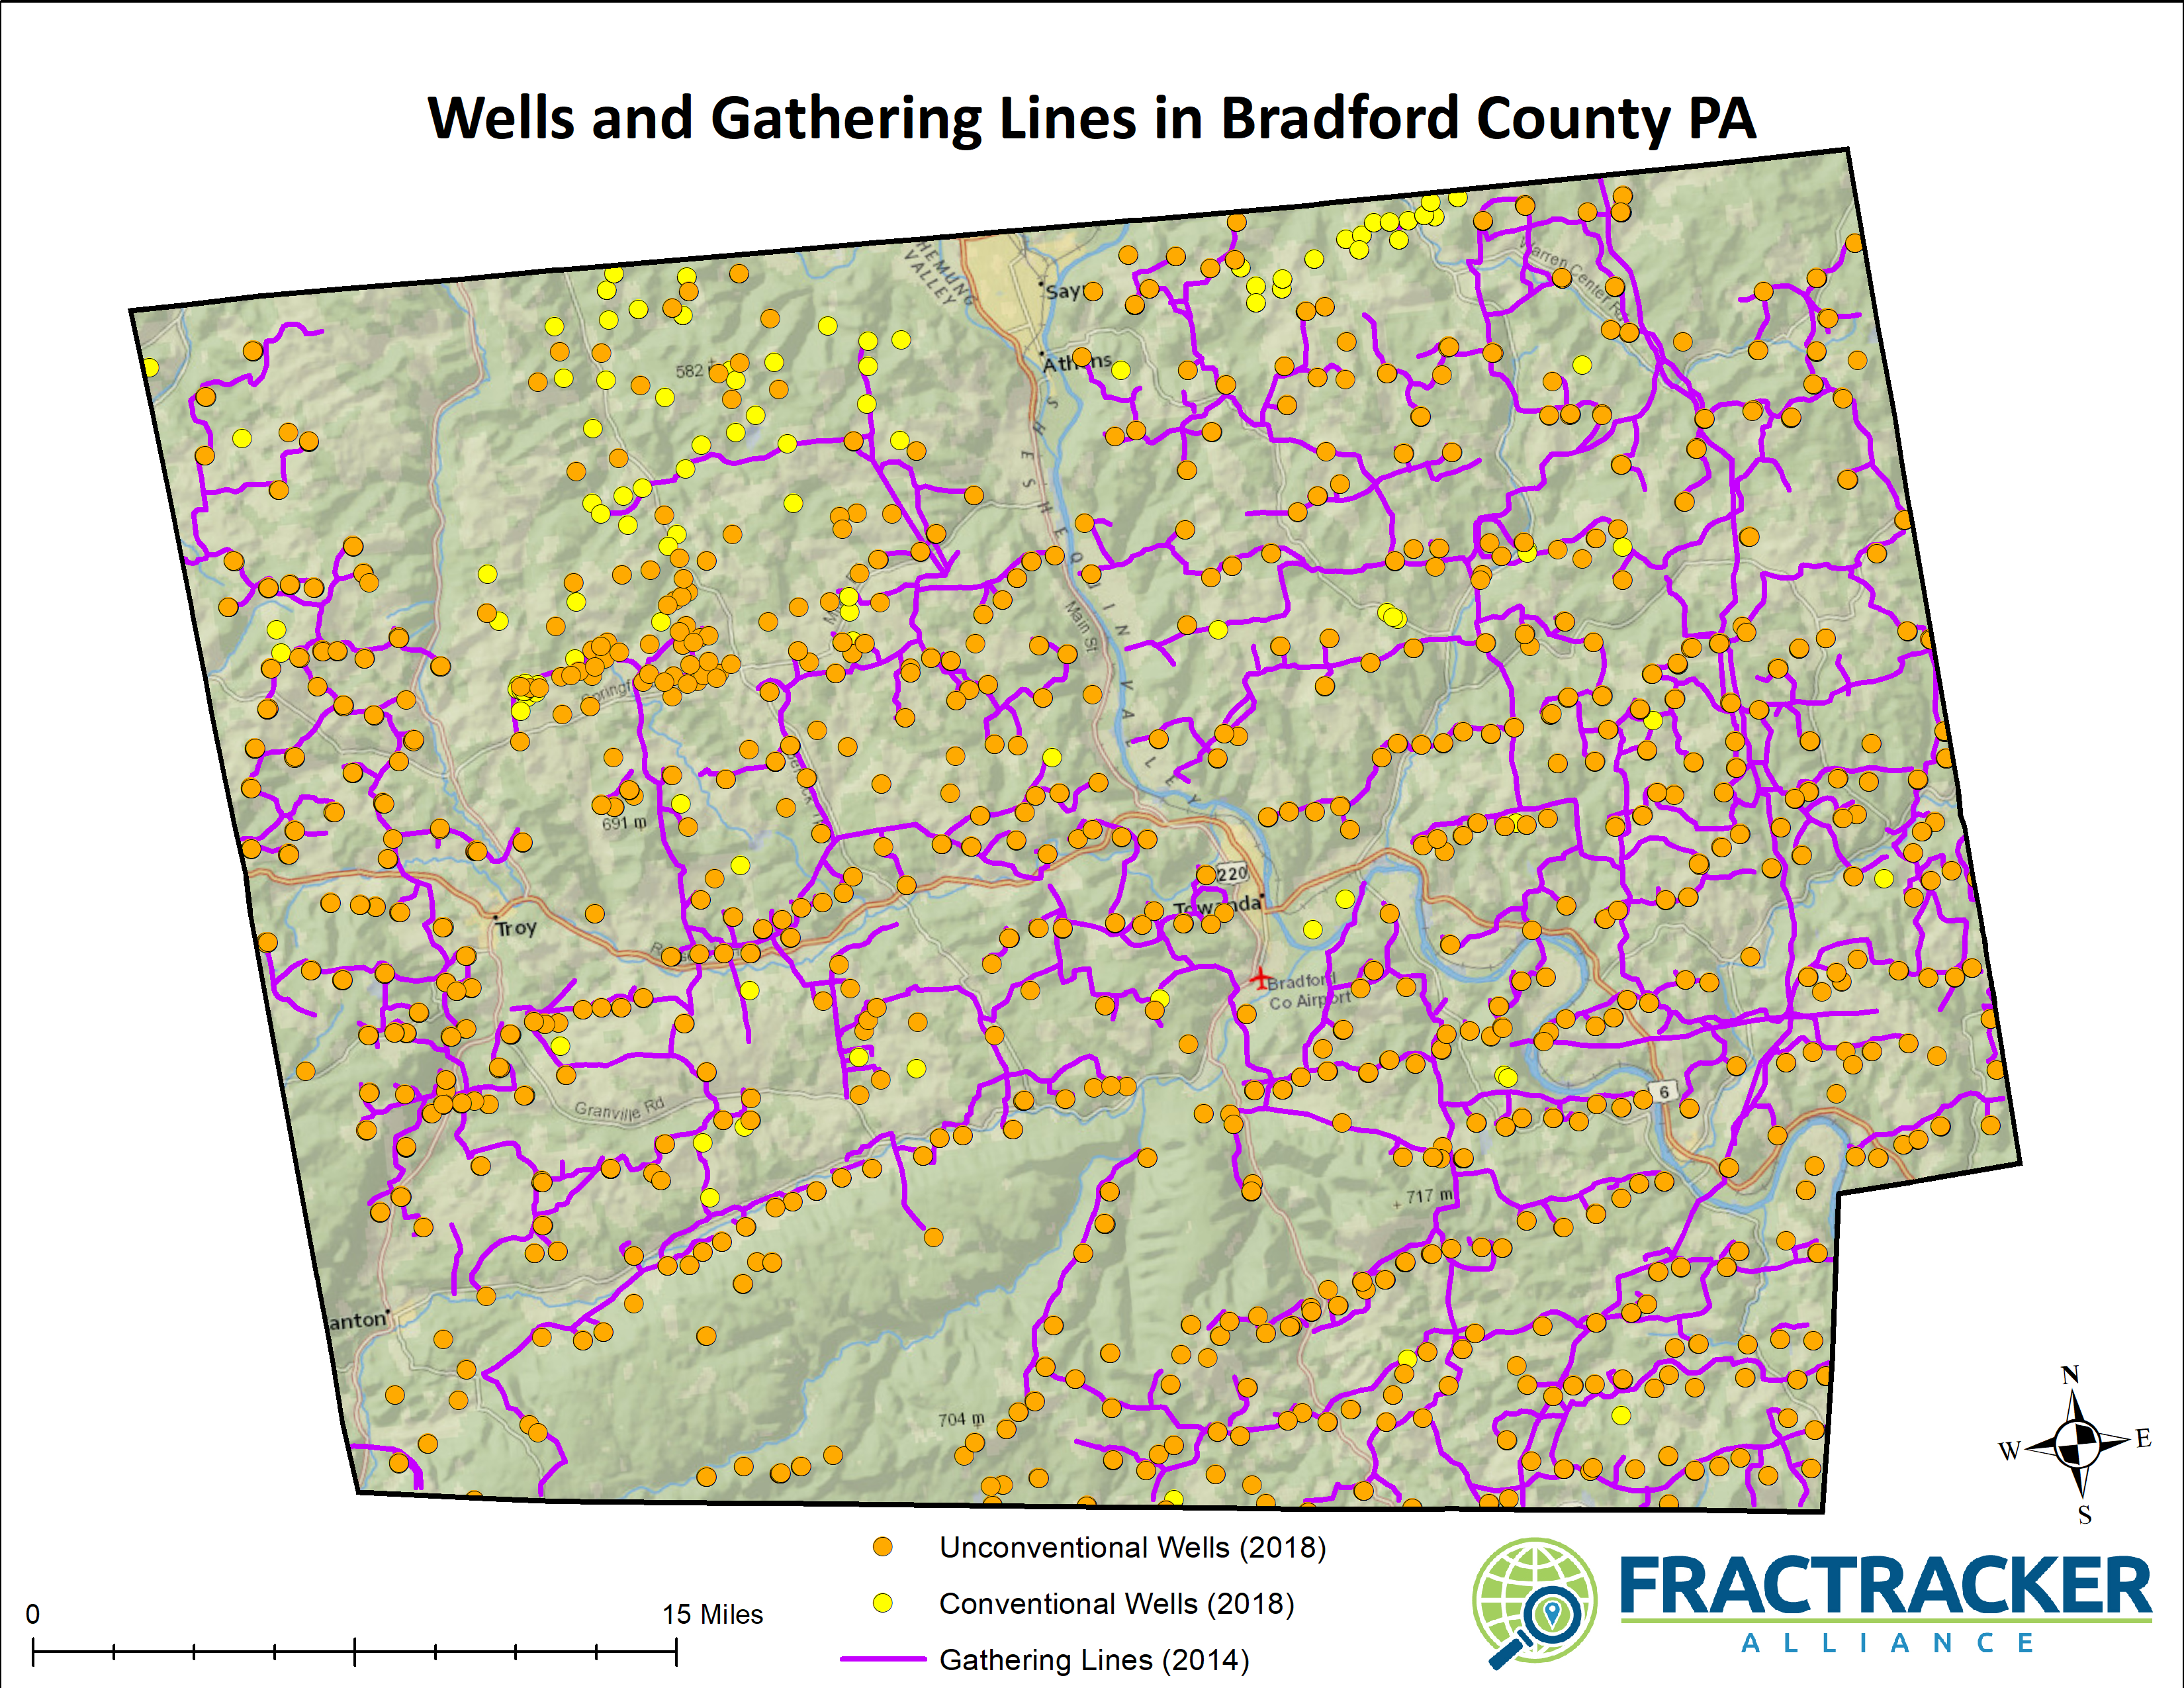
Figure 1: Location of gathering lines (2014) and oil and gas wells (2018) in Bradford County, Pennsylvania. Note the pockets of newer wells that are not connected to the older gathering line network.
In 2014, the FracTracker Alliance digitized a published map of gathering lines in Bradford County, allowing us to analyze the data spatially (Figure 2). These efforts yield similar results, with gathering lines averaging 3.5 miles in length. Not counting segments of transmission lines included in the data, such as Stagecoach, Sunoco, and Kinder Morgan’s Tennessee Gas Pipeline, there were 1,003 miles of gas gathering lines just in Bradford County in 2014.
Almost all of this data is based only on unconventional oil and gas activity, and therefore ignores the more than 96,000 conventional oil and gas (O&G) wells active in the state. We do not have a reasonable estimate on the average length of gathering line segments are for this network. It is reasonable to assume that they tend to be shorter, as conventional wells are often closer together than unconventional well pads, but they must still network across vast portions of the state.
Table 2. Estimated length of gathering lines for conventional wells in Pennsylvania by variable average lengths
Average Length (Miles)
Conventional Wells
Total Miles
0.5
96,143
48,072
1.0
96,143
96,143
1.5
96,143
144,215
2.0
96,143
192,286
2.5
96,143
240,358
3.0
96,143
288,429
If the average gathering line for conventional wells in Pennsylvania is at least 1 mile in length, then the total mileage of gathering lines would exceed all other types of gas and petroleum pipelines in the state. Conversely, for the PHMSA figure of 1,105 miles to be accurate, the average gathering line for all conventional wells and unconventional well pads in Pennsylvania would be 0.011 miles, or only about 58 feet long.
Pipelines are dangerous
As pipelines impact residents in many ways, there are numerous reason why communities should try to understand their impacts – including basic planning, property rights, sediment runoff into streams, to name a few. Perhaps the most significant reason, however, is the potential for harmful incidents to occur, which are more common than anyone would like to think (See Table 3). Some of these incidents are quite serious, too.
Table 3. Nationwide pipeline incidents statistics from PHMSA from January 1, 2010 through July 13, 2018
Report
Events
Fatalities
Injuries
Explosions
Evacuees
Total Damages
Gas Distribution
909
92
432
220
16,949
$348,511,528
Gas Transmission / Gathering
1,031
23
94
49
8,557
$1,085,396,867
Hazardous Liquids
3,368
10
24
14
2,467
$2,531,839,207
Grand Total
5,308
125
550
283
27,973
$3,965,747,602
As of the July 13, 2018 download date, the PHMSA report covers 3,116 days.
Incidents Per Day
This means that nationally per day there are 1.7 pipeline incidents, almost 9 people evacuated, and $1,272,704 in damages, including the loss of released hydrocarbons.
On average, there is a fatality every 25 days, an injury every six days, and an explosion every 11 days. The location of those explosions obviously has a lot to do with the casualty count and aggregate property damage.
How do Pennsylvania pipelines hold up? As one might expect from a state with so many pipelines, Pennsylvania’s share of these incidents are significant (See Table 4).
Table 4. Pennsylvania pipeline incidents statistics from PHMSA from January 1, 2010 through July 13, 2018
Report
Events
Fatalities
Injuries
Explosions
Evacuees
Total Damages
Gas Distribution
29
8
19
12
778
$6,769,061
Gas Transmission / Gathering
30
0
2
2
292
$51,048,027
Hazardous Liquids
49
0
0
1
48
$9,115,036
Grand Total
108
8
21
15
1,118
$66,932,124
Within Pennsylvania, an incident is reported to PHMSA every 29 days, an injury or fatality can be expected every 107 days, and the daily average of property damage is $21,480.
The issue with under-reported gathering lines notwithstanding, PHMSA lists Pennsylvania with 92,407 miles of combined gas and hazardous liquid pipelines, which is roughly 3.3% of the nationwide total, and there is no reason to believe that PHMSA’s issue with accounting for gathering lines is unique to the Keystone State.
Just 2% of the total number of incidents are in Pennsylvania. In terms of impacts, however, the state has seen more than its fair share – with 6.4% of fatalities, 3.8% of injuries, 5.3% of explosions, and 3.9% of evacuations. Property damage in Pennsylvania accounts for just 1.7% of the national total, making it the only category examined above for which its share of impacts is less than expected, based on total pipeline miles.
Pipeline location data not widely available
Pipeline data is published from a variety of public agencies, although almost none of it is really accessible or accurate.
For example the Department of Homeland Security (DHS) publishes a number of energy-related datasets. While they do not publish gas pipelines, they do have a 2012 dataset of natural gas liquid routes, which is a significant portion of the hazardous liquid inventory. From an analytical point of view, however, this dataset is essentially worthless. Many of these pipelines are so generalized that they don’t make a single bend for multiple counties, and the actual location of the routes can be miles from where the data are represented. Communities cannot use this as a tool to better understand how pipelines interact with places that are important to them, like schools, hospitals, and residential neighborhoods. The dataset is also incomplete – the original Mariner East natural gas pipeline, which has been around for decades, isn’t even included in the dataset.
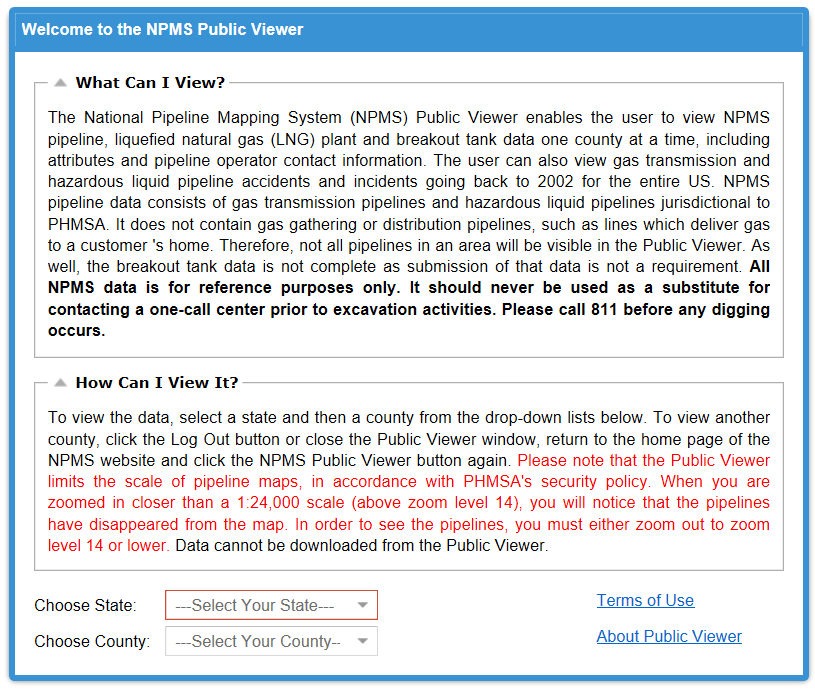
Figure 2: This text appears to viewers of PHMSA’s public pipeline viewer.
Another data source is PHMSA’s National Pipeline Mapping System Public Viewer. While this source is rich in content, it has several intentional limitations that thwart the ability of the public to accurately analyze the pipeline network and understand potential impacts:
Data can only be accessed one county at a time, which is impractical for long interstate transmission routes,
Data can not be be downloaded, and
The on-screen representation of the routes disappears when users zoom in too far.
Within Pennsylvania, the Department of Environmental Protection (DEP) maintains the Pennsylvania Pipeline Portal, which contains a lot of information about various recent pipeline projects. However, with the sole exception of the Mariner East II project, the agency does not provide any geospatial data for the routes. The reason for this is explained on the Mariner East II page:
These shapefiles are the GIS data layers associated with the permits that have been submitted for the proposed pipeline project. These shapefiles are not required as part of a permit application and are not commonly submitted but were provided to the Department by Sunoco Pipeline, L.P.
The files were accepted by the Department to aid in the review of the application material given the large scale of the project. The shapefiles ease the review by displaying some information contained in the hardcopy of the plans and application in a different format.
The Department of Conservation and Natural Resources (DCNR) does make oil and gas infrastructure data available, including pipelines, where it occurs on state forest land.
Pennsylvania Pipelines Map
Considering the risks posed by pipelines, their proliferation in Pennsylvania, and this critical juncture in their development with an implicit opportunity to document impacts, FracTracker believes it is important now to develop an accurate interactive statewide map of these projects, fortify it with essential data layers, and facilitate citizen reporting of the problems that are occurring.
Other than the Mariner East II route and the state forest data available from DCNR, all of the pipeline routes on our Pennsylvania Pipeline Map, below, have been painstakingly digitized – either from paper maps, PDFs, or other digital media – to make geospatial data that can analyzed by interacting with other datasets. These layers are only as good as their sources, and may not be exact in some cases, but they are orders of magnitude better than data produced by public agencies such as DHS.
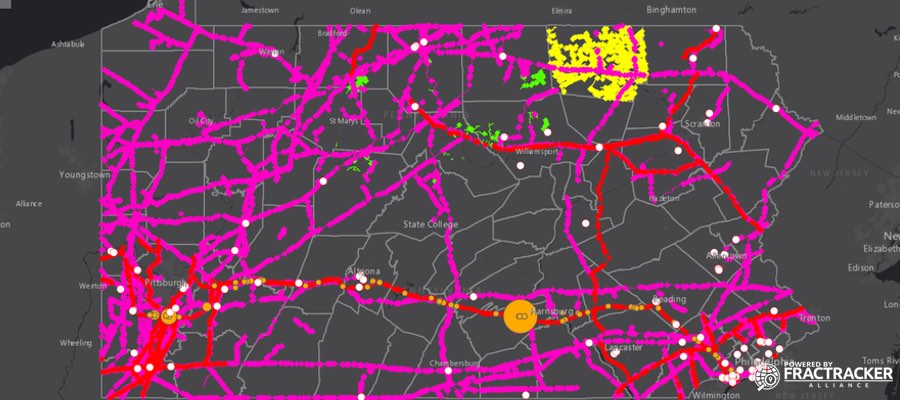
Figure 3: FracTracker’s Pennsylvania Pipeline Map. View fulll screen to explore map further, view water crossings, and other details not visible at the statewide map view.
Data Layers on Pennsylvania Pipelines Map
Incidents
PHMSA incidents (7-13-2018). Pipeline incidents that were reported to the Pipeline and Hazardous Material Safety Administration. These reports contain significant information about the incidents, including location coordinates, and are shown on the map with white circles.
Note that a few of the location coordinates appear to be erroneous, as two reports appear outside of the state boundary.
Spills
Mariner East II – Inadvertent Returns (6-1-2018). This data layer shows inadvertent returns – or spills – related to the construction of the Mariner East II pipeline. This is a combination of two reports, including one where the spills that impacted waterways, and those categorized as upland spills. These are represented on the map by orange dots that vary in size depending on the amount of fluid that spilled. Some of the locations were provided as latitude / longitude coordinates, while others are estimates based on the description. In a few cases, the latitude value was adjusted to intersect the pipeline route. In each case, the adjusted location was in the correct county and municipality.
Water Crossings
Known Stream & Wetland Crossings (2018). This shows the locations where the known pipeline routes intersect with streams and other wetlands on the National Wetland Inventory. These are organized by our four pipeline layers that follow, including FracTracker Vetted Pipelines (1,397 crossings), DCNR Pipelines (184 crossings), PHMSA Gas Pipelines (6,767 crossings), and Bradford County Gathering Lines (867 crossings). These crossings are shown as diamonds that match the colors of the four listed pipeline layers.
Vetted Pipelines
FracTracker Vetted Pipelines (2018). This pipeline layer is an aggregation of pipeline routes that have been digitized in recent years. Much of this digitization was performed by the FracTracker Alliance, and it is an available layer on our mobile app. These are largely newer projects, and contain some routes, such as the Falcon Ethane Pipeline System, that have not been built yet. In some cases, multiple versions of the pipeline routes are printed, and we may not have the final version of the route in all circumstances. FracTracker Vetted Pipelines are represented with a red line.
DCNR Pipelines
DCNR Pipelines (2018). This includes pipeline routes on state forest lands, and is shown as green lines on the map.
PHMSA Pipelines
PHMSA Gas Pipelines (2018). This includes data digitized from the PHMSA Public Pipeline Viewer. This source contains gas and liquid pipelines, but only gas pipelines are included in this analysis. These routes are shown in a bright purplish pink color.
Bradford Lines
Bradford County Gathering Lines (2014). This layer was digitized by the FracTracker Alliance after Bradford County published a printed map of gathering lines within the county in 2014. It is the only county in Pennsylvania that we have gathering line data for, and it is shown on the map as a yellow line.
Nearby Waterways
Streams & Wetlands with 1/2 Mile of Pipelines (2018). This clipped layer of the National Wetlands Inventory is provided for visual reference of the wetlands near known pipeline routes. Due to the large amount of data, this layer is only visible when users zoom in to a scale of 1:500,000, or about the size of a large county.
By Matt Kelso, Manager of Data and Technology
This article is the first in a two-part series on Pennsylvania pipelines. Stay tuned!
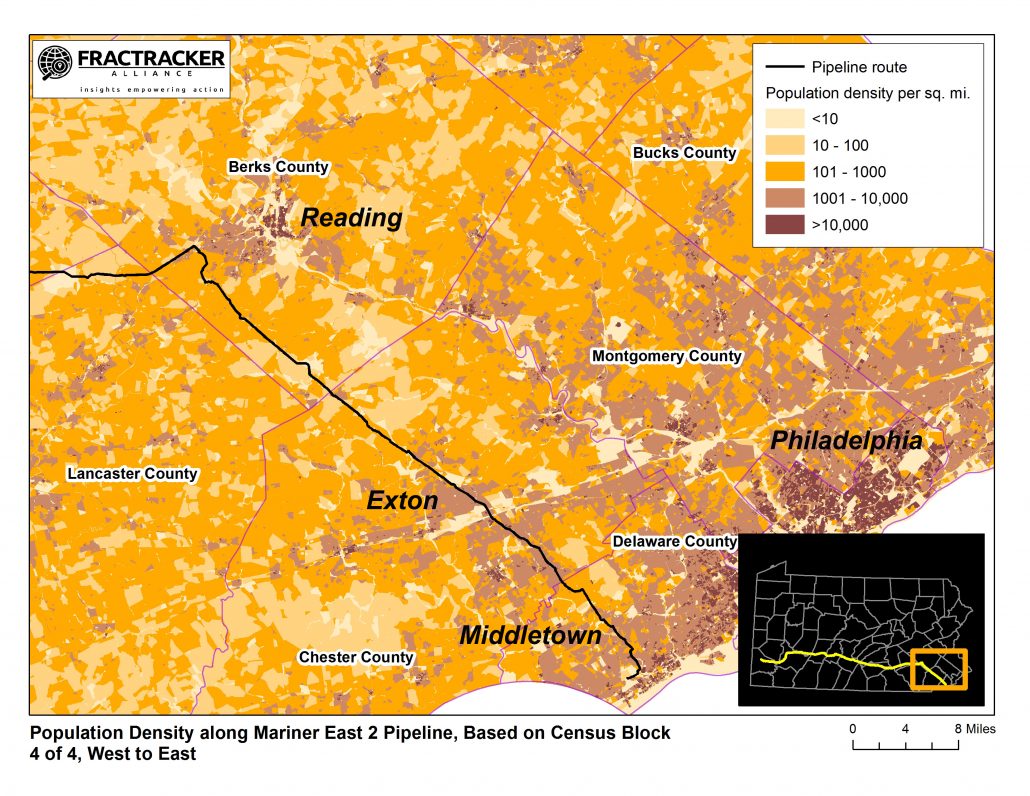
FracTracker Alliance recently created a set of maps showing population variation along the route of the Mariner East 2 Pipeline, which I refer to as the “Dragonpipe.” FracTracker’s maps dramatically reveal a route that runs through many centers of dense population, and seems to avoid relatively nearby areas with far lower population density. The maps are based on US Census 2010 block-level data.
The take-away lesson from these maps is this: Sunoco has put the Dragonpipe in a very bad location.
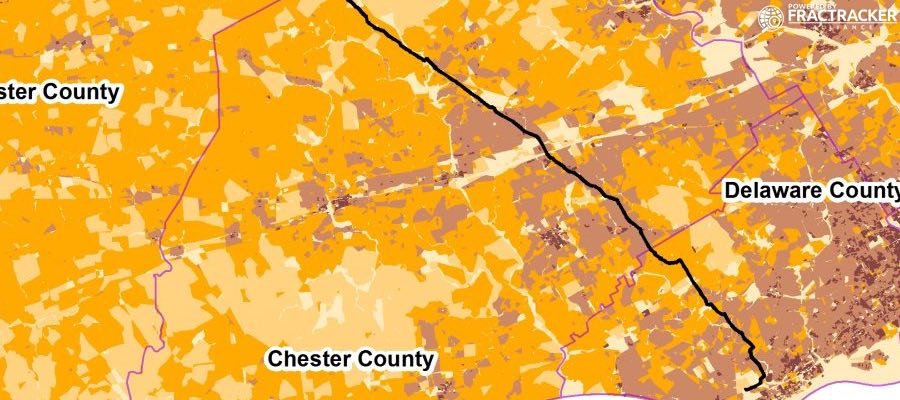
As an example, here is a map of the pipeline route as it passes through Berks, Chester, and Delaware counties in Pennsylvania:
Figure 1. Population density in southeastern Pennsylvania. Map courtesy of FracTracker Alliance. Location annotations added by G. Alexander.
The dark brown areas in the map above denote the most densely populated locations, displayed as the number of people per square mile. The lighter the color, the lower the population density. The black line is the pipeline route.
In the upper left-hand part of the map, note that the route passes through the suburbs of Reading, in Berks County. Further south in the same map, notice how it passes directly through population centers in Chester and Delaware counties.
Let’s examine this pattern more closely.
Why was this route chosen in the first place?
For Sunoco’s convenience
In many areas, from a standpoint of impacts on local communities, the pipeline route is actually the worst possible track that Sunoco could have chosen; it puts more people at risk than any other path, given the same starting- and endpoints. Why in the world did they choose this route?
The answer is this: for Sunoco’s corporate convenience. The Dragonpipe, for most of its length, runs side-by-side Mariner East 1 (ME1), an existing 80+ year-old pipeline designed to carry gasoline and heating oil to customers in the central and western parts of Pennsylvania. From this standpoint, the location of the old pipeline makes sense; it had to be sited near populated areas. That’s where the customers for gasoline and heating oil were located back in the 1930s.
However, the flip-side of Sunoco’s corporate convenience may also mean unnecessary risks to tens of thousands of Pennsylvania residents.
The old pipeline connected the centers of population in the 1930s, areas that are now much more populous when they were nearly ninety years ago. In the southeastern part of Pennsylvania, the character of the area has also changed dramatically. When the original pipeline was built, the landscape along ME1’s route through Delaware and Chester counties was predominantly farmland. Today, that area has changed to densely-settled suburbs, with homes, schools, businesses, hospitals, and shopping centers directly adjacent to the pipeline’s right-of-way.
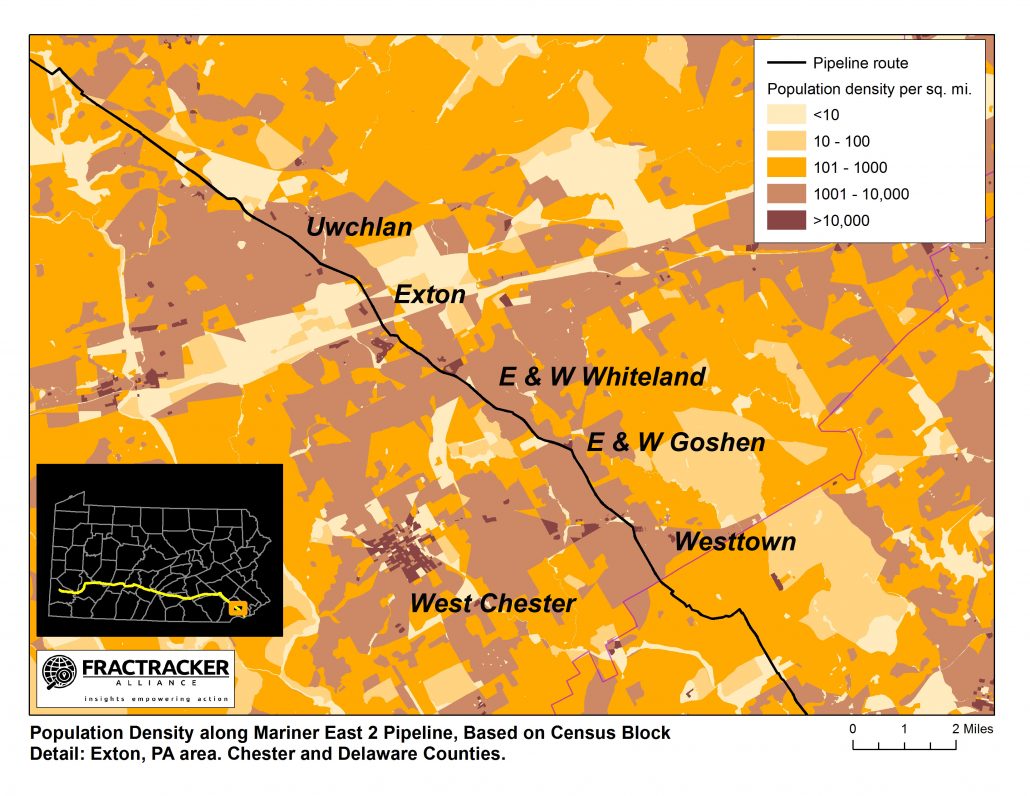
The Exton area provides a prime example of how this transition to suburbia has set the stage for potential disaster along the pipeline route. The following image shows a detailed view of the population density near Exton. As you can see, the pipeline route sticks to high-density areas (shown in dark brown) the entire way, even though lower-density options (shown in orange and yellow) exist nearby.
Figure 2. Population density in Exton area. Map courtesy of FracTracker Alliance. Location annotations added by G. Alexander.
Sunoco — like any corporation — has a moral obligation to conduct its business in a safe manner. This includes choosing a safe route for a pipeline that has inherent dangers and risks. However, Sunoco apparently did not choose to do so. Moreover, by law, Sunoco has an obligation to make human safety paramount. In the settlement Sunoco reached last August with Clean Air Council, Delaware Riverkeeper Network, and Mountain Watershed Association, Sunoco agreed to consider alternative routing for the pipeline in this area. Then, despite their promises, Sunoco simply bypassed that part of the agreement. Rather than explore alternatives to the proposed route, Sunoco dismissed the alternatives as “not practicable” because they did not involve the right-of-way that was already in use for Mariner East 1.
Sunoco seemed to have made their sole priority in considering a pipeline route whether the company has an existing pipeline there already. A better route would reduce by hundreds the number of people who could be killed or injured if there were a leak and explosion.
Pipelines leak
Pipelines can and do leak. Mariner East 1, in its short career as a pipeline carrying NGLs, has already leaked several times. It is just good luck that the leaks were stopped before any product ignited. (See most recent report of ME1 and ME2 issues.) The Atex pipeline, a pipeline of similar size and content that runs down to the Gulf Coast, ruptured and exploded near Follansbee, WV, in just its second year of operation. And there’s no reason to believe such an incident would never happen with the Dragonpipe.
Sunoco has an obligation to do what it can to minimize the injuries, death, and destruction caused by an event like the Follansbee explosion. The Follansbee incident occurred in a forested area. The explosion destroyed several acres of trees, but no-one was killed. The result would have been far different if had the explosion been in a densely populated area.
Just as the maps above show how the Philadelphia suburbs and those of Reading are threatened, other FracTracker maps show the threats to suburbs of Pittsburgh and Harrisburg, below. Click to expand.
A call for change
Indeed, across the state, the Dragonpipe route gets dangerously and notably close to population centers. Such a path may be a convenient and financially beneficial option for Sunoco, but it is an unacceptable risk for Pennsylvania’s citizens to bear.
About the Author: George Alexander publishes the Dragonpipe Diary (www.dragonpipediary.com), covering all aspects the Mariner East pipeline project, including technology, risks, legal issues, economics, and the people and groups involved. He recently retired from a career in journalism and marketing.
An earlier version of this essay was published in Mr. Alexander’s blog, Dragonpipe Diary, on June 29, 2018.
https://www.fractracker.org/a5ej20sjfwe/wp-content/uploads/2018/07/ME2-Dragonpipe-Map-Feature.jpg400900Guest Authorhttps://www.fractracker.org/a5ej20sjfwe/wp-content/uploads/2025/09/2025-Wordmark-Logo.pngGuest Author2018-07-20 13:32:312021-04-15 15:01:14Population density maps: Lessons on where NOT to put a pipeline
The Origins & Work of Lebanon Pipeline Awareness, Inc. in Lebanon County, PA by Michael Schroeder, Lebanon Pipeline Awareness, Inc.
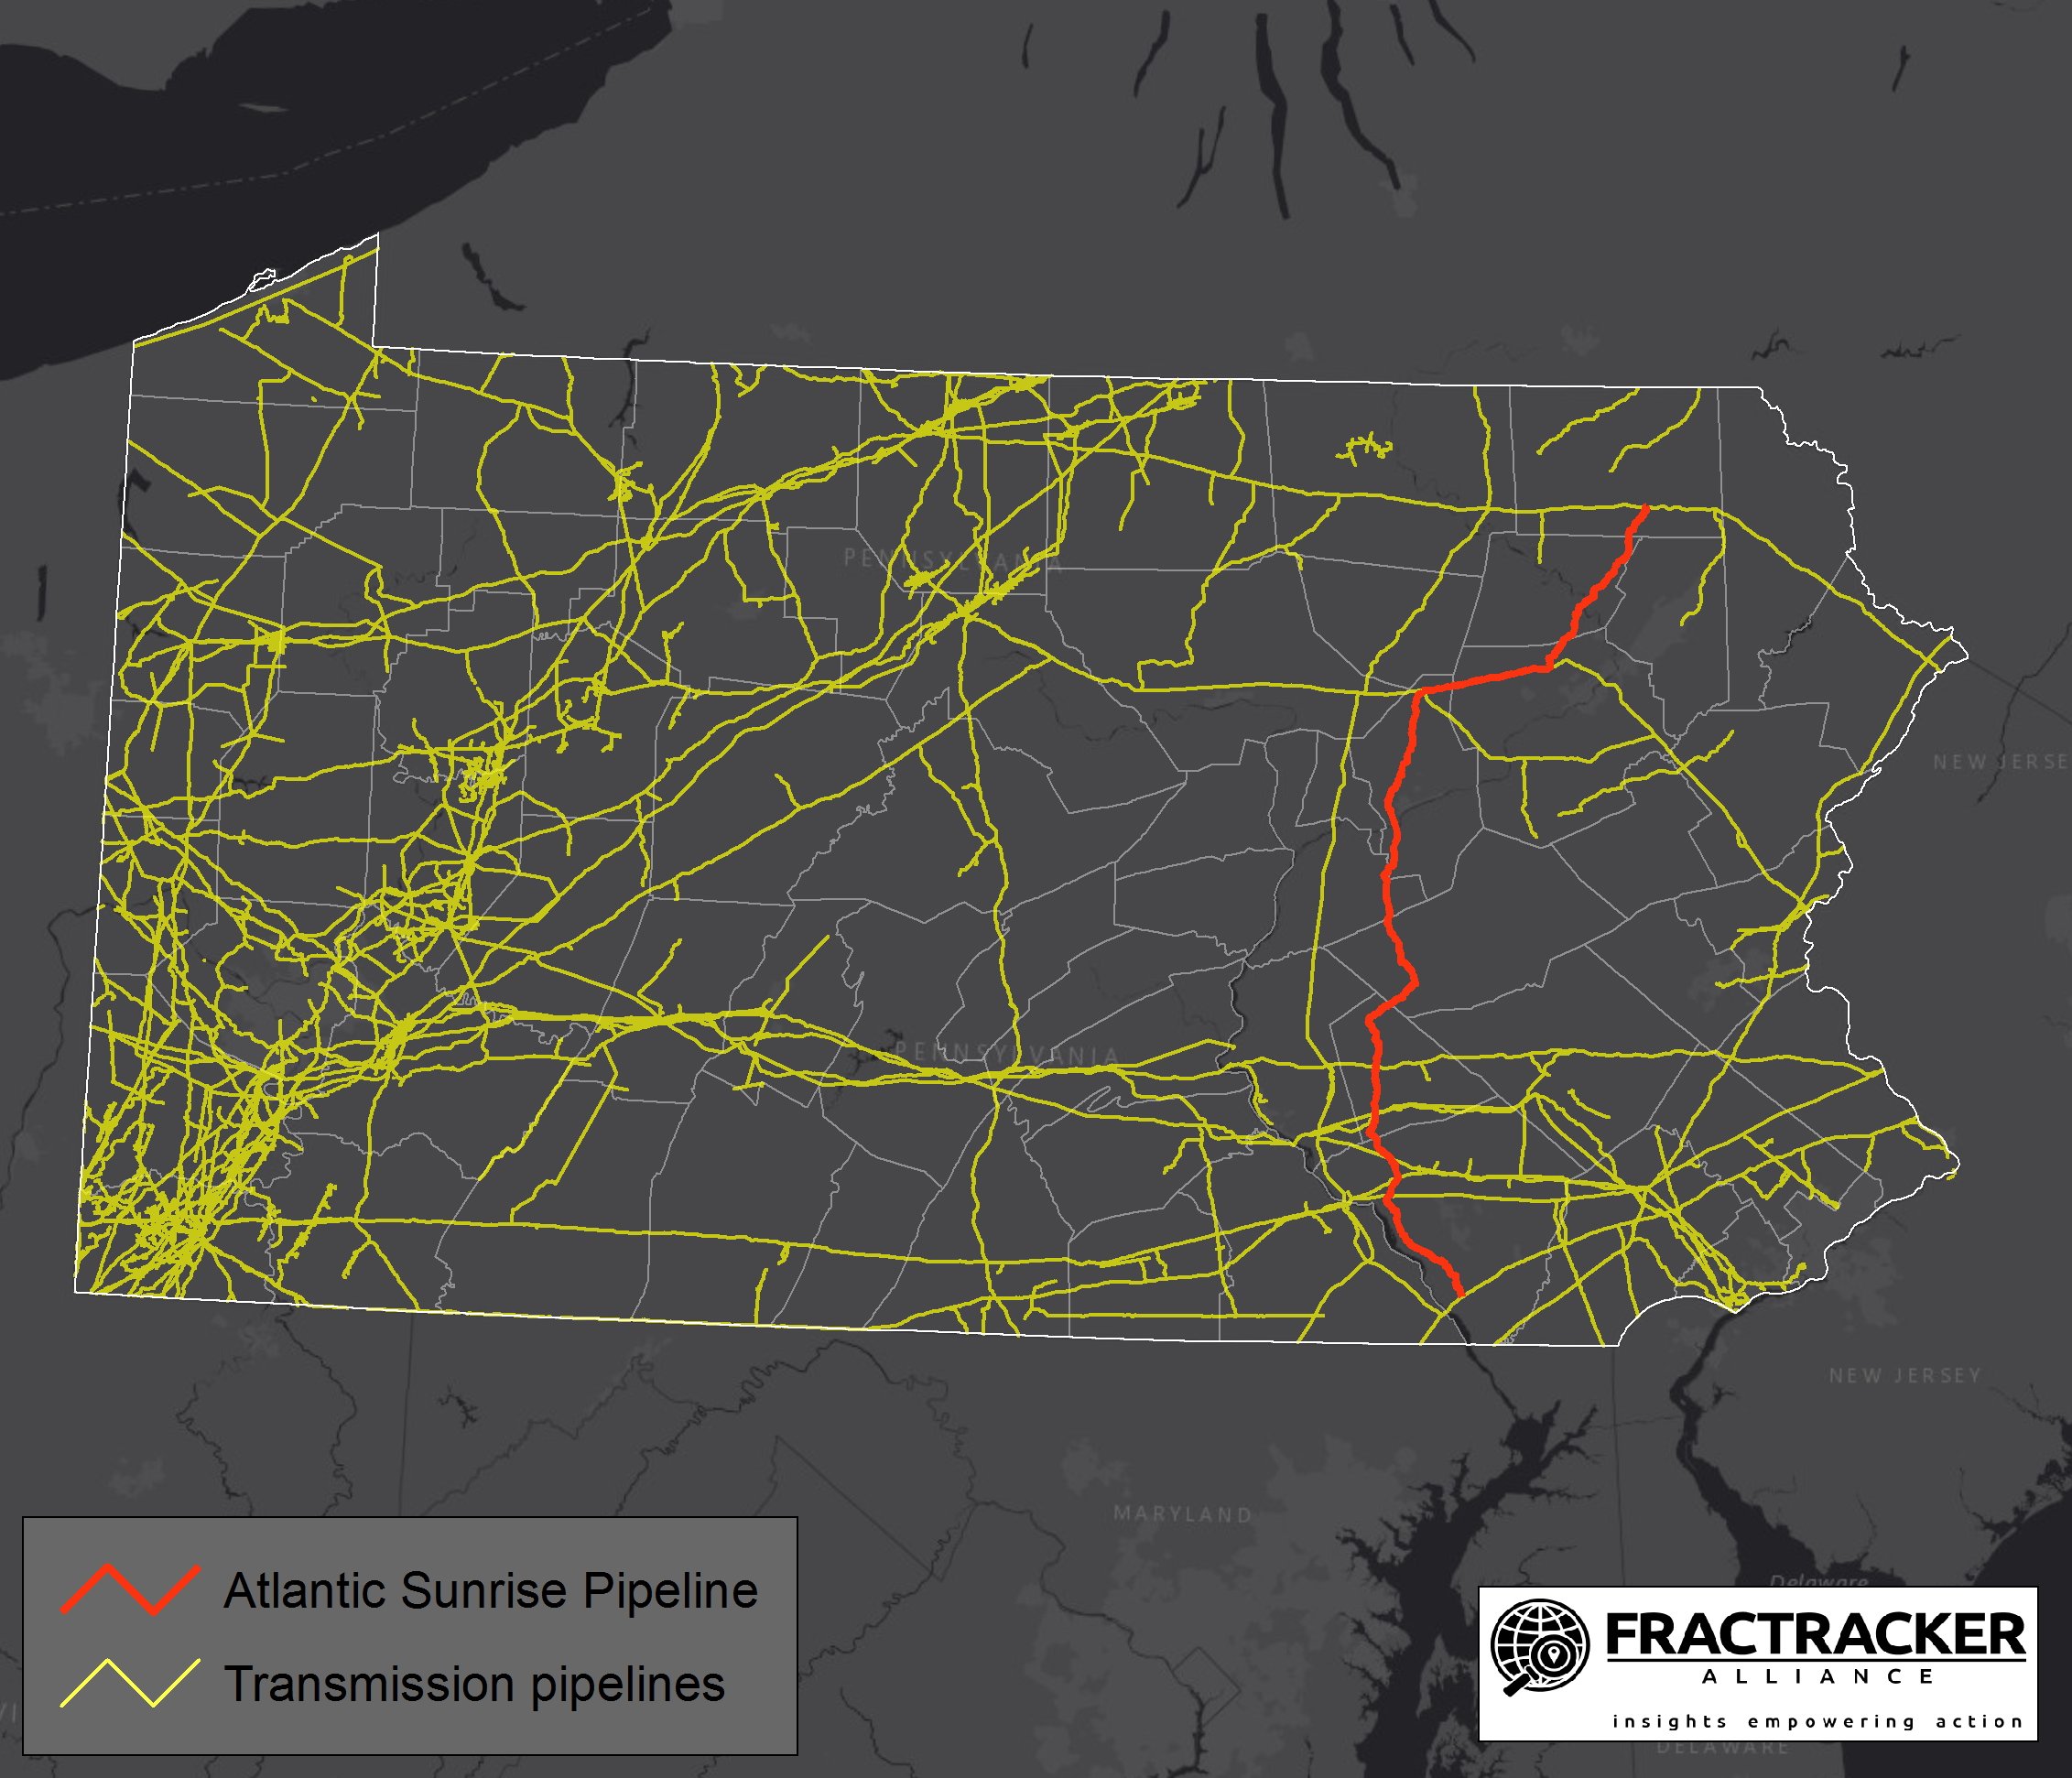
Nestled in a mostly agricultural region blessed with some of the most fertile, non-irrigated farmland in the world, Lebanon County, Pennsylvania sits square in the crosshairs of a Pipeline Revolution – smack-dab in between the Marcellus Shale fracking zones in northern and western PA and the processing and export facilities of the Eastern seaboard. This Pipeline Revolution began in earnest more than four years ago, in spring 2014, when Williams/Transco announced plans to build a 200-mile, 42-inch diameter, high-pressure (1,480 p.s.i.) underground natural gas pipeline with the Orwellian-sounding name “Atlantic Sunrise” as a shortcut to whisk fracked natural gas to points south – mainly Cove Point just south of Baltimore – for export. See map below for more context.
That’s the north-south axis of the crosshairs. East-west, for starters, is the 8-inch diameter, cast-iron Mariner East pipeline, which has traversed the state since the late 1930s, carrying gasoline from the Philadelphia region to the Pittsburgh area. Also around spring 2014, Mariner East’s owner-operator, Sunoco Logistics, announced its Mariner East expansion project: to stop carrying gasoline, reverse the flow, and start streaming natural gas liquids (NGLs – mainly propane, ethane, and butane) from the fracking zones of western PA to the Marcus Hook export facility outside Philadelphia. Also planned were several new larger-volume pipelines to be laid in the same easement – Mariner East 2 and 2X – along with their corresponding pump stations.
The two major transmission pipeline projects cross on private land atop a forested hill in Lebanon County’s South Londonderry Township – making “in the crosshairs” an apt metaphor for where we stand in relation to the Pipeline Revolution.
In response to Williams/Transco’s announcement in spring 2014, activists in neighboring Lancaster County organized the grassroots citizens’ group Lancaster Against Pipelines. We soon followed suit, holding our first organizing meeting in April in humble surroundings, an artist’s loft in downtown Lebanon. After a democratic vote,we called ourselves Lebanon Against Pipelines and began meeting bi-weekly with a core group of 8-10 people.
Initial organizing meeting of Lebanon Against Pipelines (soon changed to Lebanon Pipeline Awareness), downtown Lebanon, April 2014
By summer 2014, we adopted what we felt was a more positive and publicly acceptable name in our strongly conservative county, one more in keeping with our core mission of raising public awareness about the immensely destructive power of fracking and pipelines: Lebanon Pipeline Awareness.
Making Plans
Over the next year, a core leadership emerged. With the pro-bono help of a local attorney, we became a 501c(3) non-profit corporation with officers and a board of directors, making it possible to apply for much-needed grants after our meager, mostly self-funded beginnings.
Realizing the importance of strength in numbers, from the outset we reached out to collaborate with other groups. We’ve had many key allies in this fight, especially our sister organization, Concerned Citizens of Lebanon County (CCLC). Focused on Sunoco’s Mariner East projects, CCLC has focused mainly on the judicial system to challenge the absurd notion that this project merits status as a “public utility” – most notably by pursuing civil action against Sunoco for not obtaining the proper permits before building its new pump station in West Cornwall Township.
Bringing About Change
How have we worked to raise public awareness? In most every way we can think of, given our limited resources.
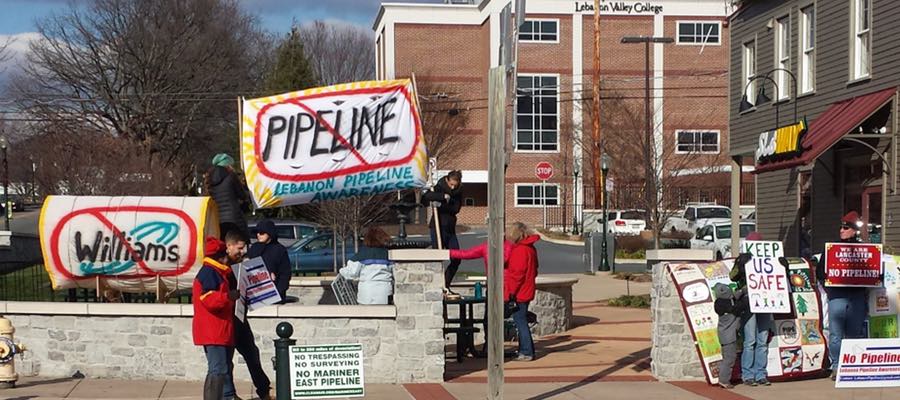
We still lack a website, but we have developed and curated a highly active Facebook presence (with nearly 800 “likes” at present). We’ve designed, printed, and distributed widely an attractive tri-fold brochure and our own eye-catching logo. We’ve set up tables at most every available community event (National Night Out in Campbelltown; Historic Old Annville Day; the Lebanon County Fair; and others). We’ve organized protests and demonstrations, often in tandem with Lancaster Against Pipelines and other allied groups. We have sponsored film screenings, public safety forums, speakers from allied organizations, and informational meetings for local landowners and other concerned citizens.
Public protest with Lancaster Against Pipelines, Annville town square, December 2015
We’ve attended local municipal meetings to encourage local authorities to pass resolutions opposing the pipelines traversing their municipalities – in two cases successfully. We’ve filed dozens of Right-To-Know requests, developing a rich archive of construction violations and disseminating our findings publicly. We’ve brought our concerns to the county commissioners’ meetings, prompting them to write letters of concern to state and federal officials and add an informational “pipelines” tab to their website. We have developed a robust presence in local media outlets – issuing press releases and writing letters to the editor and op-ed pieces, and inviting reporters to the events we sponsor – including local newspapers (like the Lebanon Daily News), regional digital media platforms (like NPR’s StateImpact), local TV and radio stations, and more. We’ve even hosted a few tours for national photographers and reporters.
Working with Others
In our interactions with local governmental authorities, we consistently act respectfully and courteously and try hard not to blindside anyone. Before attending a public meeting, we’ll send a courtesy note to the relevant authority, detailing our concerns and summarizing what we’ll be saying and asking for. When speaking at public meetings, we’re civil, crisp, and respectful – though, when necessary, we have engaged in peaceful acts of public protest (like duct-taping our mouths shut when prevented from speaking at a township meeting because we’re not township residents).
We’ve also met with all of our state representatives, either in individual meetings or during town hall-style meetings with constituents. We’ve expressed our concerns to members of Governor Tom Wolf’s staff, his Pipeline Infrastructure Task Force and other Department of Environmental Protection officials, the Susquehanna River Basin Commission, the Federal Energy Regulatory Commission, and other public bodies.
Innovative Pipeline Monitoring Program
Citizen pipeline monitoring badge
More recently, with pipeline construction well underway, we’ve developed a pipeline construction monitoring program, undergoing rigorous training and developing official badges to identify ourselves and our organization. We also register all of our monitors with the county commissioners’ office (to prevent imposters from engaging in nefarious acts in our name). (See badge, right)
And it’s made a difference.
I remember well our first outreach efforts in summer 2014 at events like National Night Out in Campbelltown, where we were met with a fair amount of open hostility. “Why do you oppose American energy independence?” people would ask. “What about all the jobs the pipelines will bring to local workers?” After four years of respectfully but insistently hammering on these issues, the public tenor has shifted. Very rarely do we encounter outright hostility anymore. The public has grown increasingly receptive to our message – especially now that construction has begun and folks can see that what we’ve predicted is now coming to pass.
Respect and Reciprocity
We’ve worked very hard to cultivate a respectable public persona and reputation, and we’ve largely succeeded. As best as we can tell, the predominant public perception is that Lebanon Pipeline Awareness is run by a group of dedicated and well-informed volunteers with an important message to share. In fact, two of our leaders were singled out last year by the local newspaper for recognition as providing a positive impact for our community. Our core group, which generally meets twice a month, has expanded to include upwards of 15 committed local activists.
We’ve also worked hard to always couple our anti-pipeline message with a positive message about renewable energy – repeatedly emphasizing that wind, solar, geothermal, and other green energies represent an increasingly viable alternative for energy and for jobs.
In It for the Long Haul
So that’s where we in Lebanon Pipeline Awareness stand at the beginning of our fifth year. Because we have every reason to expect this insane pipeline buildout to intensify, we know we’re in it for the long haul. Our goals for the coming year are to expand our membership; build on and extend our alliances even further; intensify our outreach efforts and our pipeline construction monitoring program; and continue to host public meetings for concerned property owners and citizens.
CHISPA Flyer – Click to enlarge
We also plan to expand our activities to include direct action campaigns like CHISPA – “Challenge in the Streets to Pipelines in PA” – where every Friday afternoon from 4-6 p.m. we’ll be lining five miles of westbound Route 422 from Lebanon to Annville with volunteers bearing provocative protest signs that challenge the thousands of passing motorists to think in fresh ways about issues like climate change, jobs, eminent domain, property rights, renewable energies, and more.
Lebanon Pipeline Awareness is but one of dozens of grassroots citizens’ organizations that have emerged across Pennsylvania over the past decade to resist the Fracking and Pipeline revolutions and insist that we follow “a better path” (the name of an emergent coalition of anti-fracking and anti-pipeline groups from across Pennsylvania). We have lost many battles against our vastly more deep-pocketed and powerful adversaries, but we’ve also made a substantial and positive difference.
Will we win the war? Yes, eventually, as global climate disruption makes increasingly clear that our most pressing need as a species is to leave the remaining stocks of fossil fuels in the ground. In the meantime, win or lose, our efforts continue – and will continue as long as these insane Fracking and Pipeline revolutions continue to imperil humankind and the web of life that sustains us all.
We are always learning new things at FracTracker. While we have been analyzing and mapping oil and gas (O&G) violations issued by the Department of Environmental Protection (DEP) in Pennsylvania since 2010, we have apparently been under-representing the total amount of issues associated with unconventional drilling in the state.
The reason for the missing violations is that there are inconsistencies with how well pads are classified in the compliance report. Many of these well pads – full of unconventional permits and drilled wells – are indeed categorized as “unconventional” in the DEP compliance data. Others, equally full of unconventional permits and wells, simply leave that field blank.
Therefore, any analysis for unconventional violations is likely to miss some of the incidents that are attributed to the well pad itself, as opposed to any of the wells that are found upon that well pad.
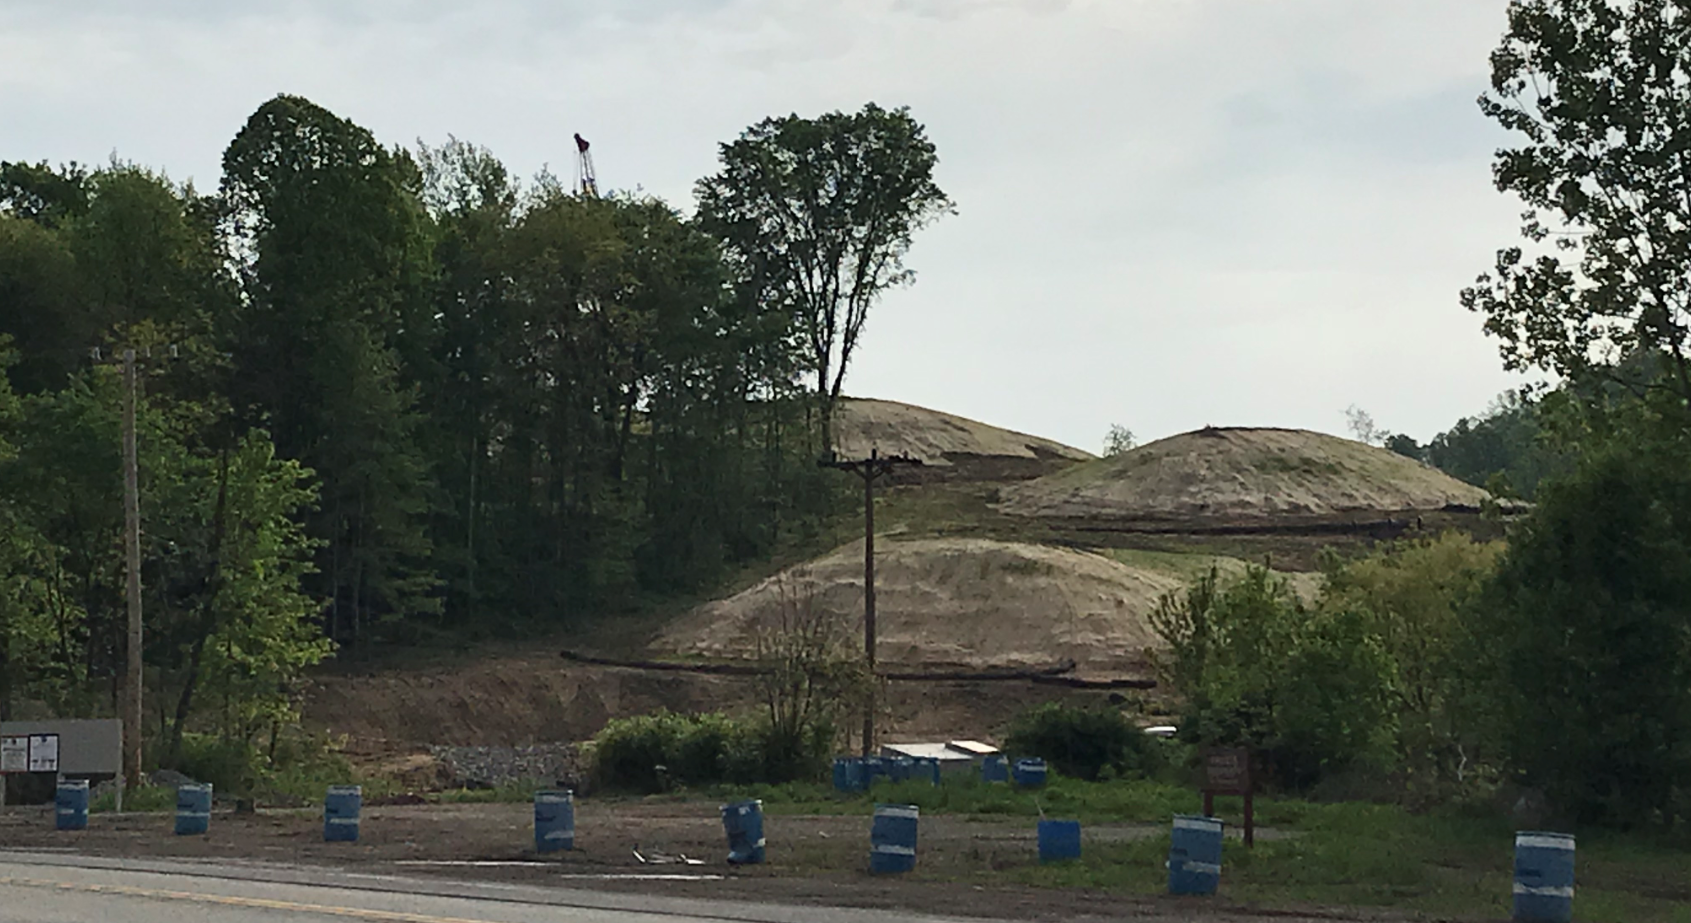
Midas Well Pad unearths issue
While we have heard about missing violation data in the past, I discovered the nature of the issue while researching the Midas Well Pad in Plum Borough, Allegheny County on the DEP resource site eFACTS, noting the presence of multiple violations at the nascent well site. However, when attempting to download the relevant data on the compliance report, the results were missing. I had entered search parameters that made sense to me, limiting results to violations in the proper county and municipality, and including an inspection date range that was broader than what was showing up on eFACTS. I had also limited results to unconventional wells, because while this is Plum’s first unconventional well pad, the back roads are dotted with dozens – if not hundreds – of conventional O&G sites.
The Midas Well Pad, as seem from Coxcomb Hill Rd. in Plum, PA
After that attempt failed, I downloaded the entire state’s worth of data, whether conventional or not, and I was able to find the 31 violations associated with the well pad.
I contacted DEP about this, wondering whether there was some data irregularity that prevented my search in Plum from finding all of the incidents that occurred there. The reply was somewhat helpful, noting that there was no county, municipality, or unconventional value associated with that well pad in the compliance report, explaining why the search result came up negative.
It is worth noting that the separate well pad report does indeed have values for all of these fields for the Midas Well Pad, so there is a lack of consistency on this issue. Even more importantly, it is worth remembering that any compliance report search that limits results using county, municipality, or unconventional variables are likely to result in incomplete results.
The violations at the Midas Well Pad are focused around erosion and sedimentation issues, wetland impacts, failure to follow approved methodology, and failure to fix some of the problems on subsequent site inspections. The compliance report includes a narrative inspection comment, giving the public a glimpse through the inspector’s eyes. Here is one of several such comments at the site:
Follow up inspection related to wetland impact reported on 2/23/18 and 2/24/18. At the time of inspection, the Operator was actively conducting earth disturbance activity associated with the construction of well pad channel 6. The Department gave verbal permission on 2/27/2018 to deviate from the construction sequence and continue with the construction of PCSM wet pond 1. At the time of inspection wet pond 1 was partially constructed. The outlet structure and emergency spillway associated with wet pond 1. At the time of inspection wet pond 1 was holding water, however the slopes were not temporary stabilized. The Operator indicated that additional work was planned for the wet pond and would be temporary stabilized. The Operator indicated a previously unidentified seep located upgradient and outside of the LOD is contributing additional water to wet pond 1. The Department recommended the Operator identify wet weather springs upgradient from wet pond 1. Additionally, the Department recommends the Operator monitor all additional flow and submit a permit modification outlines changes made to the construction sequence and identifies the location of all toe drains to be constructed on site. The Department and Operator agreed to reschedule an onsite meeting to discuss the remediation of the wetland. Th Department recommends the Operator monitor the vegetative growth in the wetland. The Department recommends that the Operator add additional temporary mulch to the disturbed area and continue to perform routine maintenance to the temporary BMPs.
How pervasive is this problem?
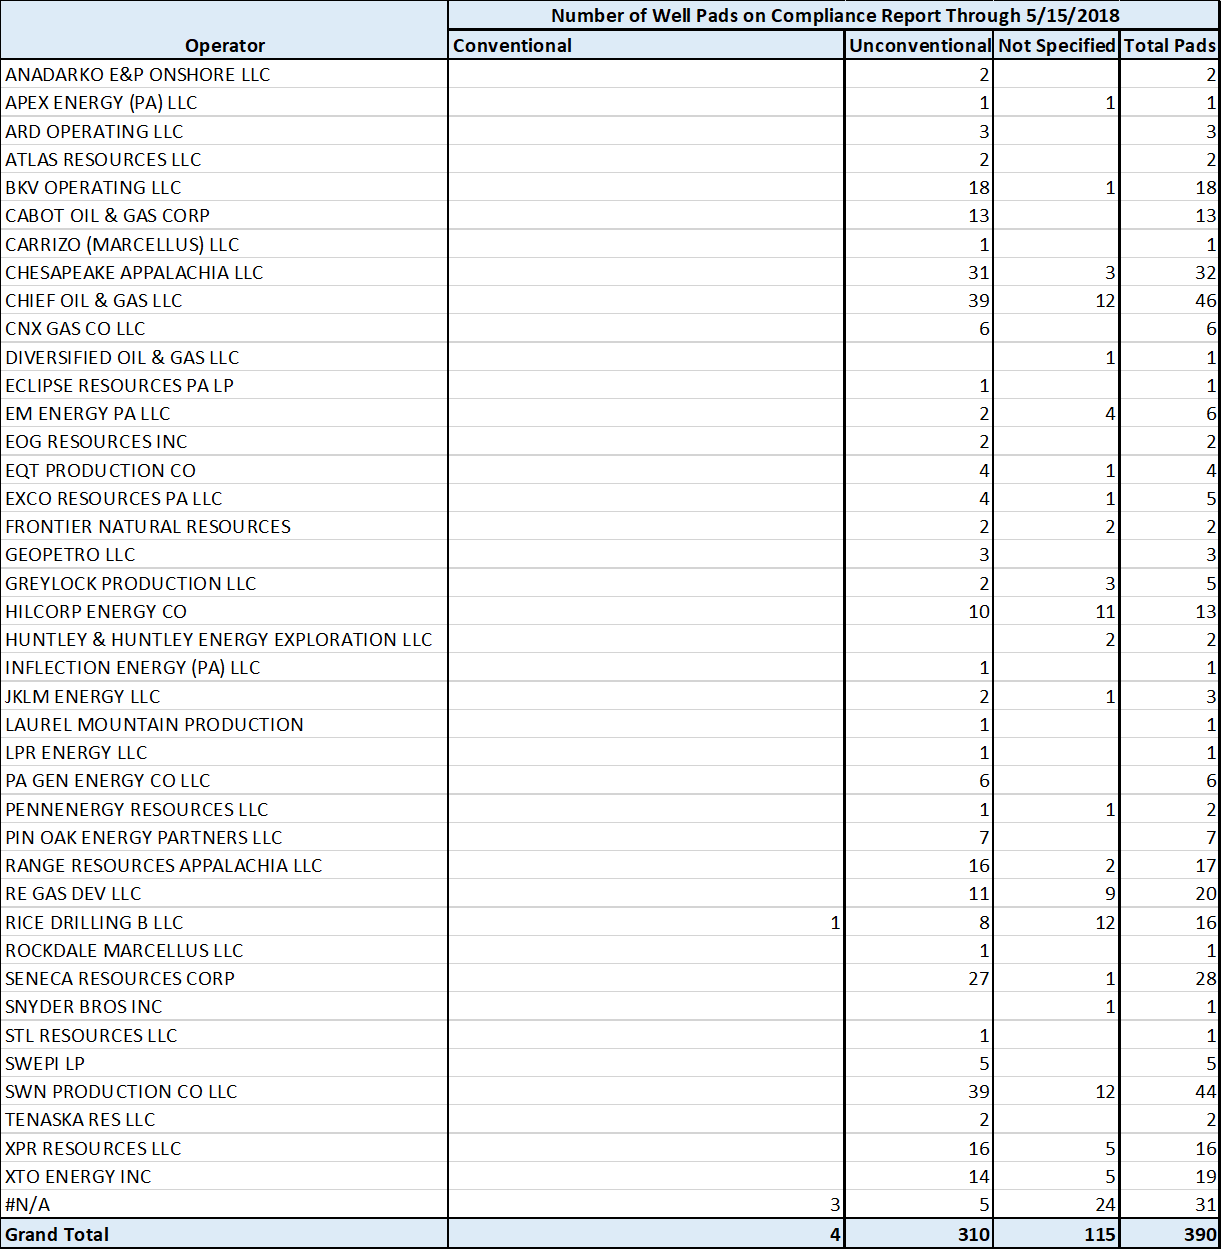
The DEP well pad report contains data on 12,600 wells, situated on 3,715 wells pads. On the compliance side, there are 2,689 violations at 390 different sites that contain the words “Well Pad.” 739 of these violations do not have associated Well API Numbers, and are therefore not shown in our Pennsylvania Shale Viewer map. The number of sites with violations per operator is shown below in Figure 1 (click to expand).
Figure 1: Number of well pads appearing on compliance report by operator, through 5/15/2018. Click on the image to see the full-sized version.
There are four things to note about about Figure 1.
First, this table is not the number of violations on well pads, but merely the count of well pads with violations appearing on the compliance report.
Second, this does not contain any data on wells on those pads that were issued violations – only instances where the well pads themselves were cited are shown.
This map shows oil and gas (O&G) violations in Pennsylvania that are assessed to well pads, as opposed to individual wells. To access the map’s legend and other details, click the double-arrow icon at the top-left corner of the map.
The third thing to note about Figure 1 is that there are instances where the same pad falls into more than one category. Hilcorp Energy, for example, has 10 wells in the unconventional category, 11 wells that are not defined, but only 13 total wells, indicating significant overlap between the categories.
And fourth, there are 31 instances where the phrase “well pad” occurs in the compliance report where the unique Site ID# does not appear on the well pad report. In some cases, the name of the facility indicates that it might be for another facility that is related to the well pad, such as “Southwest System – Well Pad 36 to Bluestone Pipeline.” For other entries, such as “Yarasavage Well Pad”, it remains unclear why the Site ID# does not yield a matching entry from the well pad report.
By Matt Kelso, Manager of Data and Technology, FracTracker Alliance
https://www.fractracker.org/a5ej20sjfwe/wp-content/uploads/2018/05/PA-Well-Pad-Violations-Feature.jpg400900Matt Kelso, BAhttps://www.fractracker.org/a5ej20sjfwe/wp-content/uploads/2025/09/2025-Wordmark-Logo.pngMatt Kelso, BA2018-05-23 09:39:172021-04-15 15:01:18Well Pad Violations in Pennsylvania
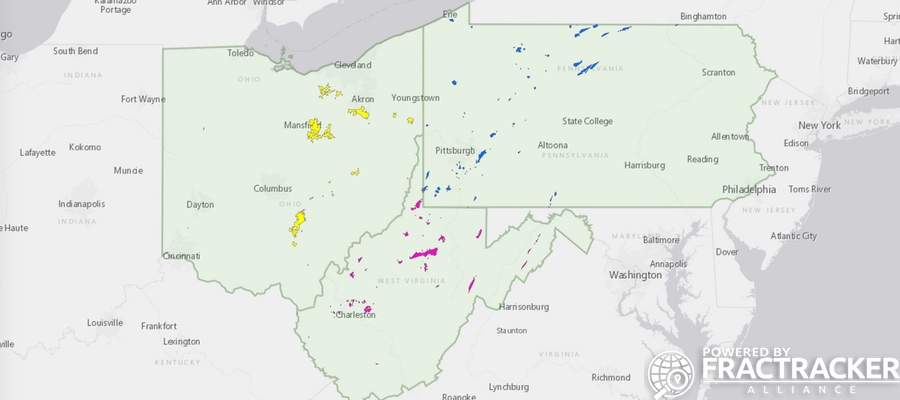
FracTracker has received numerous requests to compile a regional map of natural gas storage wells. In response, we have built the dynamic map below covering storage wells in Pennsylvania, Ohio, and West Virginia:
The colored areas on the map above (pink, blue, and yellow) correspond to gas storage wells in one of the three states. When you first view the map in fullscreen mode you will notice that these wells have been “generalized” into one large layer. That feature allows the map to load more quickly in your browser.
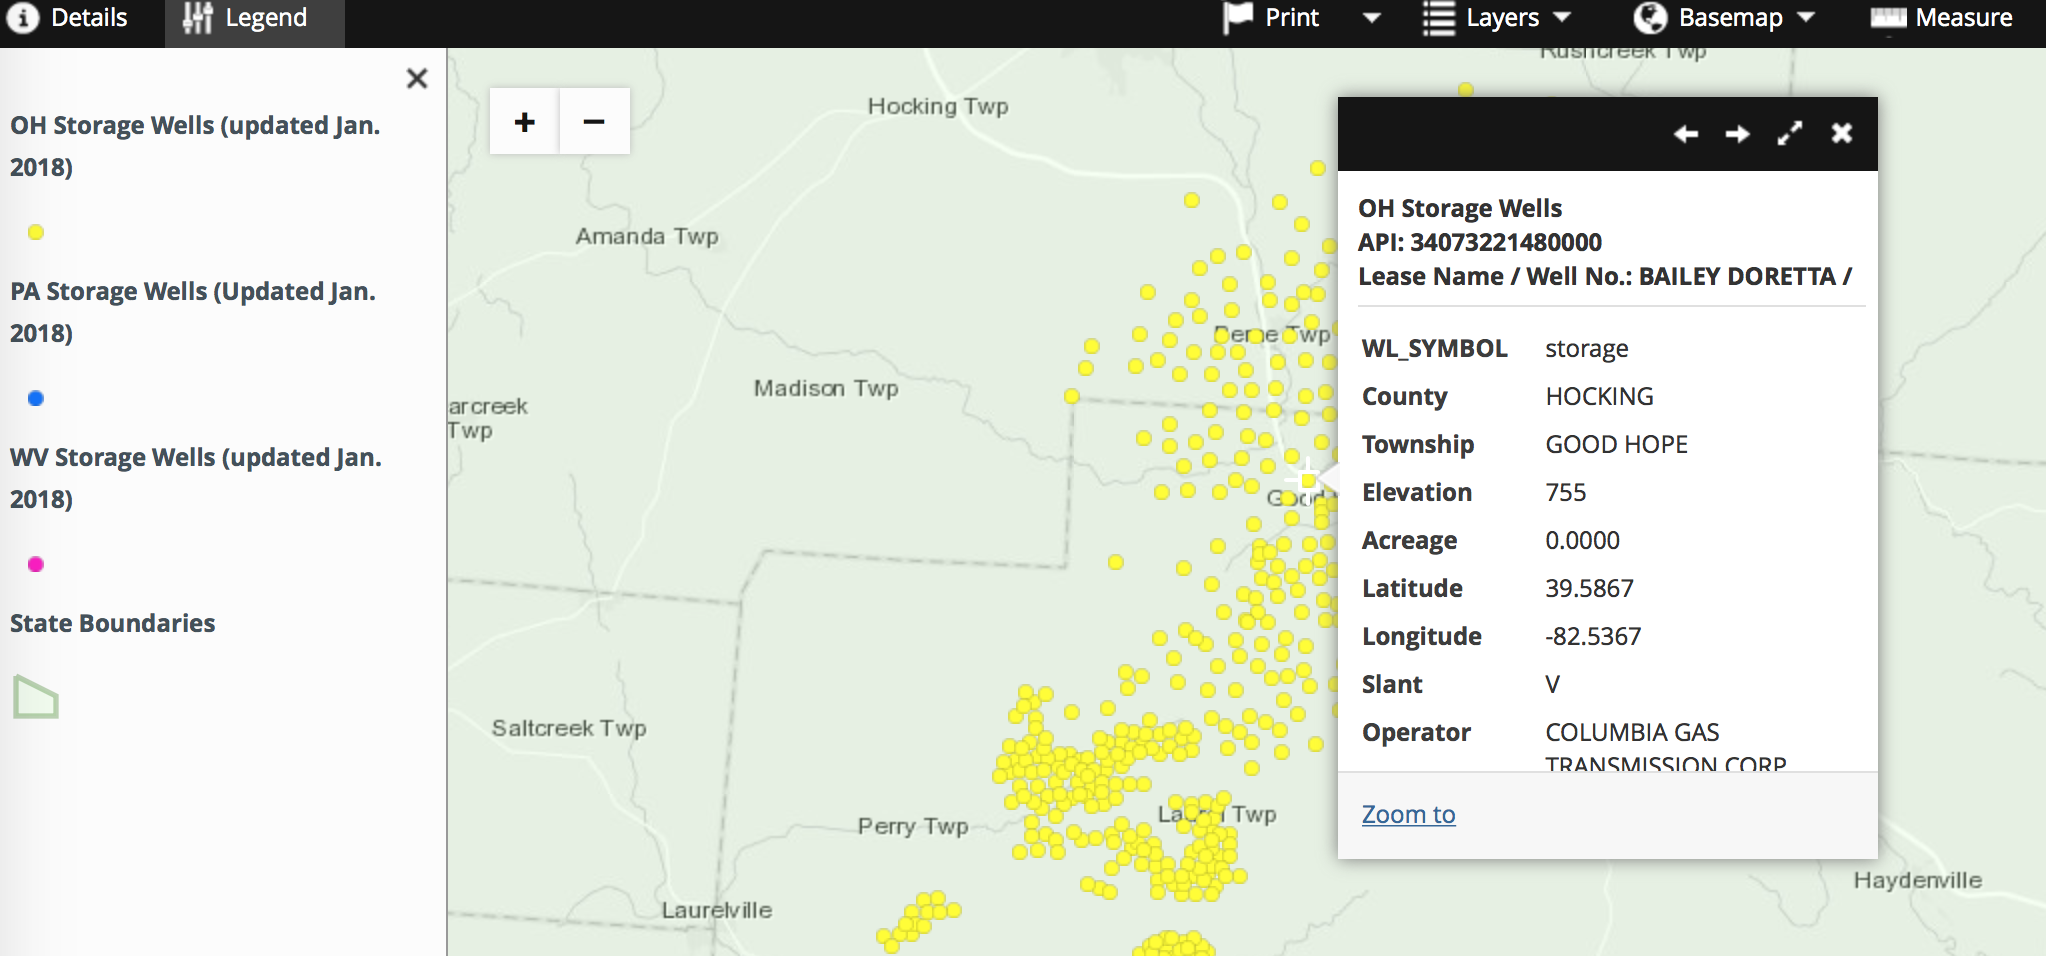
Zoom in further to where the generalized layers change to individual points in order to explore the wells more in depth, as shown in the screenshot below:
Map Metadata: Upper Appalachian Gas Storage Wells
This map shows gas storage wells in Ohio, Pennsylvania, and West Virginia. Due to the large amount of data, generalized layers were created to show the location of the storage fields at statewide zoom levels. To access well data, viewers must zoom in beyond the scale of 1:500,000, or about the size of a large county. Each state’s data includes slightly different data fields.
Data Layers include:
Name: OH Storage Wells
Date: January 2018
Source: Ohio DNR
Notes: Gas storage wells in Ohio. Storage wells selected from a broader dataset by FracTracker Alliance.
Name: PA Storage Wells
Date: January 2018
Source: Pennsylvania DEP
Notes: Gas storage wells in Pennsylvania. Storage wells selected from a broader dataset by FracTracker Alliance.
Name: WV Storage Wells
Date: January 2018
Source: West Virginia DEP
Notes: Gas storage wells in West Virginia. Storage wells selected from a broader dataset by FracTracker Alliance.
Name: State Boundaries
Date: 2018
Source: USDA Geospatial Data Gateway
Notes: State boundaries of states with gas storage wells on this map.
https://www.fractracker.org/a5ej20sjfwe/wp-content/uploads/2018/04/StorageWells-Appalachia-Feature.jpg400900FracTracker Alliancehttps://www.fractracker.org/a5ej20sjfwe/wp-content/uploads/2025/09/2025-Wordmark-Logo.pngFracTracker Alliance2018-04-11 13:41:432021-04-15 15:01:19New map available showing Upper Appalachian gas storage wells
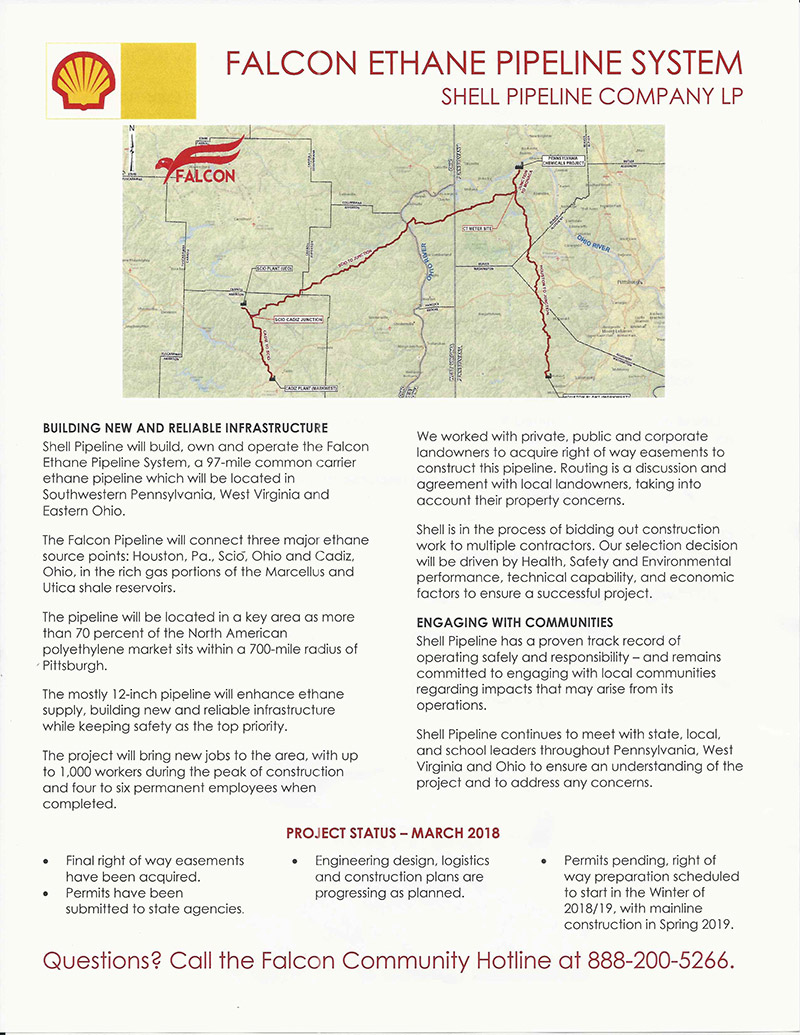
In August 2016, Shell Pipeline announced plans to develop the Falcon Ethane Pipeline System, a 97-mile pipeline network that will carry more than 107,000 barrels of ethane per day through Pennsylvania, West Virginia, and Ohio, to feed Shell Appalachia’s petrochemical facility currently under construction in Beaver County, PA.
FracTracker has covered the proposed Falcon pipeline extensively in recent months. Our Falcon Public EIA Project explored the project in great detail, revealing the many steps involved in risk assessments and a range of potential impacts to public and environmental health.
Shell’s response to these events has invariably focused on their intent to build and operate a pipeline that exceeds safety standards, as well as their commitments to being a good neighbor. In this article, we investigate these claims by looking at federal data on safety incidents related to Shell Pipeline.
Contrary to claims, records show that Shell’s safety record is one of the worst in the nation.
The “Good Neighbor” Narrative
Maintaining a reputation as a “good neighbor” is paramount to pipeline companies. Negotiating with landowners, working with regulators, and getting support from implicated communities can hinge on the perception that the pipeline will be built and operated in a responsible manner. This is evident in cases where Shell Pipeline has sold the Falcon in press releases as an example of the company’s commitment to safety in public comments.
Figure 1. Shell flyer
A recent flyer distributed to communities in the path of the Falcon, seen in Figure 1, also emphasizes safety, such as in claims that “Shell Pipeline has a proven track record of operating safely and responsibility and remains committed to engaging with local communities regarding impacts that may arise from its operations.”
Shell reinforced their “good neighbor” policy on several occasions at a recent Shell-sponsored information meeting held in Beaver County, stating that, everywhere they do business, Shell was committed to the reliable delivery of their product. According to project managers speaking at the event, this is achieved through “planning and training with first responders, preventative maintenance for the right-of-way and valves, and through inspections—all in the name of maintaining pipeline integrity.”
Shell Pipeline also recently created an informational website dedicated to the Falcon pipeline to provide details on the project and emphasize its minimal impact. Although, curiously, Shell’s answer to the question “Is the pipeline safe?” is blank.
U.S. Pipeline Incident Data
Every few years FracTracker revisits data on pipeline safety incidents that is maintained by the Pipeline and Hazardous Materials Safety Administration (PHMSA). In our last national analysis we found that there have been 4,215 pipeline incidents resulting in 100 reported fatalities, 470 injuries, and property damage exceeding $3.4 billion.
These numbers were based on U.S. data from 2010-2016 for natural gas transmission and gathering pipelines, natural gas distribution pipelines, and hazardous liquids pipelines. It is also worth noting that incident data are heavily dependent on voluntary reporting. They also do not account for incidents that were only investigated at the state level.
Shell Pipeline has only a few assets related to transmission, gathering, and distribution lines. Almost all of their pipeline miles transport highly-volatile liquids such as crude oil, refined petroleum products, and hazardous liquids such as ethane. Therefore, to get a more accurate picture of how Shell Pipeline’s safety record stacks up to comparable operators, our analysis focuses exclusively on PHMSA’s hazardous liquids pipeline data. We also expanded our analysis to look at incidents dating back to 2002.
Shell’s Incident Record
In total, PHMSA data show that Shell was responsible for 194 pipeline incidents since 2002. These incidents spilled 59,290 barrels of petrochemical products totaling some $183-million in damages. The below map locates where most of these incidents occurred. Unfortunately, 34 incidents have no location data and so are not visible on the map. The map also shows the location of Shell’s many refineries, transport terminals, and off-shore drilling platforms.
Open the map fullscreen to see more details and tools for exploring the data.
PHMSA’s hazardous liquid pipeline data account for more than 350 known pipeline operators. Some operators are fairly small, only maintaining a few miles of pipeline. Others are hard to track subsidiaries of larger companies. However, the big players stand out from the pack — some 20 operators account for more than 60% of all pipeline miles in the U.S., and Shell Pipeline is one of these 20.
Comparing Shell Pipeline to other major operators carrying HVLs, we found that Shell ranks 2nd in the nation in the most incidents-per-mile of maintained pipeline, seen in table 1 below. These numbers are based on the total incidents since 2002 divided by the number of miles maintained by each operator as of 2016 miles. Table 2 breaks Shell’s incidents down by year and number of miles maintained for each of those years.
Table 1: U.S. Pipeline operators ranked by incidents-per-mile
Operator
HVL Incidents
HVL Pipeline Miles
Incidents Per Mile (2016)
Kinder Morgan
387
3,370
0.115
Shell Pipeline
194
3,490
0.056
Chevron
124
2,380
0.051
Sunoco Pipeline
352
6,459
0.049
ExxonMobile
240
5,090
0.048
Colonial Pipeline
244
5,600
0.044
Enbride
258
6,490
0.04
Buckeye Pipeline
231
7,542
0.031
Magellan Pipeline
376
12,928
0.03
Marathan Pipeline
162
5,755
0.029
Table 2: Shell incidents and maintained pipeline miles by year
Year
Incidents
Pipeline Miles
Total Damage
Notes
2002
15
no PHMSA data
$2,173,704
2003
20
no PHMSA data
$3,233,530
2004
25
5,189
$40,344,002
Hurricane Ivan
2005
22
4,830
$62,528,595
Hurricane Katrina & Rita
2006
10
4,967
$11,561,936
2007
5
4,889
$2,217,354
2008
12
5,076
$1,543,288
2009
15
5,063
$11,349,052
2010
9
4,888
$3,401,975
2011
6
4,904
$2,754,750
2012
12
4,503
$17,268,235
2013
4
3,838
$10,058,625
2014
11
3,774
$3,852,006
2015
12
3,630
$4,061,340
2016
6
3,490
$6,875,000
2017
9
no PHMSA data
$242,800
2018
1
no PHMSA data
$47,000
As of 3/1/18
Cause & Location of Failure
What were the causes of Shell’s pipeline incidents? At Shell’s public informational session, it was said that “in the industry, we know that the biggest issue with pipeline accidents is third party problems – when someone, not us, hits the pipeline.” However, PHMSA data reveal that most of Shell’s incidents issues should have been under the company’s control. For instance, 66% (128) of incidents were due to equipment failure, corrosion, welding failure, structural issues, or incorrect operations (Table 3).
Table 3. Shell Pipeline incidents by cause of failure
Cause
Incidents
Equipment Failure
51
Corrosion
37
Natural Forces
35
Incorrect Operation
25
Other
20
Material and/or Weld Failure
15
Excavation Damage
11
Total
194
However, not all of these incidents occurred at one of Shell’s petrochemical facilities. As Table 4 below illustrates, at least 57 incidents occurred somewhere along the pipeline’s right-of-way through public areas or migrated off Shell’s property to impact public spaces. These numbers may be higher as 47 incidents have no mention of the property where incidents occurred.
Table 4. Shell Pipeline incidents by location of failure
Location
Incidents
Contained on Operator Property
88
Pipeline Right-of-Way
54
Unknwon
47
Originated on Operator Property, Migrated off Property
3
Contained on Operator-Controlled Right-of-Way
2
Total
194
On several occasions, Shell has claimed that the Falcon will be safely “unseen and out of mind” beneath at least 4ft of ground cover. However, even when this standard is exceeded, PHMSA data revealed that at least a third of Shell’s incidents occurred beneath 4ft or more of soil.
Many of the aboveground incidents occurred at sites like pumping stations and shut-off valves. For instance, a 2016 ethylene spill in Louisiana was caused by lightning striking a pumping station, leading to pump failure and an eventual fire. In numerous incidents, valves failed due to water seeping into systems from frozen pipes, or large rain events overflowing facility sump pumps. Table 5 below breaks these incidents down by the kind of commodity involved in each case.
Table 5. Shell Pipeline incidents by commodity spill volumes
Commodity
Barrels
Crude Oil
51,743
Highly Volatile Liquids
6,066
Gas/Diesel/Fuel
1,156
Petroleum Products
325
Total
59,290
Impacts & Costs
None of Shell’s incidents resulted in fatalities, injuries, or major explosions. However, there is evidence of significant environmental and community impacts. Of 150 incidents that included such data, 76 resulted in soil contamination and 38 resulted in water contamination issues. Furthermore, 78 incidents occurred in high consequence areas (HCAs)—locations along the pipeline that were identified during construction as having sensitive environmental habitats, drinking water resources, or densely populated areas.
Table 6 below shows the costs of the 194 incidents. These numbers are somewhat deceiving as the “Public (other)” category includes such things as inspections, environmental cleanup, and disposal of contaminated soil. Thus, the costs incurred by private citizens and public services totaled more than $80-million.
Table 6. Costs of damage from Shell Pipeline incidents
Private Property
Emergency Response
Environmental Cleanup
Public (other)
Damage to Operator
Total Cost
$266,575
$62,134,861
$11,024,900
$7,308,000
$102,778,856
$183,513,192
A number of significant incidents are worth mention. For instance, in 2013, a Shell pipeline rupture led to as much as 30,000 gallons of crude oil spilling into a waterway near Houston, Texas, that connects to the Gulf of Mexico. Shell’s initial position was that no rupture or spill had occurred, but this was later found not to be the case after investigations by the U.S. Coast Guard. The image at the top of this page depicts Shell’s cleanup efforts in the waterway.
Another incident found that a Shell crude oil pipeline ruptured twice in less than a year in the San Joaquin Valley, CA. Investigations found that the ruptures were due to “fatigue cracks” that led to 60,000 gallons of oil spilling into grasslands, resulting in more than $6 million in environmental damage and emergency response costs. Concerns raised by the State Fire Marshal’s Pipeline Safety Division following the second spill in 2016 forced Shell to replace a 12-mile stretch of the problematic pipeline, as seen in the image above.
Conclusion
These findings suggest that while Shell is obligated to stress safety to sell the Falcon pipeline to the public, people should take Shell’s “good neighbor” narrative with a degree of skepticism. The numbers presented by PHMSA’s pipeline incident data significantly undermine Shell’s claim of having a proven track record as a safe and responsible operator. In fact, Shell ranks near the top of all US operators for incidents per HVL pipeline mile maintained, as well as damage totals.
There are inherent gaps in our analysis based on data inadequacies worth noting. Incidents dealt with at the state level may not make their way into PHMSA’s data, nor would problems that are not voluntary reported by pipeline operators. Issues similar to what the state of Pennsylvania has experienced with Sunoco Pipeline’s Mariner East 2, where horizontal drilling mishaps have contaminated dozens of streams and private drinking water wells, would likely not be reflected in PHMSA’s data unless those incidents resulted in federal interventions.
Based on the available data, however, most of Shell’s pipelines support one of the company’s many refining and storage facilities, primarily located in California and the Gulf states of Texas and Louisiana. Unsurprisingly, these areas are also where we see dense clusters of pipeline incidents attributed to Shell. In addition, many of Shell’s incidents appear to be the result of inadequate maintenance and improper operations, and less so due to factors beyond their control.
As Shell’s footprint in the Appalachian region expands, their safety history suggests we could see the same proliferation of pipeline incidents in this area over time, as well.
NOTE: This article was amended on 4/9/18 to include table 2.