Fracking in Pennsylvania: Not Worth It
Despite the ever-increasing heaps of violations and drilling waste, Pennsylvania’s fracked wells continue to produce an excess supply of gas, driving prices down. To cut their losses, the oil and gas industry is turning towards increased exports and petrochemical production. Continuing to expand fracking in Pennsylvania will only increase risks to the public and to the climate, all for what may amount to another boom and bust cycle that is largely unprofitable to investors.
Let’s take a look at gas production, waste, newly drilled wells, and violations in Pennsylvania in the past year to understand just how precarious the fracking industry is.
Production
Fracked hydrocarbon production continues to rise in Pennsylvania, resulting in an increase in waste production, violations, greenhouse gas emissions, and public health concerns. There are three types of hydrocarbons produced from wells in Pennsylvania: gas, condensate, and oil. Gas is composed mostly of methane, the most basic of the hydrocarbons, but in some parts of Pennsylvania, there can be significant quantities of ethane, propane, and other so-called “natural gas liquids” (NGLs) mixed in. Each of these NGLs are actually gaseous at atmospheric conditions, but operators try to separate these with a combination of pressure and low temperatures, converting them to a liquid phase. Some of these NGLs can be separated on-site, and this is typically referred to as condensate. Fracked wells in Pennsylvania also produce a relatively tiny amount of oil.
View map fullscreen | How FracTracker maps work
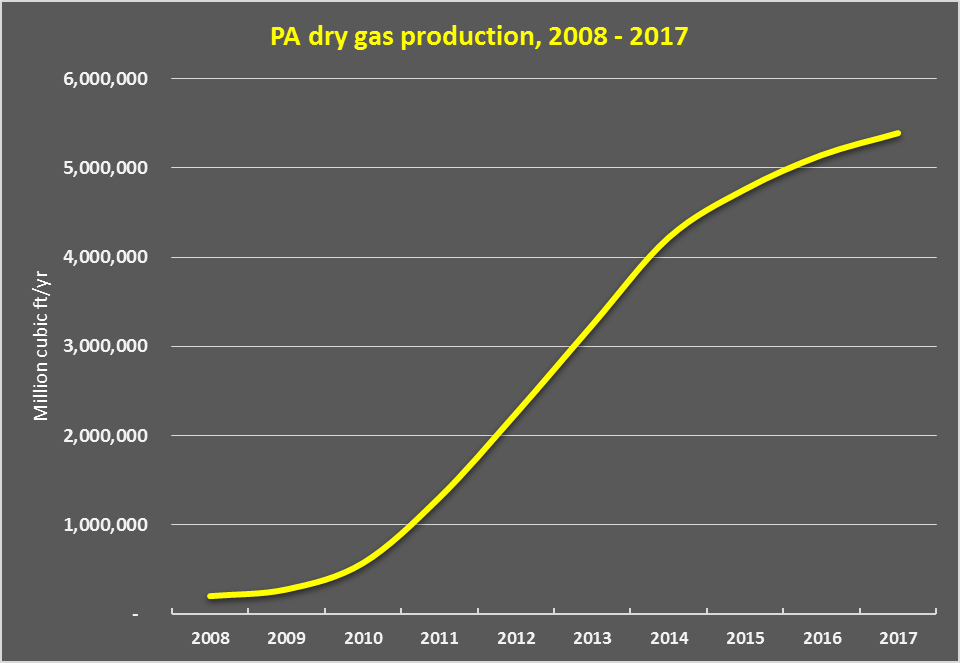
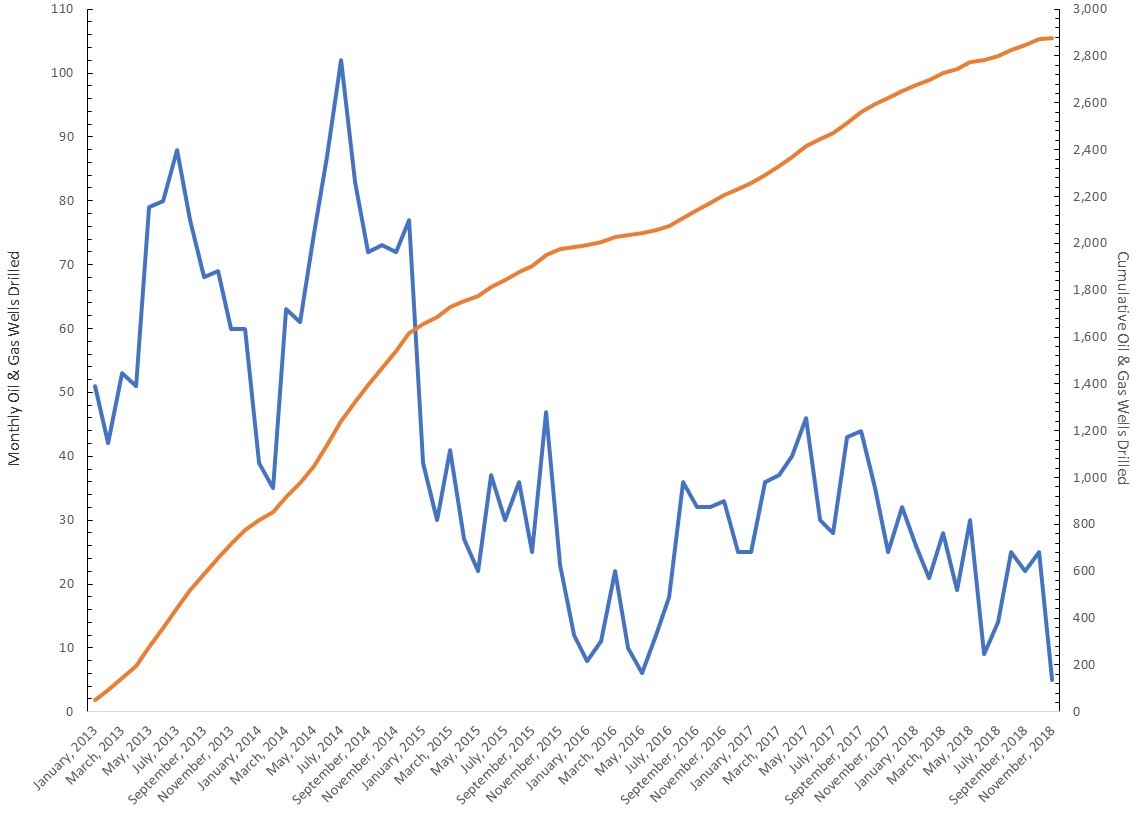
For those of you wondering why we are looking at the November, 2018 through October, 2019 time frame, this is simply a reflection of the available data. In this 12-month period, 9,858 fracked Pennsylvania wells, classified as “unconventional,” reported producing 6.68 trillion cubic feet of gas (Tcf), 4.89 million barrels of condensate, and just over 70,000 barrels of oil.
By means of comparison, Pennsylvania consumed about 1.46 Tcf of gas across all sectors in 2018, of which just 253 billion cubic feet (Bcf) was used in the homes of Pennsylvania’s 12.8 million residents. In fact, the amount of gas produced in Pennsylvania exceeds residential consumption in the entire United States by almost 1.7 Tcf. However, less than 17% of all gas consumed in Pennsylvania is for residential use, with nearly 28% being used for industrial purposes (including petrochemical development), and more than 35% used to generate electricity.
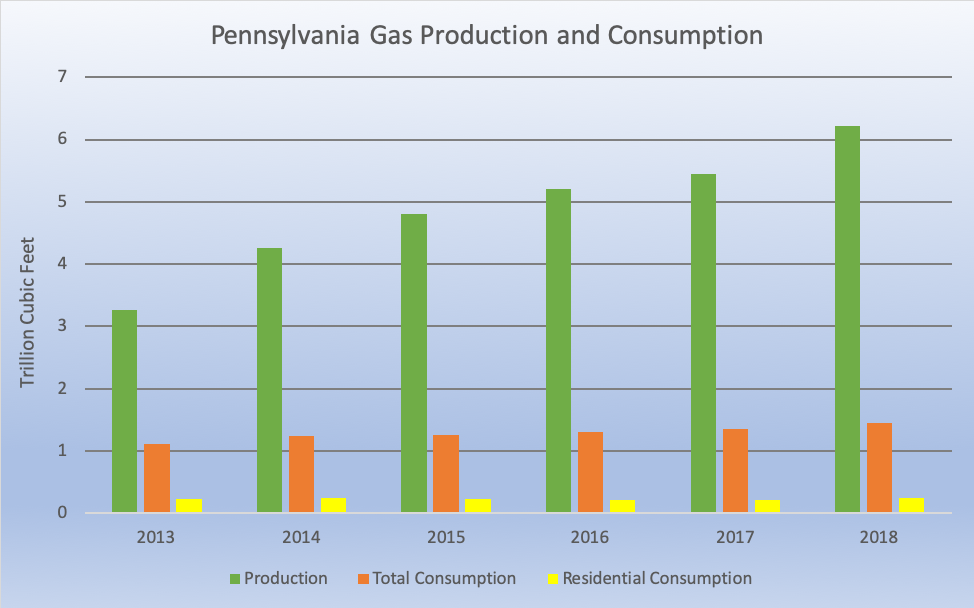
Figure 1. Fracked gas production compared to all fracked gas consumption and residential gas consumption in Pennsylvania from 2013 through 2018. Data from ref. Energy Information Administration.
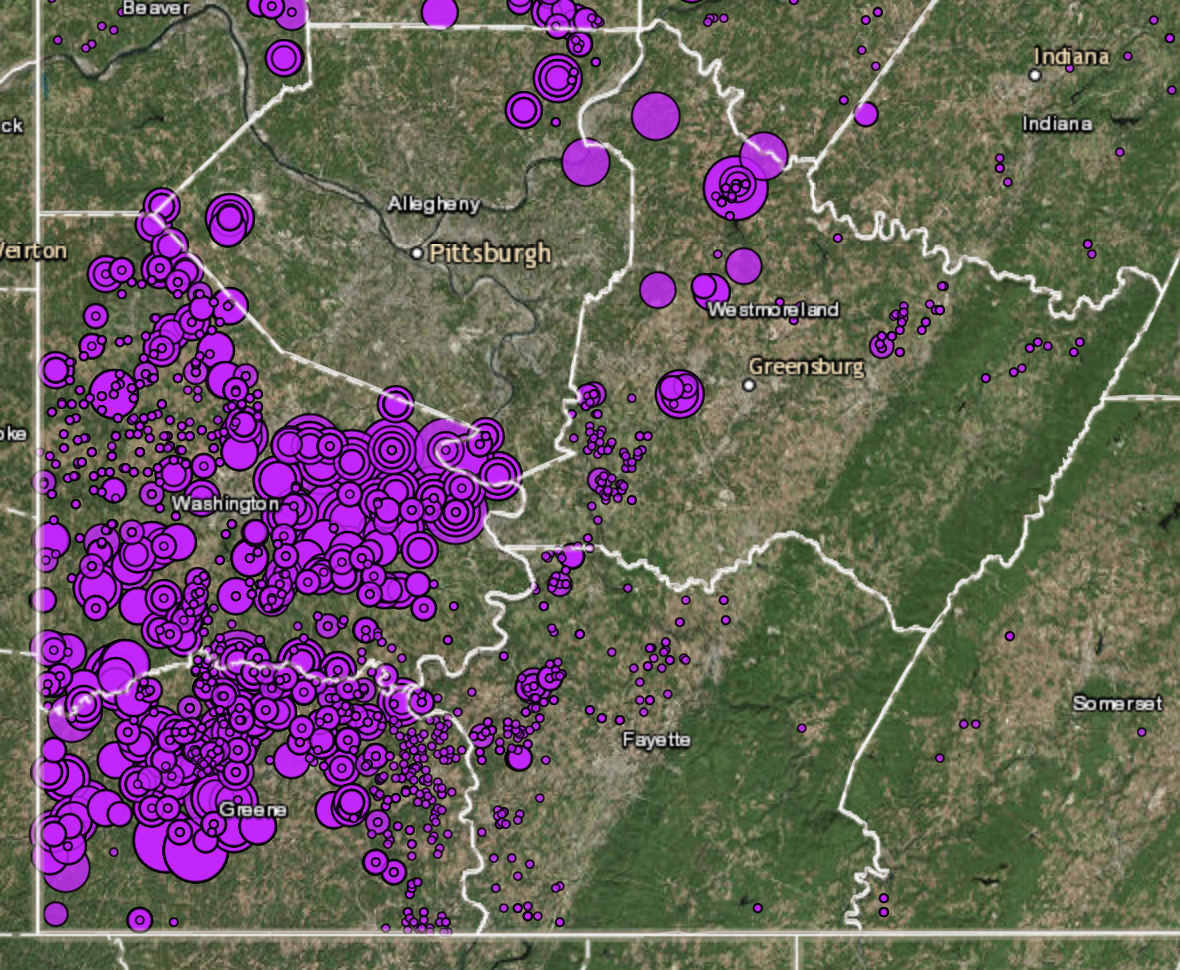
While gas production has expansive hotspots in the northeastern and southwestern portions of the state, the liquid production comes from a much more limited geography. Eighty percent of all condensate production came from Washington County, while 87% of all fracked oil came from wells in Mercer County.
Because the definition of condensate has been somewhat controversial in the past (while the oil export ban was still in effect), I asked the Department of Environmental Protection (DEP) for the definition, and was told that if hydrocarbons come out of the well as a liquid, they should be reported as oil. If they are gaseous but condense to a liquid at standard temperature and pressure (60 degrees Fahrenheit and pressure 14.7 PSIA) on-site, then it is to be reported as condensate. Any NGLs that remain gaseous but are removed from the gas supply further downstream are reported as gas in this report. For this reason, it is not really possible to use the production report to find specific amounts of NGLs produced in the state, but it certainly exceeds condensate production by an appreciable margin.
The volume of gas withdrawn from fracked wells in Pennsylvania in just one year is equal to the volume of 3.2 Mount Everests!
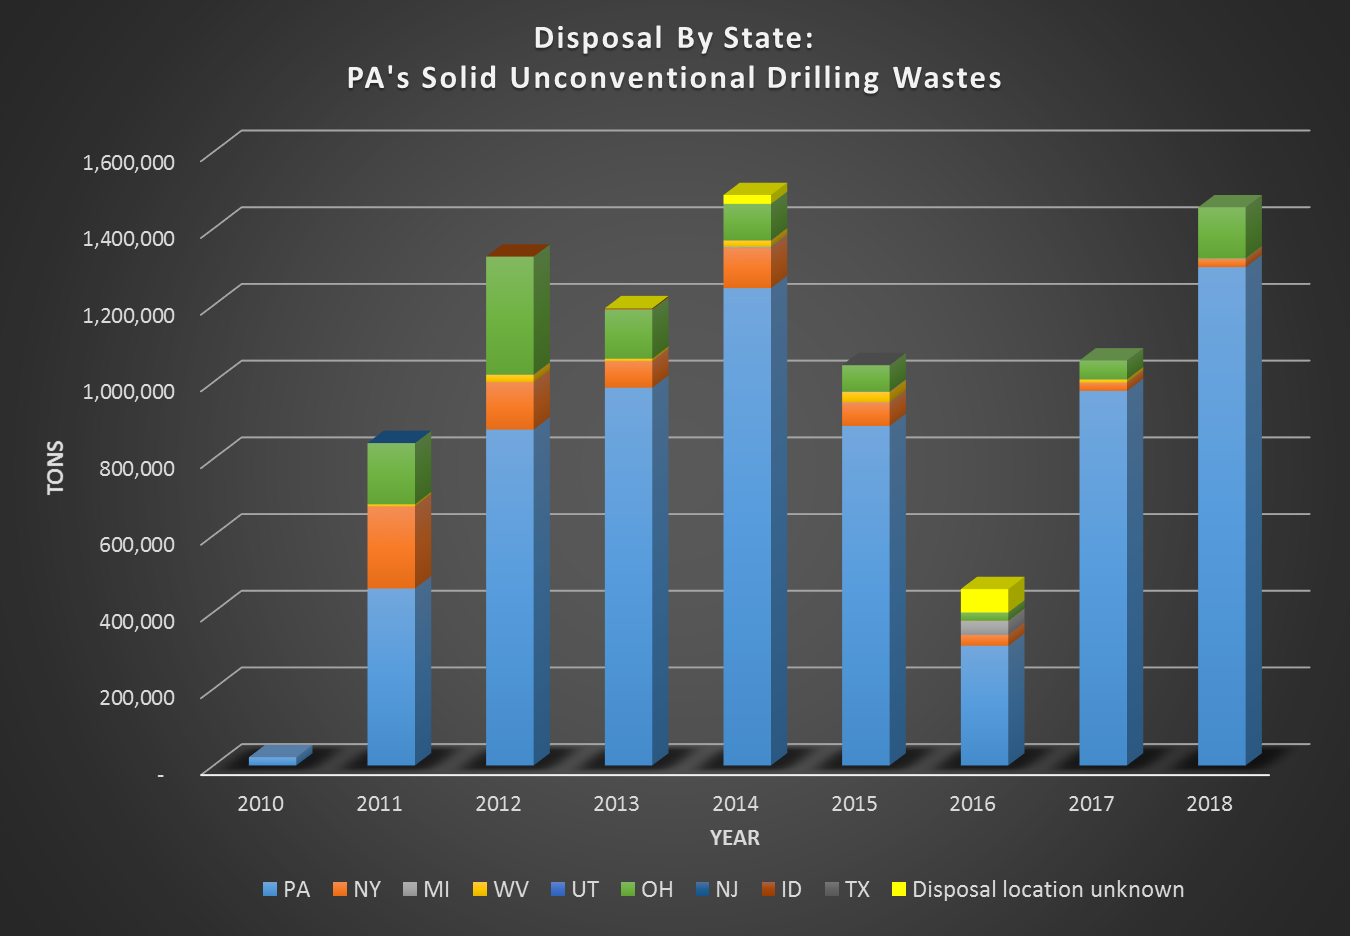
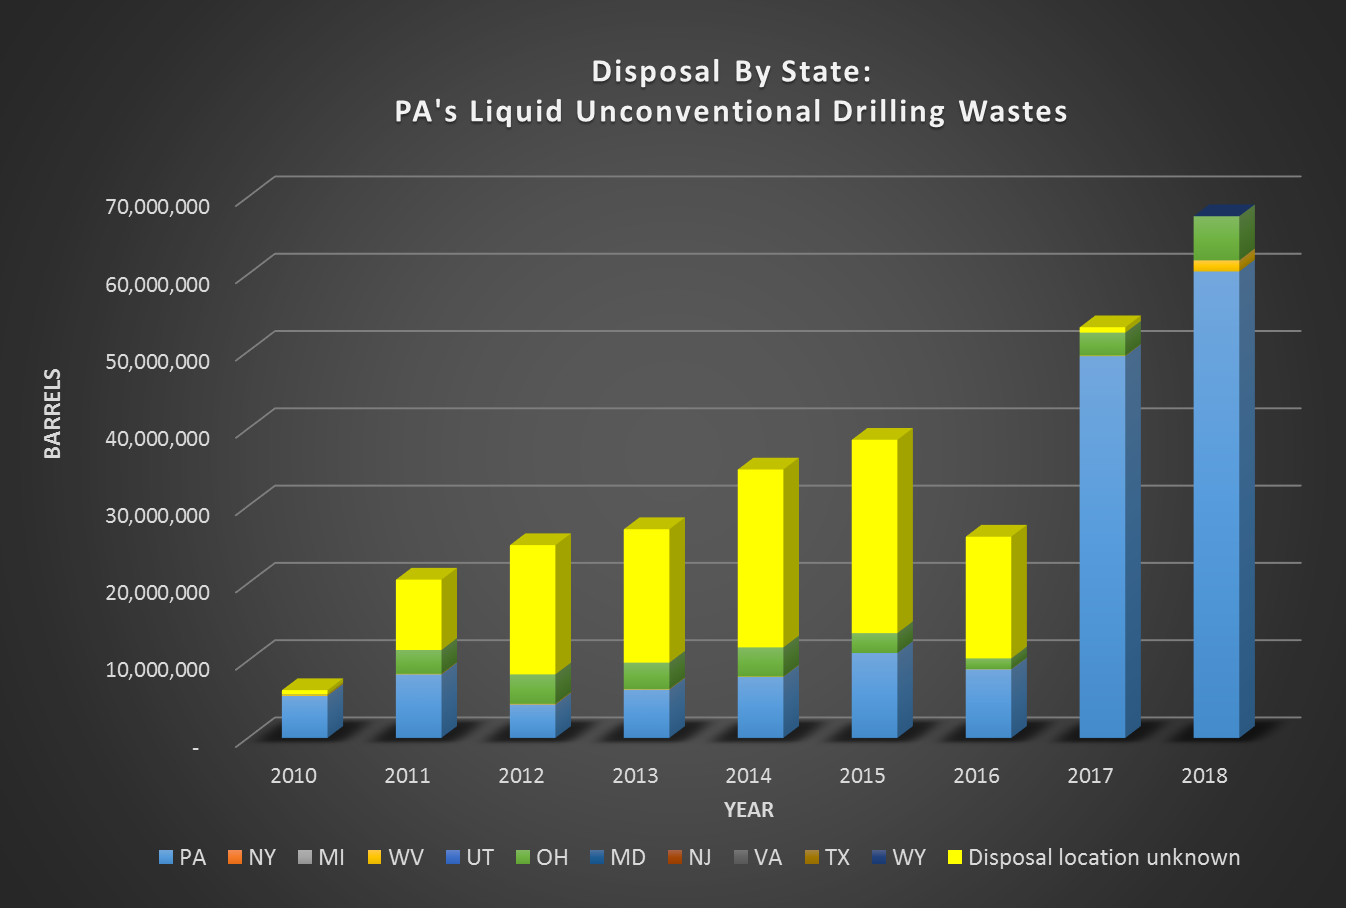
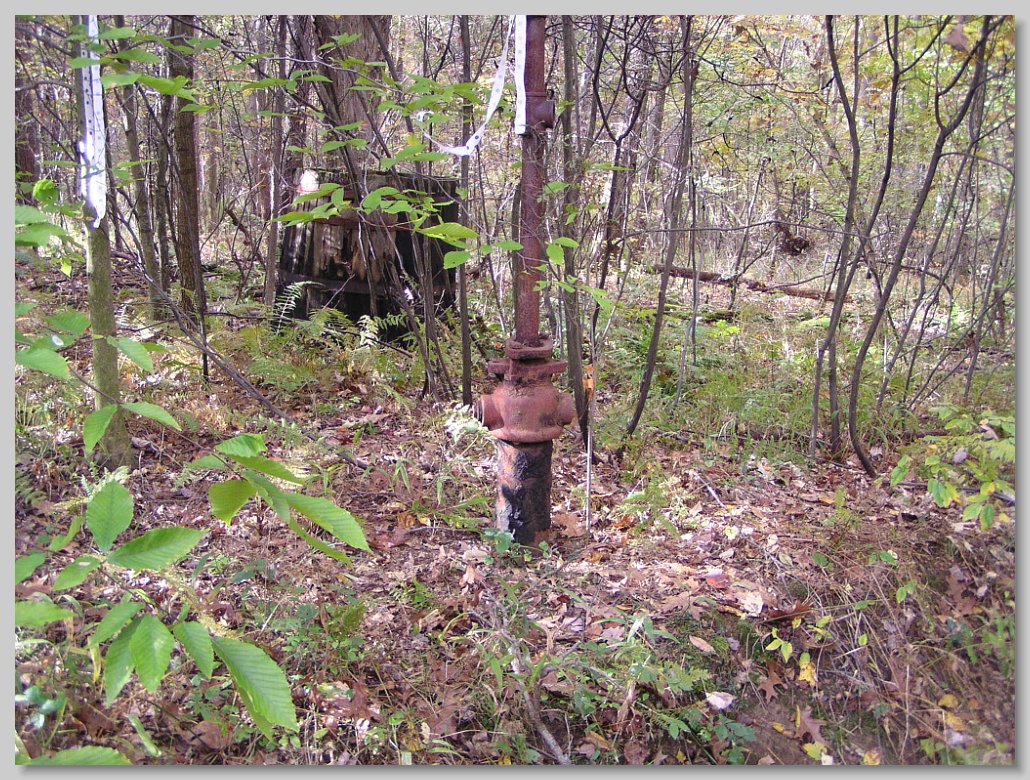
Waste
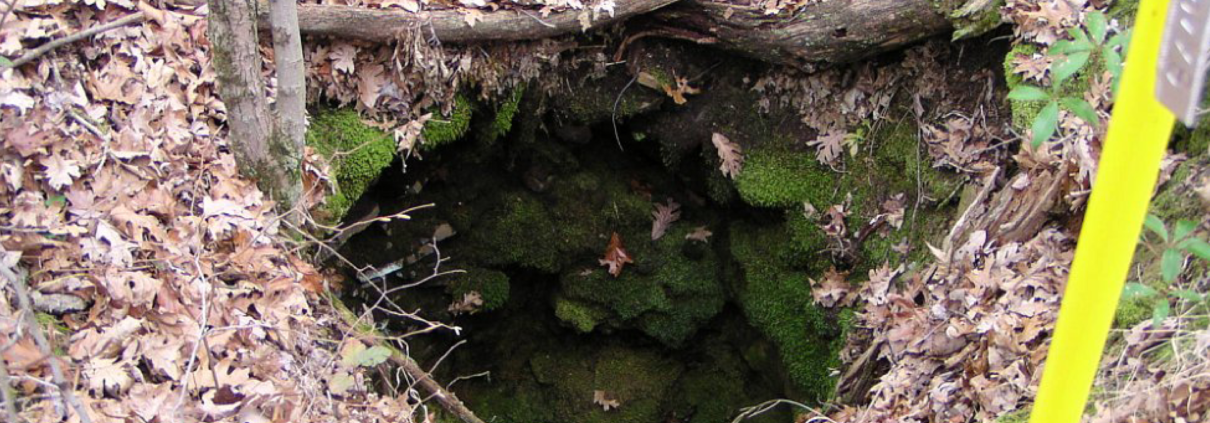
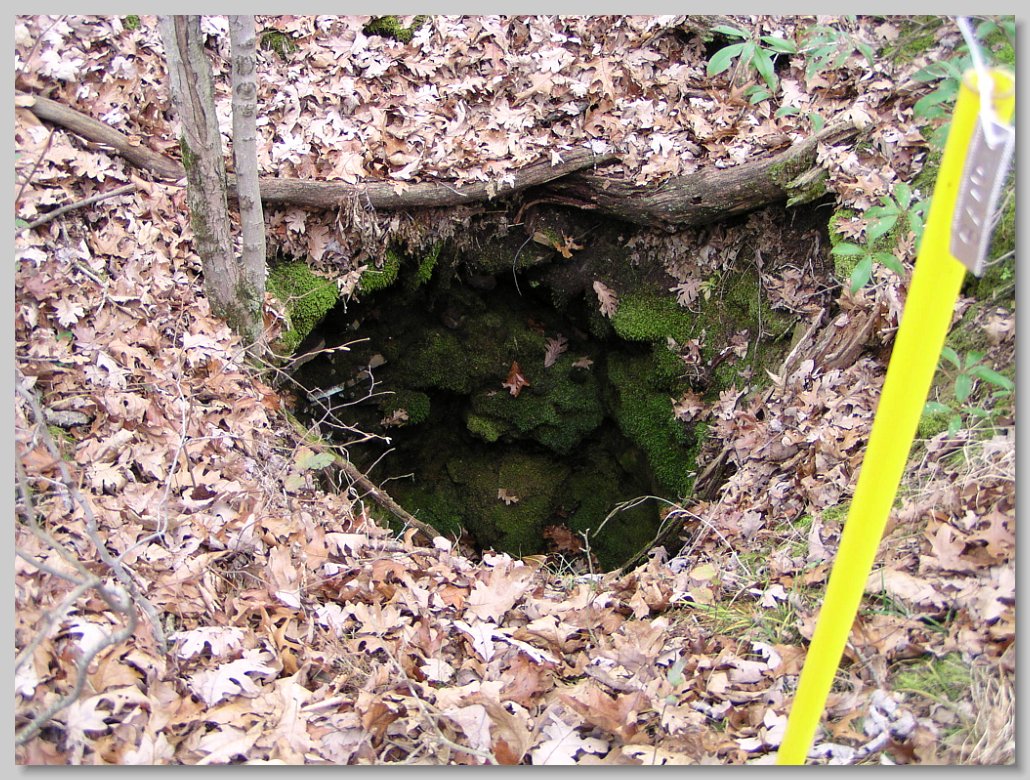
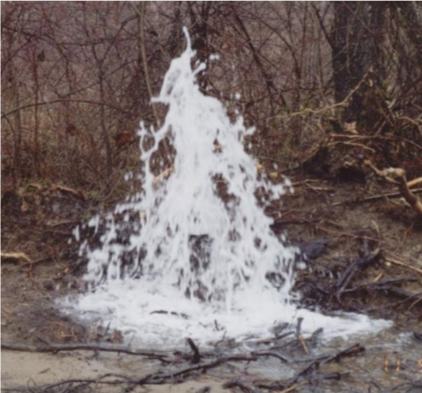
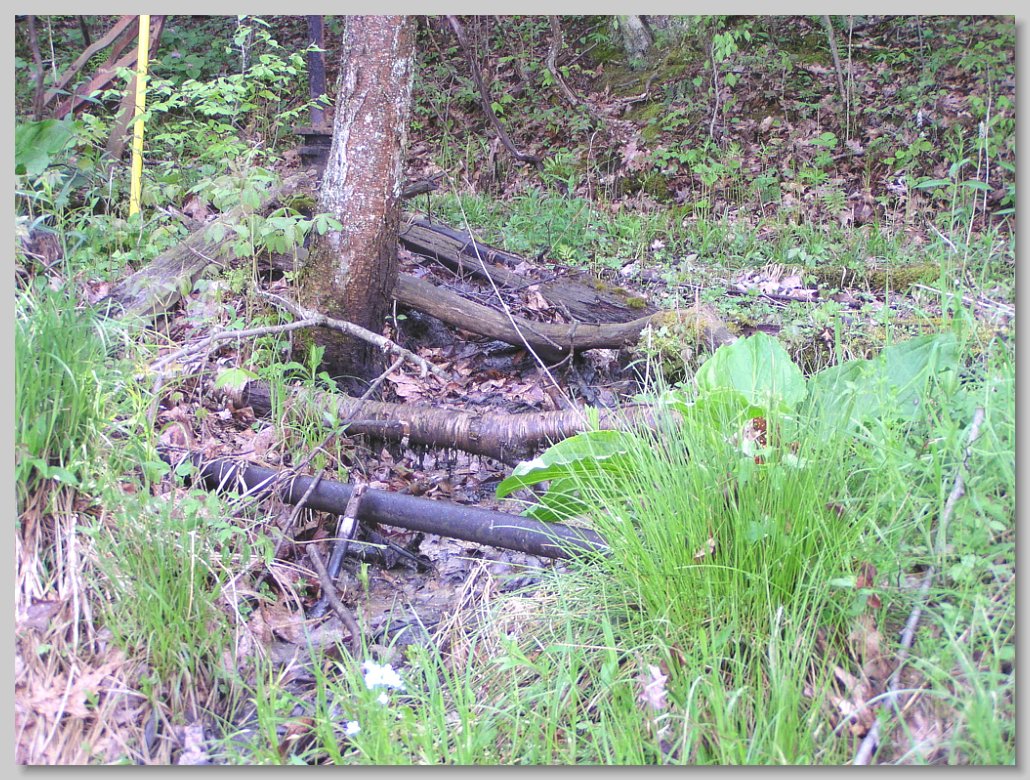
Hydrocarbons aren’t the only thing that come out of the ground when operators drill and frack wells in Pennsylvania. Drillers also report a staggering amount of waste products, including more than 65 million barrels (2.7 billion gallons) of liquid waste and 1.2 million tons of solid waste in the 12-month period.
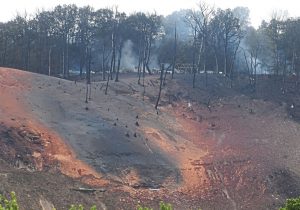
Waste facilities have significant issues such as inducing earthquakes, toxic leachate, and radioactive sediments in streambeds.
| Waste Type | Liquid Waste (Barrels) | Solid Waste (Tons) |
| Basic Sediment | 63 | |
| Brine Co-Product | 247 | |
| Drill Cuttings | 1,094,208 | |
| Drilling Fluid Waste | 1,439,338 | 11,378 |
| Filter Socks | 143 | |
| Other Oil & Gas Wastes | 2,236,750 | 6,387 |
| Produced Fluid | 61,376,465 | 41,165 |
| Servicing Fluid | 17,196 | 3,250 |
| Soil Contaminated by Oil & Gas Related Spills | 25,505 | |
| Spent Lubricant Waste | 1,104 | |
| Synthetic Liner Materials | 21,051 | |
| Unused Fracturing Fluid Waste | 7,077 | 1,593 |
| Waste Water Treatment Sludge | 35,151 | |
| Grand Total | 65,078,240 | 1,239,831 |
Figure 2. Oil and gas waste generated by fracked wells as reported by drillers from November 1, 2018 through October 31, 2019. Data from ref: PA DEP.
Some of the waste is probably best described as sludge, and several of the categories allow for reporting in barrels or tons. Almost all of the waste was in the well bore at one time or another, although there are some site-related materials that need to be disposed of, including filter socks which separate liquid and solid waste, soils contaminated by spills, spent lubricant, liners, and unused frack fluid waste.
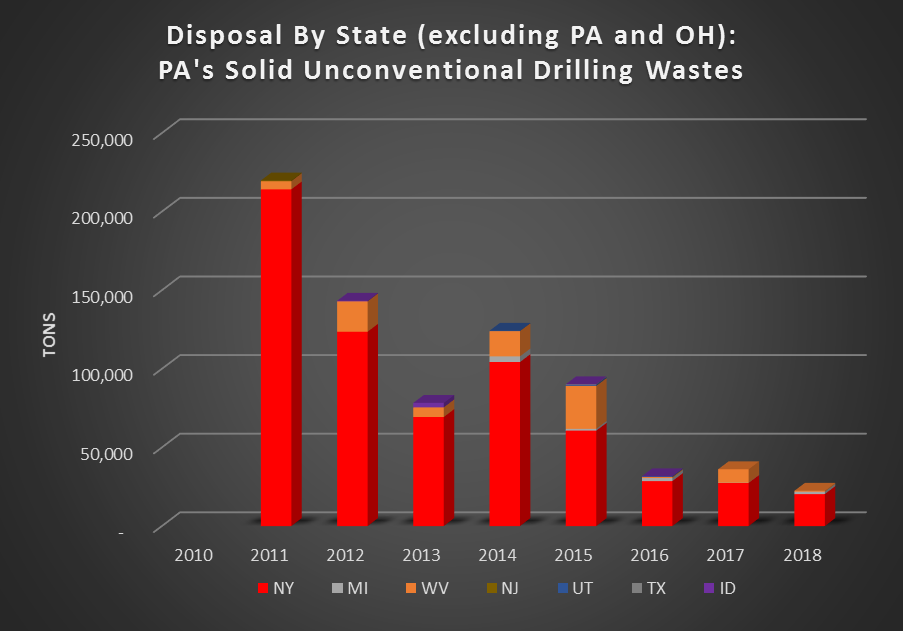
Where does all of this waste go? We worked with Earthworks earlier this year to take a deep dive into the data, focusing on these facilities that receive waste from Pennsylvania’s oil and gas wells. While the majority of the waste is dealt with in-state, a significant quantity crosses state lines to landfills and injection wells in neighboring states, and sometimes as far away as Idaho.
Please see the report, Pennsylvania Oil & Gas Waste for more details.
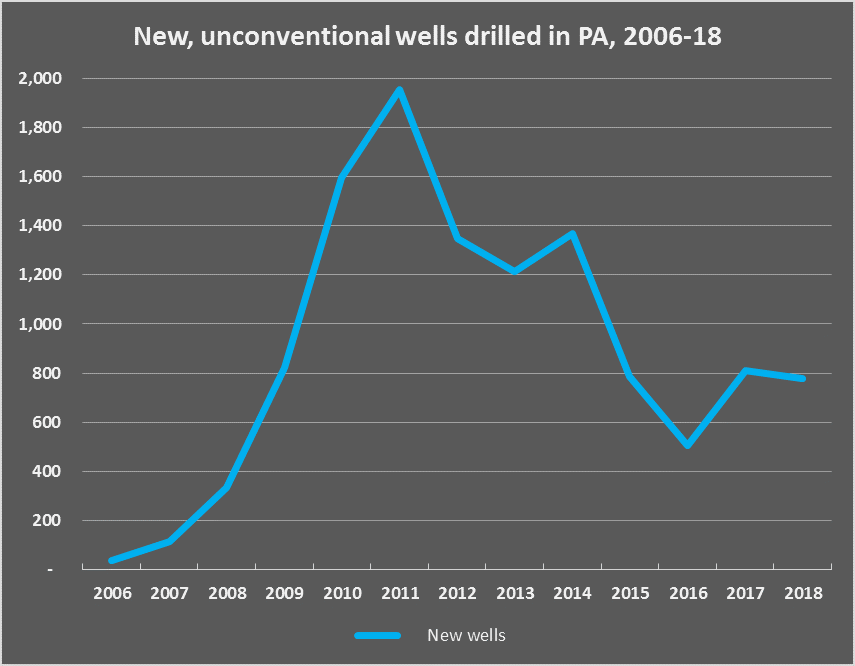
Drilled Wells
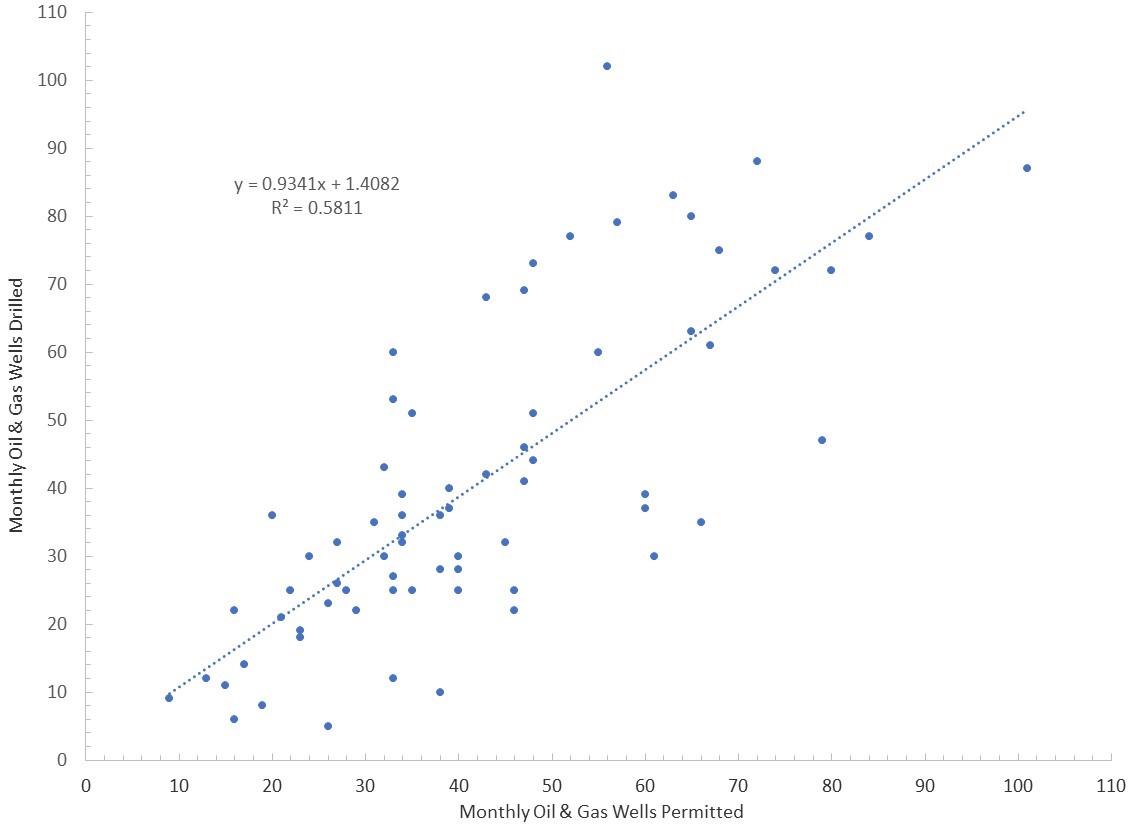
Oil and gas operators have started the drilling process for 616 fracking wells in 2019, which appear on the Pennsylvania DEP spud report. This is less than one third of the 2011 peak of 1,956 fracked wells, and 2019 is the fifth consecutive year with fewer than 1,000 wells drilled. This has the effect of making industry projections relying on 1,500 or more drilled wells per year seem rather dubious.
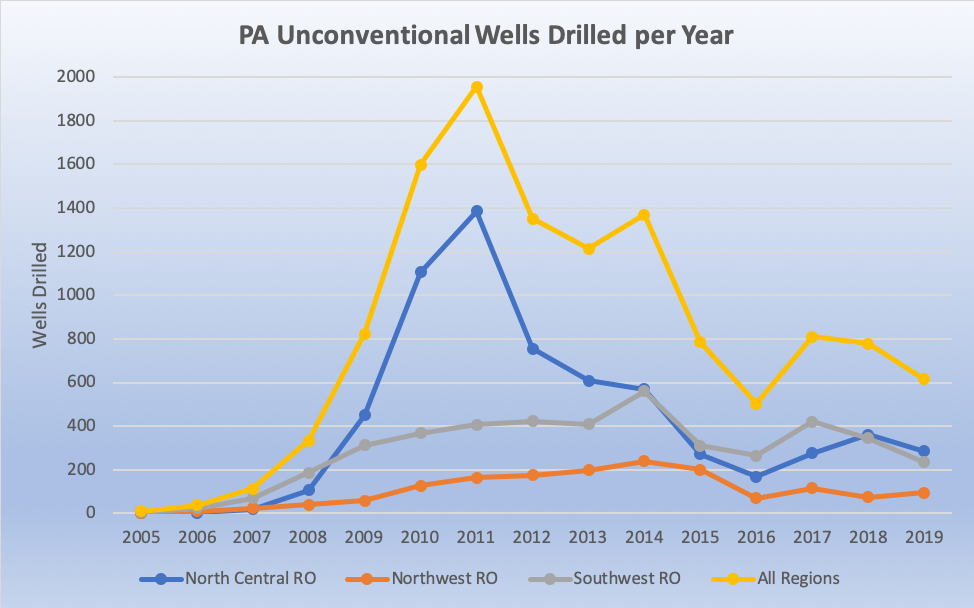
Figure 3. Unconventional (fracked) wells drilled from 2005 through December 23, 2019, showing totals by regional office. Data from ref: PA DEP.
Oil and gas wells in Pennsylvania fall under the jurisdiction of three different regional offices. By looking at Figure 2, it becomes apparent that the North Central Regional Office (blue line) was a huge driver of the 2009 to 2014 drilling boom, before falling back to a similar drilling rate of the Southwest Regional Office.
The slowdown in drilling for gas in recent years is related to the lack of demand for the product. In turn, this drives prices down, a phenomenon that industry refers to as a “price glut.” The situation it is forcing major players in the regions such as Range Resources to reduce their holdings in Appalachia, and some, such as Chevron, are pulling out entirely.
Violations
Disturbingly, 2019 was the fifth straight year that the number of violations issued by DEP will exceed the total number of wells drilled.
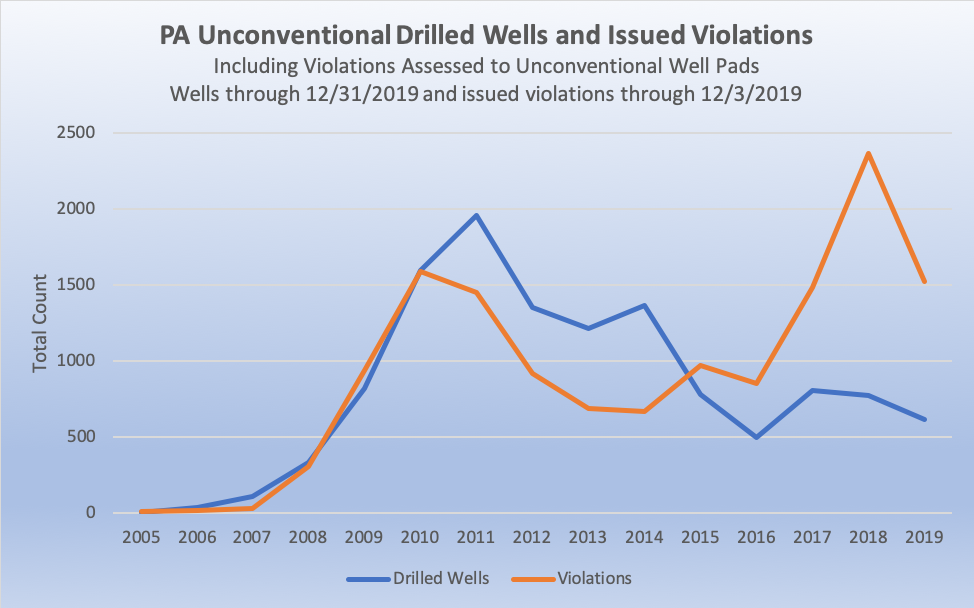
Figure 4. Unconventional (fracked) drilled wells and issued violations from 2005 through December 2019. Data from ref: DEP.
Violations related to unconventional drilling are a bit unwieldy to summarize. The 13,833 incidents reported in Pennsylvania fall into 359 different categories, representing the specific regulations in which the drilling operator fell short of expectations. The industry likes to dismiss many of these as being administrative matters, and indeed, the DEP does categorize the violations as either “Administrative” or “Environmental, Health & Safety”. However, 9,998 (72%) of the violations through December 3, 2019, are in the latter category, and even some of the ones that are categorized as administrative seem like they ought to be in environmental, health, and safety. For example, let’s look at the 15 most frequent infractions:
| Violation Code | Incidents | Category |
| SWMA301 – Failure to properly store, transport, process or dispose of a residual waste. | 767 | Environmental Health & Safety |
| CSL 402(b) – POTENTIAL POLLUTION – Conducting an activity regulated by a permit issued pursuant to Section 402 of The Clean Streams Law to prevent the potential of pollution to waters of the Commonwealth without a permit or contrary to a permit issued under that authority by the Department. | 613 | Environmental Health & Safety |
| 102.4 – Failure to minimize accelerated erosion, implement E&S plan, maintain E&S controls. Failure to stabilize site until total site restoration under OGA Sec 206(c)(d) | 595 | Environmental Health & Safety |
| SWMA 301 – MANAGEMENT OF RESIDUAL WASTE – Person operated a residual waste processing or disposal facility without obtaining a permit for such facility from DEP. Person stored, transported, processed, or disposed of residual waste inconsistent with or unauthorized by the rules and regulations of DEP. | 540 | Environmental Health & Safety |
| 601.101 – O&G Act 223-General. Used only when a specific O&G Act code cannot be used | 469 | Administrative |
| 402CSL – Failure to adopt pollution prevention measures required or prescribed by DEP by handling materials that create a danger of pollution. | 362 | Environmental Health & Safety |
| 78.54* – Failure to properly control or dispose of industrial or residual waste to prevent pollution of the waters of the Commonwealth. | 339 | Environmental Health & Safety |
| 401 CSL – Discharge of pollutional material to waters of Commonwealth. | 299 | Environmental Health & Safety |
| 102.4(b)1 – EROSION AND SEDIMENT CONTROL REQUIREMENTS – Person conducting earth disturbance activity failed to implement and maintain E & S BMPs to minimize the potential for accelerated erosion and sedimentation. | 285 | Environmental Health & Safety |
| 102.5(m)4 – PERMIT REQUIREMENTS – GENERAL PERMITS – Person failed to comply with the terms and conditions of the E & S Control General Permit. | 283 | Environmental Health & Safety |
| 78.56(1) – Pit and tanks not constructed with sufficient capacity to contain pollutional substances. | 256 | Administrative |
| 78a53 – EROSION AND SEDIMENT CONTROL AND STORMWATER MANAGEMENT – Person proposing or conducting earth disturbance activities associated with oil and gas operations failed to comply with 25 Pa. Code § 102. | 247 | Environmental Health & Safety |
| 102.11(a)1 – GENERAL REQUIREMENTS – BMP AND DESIGN STANDARDS – Person failed to design, implement and maintain E & S BMPs to minimize the potential for accelerated erosion and sedimentation to protect, maintain, reclaim and restore water quality and existing and designated uses. | 235 | Environmental Health & Safety |
| CSL 401 – PROHIBITION AGAINST OTHER POLLUTIONS – Discharged substance of any kind or character resulting in pollution of Waters of the Commonwealth. | 235 | Environmental Health & Safety |
| OGA3216(C) – WELL SITE RESTORATIONS – PITS, DRILLING SUPPLIES AND EQUIPMENT – Failure to fill all pits used to contain produced fluids or industrial wastes and remove unnecessary drilling supplies/equipment not needed for production within 9 months from completion of drilling of well. | 206 | Environmental Health & Safety |
Figure 5. Top 15 most frequently cited violations for unconventional drilling operations in Pennsylvania through December 3, 2019. Data from ref: DEP.
Of the 15 most common categories, only two are considered administrative violations. One of these is a general code, where we don’t know what happened to warrant the infraction without reading the written narrative that accompanies the data, and is therefore impossible to categorize. The only other administrative violation in the top 15 categories reads, “78.56(1) – Pit and tanks not constructed with sufficient capacity to contain pollutional substances,” which certainly sounds like it would have some real-world implications beyond administrative concerns.
Check out our Pennsylvania Shale Viewer map to see if there are violations at wells near you.
Bloated With Gas, Fraught With Trouble
To address the excess supply of gas, companies have tried to export the gas and liquids to other markets through pipelines. Those efforts have been fraught with trouble as well. Residents are reluctant to put up with an endless barrage of new pipelines, yielding their land and putting their safety at risk for an industry that can’t seem to move the product safely. The Revolution pipeline explosion hasn’t helped that perception, nor have all of the sinkholes and hundreds of leaky “inadvertent returns” along the path of the Mariner East pipeline system. In a sense, the industry’s best case scenario is to call these failures incompetence, because otherwise they would be forced to admit that the 2.5 million miles of hydrocarbon pipelines in the United States are inherently risky, prone to failure any time and any place.
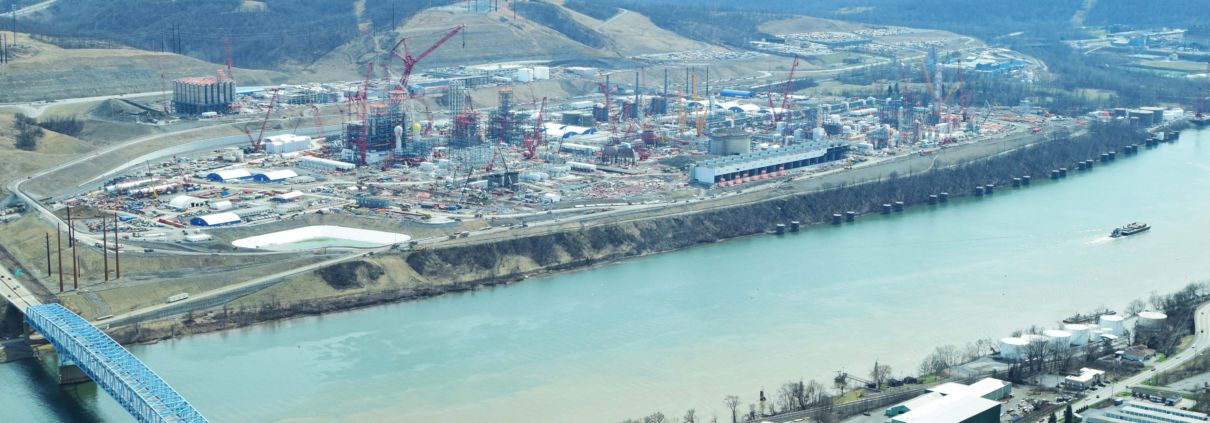
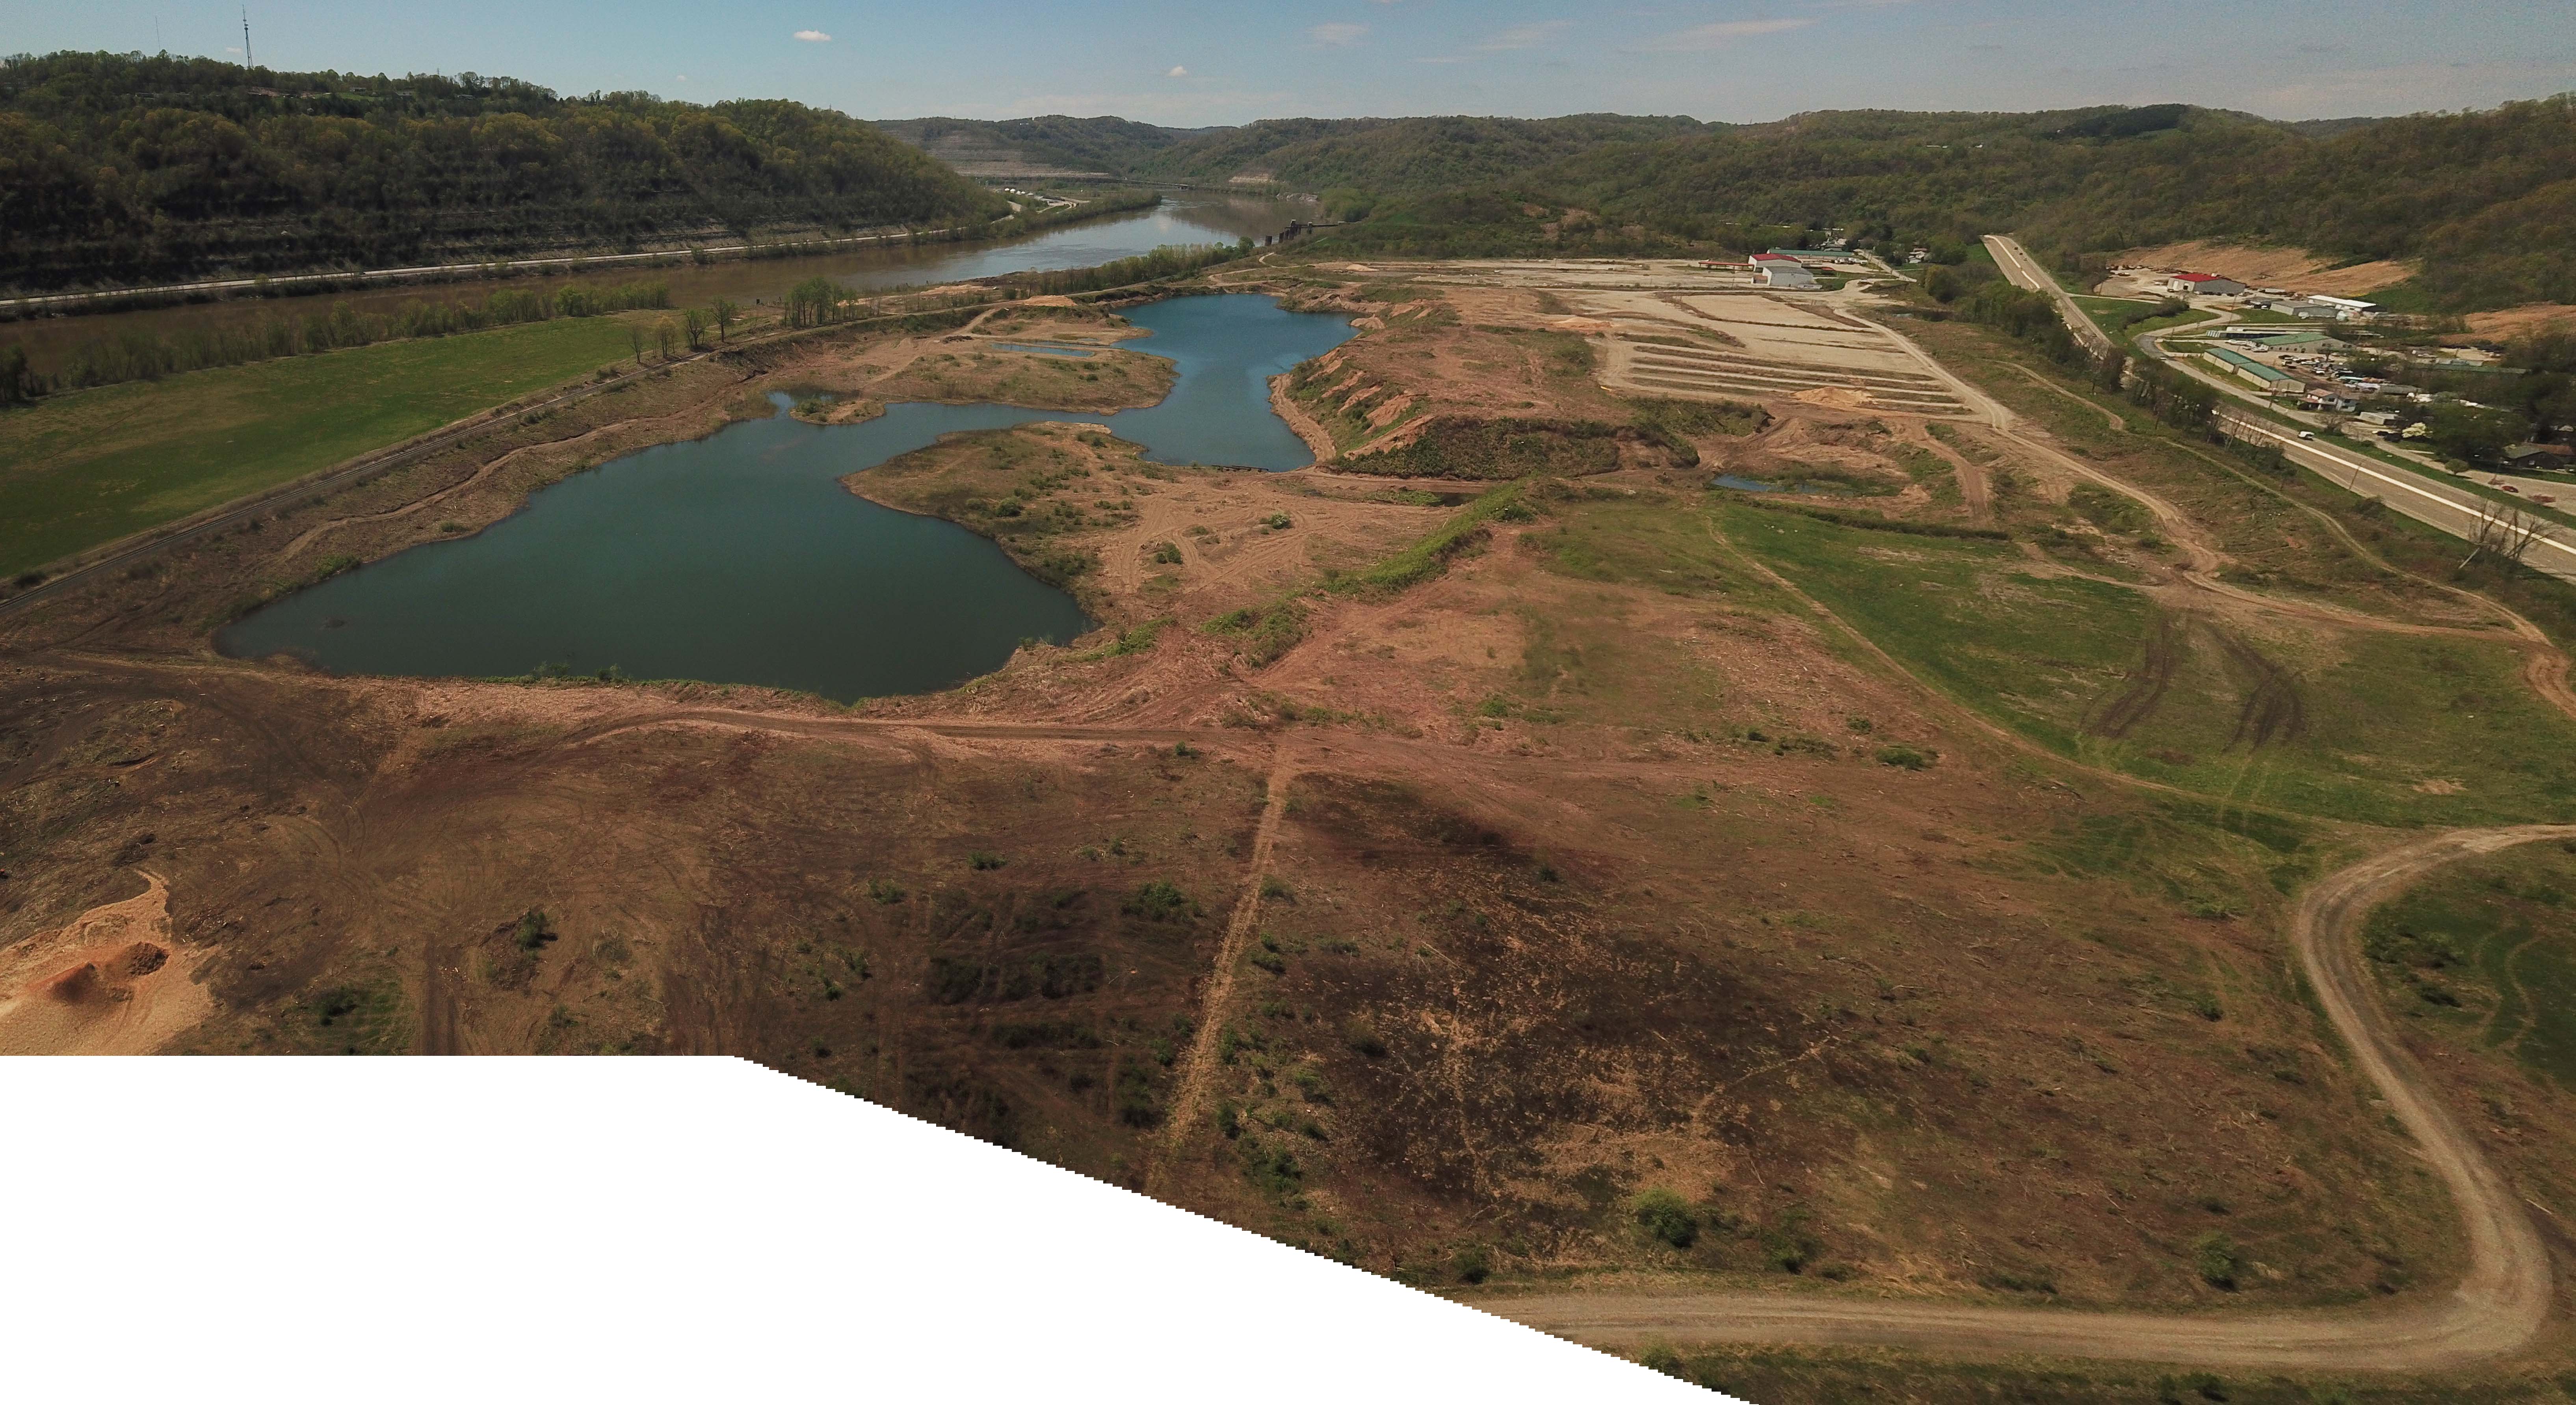
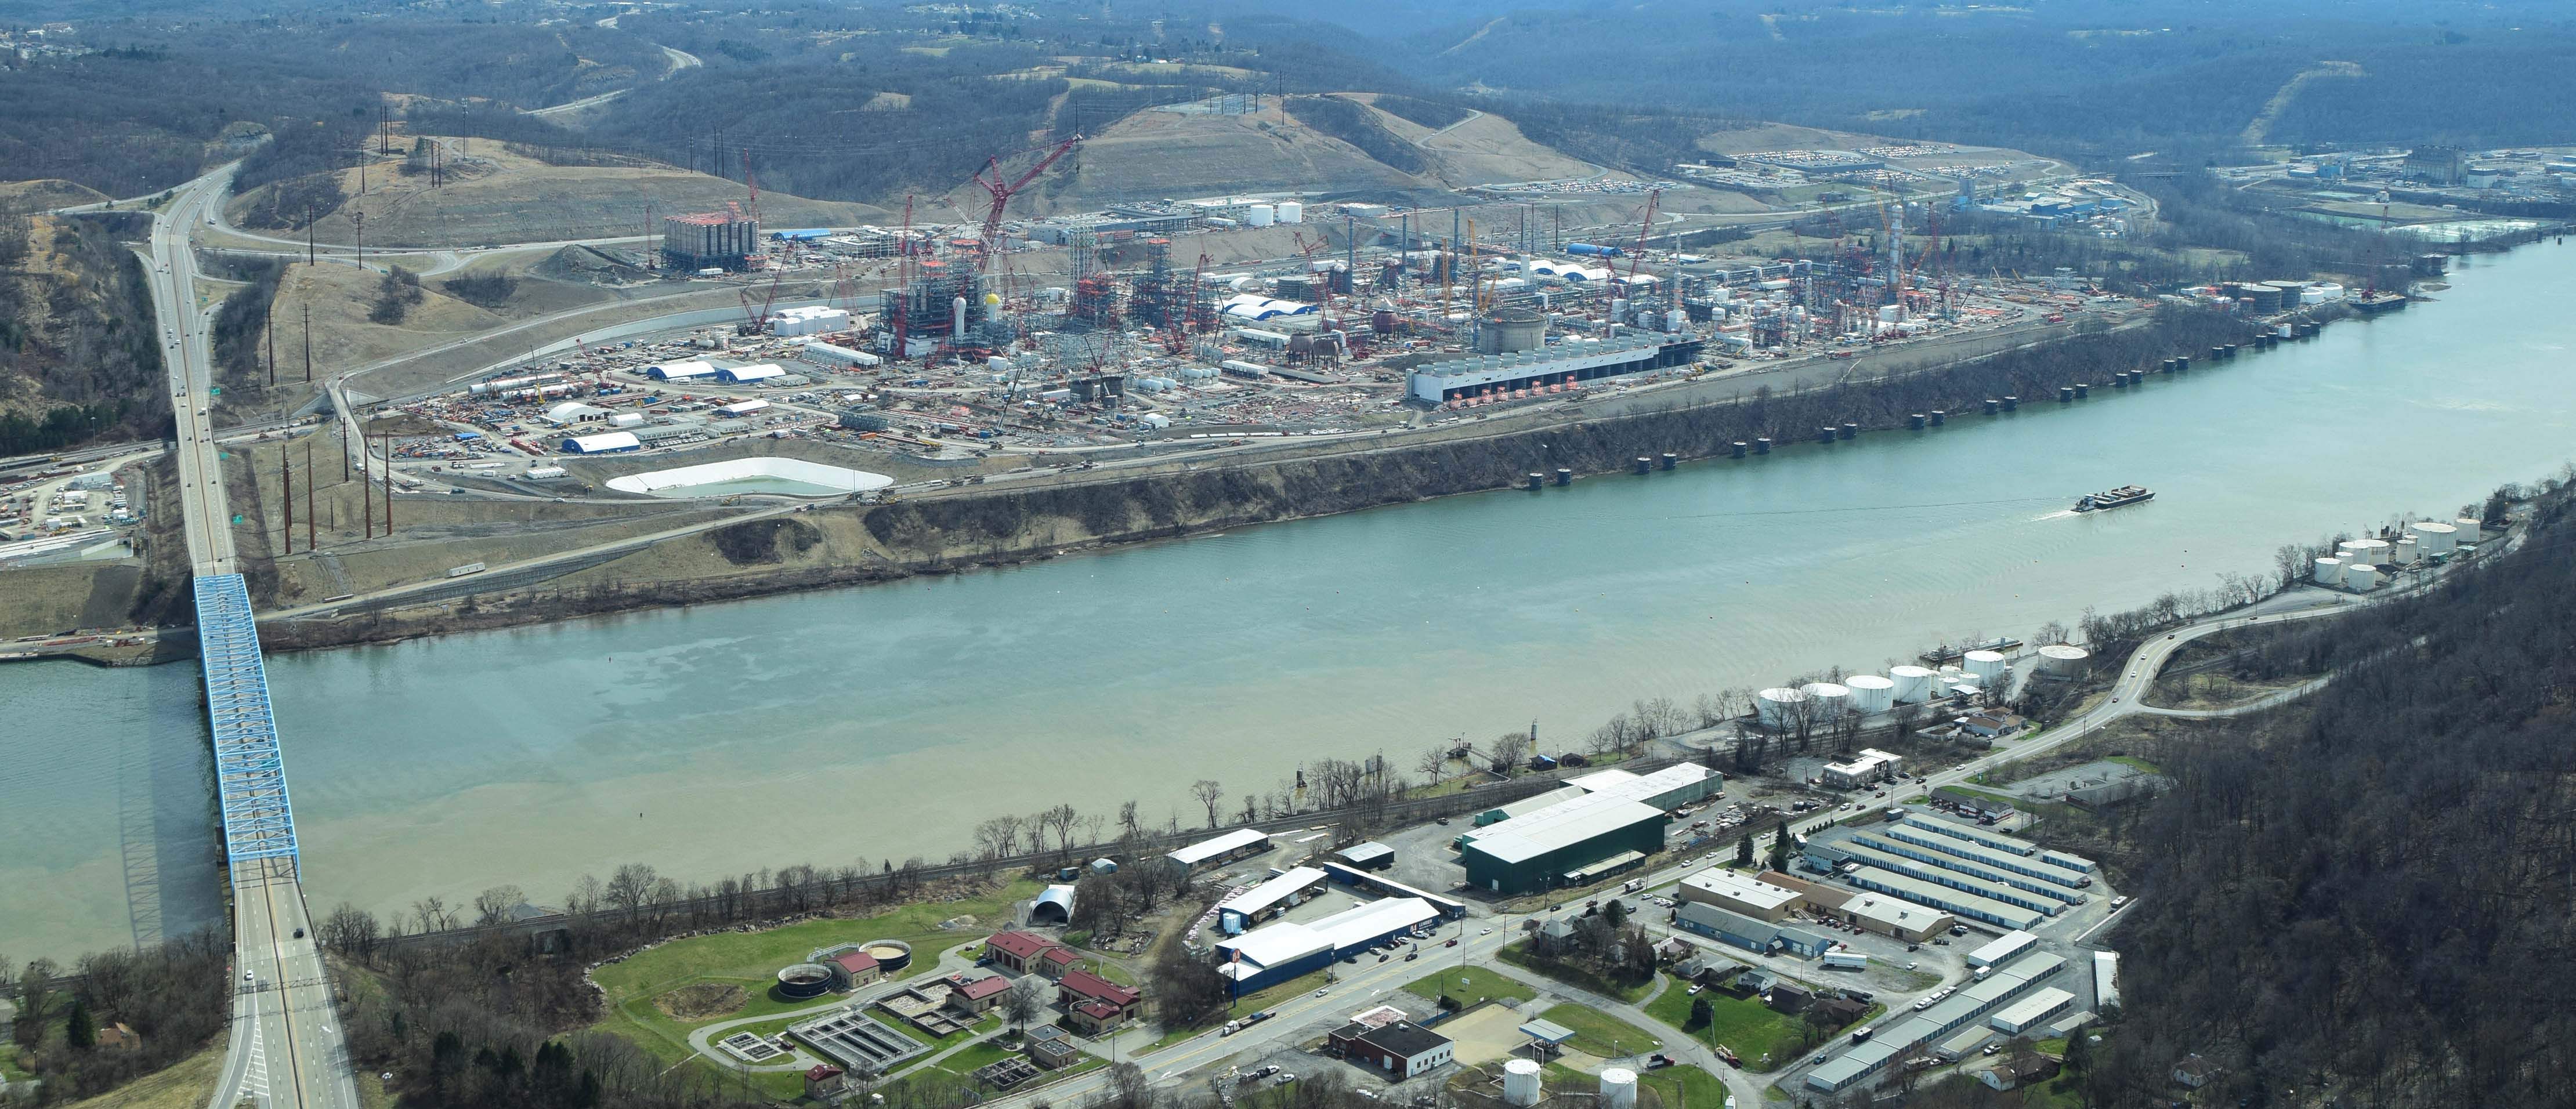
In addition to increasing the transportation and export of natural gas to new markets, private companies and elected officials are collaborating to attract foreign investors to fund a massive petrochemical expansion in the Ohio River Valley. The planned petrochemical plants intend to capitalize on the cheap feedstock of natural gas.
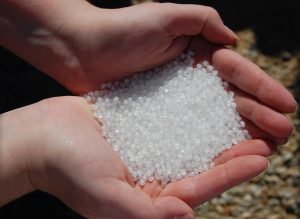
Pennsylvania’s high content of NGLs is a selling point by the industry, because they have an added value when compared to gas. While all of these hydrocarbons can burn and produce energy in a similar manner, operators are required to remove most of them to get the energy content of the gas into an acceptable range for gas transmission lines. Because of this, enormous facilities have to be built to separate these NGLs, while even larger facilities are constructed to consume it all. Shell’s Pennsylvania Petrochemicals Complex ethane cracker being built in Beaver County, PA is scheduled to make 1.6 million metric tons of polyethylene per year, mostly for plastics.
This comes at a time when communities around the country and the world are enacting new regulations to rein in plastic pollution, which our descendants are going to finding on the beach for thousands of years, even if everyone on the planet were to stop using single-use plastics today. Of course, none of these bans or taxes are currently permitted in Pennsylvania, but adding 1.6 million metric tons per year to our current supply is unnecessary, and indeed, it is only the beginning for the region. A similar facility, known as the PTT Global Chemical cracker appears to be moving forward in Eastern Ohio, and ExxonMobil appears to be thinking about building one in the region as well. Industry analysts think the region produces enough NGLs to support five of these ethane crackers.
Despite all of these problems, the oil and gas industry still plans to fill the Ohio River Valley with new petrochemical plants, gas processing plants, and storage facilities in the hopes that someday, somebody may want what they’ve taken from the ground.
Here’s hoping that 2020 is a safer and healthier year than 2019 was. But there is no need to leave it up to chance. Together, we have the power to change things, if we all demand that our voices are heard. As a start, consider contacting your elected officials to let them know that renewing Pennsylvania’s blocking of municipal bans and taxes on plastic bags is unacceptable.
By Matt Kelso, Manager of Data & Technology, FracTracker Alliance