Pennsylvania Conventional Well Map Update
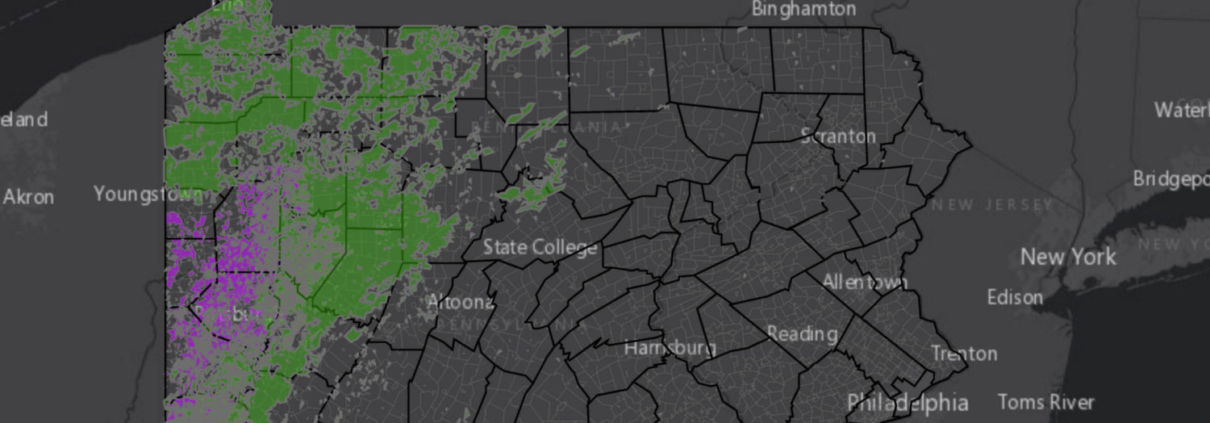
There are over 100,000 active conventional wells in PA, with more permitted each year. Most are unplugged, posing serious threats to the climate.
There are over 100,000 active conventional wells in PA, with more permitted each year. Most are unplugged, posing serious threats to the climate.
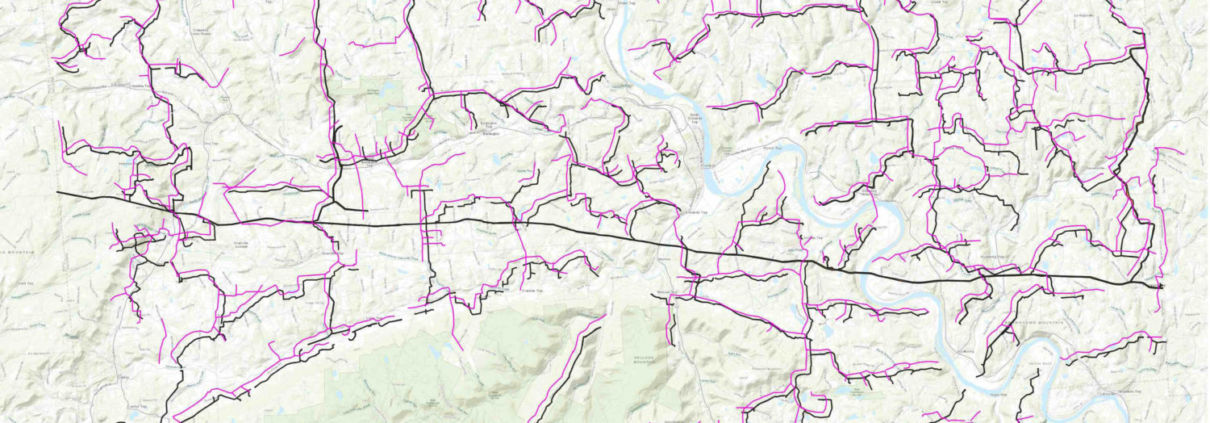
FracTracker mapped gathering lines in Bradford County, PA. Public data on gathering lines are incomplete, leaving us to fill in the gaps.

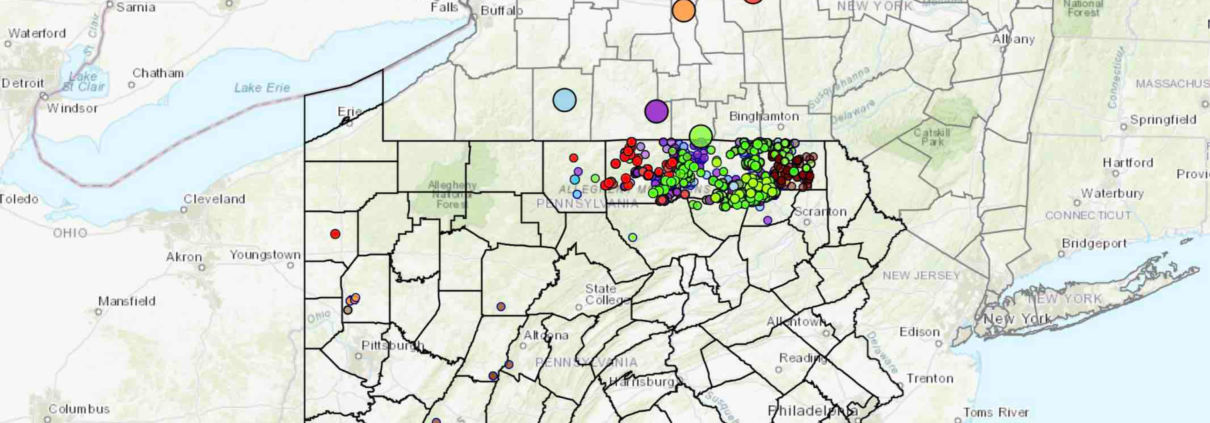
Information on which bird species in northeastern Pennsylvania are affected by the fracking industry’s expansion.
Over the past decade, New York State has seen a steep decline in the quantity of waste products from the fracking industry sent to its landfills for disposal. Explore FracTracker’s 2020 updated data.
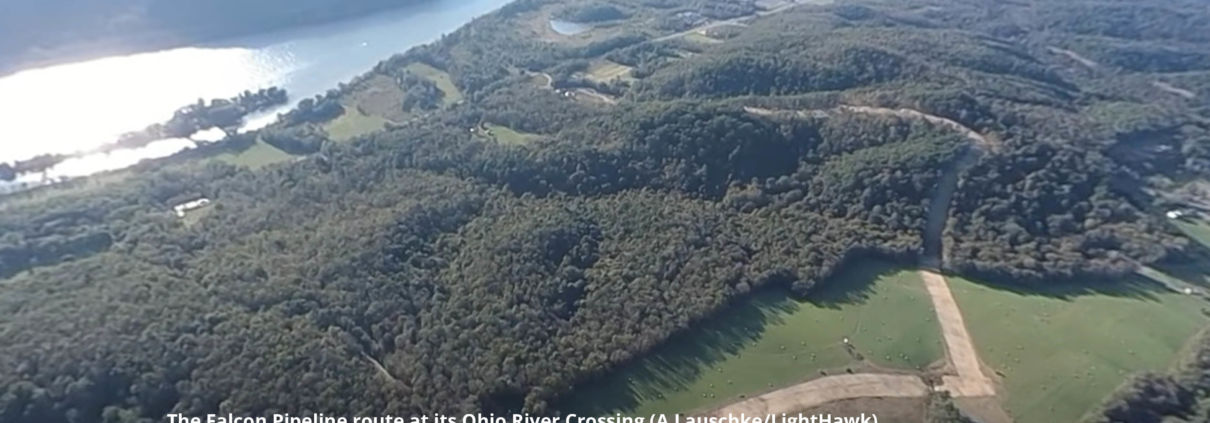
The Falcon Ethane Pipeline System is at the center of major investigations into possible noncompliance with construction and public safety requirements and failing to report drilling mud spills, according to documents obtained from the Pennsylvania Department of Environmental Protection (PA DEP) by FracTracker Alliance. These investigations, which are yet to be released, also uncovered instances of alleged data falsification in construction reports and Shell Pipeline Company firing employees in retaliation for speaking up about these issues.
3/17/21 Press release: https://www.fractracker.org/falcon-investigation-press-release-fractraccker-alliance/
Shell’s attempts to cut corners while constructing this 98-mile pipeline, likely motivated by the increasingly bleak economic prospects of this project, present serious public safety concerns for the thousands of residents along its route in Pennsylvania, West Virginia, and Ohio.
These allegations are serious enough to warrant immediate action. We’re calling on the Pipeline and Hazardous Materials Safety Administration (PHMSA) to thoroughly examine these allegations and suspend construction if not yet completed, or, in the case that construction is complete, operation of the Falcon Pipeline. Furthermore, we call on state environmental regulators to fully investigate construction incidents throughout the entire pipeline route, require Shell Pipeline to complete any necessary remediation, including funding independent drinking water testing, and take enforcement action to hold Shell accountable. Read our letters to these agencies here.
These investigations were featured in a March 17th article by Anya Litvak in the Pittsburgh Post-Gazette.
3/18/21 update:
Additional coverage of this story was published in a Times Online article by Daveen Ray Kurutz, a StateImpact Pennsylvania article by Reid Frazier, and an Observer-Reporter article by Rick Shrum.
According to documents obtained through a public records request, a whistleblower contacted PHMSA in 2019 with serious concerns about the Falcon, including that the pipeline may have been constructed with defective corrosion coating. PHMSA is a federal agency that regulates pipeline operation. The whistleblower also shared environmental threats occurring within the DEP’s jurisdiction, prompting the PA DEP and Pennsylvania Attorney General’s Office to get involved.
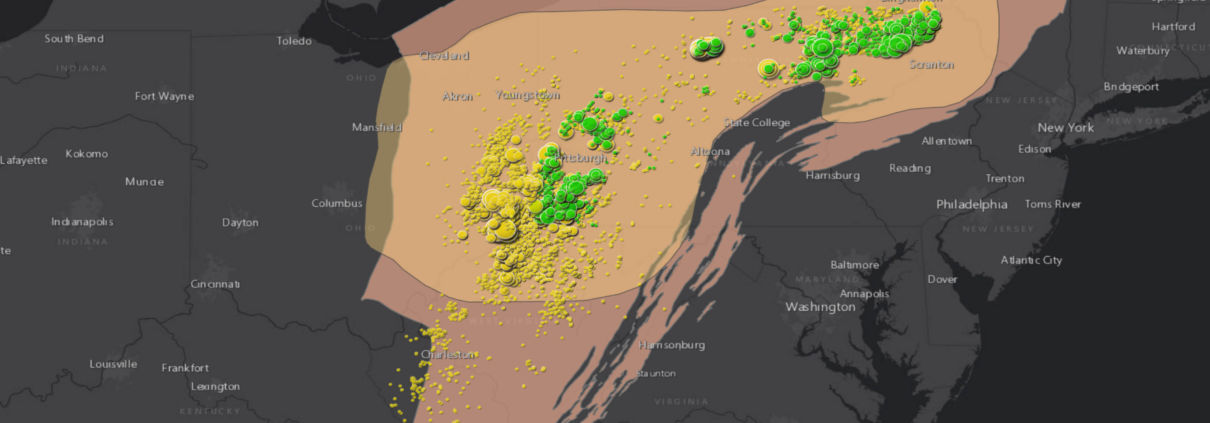
Many of the issues with the Falcon relate to a construction method used to install pipelines beneath sensitive areas like roads and rivers called horizontal directional drilling (HDD). Shell Pipeline contracted Ellingson Trenchless LLC to complete over 20 HDDs along the Falcon, including crossings beneath drinking water sources such as the Ohio River and its tributaries. FracTracker and DeSmog Blog previously reported on major drilling mud spills Shell caused while constructing HDDs and how public agencies have failed to regulate these incidents.
This map shows the Falcon Pipeline’s HDD crossings and spills of drilling fluid spills that occurred through 3/5/2020. To see the data sources, click on the information icon found in the upper right corner of the map header as well as under the map address bar.
View Map Full Sized | Updated 6/16/20
Correspondence between the PA DEP and PHMSA from February 26, 2020 reveal the gravity of the situation. While PHMSA conducted an inquiry into the whistleblower’s complaints in 2019 and concluded there were no deficiencies, PA DEP Secretary Patrick McDonnell wrote that his agency felt it was incomplete and urged PHMSA to conduct a more thorough investigation. Secretary McDonnell noted the PA DEP “has received what appears to be credible information that sections of Shell’s Falcon Pipeline project in western PA, developed for the transportation of ethane liquid, may have been constructed with defective corrosion coating protection,” and that “corroded pipes pose a possible threat of product release, landslide, or even explosions.”
FracTracker submitted a Freedom of Information Act request with PHMSA asking for documents pertaining to this inquiry, and was directed to the agency’s publicly available enforcement action webpage. The page shows that PHMSA opened a case into the Falcon on July 16, 2020, five months after Secretary McDonnell sent the letter. PHMSA sent Shell Pipeline Company a Notice of Amendment citing several inadequacies with the Falcon’s construction, including:
Shell responded with its amended procedures on July 27, 2020, and PHMSA closed the case on August 13, 2020.
Of note, PHMSA states it is basing this Notice on an inspection conducted between April 9th and 11th, 2019, when construction on the Falcon had only recently started. PHMSA has confirmed its investigation on the Falcon is ongoing, however we question the accuracy of self reported data given to PHMSA inspectors should be questioned
The PA DEP also brought the matter to the attention of the US Environmental Protection Agency.
The Falcon pipeline also crosses through Ohio and briefly, West Virginia. While we do not know how these states are involved in these investigations, our past analyses raise concerns about the Ohio Environmental Protection Agency’s (OEPA) ability to regulate the pipeline’s HDD crossings.
One of the focuses of the Pennsylvania DEP’s investigation is the failure to report drilling fluid spills that occur while constructing a HDD crossing. The PA DEP shut down all HDD operations in November, 2019 and forced Shell to use monitors to calculate spills, as was stated in permit applications.
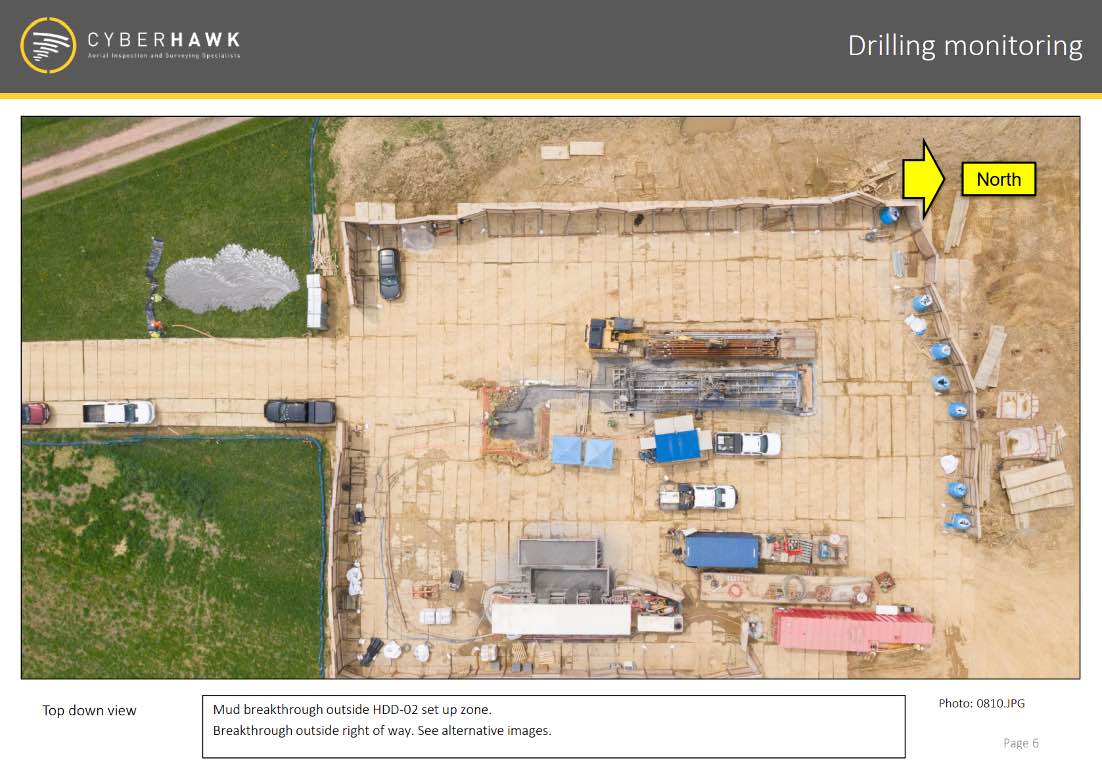
A horizontal directional drilling (HDD) construction site for the Falcon Pipeline in Southview, Washington County, Pennsylvania. You can see where the drilling mud has returned to the surface in the top left of the photo. Photo by Cyberhawk obtained by FracTracker Alliance through a right-to-know request with the Pennsylvania Department of Environmental Protection.
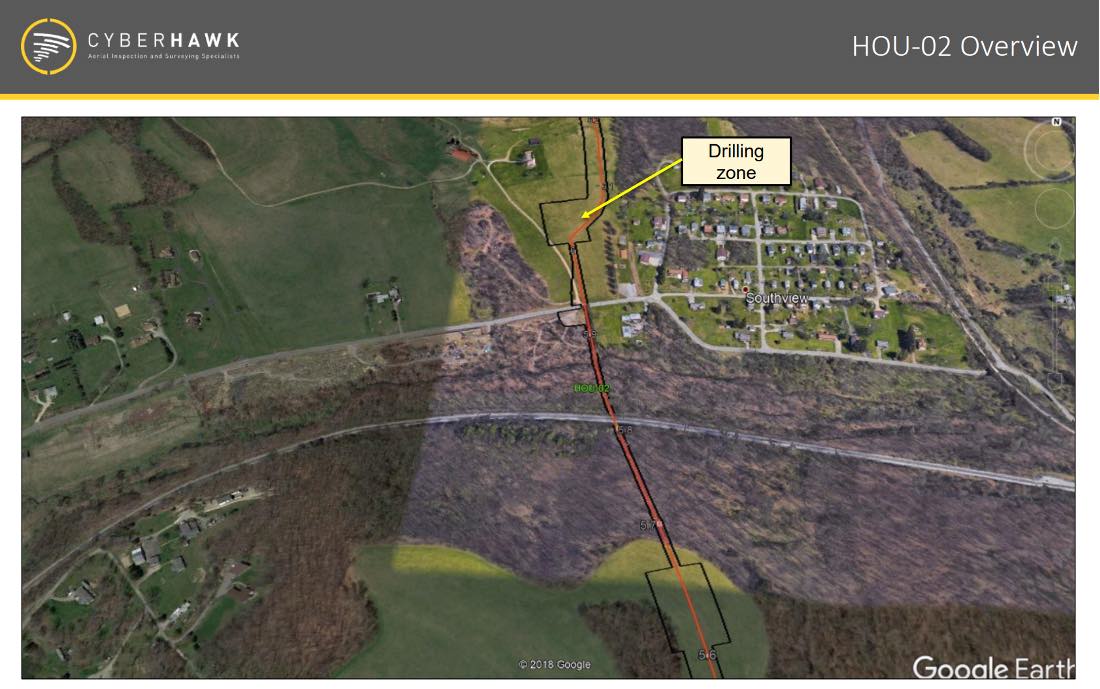
The Falcon Pipeline’s HDD locations are often close to neighborhoods, like the HOU-02 crossing in Southview, Washington County, Pennsylvania. Photo by Cyberhawk obtained by FracTracker Alliance through a right-to-know request with the Pennsylvania Department of Environmental Protection.
To our knowledge, the OEPA did not enforce this procedure, instead relying on workers to manually calculate and report spills. Shell’s failure to accurately self-report raises concerns about the safety of the Falcon’s HDD crossings in Ohio, including the crossing beneath the Ohio River, just upstream of drinking water intakes for Toronto and Steubenville, Ohio.
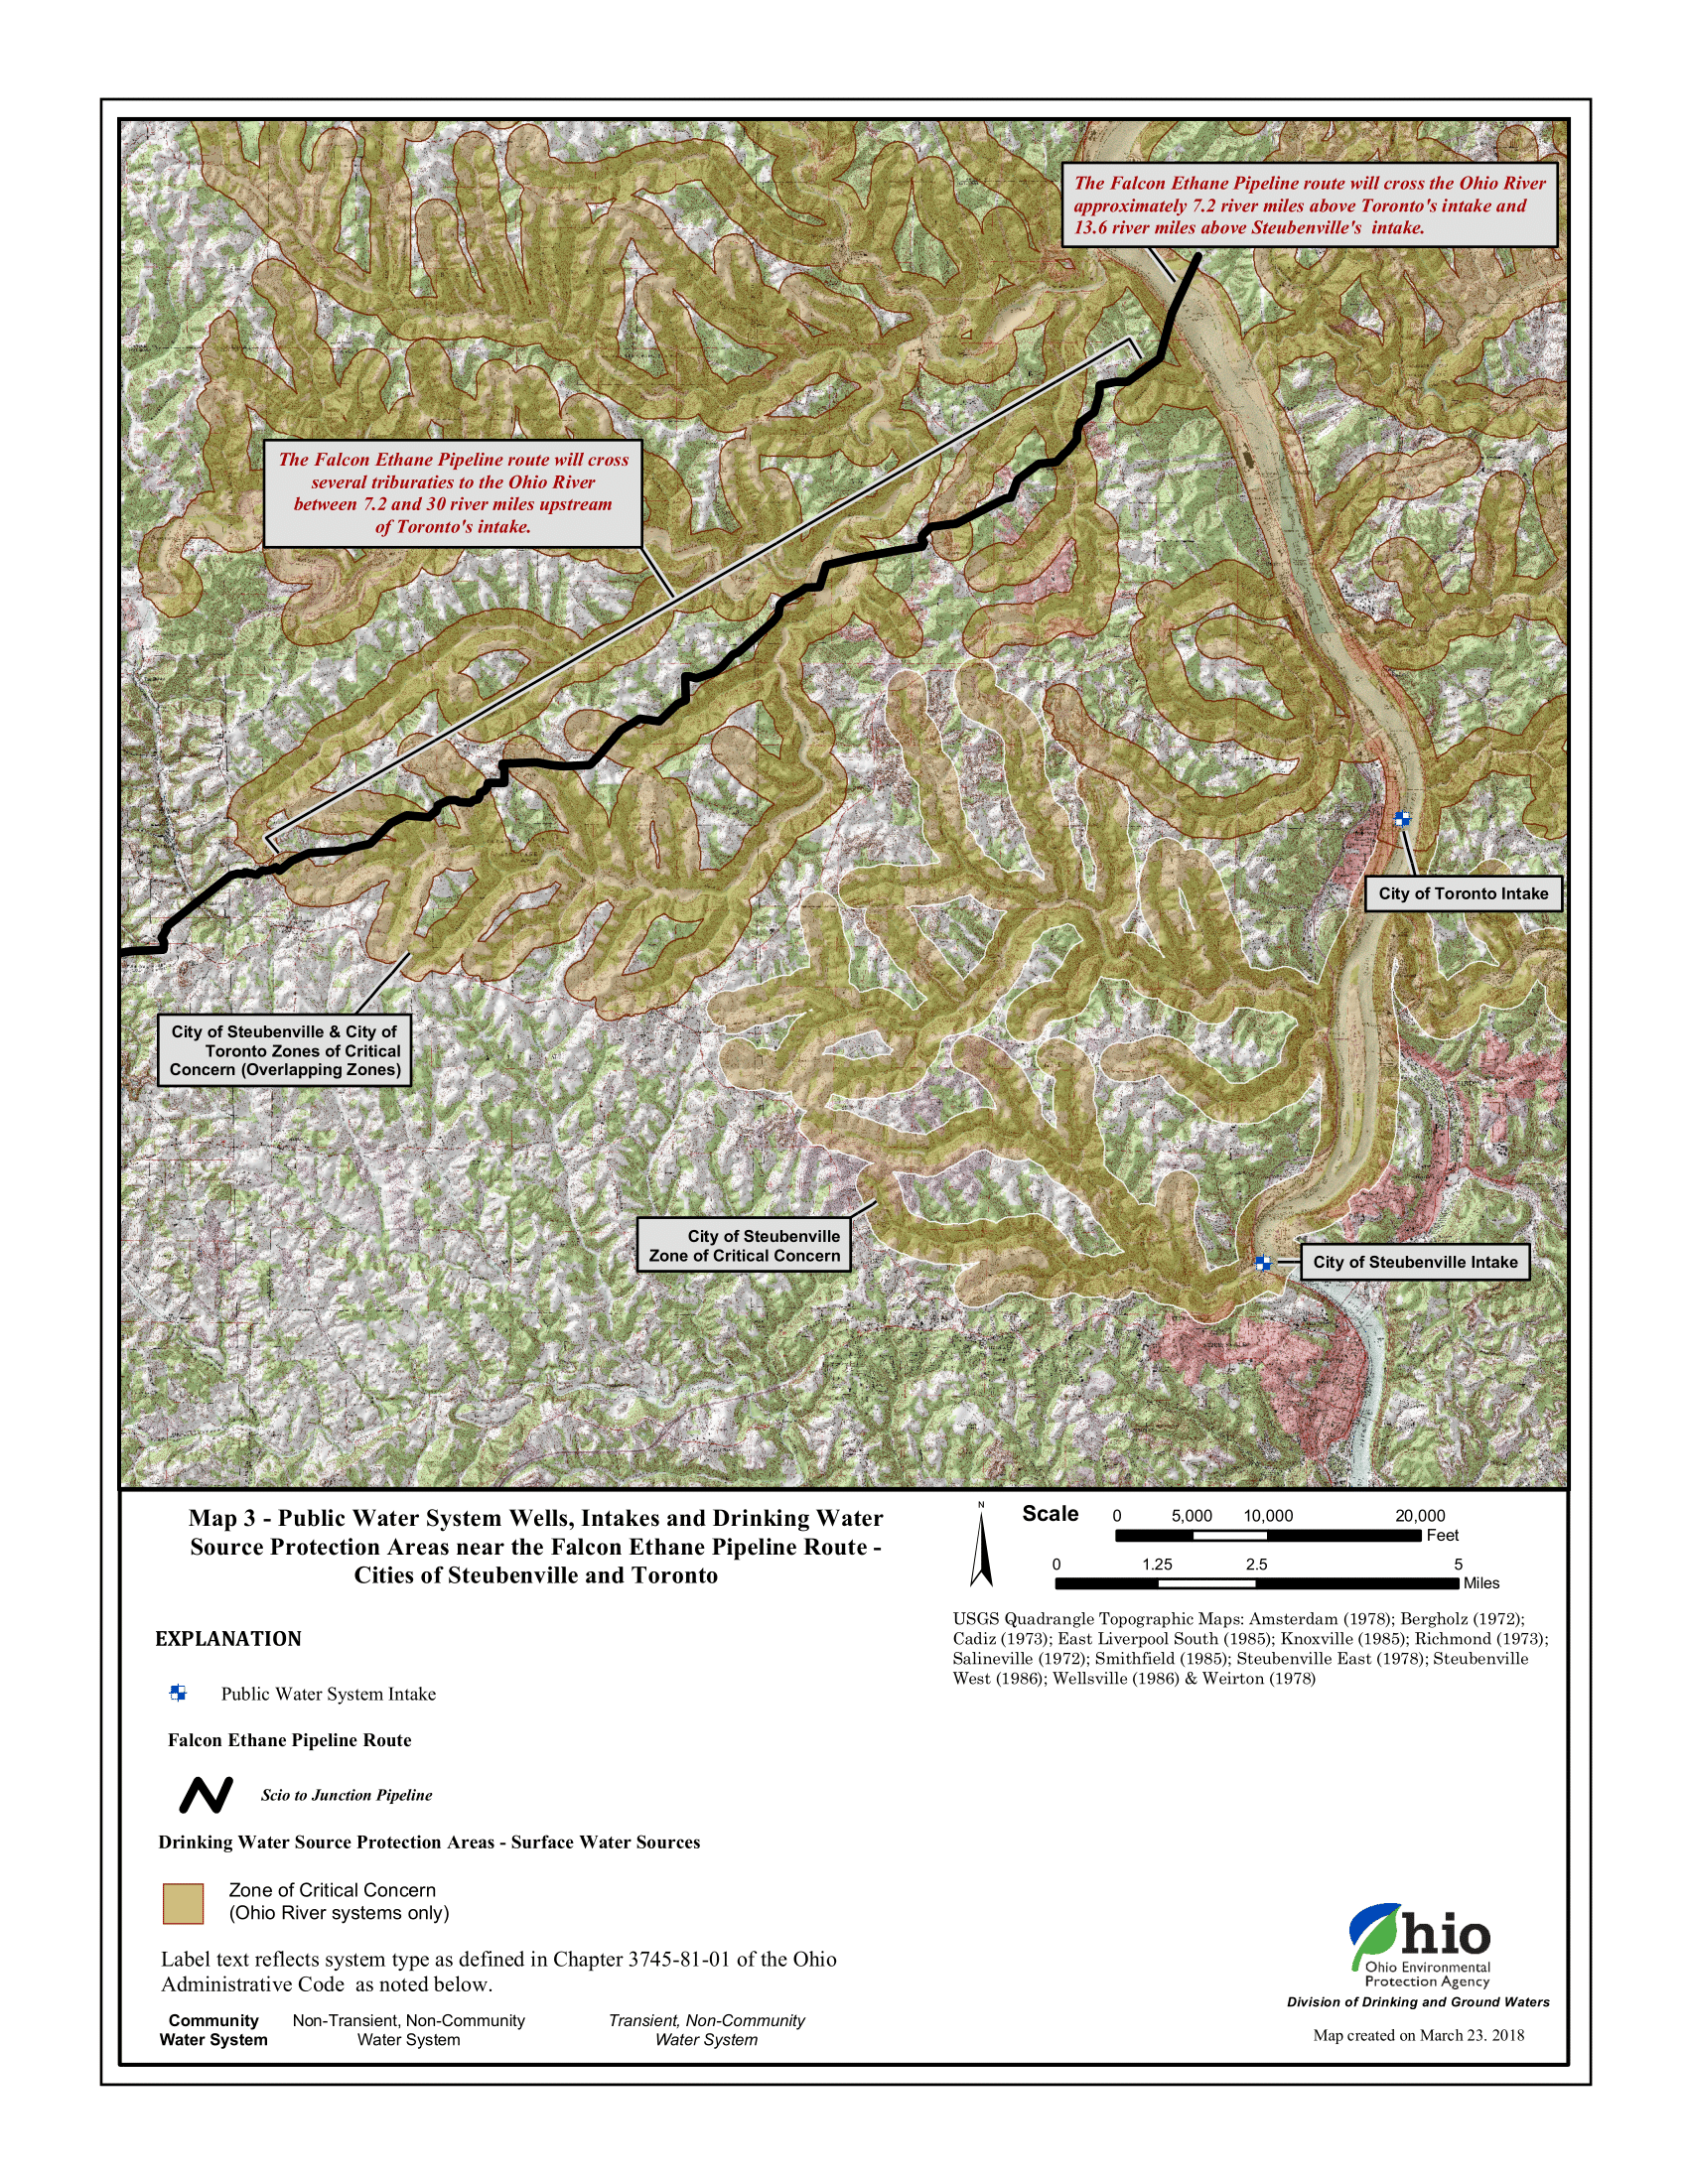
Public water system wells, intakes, and Drinking Water Source Protection Areas nears the Falcon Pipeline Route. Note, the pipeline route may have slightly changed since this map was produced. Source: Ohio EPA
The Falcon is connected to one of Shell’s most high-profile projects: a $6 billion to $10 billion plastic manufacturing plant, commonly referred to as the Shell ethane cracker, in Beaver County, Pennsylvania. These massive projects represent the oil and gas industry’s far-fetched dream of a new age of manufacturing in the region that would revolve around converting fracked gas into plastic, much of which would be exported overseas.
Many in the Ohio River Valley have raised serious concerns over the public health implications of a petrochemical buildout. The United States’ current petrochemical hub is in the Gulf Coast, including a stretch of Louisiana known colloquially as “Cancer Alley” because of the high risk of cancer from industrial pollution.
Construction of the ethane cracker and the Falcon pipeline have forged forward during the COVID-19 pandemic. In another example of the culture of fear at the worksite, several workers expressed concern that speaking publicly about unsafe working conditions that made social distancing impossible would cost them their jobs. Yet the state has allowed work to continue on at the plant, going so far as to grant Shell the approval to continue work without the waiver most businesses had to obtain. As of December 2020, over 274 Shell workers had contracted the coronavirus.
While the oil and gas industry had initially planned several ethane crackers for the region, all companies except for Shell have pulled out or put their plans on hold, likely due to the industry’s weak financial outlook.
A June 2020 report by the Institute for Energy Economics and Financial Analysis (IEEFA), stated that:
Royal Dutch Shell owes a more complete explanation to shareholders and the people of Pennsylvania of how it is managing risk. Shell remains optimistic regarding the prospects for its Pennsylvania Petrochemical Complex in Beaver County, Penn. The complex, which is expected to open in 2021 or 2022, is part of a larger planned buildout of plastics capacity in the Ohio River Valley and the U.S. IEEFA concludes that the current risk profile indicates the complex will open to market conditions that are more challenging than when the project was planned. The complex is likely to be less profitable than expected and face an extended period of financial distress.
Many of Pennsylvania’s elected officials have gone to great lengths to support this project. The Corbett administration enticed Shell to build this plastic factory in Pennsylvania by offering Shell a tax break for each barrel of fracked gas it buys from companies in the state and converts to plastic (valued at $66 million each year). The state declared the construction site a Keystone Opportunity Zone, giving Shell a 15-year exemption from state and local taxes. In exchange, Shell had to provide at least 2,500 temporary construction jobs and invest $1 billion in the state, giving the company an incredible amount of power to decide where resources are allocated in Pennsylvania.
Would the state have asked Shell for more than 2,500 construction jobs if it knew these jobs could be taken away when workers spoke out against life-threatening conditions? Will the politicians who have hailed oil and gas as the only job creator in the region care when workers are forced to hide their identity when communicating with public agencies?
The PA DEP appears to have played a key role in calling for this investigation, yet the agency itself was recently at the center of a different investigation led by Pennsylvania Attorney General Josh Shapiro. The resulting Investigating Grand Jury Report revealed systematic failure by the PA DEP and the state’s Department of Health to regulate the unconventional oil and gas industry. One of the failures was that the Department seldom referred environmental crimes to the Attorney General’s Office, which must occur before the Office has the authority to prosecute.
The Office of Attorney General is involved in this investigation, which the PA DEP is referring to as noncriminal.
The Grand Jury Report also cited concerns about “the revolving door” that shuffled PA DEP employees into higher-paying jobs in the oil and gas industry. The report cited examples of PA DEP employees skirting regulations to perform special favors for companies they wished to be hired by. The watchdog research organization Little Sis listed 47 fracking regulators in Pennsylvania that have moved back and forth between the energy industry, including Shell’s Government Relations Advisor, John Hines.
The Falcon Pipeline sits empty as people across the nation are amping up pressure on President Biden to pursue bold action in pursuit of environmental justice and a just transition to clean energy. Following Biden’s cancellation of the Keystone XL pipeline, Indigenous leaders are calling for him to shut down other projects including Enbridge Line 3 and the Dakota Access Pipeline.
Over a hundred groups representing millions of people have signed on to the Build Back Fossil Free campaign, imploring Biden to create new jobs through climate mobilization. Americans are also pushing Biden to be a Plastic Free President and take immediate action to address plastic pollution by suspending and denying permits for new projects like the Shell ethane cracker that convert fracked gas into plastic.
If brought online, the Falcon pipeline and Shell ethane cracker will lock in decades of more fracking, greenhouse gasses, dangerous pollution, and single-use plastic production.
Just as concerning, Shell will need to tighten its parasitic grip on the state’s economic and legislative landscape to keep this plant running. Current economic and political conditions are not favorable for the Shell ethane cracker: financial analysts report that its profits will be significantly less than originally presented. If the plant is brought online, Shell’s lobbyists and public relations firms will be using every tactic to create conditions that support Shell’s bottom line, not the well-being of residents in the Ohio River Valley. Politicians will be encouraged to pass more preemptive laws to block bans on plastic bags and straws to keep up demand for the ethane cracker’s product. Lobbyists will continue pushing for legislation that imposes harsh fines and felony charges on people who protest oil and gas infrastructure, while oil and gas companies continue to fund police foundations. Shell will ensure that Pennsylvania keeps extracting fossil fuels to feed its ethane cracker.
The Falcon pipeline is at odds with global demands to address plastic and climate crises. As these new documents reveal, it also poses immediate threats to residents along its route. While we’re eager for more information from state and federal agencies to understand the details of this investigation, it’s clear that there is no safe way forward with the Falcon Pipeline.
Royal Dutch Shell has been exerting control over people through the extraction of their natural resources ever since it began drilling for oil in Dutch and British colonies in the 19th Century. What will it take to end its reign?
Health & Safety | Legislation & Politics | Petrochemicals & Plastics | Pipelines
A new collaboration between FracTracker Alliance and Algalita is aiming to help middle school and high school students understand the connection between plastics and fracking — and the wide ranging implications for climate change, environmental injustice, and human health.
Most young people today understand that plastics are problematic. But, there is still often a disconnect between the symptom of plastics in our oceans, and the root causes of the problem. Algalita’s mission is to empower a new generation of critical thinkers to shift the broken and unjust systems that are causing the plastic pollution crisis. Algalita’s strategy is creating educational experiences directly with the movement’s diverse leaders, and this new project with FracTracker is a perfect example.
Specifically, Algalita and FracTracker have been working together to add new lessons to Algalita’s brand-new online, gamified, action platform: Wayfinder Society. Through this program, students can guide their own exploration of the complexities of the plastics issue, and can take action at their own pace and scale, by completing lessons and action-items (called Waymarks) based on difficulty, topic, and type of impact.
The first of two FracTracker Waymarks outlines the connection between fracking and plastic production. Students explore a map showing the full plastics production process from fracking pads, to pipelines, to ethane crackers, and packaging factories.
In a second Waymark that builds off of the first, students explore the massive petrochemical buildout on the Gulf Coast and in the Ohio River Valley. The map allows students to analyze the greenhouse gas emissions predicted for this buildout using the data point pop-up boxes. They can also examine the effects of climate change on communities amongst the buildout by viewing the coastal flood zone areas in Texas and Louisiana. Beyond that, students can investigate how facilities are impacting their peers in schools close to massive ethane cracker facilities. Finally, students are introduced to the movement’s #PlasticFreePresident Campaign, giving them a direct action to apply their new knowledge.
This StoryMap was created by FracTracker for Wayfinder Society, a program by Algalita. Learn more at Algalita.org. Place your cursor over the image and scroll down to advance the StoryMap and explore a series of maps charting the fracking-for-plastic system. Click on the icon in the bottom left to view the legend. Scroll to the end of the StoryMap to learn more and access the data sources.
View Full Sized Map | Updated 11/20
Algalita is excited about this partnership for so many reasons. For one, GIS is a critical skill for young people to learn. These two Waymarks pose an accessible and non-intimidating introduction to ArcGIS by using simple maps and StoryMaps like the one above. The maps let students get comfortable with GIS concepts and capabilities like layers, data attribute tables, measuring tools, and filters. Allowing students to explore how plastics are produced through a geographical lens provides a unique visual and interactive experience for them. The goal is for students to be able to connect petrochem buildout, with the plastics, climate and justice issues that they are focusing on — often separately. Our aim is that by putting this part of the story in context of real physical space they will more easily make those connections. We hope these lessons spark some students’ interest in mapping, geography, and GIS, providing a new generation of changemakers with GIS in their toolbox.
On top of that, we are stoked to be building this partnership with FracTracker because the success of our collective movement depends on strong, clear communication and synergies between the nodes of the movement’s network. The FracTracker Waymarks give our Wayfinders direct access to real-time data, visualizations, and expert insights that they can then use to level-up their actions and stories around their activism. And, they connect the dots not just for students, but also for educators and movement partners like us at Algalita — we are all for this powerful lever for change!
Check out Wayfinder Society here. Access the FracTracker Waymarks here and here — but you’ll need to be logged in. If you’re a student, get started by creating a profile, and then start earning Cairns (points)! If you’re an educator, parent or mentor, and interested in exploring the site, email us here for the guest login.
By Anika Ballent, Education Director, Algalita
Algalita empowers a new generation of critical thinkers who will shift the broken and unjust systems that are causing the plastic pollution crisis. We do this by offering educational experiences created directly with the movement’s diverse leaders.
Anika has been working in the movement against plastic pollution for ten years, studying microplastics in benthic and freshwater environments. She brings together her science background and creativity to educate young changemakers through hands-on experiences in schools, Algalita’s International Youth Summit, and online programs.
Data Sources:
Fracked Wells: Pennsylvania Department of Environmental Protection
ATEX Pipeline: EIA
Railroad: Selection from ArcGIS online
Process information: Houston Chronicle
Falcon Pipeline: Shell/AECOM and FracTracker Alliance
Mariner East 2 Pipeline: PA DEP
Greenhouse gas emission increases: Environmental Integrity Project. (2020, November 30). Emission Increase Database. Retrieved from https://environmentalintegrity.org/oil-gas-infrastructure-emissions.
All other data points were mapped by FracTracker Alliance referencing various online sources. While this map is based on actual infrastructure, it is intended as a model of the fracking-for-plastic lifecycle and certain steps may vary in real life.
Fracking produces more than just oil and gas — billions of gallons of highly toxic waste are also created in the process. Regulatory loopholes have led to limited oversight into how this waste is tracked and treated, putting public health and safety at risk.
The maps below explore issues related to fracking waste from the Marcellus and Utica Shale regions of Pennsylvania, Ohio, New York, and West Virginia.
This mapping platform is an evolving tool based on available data — yet the opaqueness of the fracking industry limits our ability to map and analyze the full scope of the problem of fracking waste in the Appalachian Basin.
Unfortunately, even after sifting through thousands of data points, we’re left with many outstanding questions — what are the chemical components of the waste created? Where is it all sent? Where are its byproducts sent? What facilities are being planned and proposed? How much illegal dumping occurs?
The production of fracking waste in the Appalachian Basin will continue to create environmental and public health threats for decades after the industry leaves the region. Wells can continue to generate wastewater for years and contaminated equipment sent to landfills will leach toxins into the environment. Furthermore, with the industry’s history of failing to restore land after it has been used for oil and gas operations, we can expect abandoned fracking sites to become an increasing source of pollution in the Appalachian Basin in the coming decades. It’s imperative that the public have access to accurate and detailed data on fracking waste to protect the health of workers and residents.
By Erica Jackson, Community Outreach & Communications Specialist, FracTracker Alliance
In this article, we’ll take a look at the current trend in “re-branding” incineration as a viable option to deal with the mountains of garbage generated by our society. Incineration can produce energy for electricity, but can the costs—both economically, and ecologically—justify the benefits? What are the alternatives?
In today’s world of consumerism and production, waste disposal is a chronic problem facing most communities worldwide. Lack of attention to recycling and composting, as well as ubiquitous dependence on plastics, synthetics, and poorly-constructed or single-use goods has created a waste crisis in the United States. So much of the waste that we create could be recycled or composted, however, taking extraordinary levels of pressure off our landfills. According to estimates in 2017 by the US Environmental Protection Agency (EPA), over 30 percent of municipal solid waste is made up of organic matter like food waste, wood, and yard trimmings, almost all of which could be composted. Paper, glass, and metals – also recyclable – make up nearly 40 percent of the residential waste stream. Recycling plastic, a material which comprises 13% of the waste stream, has largely been a failed endeavor thus far.
Why say NO to incinerators?
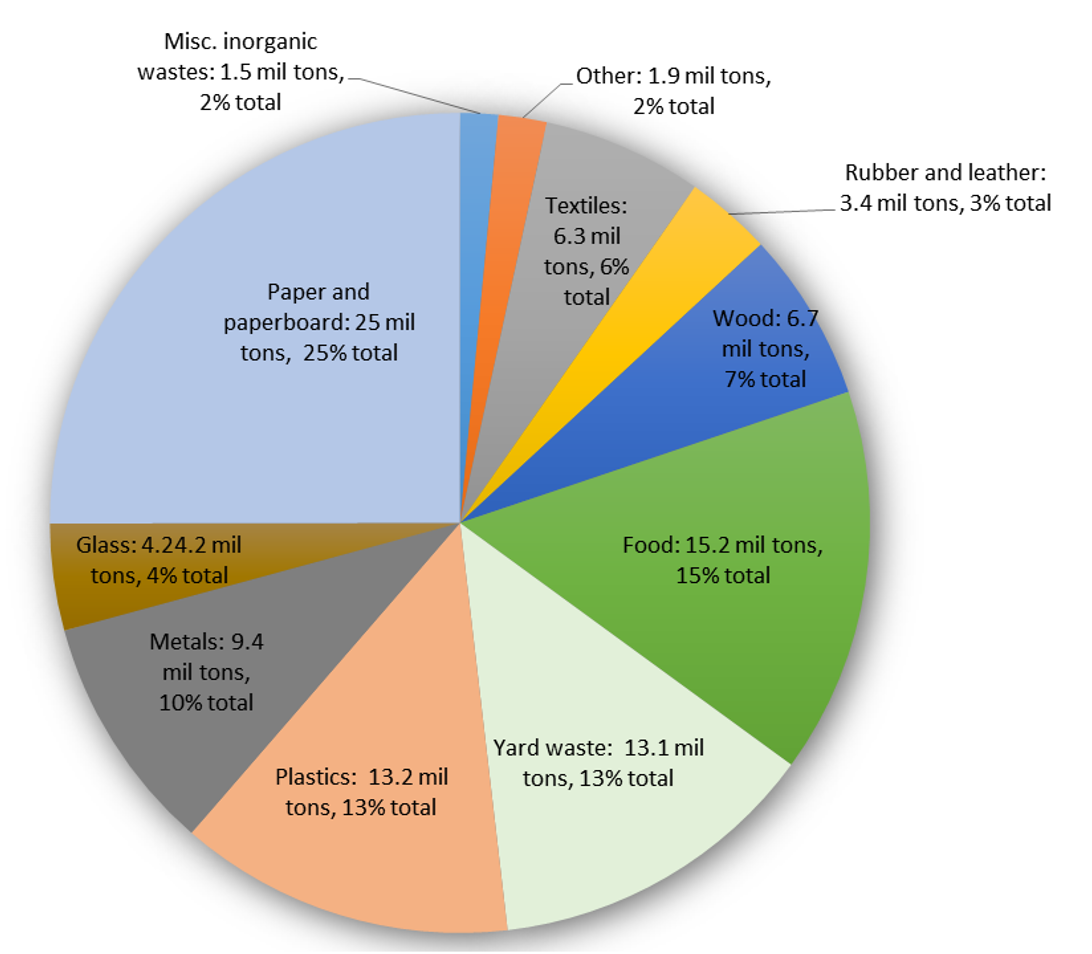
Figure 1: A breakdown of the 267.78 million tons of municipal waste that were generated in the US in 2017. Source: figure developed by FracTracker Alliance, based on 2017 EPA data. Source: https://www.epa.gov/facts-and-figures-about-materials-waste-and-recycling/national-overview-facts-and-figures-materials
Nevertheless, of the approximately 400 million tons of plastic produced annually around the world, only about 10% of it is recycled. The rest winds up in the waste stream or as microfragments (or microplastics) in our oceans, freshwater lakes, and streams.
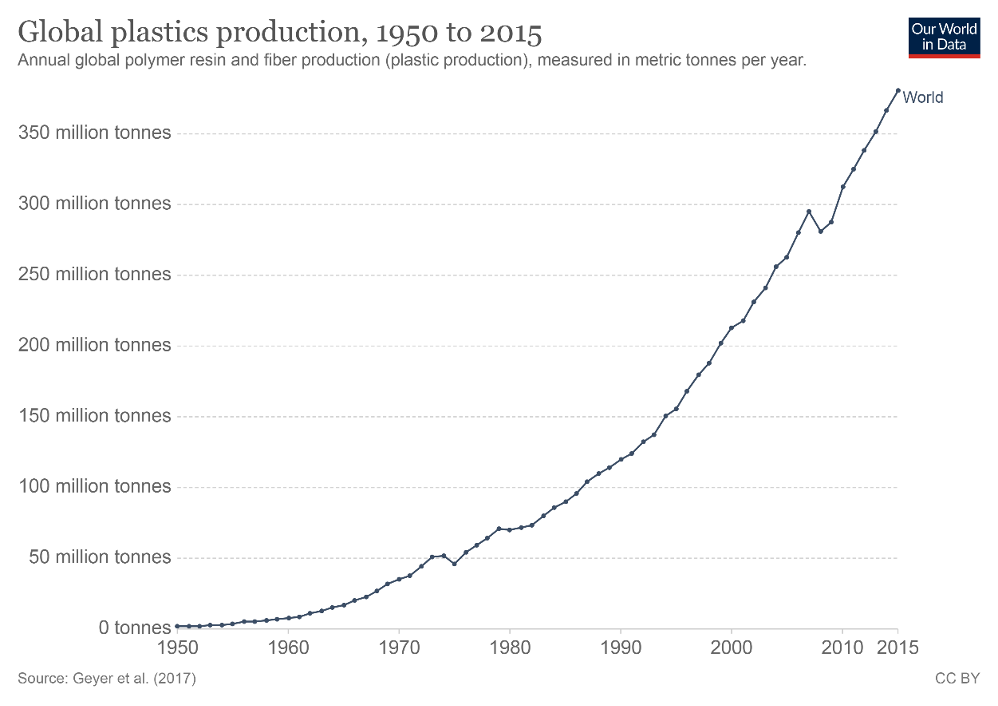
Figure 2: Increase in global plastics production, 1950-2015, Source: Geyer, R., Jambeck, J. R., & Law, K. L. (2017). Production, use, and fate of all plastics ever made. Science Advances, 3(7), e1700782. Available at: http://advances.sciencemag.org/content/3/7/e1700782 Referenced in https://ourworldindata.org/plastic-pollution
According to an EPA fact sheet, by 2017, municipal solid waste generation increased three-fold compared with 1960. In 1960, that number was 88.1 million tons. By 2017, this number had risen to nearly 267.8 million tons. Over that same period, per-capita waste generation rose from 2.68 pounds per person per day, to 4.38 pounds per person per day, as our culture became more wed to disposable items.
The EPA provides a robust “facts and figures” breakdown of waste generation and disposal here. In 2017, 42.53 million tons of US waste was shipped to landfills, which are under increasing pressure to expand and receive larger and larger loads from surrounding area, and, in some cases, hundreds of miles away.
On average, in 2017, Americans recycled and composted 35.2% of our individual waste generation rate of 4.51 pounds per person per day. While this is a notable jump from decades earlier, much of the gain appears to be in the development of municipal yard waste composting programs. Although the benefits of recycling are abundantly clear, in today’s culture, according to a PEW Research Center report published in 2016, just under 30% of Americans live in communities where recycling is strongly encouraged. An EPA estimate for 2014 noted that the recycling rate that year was only 34.6%, nationwide, with the highest compliance rate at 89.5% for corrugated boxes.
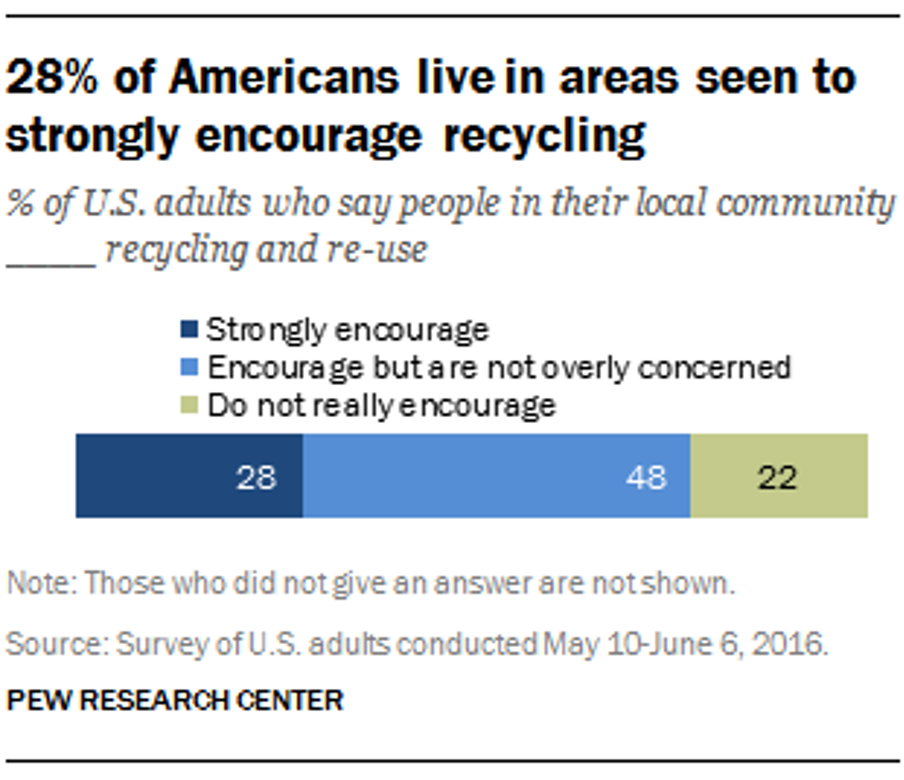
Figure 3. Percent of Americans who report recycling and re-use behaviors in their communities, via Pew Research center
Historically, incineration – or burning solid waste – has been one method for disposing of waste. And in 2017, this was the fate of 34 million tons—or nearly 13%– of all municipal waste generated in the United States. Nearly a quarter of this waste consisted of containers and packaging—much of that made from plastic. The quantity of packaging materials in the combusted waste stream has jumped from only 150,000 tons in 1970 to 7.86 million tons in 2017. Plastic, in its many forms, made up 16.4% of all incinerated materials, according to the EPA’s estimates in 2017.
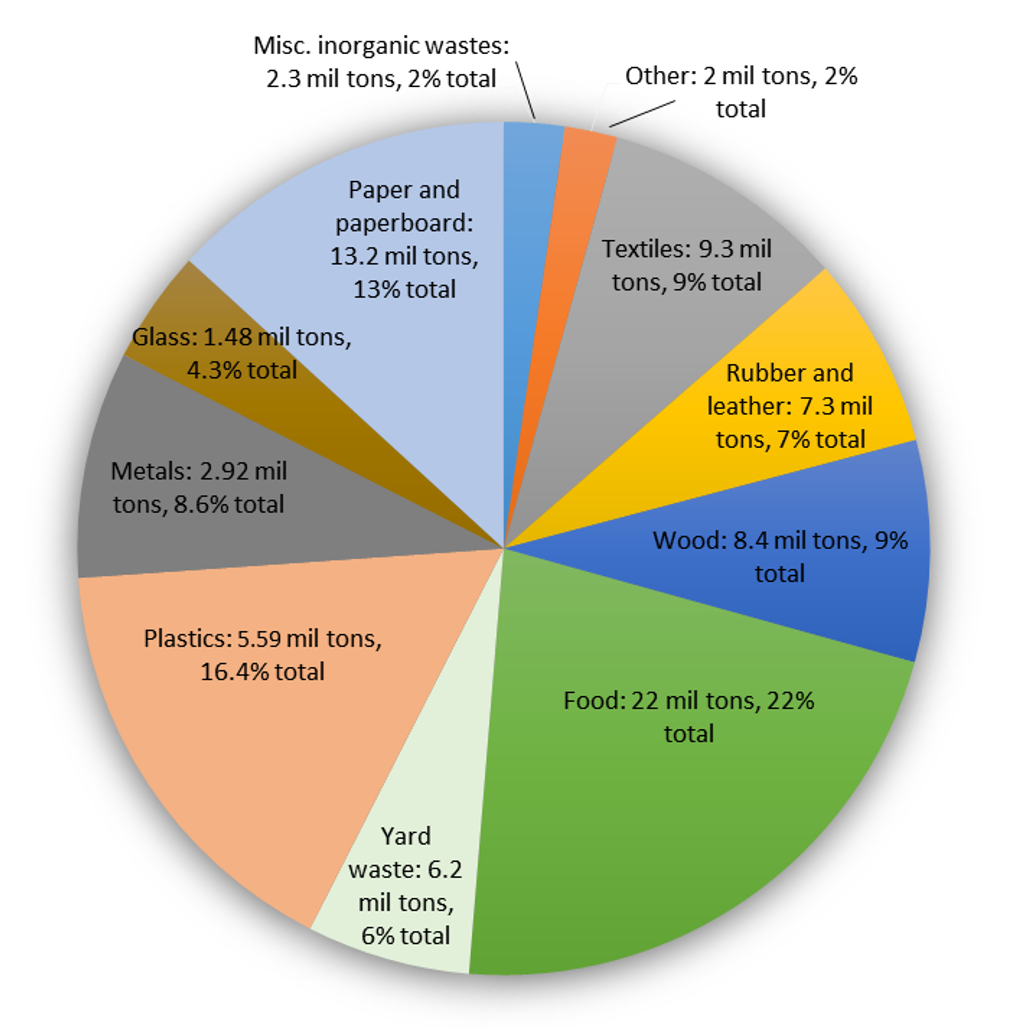
Figure 4: A breakdown of the 34.03 tons of municipal waste incinerated for energy in the US in 2017
Sadly, the answer is this: The oil and gas industry produces copious amounts of ethane, which is a byproduct of oil and gas extraction. Plastics are an “added value” component of the cycle of fossil fuel extraction. FracTracker has reported extensively on the controversial development of ethane “cracker” plants, which chemically change this extraction waste product into feedstock for the production of polypropylene plastic nuggets. These nuggets, or “nurdles,” are the building blocks for everything from fleece sportswear, to lumber, to packaging materials. The harmful impacts from plastics manufacturing on air and water quality, as well as on human and environmental health, are nothing short of stunning.
FracTracker has reported extensively on this issue. For further background reading, explore:
A report co-authored by FracTracker Alliance and the Center for Environmental Integrity in 2019 found that plastic production and incineration in 2019 contributed greenhouse gas emissions equivalent to that of 189 new 500-megawatt coal power plants. If plastic production and use grow as currently planned, by 2050, these emissions could rise to the equivalent to the emissions released by more than 615 coal-fired power plants.
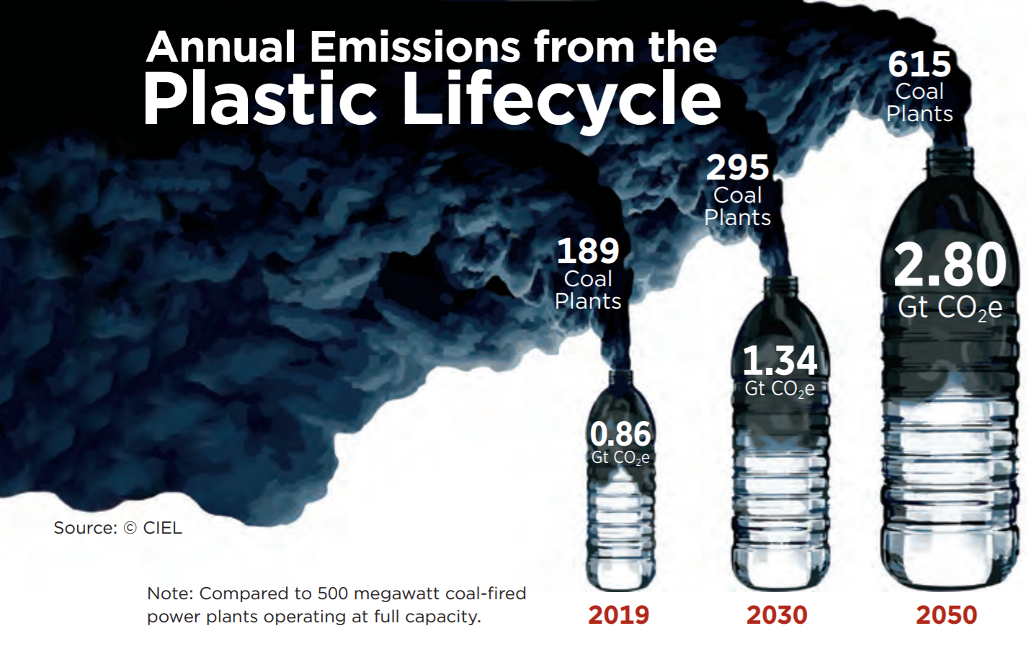
Figure 5: Projected carbon dioxide equivalencies in plastics emissions, 2019-2050. Source: Plastic and Climate https://www.ciel.org/plasticandclimate/
Incineration is now strongly critiqued as a dangerous solution to waste disposal as more synthetic and heavily processed materials derived from fossils fuels have entered the waste stream. Filters and other scrubbers that are designed to remove toxins and particulates from incineration smoke are anything but fail-safe. Furthermore, the fly-ash and bottom ash that are produced by incineration only concentrate hazardous compounds even further, posing additional conundrums for disposal.
Incineration as a means of waste disposal, in some states is considered a “renewable energy” source when electricity is generated as a by-product. Opponents of incineration and the so-called “waste-to-energy” process see it as a dangerous route for toxins to get into our lungs, and into the food stream. In fact, Energy Justice Network sees incineration as:
… the most expensive and polluting way to make energy or to manage waste. It produces the fewest jobs compared to reuse, recycling and composting the same materials. It is the dirtiest way to manage waste – far more polluting than landfills. It is also the dirtiest way to produce energy – far more polluting than coal burning.
Waste incineration has been one solution for disposing of trash for millennia. And now, aided by technology, and fueled by a crisis to dispose of ever-increasing trash our society generates, waste-to-energy (WTE) incineration facilities are a component in how we produce electricity.
But what is a common characteristic of the communities in which WTEs are sited? According to a 2019 report by the Tishman Environmental and Design Center at the New School, 79% of all municipal solid waste incinerators are located in communities of color and low-income communities. Incinerators are not only highly problematic environmentally and economically. They present direct and dire environmental justice threats.
Click here to view this map full-screen
![]()
Activate the Layers List button to turn on Environmental Justice data on air pollutants and cancer occurrences across the United States. We have also included real-time air monitoring data in the interactive map because one of the health impacts of incineration includes respiratory illnesses. These air monitoring stations measure ambient particulate matter (PM 2.5) in the atmosphere, which can be a helpful metric.
These trash incinerators capture energy released from the process of burning materials, and turn it into electricity. But what are the costs? Proponents of incineration say it is a sensible way to reclaim or recovery energy that would otherwise be lost to landfill disposal. The US EIA also points out that burning waste reduces the volume of waste products by up to 87%.
The down-side of incineration of municipal waste, however, is proportionally much greater, with a panoply of health effects documented by the National Institutes for Health, and others.
Dioxins (shown in Figures 6-11) are some of the most dangerous byproducts of trash incineration. They make up a group of highly persistent organic pollutants that take a long time to degrade in the environment and are prone to bioaccumulation up the food chain.
Dioxins are known to cause cancer, disrupt the endocrine and immune systems, and lead to reproductive and developmental problems. Dioxins are some of the most dangerous compounds produced from incineration. Compared with the air pollution from coal-burning power plants, dioxin concentrations produced from incineration may be up to 28 times as high.

2,3,7,8-Tetrachlorodibenzo-p-dioxin

2,3,7,8-Tetrachlorodibenzofuran

3,3′,4,4′,5,5′-Hexachlorobiphenyl
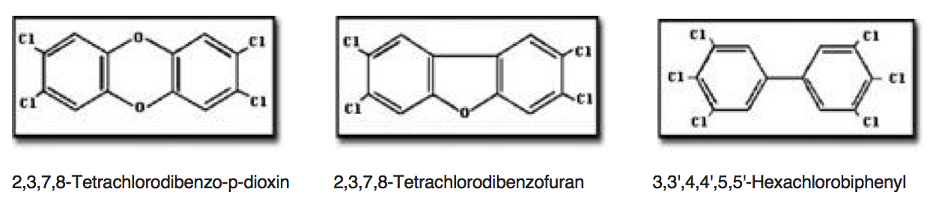
Figures 6-11: Dioxin chemical structures via US EPA. Source: https://www.epa.gov/dioxin/learn-about-dioxin
Federal EPA regulations between 2000 and 2005 resulted in the closure of nearly 200 high dioxin emitting plants. Currently, there are fewer than 100 waste-to-energy incinerators operating in the United States, all of which are required to operate with high-tech equipment that reduces dioxins to 1% of what used to be emitted. Nevertheless, even with these add-ons, incinerators still produce 28 times the amount of dioxin per BTU when compared with power plants that burn coal.
Even with pollution controls required of trash incinerators since 2005, compared with coal-burning energy generation, incineration still releases 6.4 times as much of the notoriously toxic pollutant mercury to produce the equivalent amount of energy.
Energy Justice Network, furthermore, notes that incineration is the most expensive means of managing waste… as well as making energy. This price tag includes high costs to build incinerators, as well as staff and maintain them — exceeding operation and maintenance costs of coal by a factor of 11, and nuclear by a factor of 4.2.
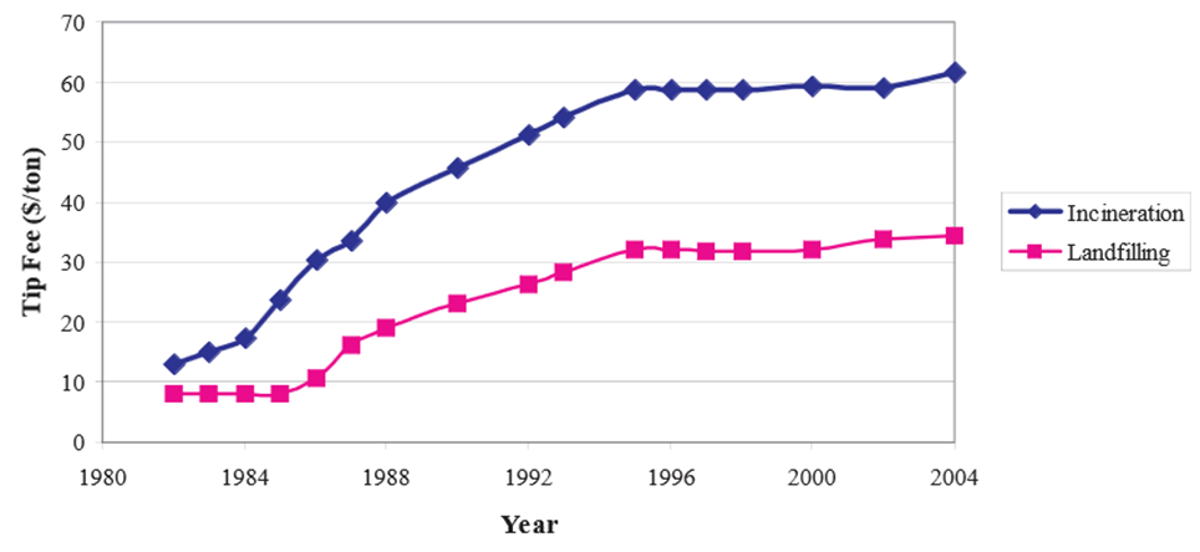
Figure 12. Costs of incineration per ton are nearly twice that of landfilling. Source: National Solid Waste Management Association 2005 Tip Fee Survey, p. 3.
Energy Justice Network and others have pointed out that the amount of energy recovered and/or saved from recycling or composting is up to five times that which would be provided through incineration.
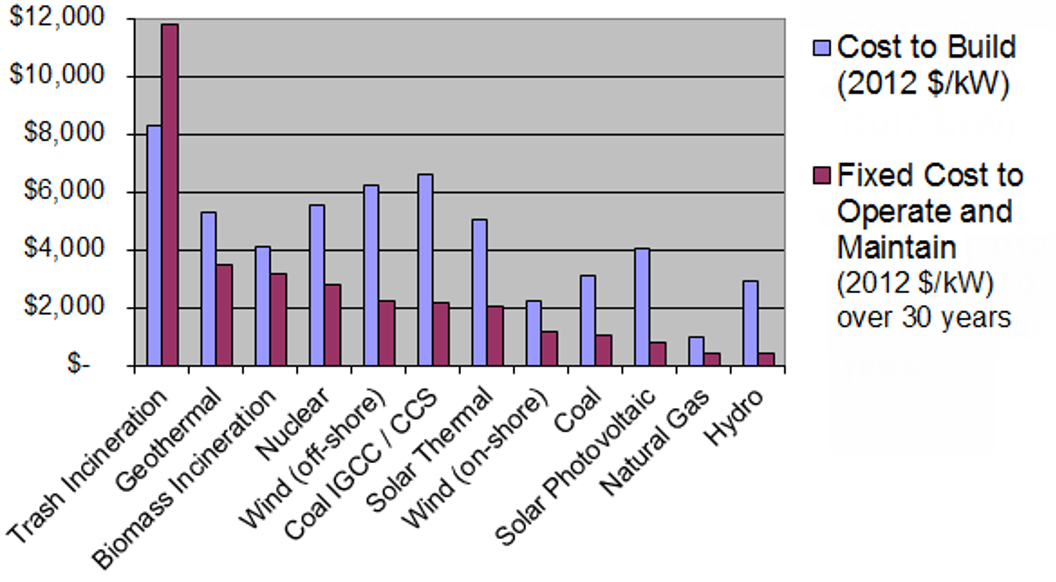
Figure 13. Estimated power plant capital and operating costs. Source: Energy Justice Network
Waste is a “renewable” resource only to the extent that humans will continue to generate waste. In general, the definition of “renewable” refers to non-fossil fuel based energy, such as wind, solar, geothermal, wind, hydropower, and biomass. Synthetic materials like plastics, derived from oil and gas, however, are not. Although not created from fossil fuels, biologically-derived products are not technically “renewable” either.
ZeroWasteEurope argues that:
Biogenic materials you find in the residual waste stream, such as food, paper, card and natural textiles, are derived from intensive agriculture – monoculture forests, cotton fields and other “green deserts”. The ecosystems from which these materials are derived could not survive in the absence of human intervention, and of energy inputs from fossil sources. It is, therefore, more than debatable whether such materials should be referred to as renewable.
Although incineration may reduce waste volumes by up to 90%, the resulting waste-products are problematic. “Fly-ash,” which is composed of the light-weight byproducts, may be reused in concrete and wallboard. “Bottom ash” however, the more coarse fraction of incineration—about 10% overall—concentrates toxins like heavy metals. Bottom-ash is disposed of in landfills or sometimes incorporated into structural fill and aggregate road-base material.
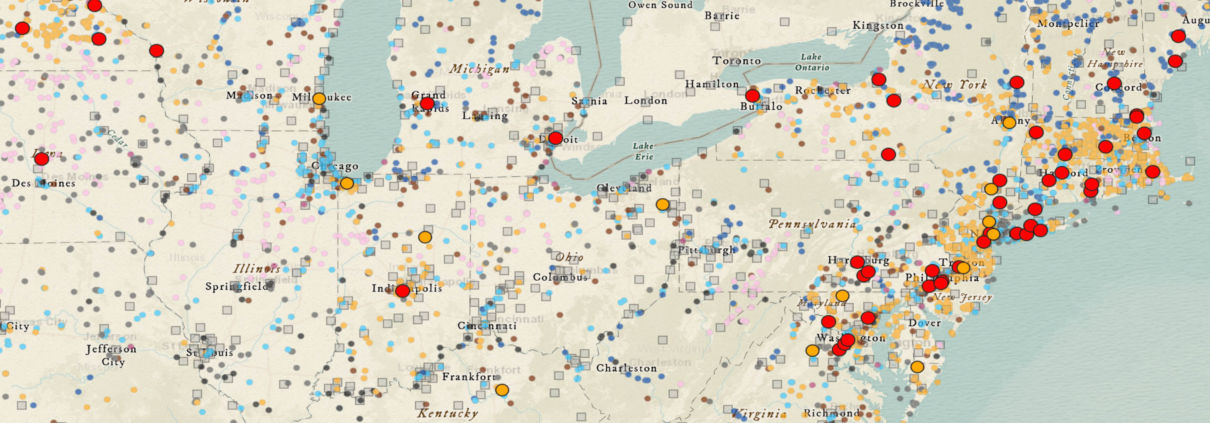
Trash incineration accounts for a fraction of the power produced in the United States. According to the United States Energy Information Administration, just under 13% of electricity generated in the US comes from burning of municipal solid waste, in fewer than 65 waste-to-energy plants nation-wide. Nevertheless, operational waste-to-incineration plants are found throughout the United States, with a concentration east of the Mississippi.
According to EnergyJustice.net’s count of waste incinerators in the US and Canada, currently, there are:
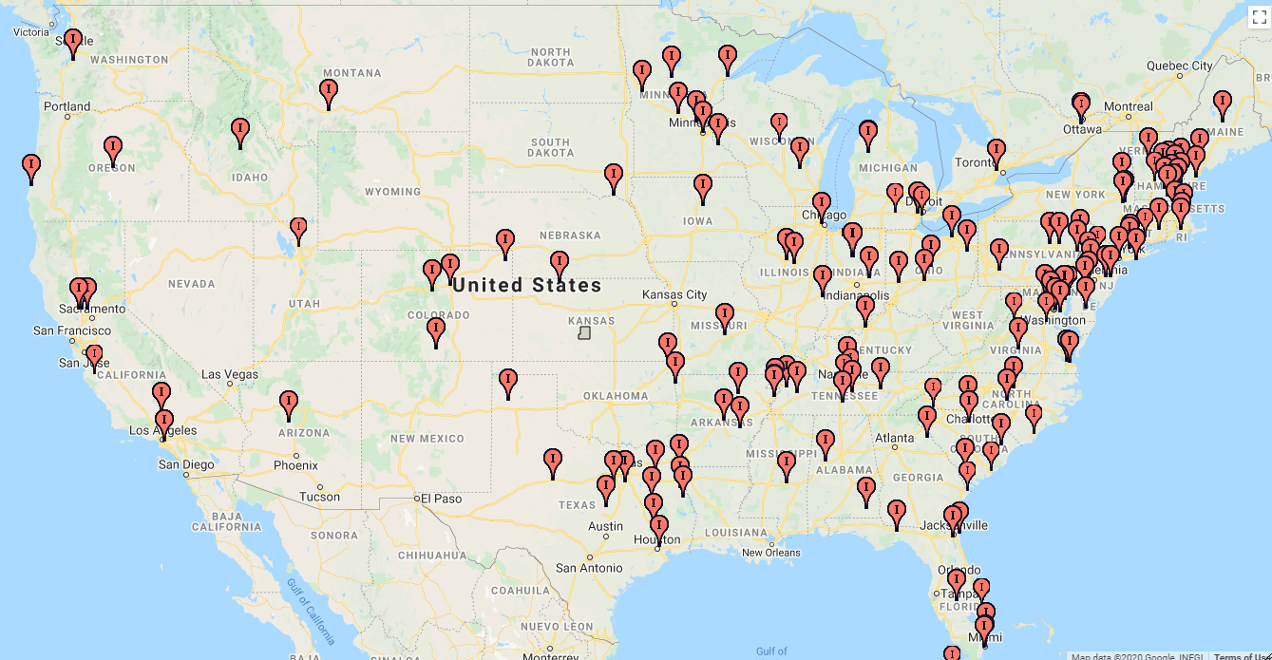
Figure 14. Locations of waste incinerators that are already shut down. Source: EnergyJustice.net)
Precise numbers of these incinerators are difficult to ascertain, however. Recent estimates from the federal government put the number of current waste-to-energy facilities at slightly fewer: EPA currently says there are 75 of these incinerators in the United States. And in their database, updated July 2020, the United States Energy Information Administration (EIA), lists 63 power plants that are fueled by municipal solid waste. Of these 63 plants, 40—or 66%—are in the northeast United States.
Regardless, advocates of clean energy, waste reduction, and sustainability argue that trash incinerators, despite improvements in pollution reduction over earlier times and the potential for at least some electric generation, are the least effective option for waste disposal that exists. The trend towards plant closure across the United States would support that assertion.
Let’s take a look at the dirty details on WTE facilities in three states in the Northeastern US.
In NYS, there are currently 11 waste-to-energy facilities that are operational, and two that are proposed. Here’s a look at some of them:
The largest waste-to-energy facility in New York State, Covanta Hempstead Company (Nassau County), was built in 1989. It is a 72 MW generating plant, and considered by Covanta to be the “cornerstone of the town’s integrated waste service plan.”
According to the Environmental Protection Agency’s ECHO database, this plant has no violations listed. Oddly enough, even after drawing public attention in 2009 about the risks associated with particulate fall-out from the plant, the facility has not been inspected in the past 5 years.
Other WTE facilities in New York State include the Wheelabrator plant located in Peekskill (51 MW), Covanta Energy of Niagara in Niagara Falls (32 MW), Convanta Onondaga in Jamesville (39 MW), Huntington Resource Recovery in Suffolk County (24.3 MW), and the Babylon Resource Recovery Facility also in Suffolk County (16.8 MW). Five additional plants scattered throughout the state in Oswego, Dutchess, Suffolk, Tioga, and Washington Counties, are smaller than 15 MW each. Of those, two closed and one proposal was defeated.
In Pennsylvania, six WTE facilities are currently operating. Two have been closed, and six defeated.
And in New Jersey, there are currently four operating WTE facilities. Essex County Resource Recovery Facility, is New Jersey’s largest WTE facility. It opened in 1990, houses three burners, and produces 93 MW total.
Union County Resource Recovery Facility, which opened in 1994, operates three burners, producing 73 MW total. Covanta Camden Energy Recovery Center opened in 1991. It has 13 burners, producing a total of 46 MW. Wheelabrator Gloucester LP (Westville, NJ) opened in 1990. The two burners there produce 21 MW of power. Covanta Warren Energy is the oldest and smallest WTE facility in New Jersey. It produced 14 MW of energy and opened in 1988. Operations are currently shut down, but this closure may not be permanent.
Looming large above the arguments about appropriate siting, environmental justice, financial gain, and energy prices, is a bigger question:
How can we continue to live on this planet at our current rates of consumption, and the resultant waste generation?
The issue here is not so much about the sources of our heat and electricity in the future, but rather “How MUST we change our habits now to ensure a future on a livable planet?”
Professor Paul Connett (emeritus, St. Lawrence University), is a specialist in the build-up of dioxins in food chains, and the problems, dangers, and alternatives to incineration. He is a vocal advocate for a “Zero Waste” approach to consumption, and suggests that every community embrace these principles as ways to guide a reduction of our waste footprint on the planet. The fewer resources that are used, the less waste is produced, mitigating the extensive costs brought on by our consumptive lifestyles. Waste-to-energy incineration facilities are just a symptom of our excessively consumptive society.
Dr. Connett suggests these simple but powerful methods to drastically reduce the amount of materials that we dispose — whether by incineration, landfill, or out the car window on a back-road, anywhere in the world:
Connett’s Zero Waste charge to industry is this: “If we can’t reuse, recycle, or compost it, industry shouldn’t be making it.” Reducing our waste reduces our energy footprint on the planet.
In a similar vein, FracTracker has written about the potential for managing waste through a circular economics model, which has been successfully implemented by the city of Freiburg, Germany. A circular economic model incorporates recycling, reuse, and repair to loop “waste” back into the system. A circular model focuses on designing products that last and can be repaired or re-introduced back into a natural ecosystem.
This is an important vision to embrace. Every day. Everywhere.
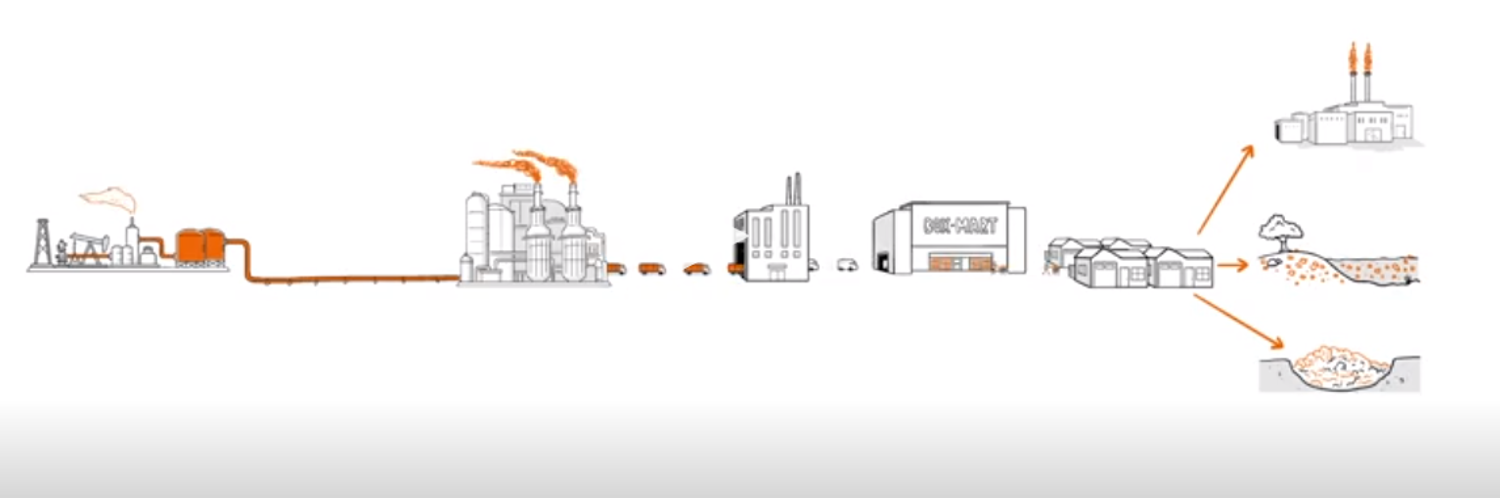
Figure 17: Illustration of common waste streams from “The Story of Plastic” (https://www.storyofplastic.org/)
By Karen Edelstein, Eastern Program Coordinator
Fracking has been raised as an issue that could determine the outcome of the 2020 US presidential election. Republican candidates have cited erroneous figures of how many fracking jobs exist in Pennsylvania, and have falsely claimed that Democratic presidential candidate Joe Biden and running mate Kamala Harris seek to ban fracking. And while the Democratic candidates have made suggestive comments in the past, they have made their position clear. As Senator Harris stated in the vice presidential debate: “I will repeat, and the American people know, that Joe Biden will not ban fracking. That is a fact.”
The debate around this issue is not on whether or not fracking should be banned– something neither party advocates– but rather around the facts. Republican candidates have inflated the extent of fracking jobs by up to 3500 percent. But the natural gas industry and the fracking boom have failed to deliver the job growth and prosperity that was predicted by proponents a decade ago. In reality, the total number of jobs in the natural gas industry in Pennsylvania never reached more than 30,000 over the last five years and is now less with the industry’s economic decline.
The total number of jobs in the natural gas industry in Pennsylvania never reached more than 30,000 over the last five years and is now less with the industry’s economic decline.
The debate should not be around the facts- those are already firmly established. The debate should be around how to best support fossil fuel workers in the inevitable transition to cleaner energy. What does a just transition that supports workers and the climate look like?
FracTracker Alliance and The Breathe Project have compiled a fact sheet to help us answer this question based on where Pennsylvania currently stands.
![]()
![]()
Breathe Project
Energy Innovation Center – Suite 140
1435 Bedford Avenue
Pittsburgh, PA 15219
The Breathe Project and FracTracker Alliance have crafted the following messaging for refuting the conflated job numbers being touted by pro-fossil fuel organizations and political candidates regarding fracking and jobs in Pennsylvania that, in some cases, has inflated natural gas jobs in the state by 3500 percent.
The natural gas industry and the fracking boom have failed to deliver the job growth and prosperity that was predicted by proponents a decade ago. The total number of jobs in the natural gas industry in Pennsylvania never reached more than 30,000 over the last five years and is now less with the industry’s economic decline.
FACT: The Pa. Dept. of Labor and Industry (DLI) reported that direct employment in natural gas development totaled 19,623 in 2016. This was down from 28,926 total natural gas development jobs in 2015. This includes jobs in drilling, extraction, support operations and pipeline construction and transportation. (StateImpact, 2016)
Pa. DLI calculated the employment figures using data from six data classifications at the U.S. Bureau of Labor Statistics — specifically, the North American Industry Classification System (NAICS) codes for cured petroleum and natural gas extraction, natural gas liquid extraction, drilling oil and gas wells, support activities for oil and gas operations, oil and gas pipeline and related structures and pipeline transportation of natural gas. (Natural Gas Intel, 2016)
Inflated estimates of fracking-related jobs in Pennsylvania under previous Gov. Tom Corbett included regulators overseeing the industry as gas jobs, truck drivers, and those working in highway construction, steel mills, coal-fired power plants, sewage treatment plants, and others. Pa. Gov. Tom Wolf’s administration revised the way gas industry jobs were calculated to reflect a more accurate depiction of jobs in the sector.
FACT: Food & Water Watch calculated that there were 7,633 jobs pre-boom (2001 – 2006), which rose to 25,960 oil and gas industry jobs post-boom (2016 – 2018). (FWW, March 2020)
Food & Water Watch created a more accurate model using a definition that encompasses only jobs directly involved with domestic oil and gas production, specifically: oil and gas extraction; support activities for oil and gas operations; drilling oil and gas wells; oil and gas pipeline construction; and pipeline transportation.
FACT: The Food & Water Watch analysis also reports that misleadingly broad definitions in industry-supported job reports overstated the industries’ scope. The industry analysis included broad swaths of manufacturing industries including “fertilizer manufacturing,” convenience store workers, and gas station workers, which accounted for nearly 35 percent of all oil and gas jobs in their analysis. (FWW, PwC at 5 and Table 4 at 9, 2019)
FACT: As a point of comparison, in 2019, close to 1 million state residents were working in healthcare, 222,600 in education, and over 590,000 in local and state government. (Pennsylvania Bureau of Labor Statistics, July, 2020)
FACT: To forecast fracking-related job growth, the American Petroleum Institute used a model with exaggerated multipliers and faulty assumptions, such as the amount of purchases made from in-state suppliers, and it double counted jobs, leading to wildly optimistic estimates. (Ohio River Valley Institute, August 2020)
FACT: In addition, many of the jobs claimed in a 2017 American Chemistry Council Appalachian petrochemical economic impact study would arise in plastics manufacturing, which raises two concerns. First, both the ACC study and subsequent reports by the U.S. Department of Energy assume that 90% of the ethylene and polyethylene produced by imagined Appalachian cracker plants would be shipped out of the region to be used in manufacturing elsewhere in the country and the world. Of the 10% that would presumably stay in the region, much or most of it would serve to replace supplies that the region’s plastics manufacturers currently source from the Gulf Coast. (Ohio River Valley Institute, August 2020)
The fracking and petrochemical industries create unsustainable boom and bust cycles that do not holistically improve local economies.
FACT: Economic analyses show that the oil and gas industry is a risky economic proposition due to the current global oversupply of plastics, unpredictable costs to the industry, a lower demand for plastics, and increased competition. The analyses call into question industry’s plans to expand fracking and gas infrastructure in the region. (IEEFA, August 2020)
FACT: Plans to build petrochemical plants in Beaver County, Pennsylvania and Belmont, Ohio, for the sole purpose of manufacturing plastic nurdles will not be as profitable as originally portrayed. (IEEFA Report, June 2020)
A clean energy economy is the only way forward.
FACT: The Dept. of Energy’s U.S. Energy and Employment Report (2017) and E2 Clean Jobs Pennsylvania Report (2020) shows that clean energy jobs in Pennsylvania employ twice as many people as the fossil fuel industry prior to the pandemic.
FACT: The 4-state region of Ohio, West Virginia, Kentucky and Pennsylvania has formed a coalition of labor, policy experts and frontline community leaders called Reimagine Appalachia. This coalition is in the process of addressing the vast number of jobs in renewable and clean energy industries in a report that will be published this fall.
Reimagine Appalachia seeks major federal funding packages that will create jobs, rebuild infrastructure and addresses climate change that will ensure that no one is left behind going forward.
Sources
O’Leary, Sean. “The Not-So-Natural Gas Boom,” Westvirginiaville.com, Aug. 10, 2020.
O’Leary, Sean. “Lies, damned lies, and economic impact studies,” Ohio River Valley Institute, Aug. 31, 2020.
O’Leary, Sean. “Game Unchanged . . . But, Not Unchangeable,” Ohio River Valley Institute, Aug. 11, 2020. Food & Water Watch. “Phantom Jobs: Fracking Job Creation Numbers Don’t Add Up,” March 2020.
Natural Gas Intel
Pa. Dept. of Environmental Protection Energy Programs. 2020 Pennsylvania Energy Employment Report,
Institute for Energy Economics and Financial Analysis (IEEFA). “IEEFA report: Financial risks loom for Shell’s Pennsylvania petrochemicals complex,” June 4, 2020.
IEEFA. “Petrochemicals may be another bad bet for the oil industry,” Aug. 19, 2020.
E2. “Clean Jobs Pennsylvania 2020,” April 15, 2020.
Natural Gas Intel. “Direct Employment in Natural Gas Development Declines by One-Third in Pennsylvania,” Dec. 23, 2016.
PennLive. “How many jobs has Marcellus Shale Really Created?” Jan. 5, 2019.
StateImpact, “Pa. oil and gas jobs down 32 percent since last year,” Dec. 23, 2016.
The Breathe Project is a coalition of citizens, environmental advocates, public health professionals and academics using the best available science and technology to improve air quality, eliminate climate pollution and make our region a healthy, prosperous place to live.
FracTracker Alliance is a 501(c)3 organization that maps, analyzes, and communicates the risks of oil, gas, and petrochemical development to advance just energy alternatives that protect public health, natural resources, and the climate.
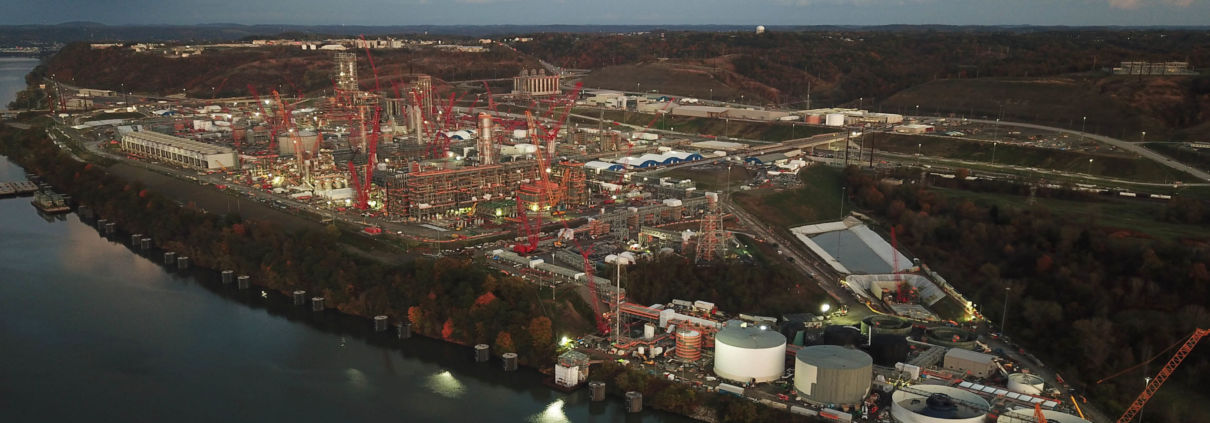
Feature image of construction of the Royal Dutch Shell cracker plant in Beaver County, Pennsylvania, October 2019. Ted Auch, FracTracker Alliance.
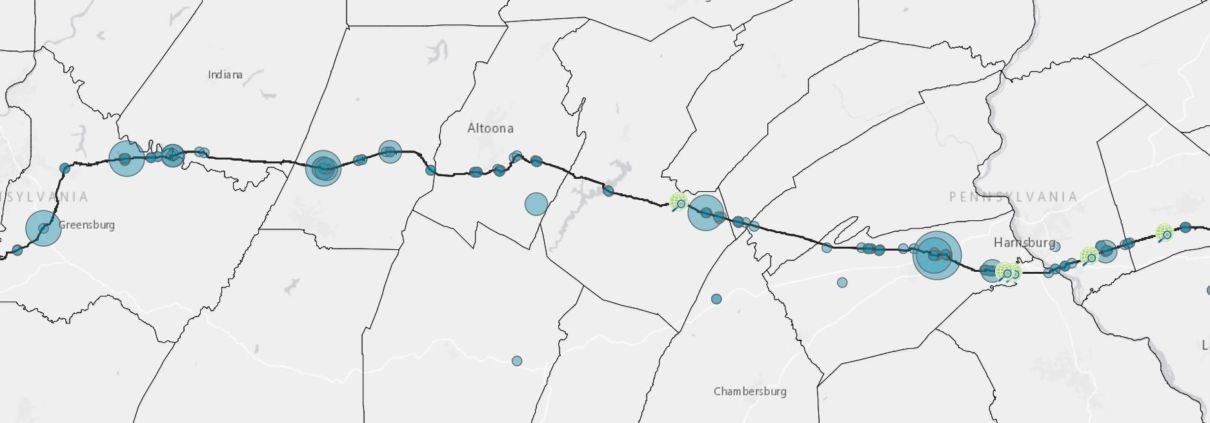
FracTracker Alliance has released a new map of drilling fluid spills along the Mariner East 2 pipeline route, showing 320 spills from its construction since 2017. Of those, a combined 147 incidents have released over 260,000 gallons of drilling fluid into Pennsylvania waterways.
The unpermitted discharge of drilling fluid, considered “industrial waste,” into waters of the Commonwealth violates The Clean Streams Law.
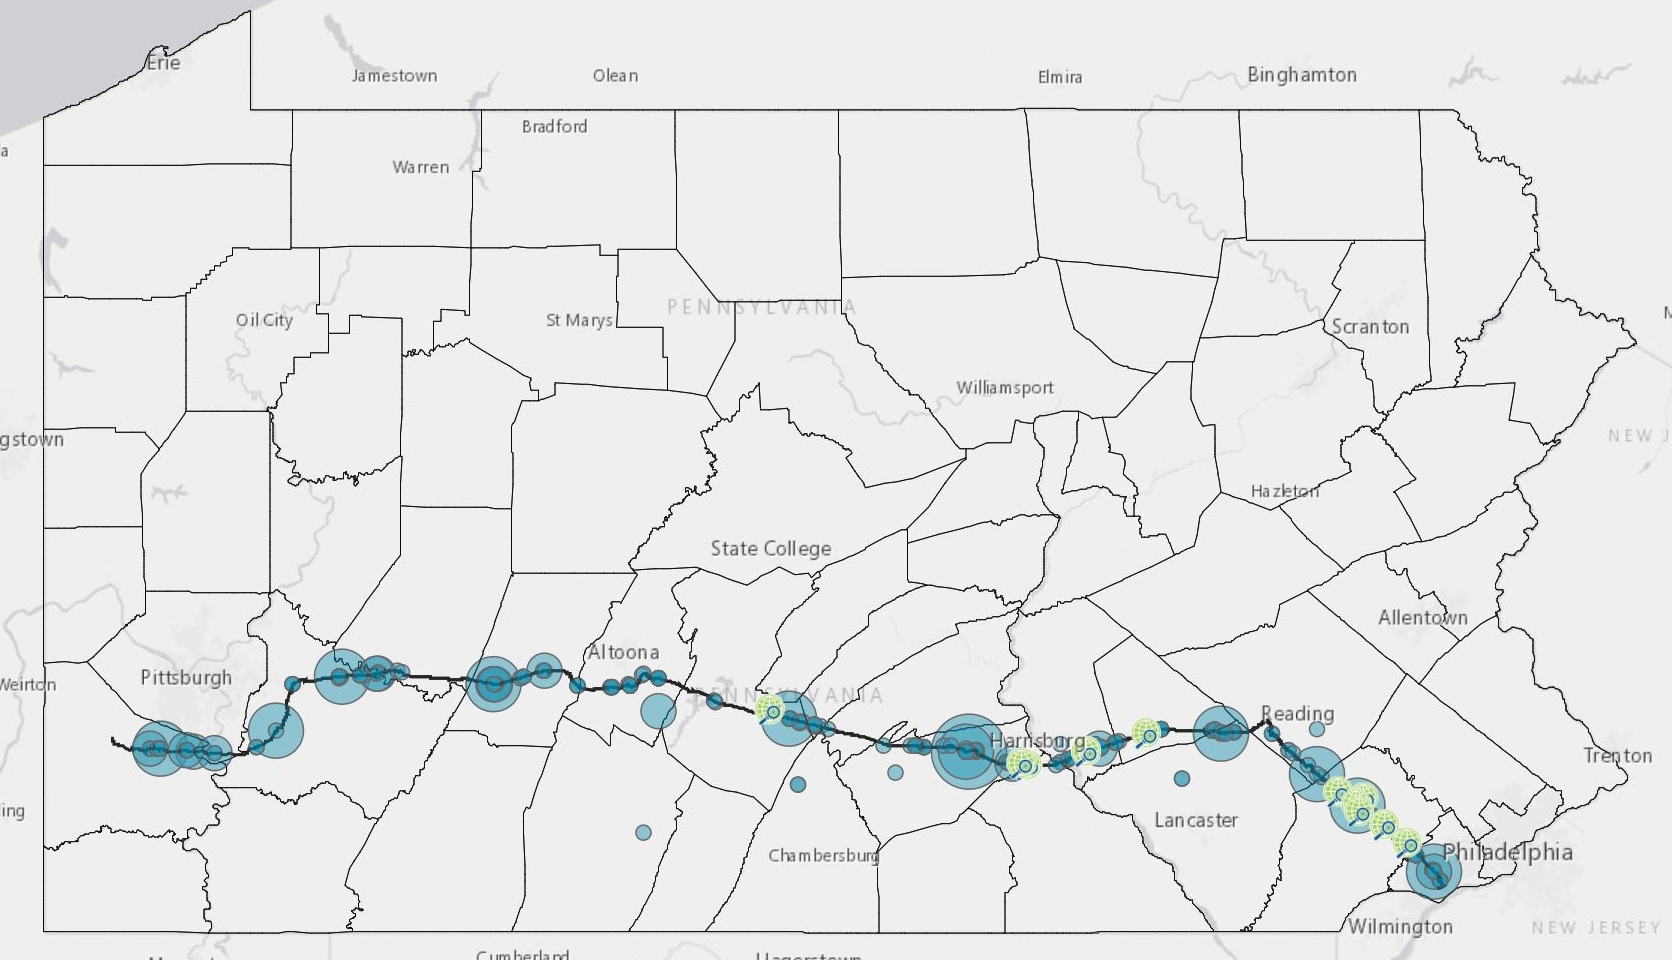
While the total reported volume of drilling fluid released into the environment from the pipeline’s construction is between 344,590 – 405,990 gallons, the actual total is larger, as there are 28 spills with unknown volumes. Spills of drilling mud are also referred to as “inadvertent returns,” or “frac-outs.”
Most of these spills occurred during implementation of horizontal directional drills (HDD). HDDs are used to install a pipeline under a waterway, road, or other sensitive area. This technique requires large quantities of drilling fluid (comprising water, bentonite clay, and chemical additives), which when spilled into the environment, can damage ecosystems and contaminate drinking water sources.
The Mariner East 2 pipeline project is part of the Mariner East pipeline system, which carries natural gas liquids (NGLs) extracted by fracked wells in the Ohio River Valley east, to the Marcus Hook Facility in Delaware County, Pennsylvania. The NGLs will then go to Europe to be turned into plastic. Explore FracTracker’s other resources on this project:
There have been 36 spills since the Commonwealth shutdown statewide on March 16th, 2020, leaks that have jeopardized drinking water sources, putting communities at even higher risk during the COVID-19 pandemic.
The most concerning occurred on August 10th, when pipeline construction released 8,163 gallons of drilling fluids into a wetland and stream system that drains into Marsh Creek Lake in Chester County, a drinking water reservoir (Figure 1). The Department of Environmental Protection (DEP), Pennsylvania Fish and Boat Commission, private contractors, and the Department of Conservation and Natural Resources are responding to the incident and conducting water tests.
On August 11th, construction caused a 15-foot wide and eight-foot deep subsidence event in the wetland (Figure 1). This caused drilling fluid to flow underground and contaminate groundwater, while also “adversely impacting the functions and values of the wetland.” Thirty-three acres of the lake are now closed to boating, fishing, and other uses of the lake — an extra blow, given the solace state parks have provided to many during this pandemic.
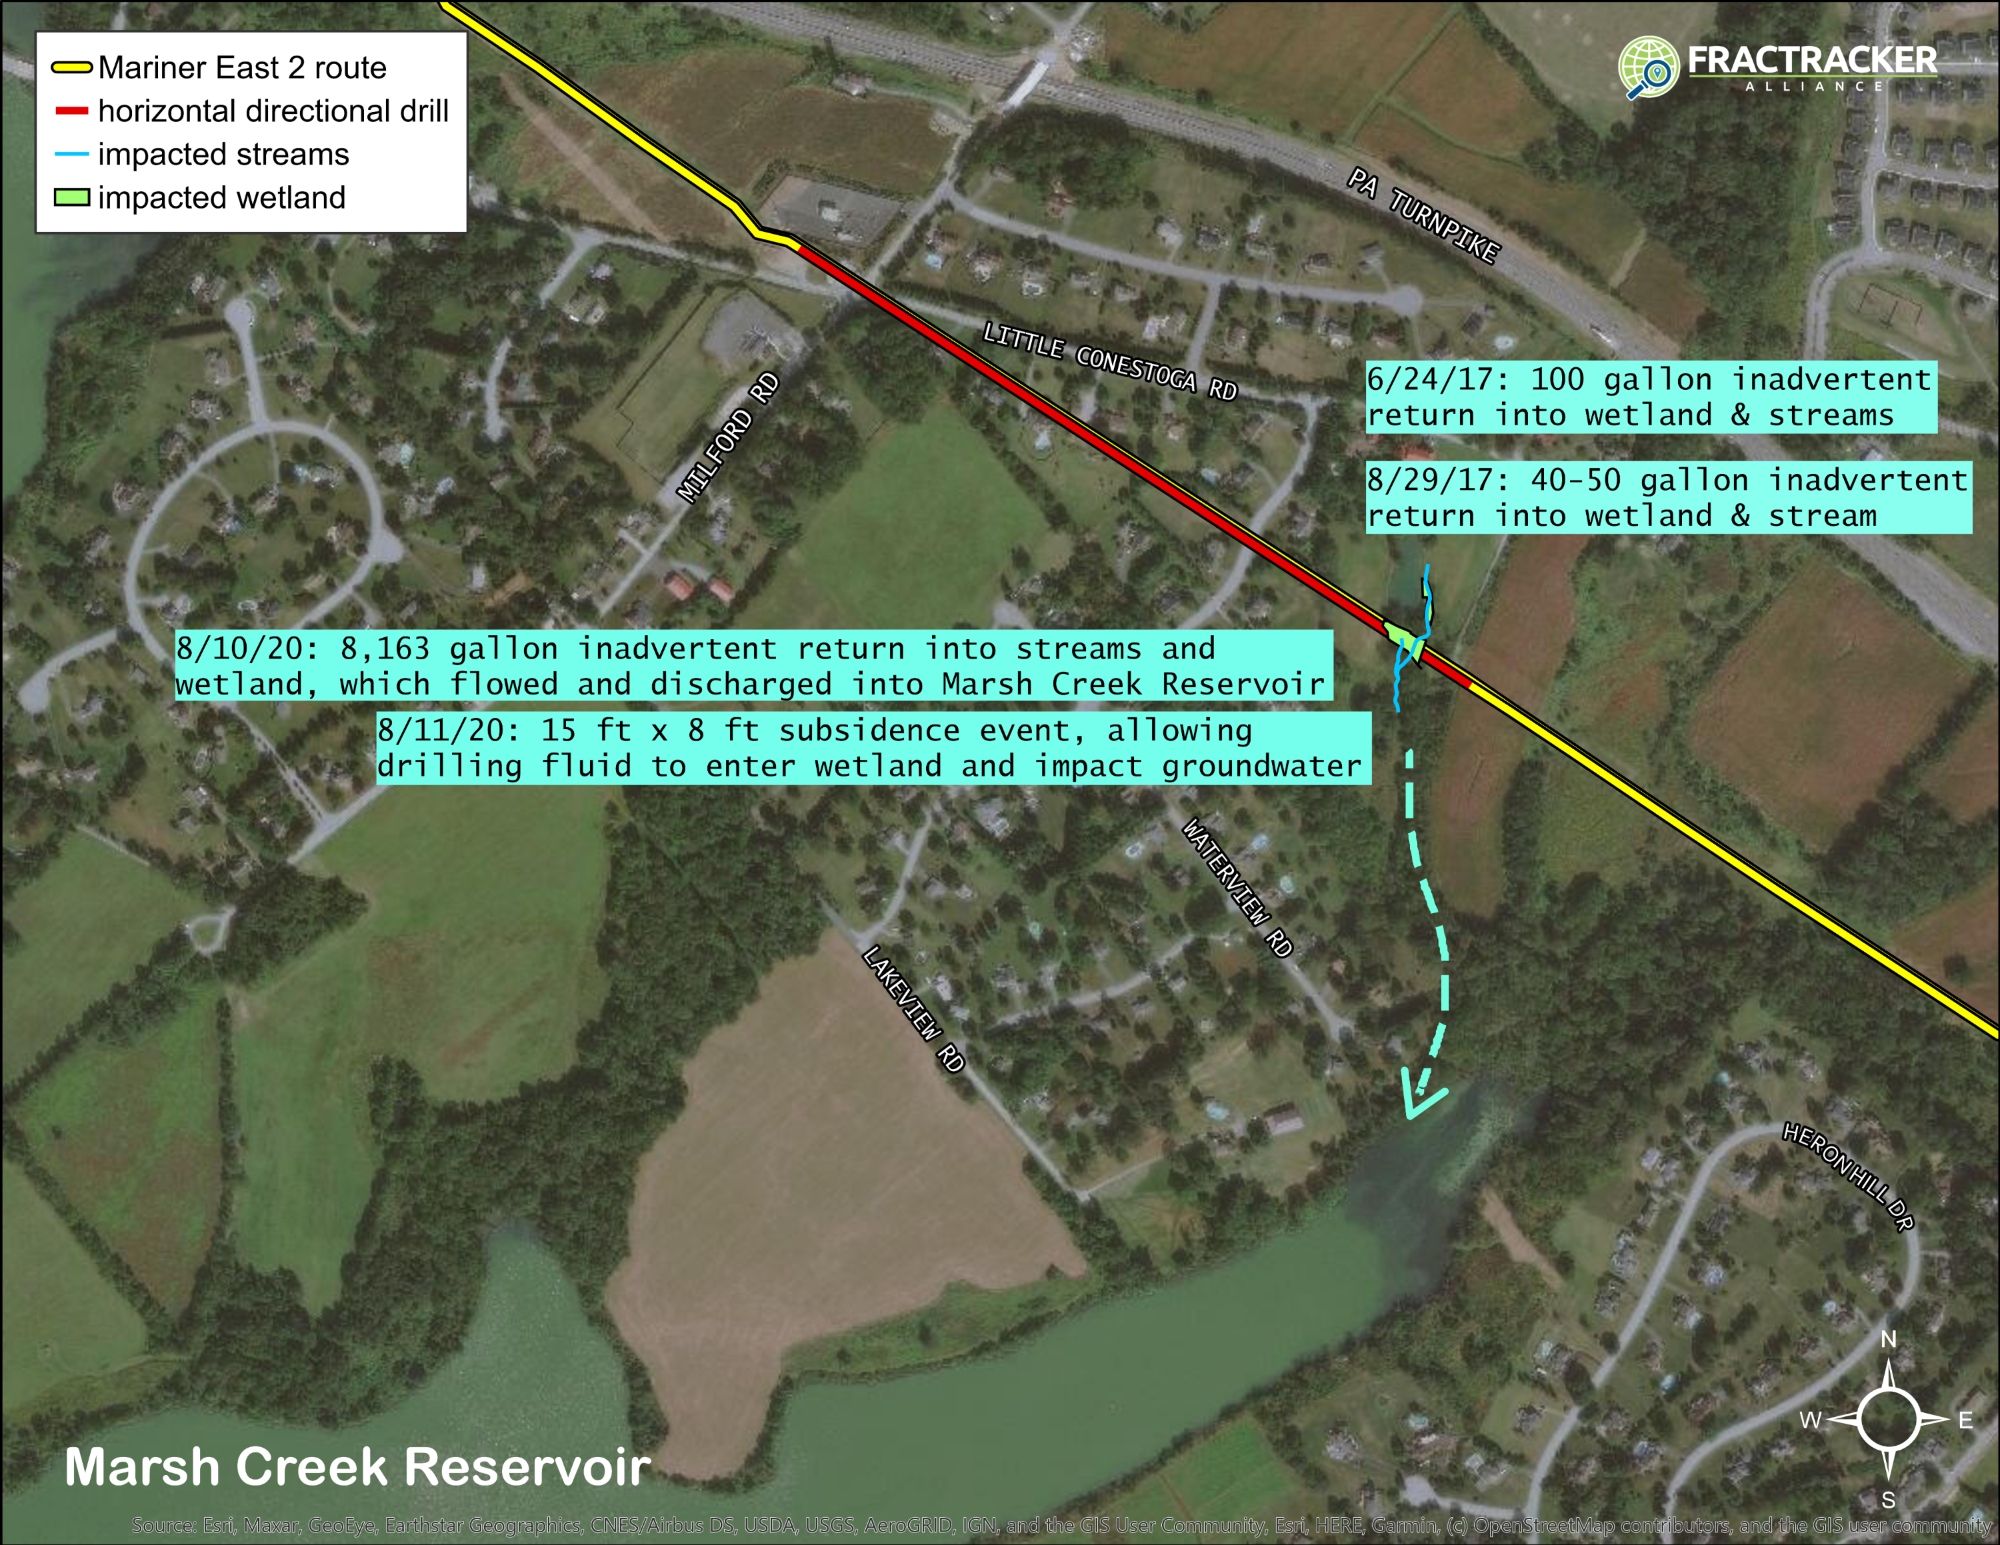
Figure 1. This HDD crossing in Upper Uwchlan Township, Chester County, caused over 8,000 gallons of drilling mud to spill into waterways. However, installation of the parallel 16-inch pipeline also caused spills at this same location in 2017.
A plume of drilling mud, captured here on video, entered the Marsh Creek Lake and settled on the lake bottom.
Last week, the PA DEP ordered Sunoco to suspend work on this HDD site and to implement a reroute using a course Sunoco had identified as an alternative in 2017:
“A 1.01 mile reroute to the north of the HDD is technically feasible. This would entail adjusting the project route prior to this HDD’s northwest entry/exit point to proceed north, cross under the Pennsylvania Turnpike, then proceed east for 0.7 miles parallel to the turnpike, cross Little Conestoga Road, then turn south, cross under the turnpike, and then reintersect the existing project route just east of this HDD’s southeast entry/exit point. There is no existing utility corridor here, however; therefore, this route would create a Greenfield utility corridor and would result in encumbering previously unaffected properties. The route would still cross two Waters of the Commonwealth and possible forested wetlands, and would pass in near proximity or immediately adjacent to five residential home sites. Both crossings of the turnpike would require “mini” HDDs or direct pipe bores to achieve the required depth of cover under the highway. Considered against the possibility of additional IRs [inadvertent returns] occurring on the proposed HDD, which are readily contained and cleaned up with minimal affect to natural resources, the permanent taking of the new 4 easement and likely need to use condemnation against previously unaffected landowners results in SPLP’s opinion that managing the proposed HDD is the preferred option.”
Based on that description, the route could follow the general direction of the dashed line in Figure 2:
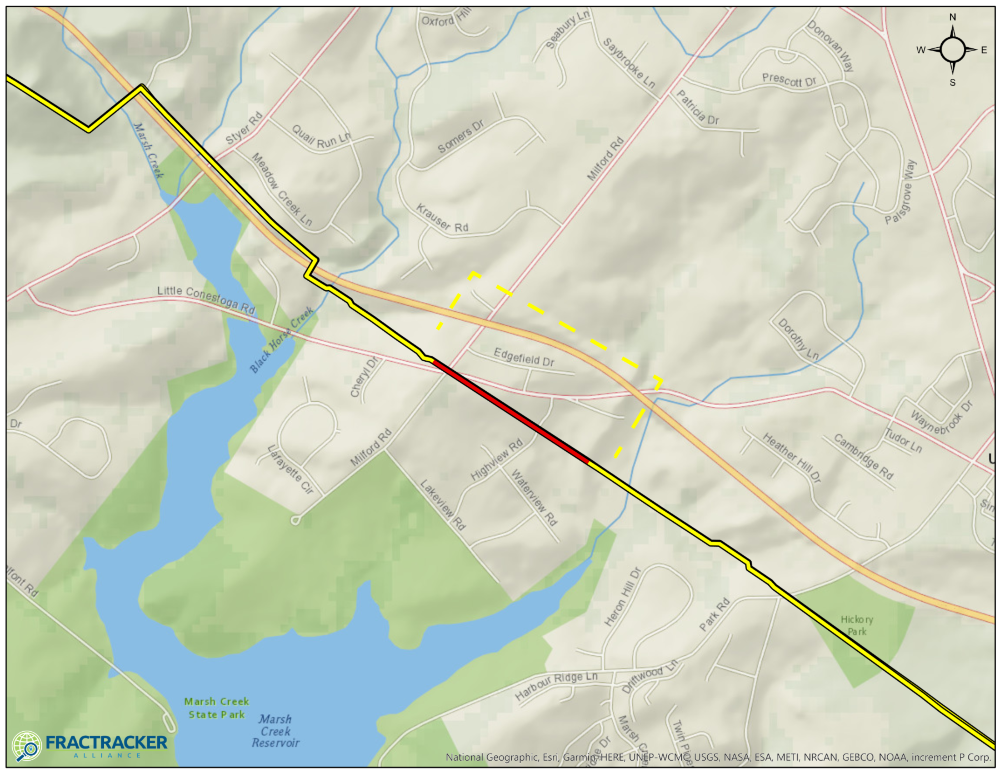
Figure 2. Possible reroute of Mariner East 2 Pipeline shown with dashed line
The DEP’s order also requires Sunoco to restore and remediate “impacted aquatic life, biota, and habitat, including the functions and values of the impacted wetlands resources, and all impacted recreational uses.” Sunoco must submit an Impact Assessment and Restoration Plan for this drill site by October 1, 2020, and the plan must provide for five years of monitoring after its completed restoration. In the meantime, Sunoco must secure the borehole using “grouting or equivalent method,” and continue to monitor the site.
The August incident likely surprised no one, as it was not the first spill at this location, and Sunoco’s own assessment acknowledged that this HDD crossing came with “a moderate to high risk of drilling fluid loss and IRs.”
Residents also sounded alarm bells for this drilling site. The proposal for just this location garnered over 200 public comments, all of which called on the DEP to deny Sunoco’s permit for drilling in this area. Many implored the DEP to consider the alternate route Sunoco must now use.
George Alexander, a Delaware County resident who runs a blog on this pipeline, the Dragonpipe Diary, says, “Sunoco/Energy Transfer continues to demonstrate in real time that they cannot build the Mariner Pipelines without inflicting harm upon our communities … The Marsh Creek situation is reminiscent of the damage to another favorite Pennsylvania lake, Raystown Lake in Huntingdon County.”
In 2017, Sunoco spilled over 200,000 gallons of drilling fluid into Raystown Lake, and released millions more underground. The spill caked acres of the lakebed with a coating of mud, hurting aquatic life and limiting recreational access to the lake. Sunoco failed to report the spills when they occurred, and the DEP fined the company $1.95 million for the incident. The fine is one of many Sunoco has incurred, including a $12.6 million penalty in February 2018 for permit violations, and more recently, a $355,636 penalty for drilling fluid discharges into waterways across eight counties.
On top of the delays, fines, strong public opposition, and even House and Senate members calling for permits to be revoked, there’s another factor working against Sunoco — the bleak financial outlook of the petrochemical industry.
The fracking boom triggered investment in projects to convert the fracked gas to plastic, leading to an oversupply in the global market. The industry made ambitious plans based on the price of plastic being $1/pound. Now, in 2020, the price is 40 – 60 cents per pound. If the Mariner East 2 pipeline is brought online, it likely will not be as profitable as its operators expected.
The poor finances of the oil and gas industry have led to the demise of several pipeline projects over the last few months. Phillips 66 announced in March it was deferring two pipelines — the Liberty Pipeline, which would transport crude oil from Wyoming to Oklahoma — and the Red Oak Pipeline system, planned to cross from Oklahoma to Texas. Kinder Morgan expressed uncertainty for its proposed Texas Permian Pass pipeline, and Enterprise Products Partners cancelled its Midland-to-ECHO crude oil pipeline project. The Atlantic Coast Pipeline also was cancelled this past July by Duke Energy and Dominion Energy, following “an unacceptable layer of uncertainty and anticipated delays,” and the Williams Constitution pipeline was also abandoned after years of challenges. In fact, the EIA recently reported that more pipeline capacity has been cancelled in 2020 than new capacity brought in service.
Will the Mariner East 2 be the next to fall?
A note from the Safety 7: The Safety 7 are seven residents of Delaware and Chester Counties who are challenging Sunoco before the [Pennsylvania Public Utility Commission]. If you are outraged at the ongoing threat to our communities from this dangerous, destructive pipeline, please consider donating to the Safety 7 Legal fund … Our next hearing begins September 29, and funds from your support are urgently needed. This motion is representative of the kind of legal work we need, if we are to prevail in protecting our communities from this dangerous pipeline project. Please contribute today if you are able, and please share this appeal widely and let your friends and family know why this case matters to you!
Learn more and donate here.
By Erica Jackson, Community Outreach and Communications Specialist, FracTracker Alliance
This map and analysis relied on data provided by the Pennsylvania Department of Environmental Protection.
![]()
216 Franklin St, Suite 400, Johnstown, PA 15901
Phone: +1 (717) 303-0403 | info@fractracker.org
FracTracker Alliance is a 501(c)3 non-profit: Tax identification number: 80-0844297
 Ted Auch