New Fortress Energy plans to build a liquefied natural gas (LNG) plant in Wyalusing, Pennsylvania, but residents in close proximity to the extensive facility and those along the transportation routes are pushing back due to health and safety concerns.
Overview
North America has an excess of fracked gas. The price of gas continues to plummet, due largely to an oversupply that exceeds market demand from Americans who want to enjoy their so-called “energy independence.” According to the United States Energy Information Administration (EIA), there is almost 18% more stored gas at the end of 2019 as there was at the end of 2018, translating to an increase of over 500 billion cubic feet over the course of a year.
What was once a promised economic boom to many communities has given way to bust. This is due, in part, to less production across the fracking fields, to the cancellation of numerous pipelines, and to the lack of domestic markets for fracked gas.
As costs for wind, solar, and grid-scale battery storage continue to drop, people are increasingly less reliant on fossil fuels. Aside from underground storage, what can industry do with all that excess product so industry has a justification to keep drilling?
Rather than cutting back on production, industry chooses to relieve domestic over-saturation by sending the gas off-shore for export.
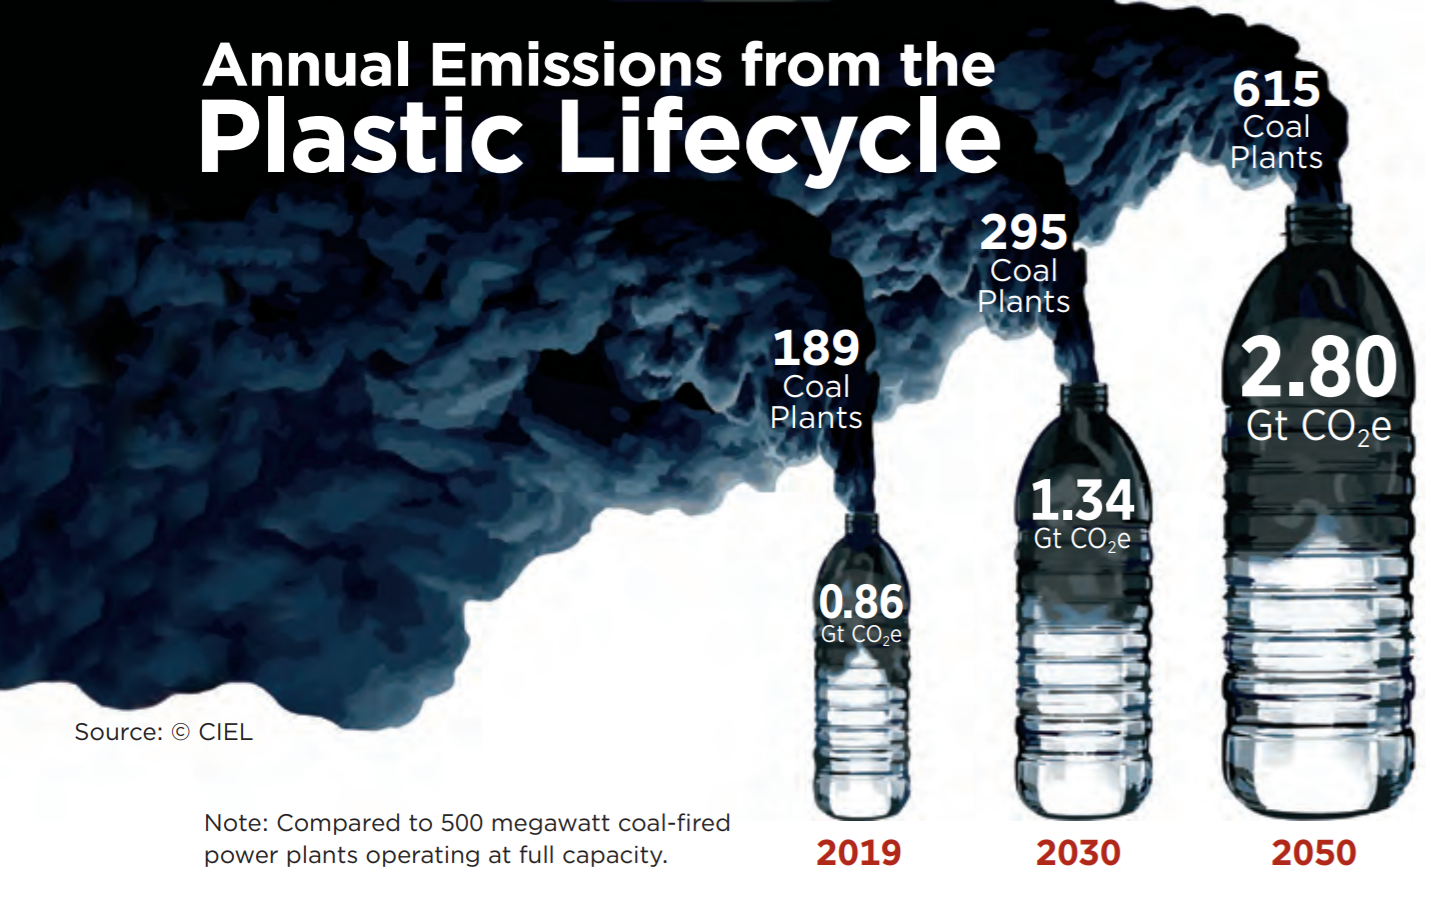
While gas is typically moved from source to consumer via pipelines, transporting gas long distances overseas presents a technical challenge. Industry chooses to compress the gas under pressure or cryogenics so that it takes up less space. Liquefied natural gas, or LNG, is simply super-cooled methane, stored at minus 260 degrees Fahrenheit.
A new LNG project in northern Pennsylvania
A little more than a year ago, New Fortress Energy announced plans to invest $800 million to develop a liquefied natural gas plant along the scenic Susquehanna River in the Bradford County, Pennsylvania community of Wyalusing. In this quiet community of fewer than 600 people, formerly open fields and woodland are slated to be converted into massive LNG complex spanning 260 acres. The plant would produce approximately 3.6 million gallons of LNG each day.
Located on the site of the proposed LNG project is a historic marker, memorializing the pre-Colonial settlement of Friedenshütten. Here, indigenous Mahican, Lenape, and Haudenosaunee converts to Christianity lived with Moravian missionaries. The village was active between 1765 and 1772. According to Katherine Faull of Bucknell University “the Friedenshütten mission was dissolved in 1772, ostensibly because of the uncertainty of the land deals that had been made with the Cayuga who had jurisdiction over that part of Pennsylvania.” Portions of the settlement structure area visible in the 1768 map (Figure 1) are 700 feet from the New Fortress methane liquefaction buildings.
Figure 1. Map by Georg Wenzel Golkowsky, 1768 (TS Mp.213.13, Unity Archives, Herrnhut)
New Fortress Energy has plans to cut a 50-foot-wide stormwater drainage ditch directly through this historic site. Construction of the plant would reportedly create up to 500 temporary jobs, and 50 permanent ones.
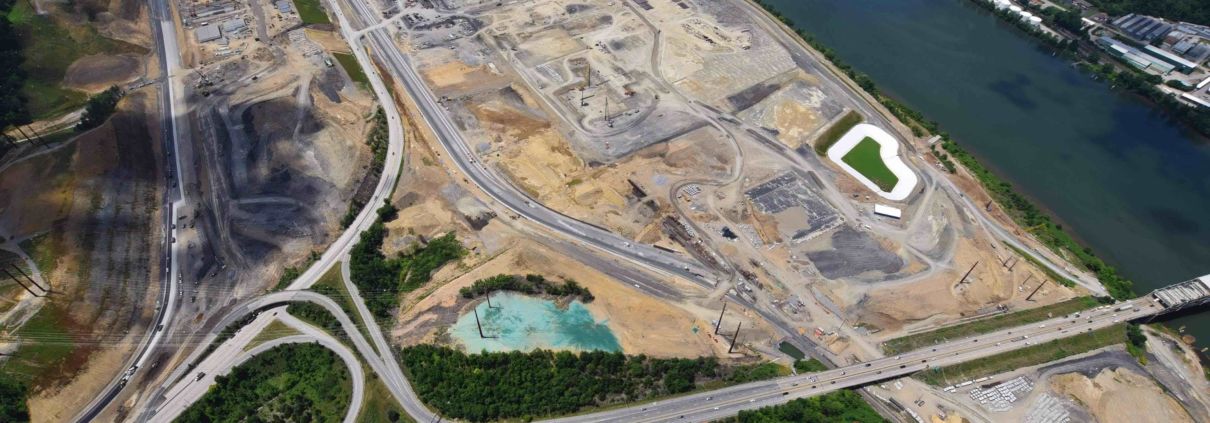
Figure 2. Aerial view of site preparation work at the New Fortress LNG plant site. Source: Ted Auch, FracTracker Alliance
The site plan for the new facility, developed in October 2018, includes large gas engines, a liquefaction facility, a hydrocarbon impoundment basin, LNG storage and pumps, a gas treatment facility, transformers, and tanker staging areas. Some features are sited within 500 feet of the railroad.
Figure 3. Proposed site plan of the New Fortress LNG facility in Wyalusing, Pennsylvania. Map by FracTracker Alliance.
An air quality plan for the New Fortress LNG facility was approved in July, 2019. Although construction was well underway starting in spring 2019, work is currently paused on the site. New Fortress has not indicated when work would resume, but expects the construction process to span two to 2.5 years.
Where to, after Wyalusing?
Without an adequate market for the gas in the United States, LNG is destined for shipping overseas in specially-designed LNG carrier ships. In 2018, according to US government data reported in rigzone.com:
“….28 countries in total received LNG exports during 2018. However, just ten countries accounted for 82 percent of the U.S. LNG direct tanker exports that year and the top four markets shared 187 shipments between them. South Korea, the top destination, received 73 cargoes in all, followed by Mexico with 53, Japan with 37 and lastly China with 24. Of the remainder, Jordan, Chile, India, Turkey, Spain, Argentina, and Brazil took only a small number of shipments each. In addition to the standard large shipments of LNG in dedicated tankers, small shipments of LNG in special containers known as ISOs were sent to the Bahamas and Barbados.”
Presently, plans are in the works for the construction of a new LNG export facility in Gibbstown, New Jersey, located just downstream from Philadelphia on the Delaware River. The Gibbstown site was formerly the home of Dupont Repauno Works, where dynamite was manufactured from 1880 to 1954. Later, the main products made there were commodity chemicals such as nitric acid. The proposed export terminal design includes two 43-foot-deep docks that would accommodate LNG tankers.
The advocacy organization “Empower NJ” provides a comprehensive description here of the proposed expansion of the deepwater LNG export terminal at Gibbstown. LNG delivered to the site would be stored in an old underground cavern previously used by Dupont. While dredging for a single dock at Gibbstown was approved by the Delaware River in 2019, new plans to build two more loading berths at a second dock are now under consideration.
Modes of transportation from Wyalusing to Gibbstown
In collaboration with Delaware Riverkeeper Network (DRN), FracTracker looked at potential overland routes for how the LNG produced in Wyalusing would reach the nearest export terminal in Gibbstown, New Jersey, a distance of 200 or more miles away.
While transportation by rail of liquefied natural gas had not been permitted by federal regulations, a significant change in rules occurred in June 2020. Under pressure from the current administration in Washington, DC, the Pipeline and Hazardous Materials Safety Administration (PHMSA) issued a final rule that authorized the bulk transportation of LNG by rail.
Plans on how to deliver the LNG from the plant in Wyalusing to the export terminal in Gibbstown, New Jersey have not been finalized, and could be by roadway or railway, or both. According to the Wilkes-Barre, Pennsylvania-based Citizen’s Voice:
In its assessment, PHMSA concluded that transporting LNG via roadways carries the same inherent risks as railways, but there is a higher likelihood of an accident because of the larger number of trucks needed compared to train cars.
The DOT-113 tank cars New Fortress received approval for can carry nearly 30,700 gallons of LNG — three times more than a single tanker truck. But, because train cars carry significantly more LNG and are transported together along railways, an incident “could lead to higher consequences,” according to the environmental assessment.
How much risk?
Because there is little to no precedent of transporting such high volumes of liquefied natural gas on roads or railroads, the extent of the disaster that could occur from a leak or crash is generally unknown. However, Delaware Riverkeeper has cited research warning about the unique characteristics of supercooled gas if it rapidly expands and spreads across terrain:
“….transport of LNG has unique safety hazards, exposing those along this particular rail route to unprecedented and unjustifiable risk. An LNG release boils furiously into a flammable vapor cloud 600 times larger than the storage container. An unignited ground-hugging vapor cloud can move far distances,[1] and exposure to the vapor can cause extreme freeze burns. If in an enclosed space, it asphyxiates, causing death.1 If ignited, the fire is inextinguishable; the fire is so hot that second-degree burns can occur within 30 seconds for those exposed within a mile. An LNG release can cause a Boiling Liquid Expanding Vapor Explosion.[2] The explosive force of LNG is similar to a thermobaric explosion – a catastrophically powerful bomb. The 2016 U.S. Emergency Response Guidebook advises fire chiefs initially to immediately evacuate the surrounding 1-mile area.[3] No federal field research has shown how far the vapor cloud can move chiefs initially to immediately evacuate the surrounding 1-mile area.[4] No federal field research has shown how far the vapor cloud can move…”
You can read Delaware Riverkeeper’s full statement of the organization’s opposition to the transportation of LNG in rail cars here.
Visualizing the routes
FracTracker mapped the most likely transport routes by road and by rail, along with demographic information (Figures 5 – 9). In collaboration with DRN, we also assessed minority and low-income population density along each route, using the Environmental Protection Agency (EPA)’s environmental justice (EJ) screening dataset, EJSCREEN. “Minority” as defined by the United States Census data used by EPA, refers to individuals who reported their race and ethnicity as something other than “non-Hispanic White” alone.
On average, around 21% of the population along the truck routes, and about 25% of the population along the train routes, is part of an EJ community. EJ communities are those that are disproportionately impacted by environmental hazards and with increased vulnerability to said hazards. Due to systemic racism, injustice, and poverty, EJ communities tend to have higher proportions of residents who are low-income and/or minorities.
Total Population
Minority Population
Low-Income Population
Truck Route A
612,747
123,071 (20%)
122,830 (20%)
Truck Route B
929,236
207,924 (22%)
183,420 (20%)
Rail Route A
1,649,638
477,816 (29%)
392,577 (24%)
Rail Route B
1,947,544
479,500 (25%)
411,536 (21%)
Figure 4. Demographics of Environmental Justice (EJ) communities along New Fortress Energy’s liquified natural gas (LNG) transportation routes in the eastern United States.
Click here to view this map fullscreen, in its own window.
And click through the tabs below to see static images of the various routes.
Rail Route A
Figure 5. Rail Route A passes within 2 miles of a population of 1,649,638. 29% (477,816 individuals) are minorities, and 24% (392,577 individuals) are low income, according to 2010 US Census data compiled by the Environmental Protection Agency as part of their EJSCREEN program. Map made by FracTracker Alliance and published by Delaware Riverkeeper Network.
Rail Route B
Figure 6. Rail Route B passes within 2 miles of a population of 1,947,544. 25% (479,500 individuals) are minorities, and 21% (411,536 individuals) are low income, according to 2010 US Census data compiled by the Environmental Protection Agency as part of their EJSCREEN program. Map made by FracTracker Alliance and published by Delaware Riverkeeper Network.
Rail Route A Detail
Figure 7. Detail of Rail Route A close to proposed export terminal, and showing minority population density within 2 miles of the route. Map made by FracTracker Alliance and published by Delaware Riverkeeper Network.
Rail Route B Detail
Figure 8. Detail of Rail Route B close to proposed export terminal, and showing population density within 2 miles of the route. Map made by FracTracker Alliance and published by Delaware Riverkeeper Network.
Truck Route A
Figure 9. Truck Route A passes within 2 miles of a population of 612,747. 20% (123,071 individuals) are minorities, and 20% (122,830 individuals) are low income, according to 2010 US Census data compiled by the Environmental Protection Agency as part of their EJSCREEN program. Map made by FracTracker Alliance and published by Delaware Riverkeeper Network.
Truck Route B
Figure 10. Truck Route B passes within 2 miles of a population of 929,236. 22% (207,924 individuals) are minorities, and 20% (183,420 individuals) are low income, according to 2010 US Census data compiled by the Environmental Protection Agency as part of their EJSCREEN program. Map made by FracTracker Alliance and published by Delaware Riverkeeper Network.
Truck Route A Detail
Figure 11. Detail of Truck Route A close to proposed export terminal, and showing minority population density within 2 miles of the route.
Truck Route B Detail
Figure 12. Detail of Truck Route B close to proposed export terminal, and showing minority population density within 2 miles of the route. Map made by FracTracker Alliance and published by Delaware Riverkeeper Network.
Growing municipal and regulatory opposition to transport of LNG through communities
Municipal opposition against the plan to construct the LNG facility at Wyalusing is mounting. On Wednesday, September 2, 2020, the Borough Council of Clarks Summit, Pennsylvania (Lackawanna County) voted in opposition to the New Fortress Energy LNG project. Their resolution asked the Delaware River Basin Commission to vote to disapprove Dock 2, the cargo destination of the LNG trucks and trains that will be traversing Lackawanna County with their hazardous content.
And in most recent news, on September 10, the Delaware River Basin Commission (DRBC) voted to delay approving an application to expand the port facilities at Gibbstown, NJ that would have enabled LNG tankers to dock there. In this important turn of events, the representatives from New York, Delaware and New Jersey voted for the delay, while the Pennsylvania representative abstained, and the Federal representative from the US Army Corps of Engineers voted to deny it. The vote was preceded by a comment period in which the public expressed unanimous desire to stop the project, citing impacts to human and environmental health, as well as impacts from methane on climate catastrophe.
In the upcoming months, prior to when they meet again until December, the DRBC will more deeply consider the details of the application. Until that time, forward progress on the LNG plant and the export terminal is effectively halted.
8/24/21: This article was updated with the following information:
At their December meeting, the DRBC issued a final approval for construction of the terminal to move ahead, voting 4-0 in favor of the proposal, with the representative from New York State abstaining.
In conclusion
As communities start to consider the impacts to health and safety posed by massive fossil fuel infrastructure—whether that is pipelines, compressor stations, drilling operations, or rail and road transport—clean energy alternatives like solar, wind, and geothermal become the sensible option for all. We applaud the elected officials in Clarks Summit for their vote early this month, and look forward to more following suit.
To stay up to date on the regional pushback against LNG and engage your voice in resistance, learn more at protectnorthernpa.org or sign-up to become an E-activist with Delaware Riverkeeper Network.
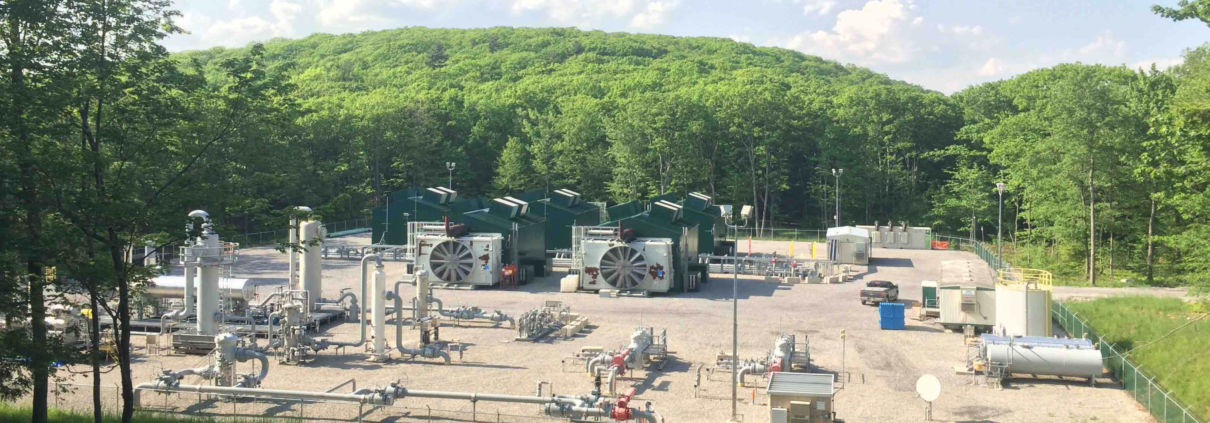
Feature photo by Ted Auch, FracTracker Alliance, with aerial support by Lighthawk
[1] “Immediate ignition with liquid still on the ground could cause the spill to develop into a pool fire and present a radiant heat hazard. If there is no ignition source, the LNG will vaporize rapidly forming a cold gas cloud that is initially heavier than air, mixes with ambient air, spreads and is carried downwind.” P. 10 “Methane in vapor state can be an asphyxiant when it displaces oxygen in a confined space.” P. 11. SP 20534 Special Permit to transport LNG by rail in DOT-113C120W rail tank cars. Final Environmental Assessment. Docket No. PHMSA-2019-0100. December 5, 2019. P. 10.
[2] “LNG tank BLEVE is possible in some transportation scenarios.” Sandia National Laboratories, “LNG Use and Safety Concerns (LNG export facility, refueling stations, marine/barge/ferry/rail/truck transport)”, Tom Blanchat, Mike Hightower, Anay Luketa. November 2014. https://www.osti.gov/servlets/purl/1367739 P. 23.
https://www.fractracker.org/a5ej20sjfwe/wp-content/uploads/2020/09/Aerial-view-of-site-preparation-work-at-the-New-Fortress-LNG-plant-site-scaled.jpg5681500Karen Edelsteinhttps://www.fractracker.org/a5ej20sjfwe/wp-content/uploads/2025/09/2025-Wordmark-Logo.pngKaren Edelstein2020-09-15 10:13:212021-08-24 14:53:19LNG development puts Wyalusing, Pennsylvania in the cross-hairs
By Emma Vieregge, FracTracker Summer 2020 Environmental and Health Fellow
Overview
Unconventional oil and natural gas development, or “fracking,” began in Pennsylvania in the early 2000s. Since then, over 12,000 unconventional wells have been drilled in the state, and over 15,000 violations have been documented at unconventional well sites. As fracking operations continue to expand, increasing numbers of residents have experienced significant health impacts and irreparable damage to their property. Southwest Pennsylvania in particular has been heavily impacted, with high concentrations of oil and gas infrastructure developed in Washington, Greene, and Fayette Counties.
Fracking operations have led to declining air quality, water and soil contamination, and drastic changes to the physical landscape including deforestation, habitat fragmentation, road construction, and damaged farmland. While the volume of scientific literature about the physical and mental health impacts of fracking is rising, few studies exist that specifically focus on residents’ perceptions of the changing physical landscape. The primary goal of this qualitative study was to identify residents’ attitudes about the changing physical landscape resulting from fracking operations. Furthermore, how have these landscape changes affected residents’ engagement with the outdoors and their overall health?
Mental health, green spaces, and a changing landscape
Many scientific studies have documented the relationship between fracking developments and mental health, and between mental health and access to green spaces and engagement with the outdoors. Peer-reviewed studies have looked at heavily fracked communities across the US, many of which focus on Pennsylvania residents. Methods typically involve one-on-one interviews, larger focus groups, surveys, or a combination of the three, to identify how living amongst oil and gas operations takes a toll on everyday life. These studies have found an increase in stress and anxiety, feelings of powerlessness against the oil and gas industry, social conflicts, sleep disturbances, and reduced life satisfaction. Additionally, residents have experienced disruptions in their sense of place and social identity. For a summary of published research about the mental health impacts from fracking, click here.
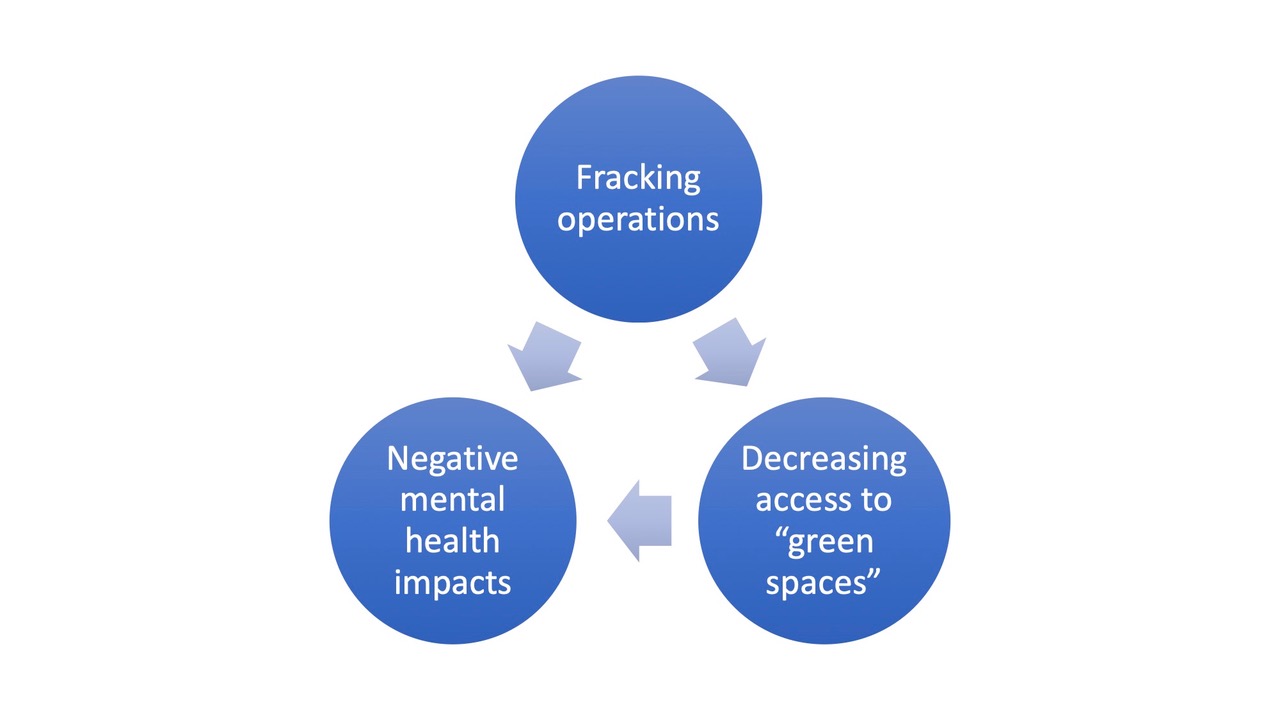
A healthy strategy many choose to cope with stress and anxiety is engagement in outdoor recreation. Having easily accessible “green spaces,” or land that is partly or completely covered with grass, trees, shrubs, or other vegetation such as parks and conservation areas have been shown to promote physical and mental health. Many scientific studies have identified significantly fewer symptoms of depression, anxiety, and stress in populations with higher levels of neighborhood green space.1 Additionally, green spaces can aid recovery from mental fatigue and community social cohesion.2 3 However, residents in Southwestern Pennsylvania may slowly see their access to green spaces and opportunities for outdoor recreation decline due to the expansion of fracking operations. Figure 1 below shows a visual representation of the interconnected relationship between fracking, access to green spaces, and negative mental health impacts.
Figure 1. The interconnected relationship between fracking operations, landscape changes and decreasing access to outdoor recreation, and negative mental health impacts.
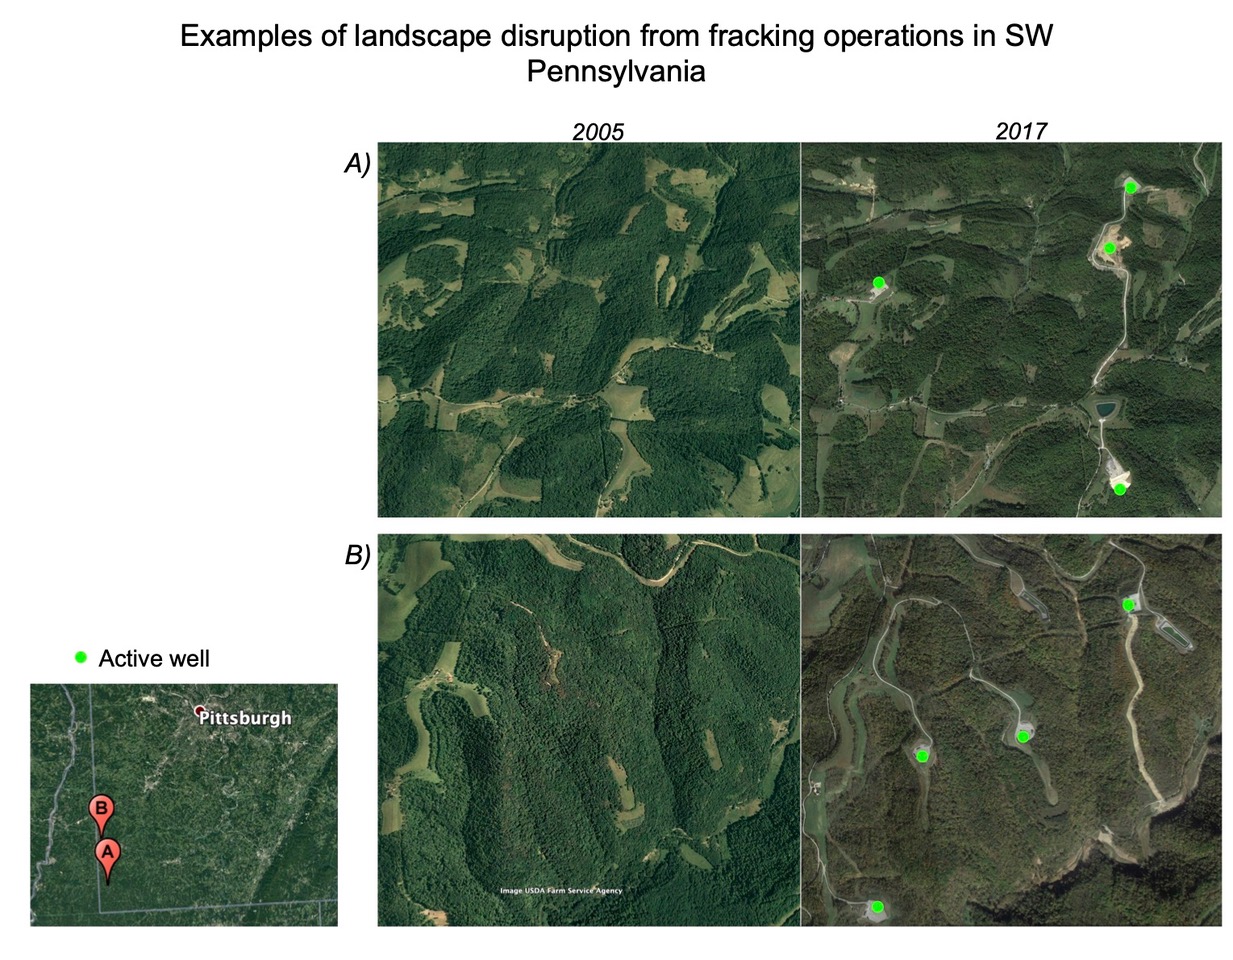
In the last 10-15 years, fracking operations in Southwest Pennsylvania have exploded. The development of new pipelines, access roads, well pads, impoundments, and compressor stations is widespread and altering the physical landscape. Figure 2 below illustrates just one of many examples of landscape disruption caused from fracking operations.
Figure 2. Examples of changes in the physical landscape caused from fracking operations in Greene County (A) and Washington County (B), Pennsylvania. Images taken from Google Earth.
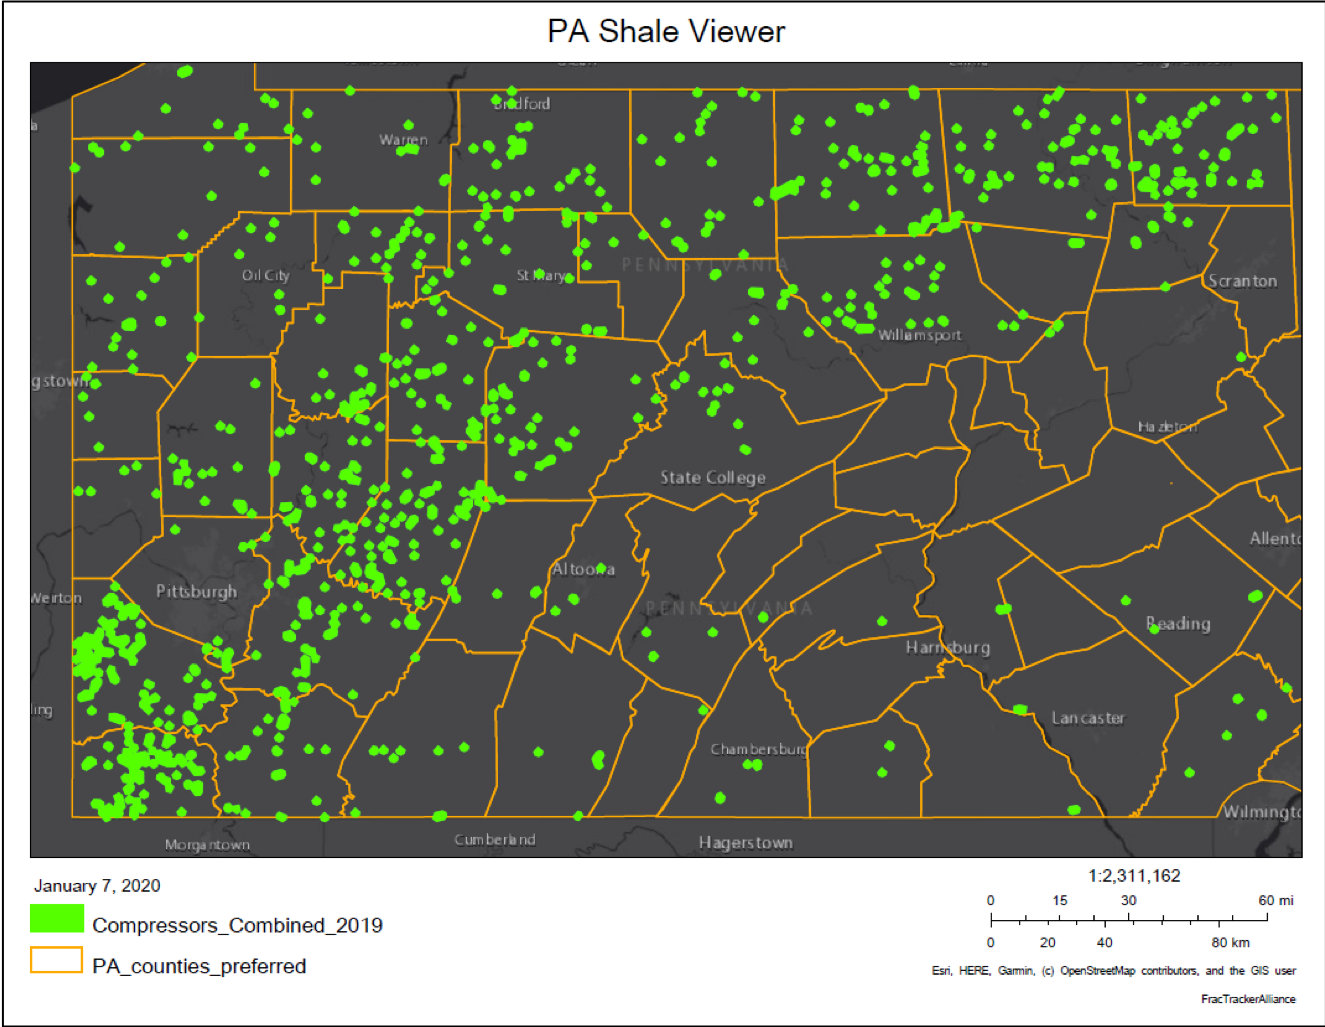
Additionally, this time-slider map (Figure 3) illustrates a larger scale view of landscape changes in Greene County, Pennsylvania in a region just east of Waynesburg.
Figure 3. Time-slider map of a region in Greene County, PA where the left portion of the map is imagery from 2005, and the right portion of the map is from 2017. Active oil and gas wells are indicated by a blue pin, and compressor stations are in green.
Study design
A qualitative study was conducted to answer the following research questions:
What are residents’ perception of the landscape changes brought about by fracking?
Have these landscape changes caused any mental health impacts?
Have changes to the physical landscape from oil and gas operations resulting in any changes in engagement with outdoor recreation?
To better understand these topics, residents living in Southwestern Pennsylvania were recruited to participate in one-on-one phone interviews, and an online survey was also distributed throughout the FracTracker Alliance network. Recruitment for the one-on-one phone interviews was accomplished through FracTracker’s social media, and email blasts through other partnering organizations such as Halt the Harm Network, People Over Petro, and the Clean Air Council. Similarly, the online survey was shared on FracTracker’s social media and also distributed through our monthly newsletter. Since this was not a randomized sample to select participants, these results should not be generalized to all residents living near oil and gas infrastructure. However, this study identifies how certain individuals have been impacted by the changing landscape brought about by fracking operations.
Eight residents completed phone interviews, all of whom resided in Washington County, PA. Residents were first asked how long they have lived in their current home, and if there was oil and gas infrastructure on or near their property. Oil and gas infrastructure was defined as well pads, compressor stations, pipelines, ponds or impoundments, or access roads. Next, residents were asked if they had any health concerns regarding fracking operations and gave personal accounts of how fracking operations have altered the physical landscape near their home and in their surrounding community. For those with agricultural land, additional questions were asked about fracking’s impact on residents’ ability to use their farmland. Lastly, residents were asked questions focused on engagement in outdoor recreation and if fracking had any impact on outdoor recreation opportunities. NVivo, a qualitative analysis software, was used identify emergent themes throughout the interviews,
In addition to the interviews, an online survey was also made available.The main purpose of the survey was to gauge where concerns about landscape changes from fracking operations fell in relation to other oil and gas impacts (i.e. air pollution, water contamination, excess noise and traffic, and soil contamination). Nine responses were recorded, and the results are discussed below. However, if you would like to add your thoughts, you can find the survey at https://www.surveymonkey.com/r/Z5DCWBD.
Main findings and emergent themes
Various emergent themes surrounding the oil and gas industry’s impact on public health and the environment were identified throughout the resident interviews. Residents shared their personal experiences and how they have been directly impacted by fracking operations, especially with reference to the changing physical landscape surrounding their homes and throughout their communities. Participants’ time of residence in Washington County ranged from 3 years to their entire life, and all participants had oil and gas infrastructure (well pad, pipelines, impoundment, access roads, or compressor station) on or next to their property.
Changes to the physical landscape and residents’ attitudes toward the altered environment
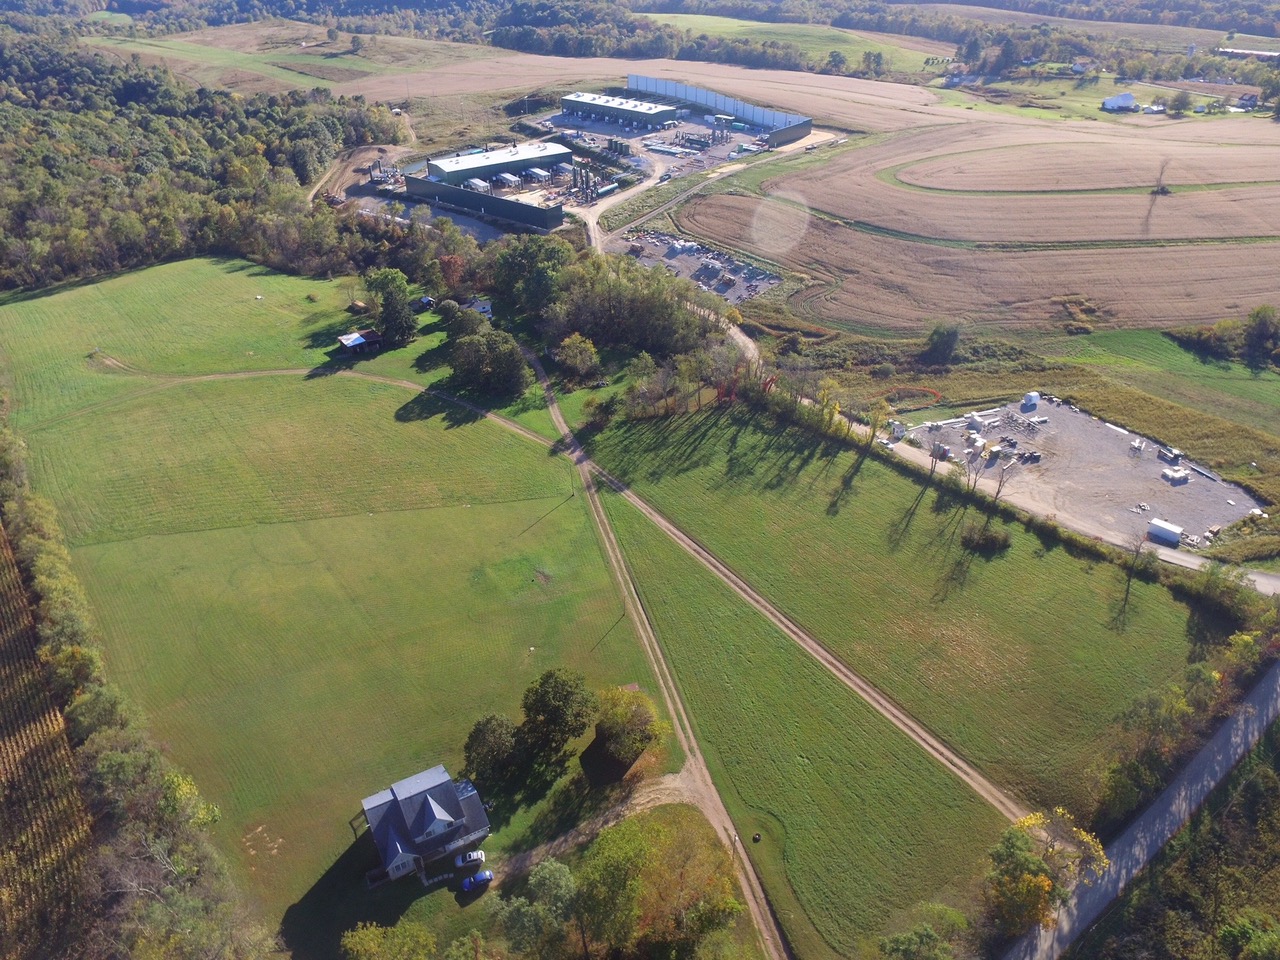
The first overarching theme was changes to the physical landscape and residents’ attitudes toward the altered environment. All interview participants expressed concerns about the changes to the physical landscape on or surrounding their property, especially regarding access roads and well pads. Although one participant mentioned that widening the township road in order to make room for fracking trucks benefited the local community, the majority of participants expressed frustration about the construction of access roads, excessive truck traffic, noise, and dust from the unpaved access roads. One individual stated, “My main concern is the dust from the road. I’m constantly breathing that in, and it’s all over my shed, on the cars, the inside of the house, the outside of the house.” Multiple participants discussed the oil and gas operations disrupting what was once peaceful farmland with beautiful scenery (see an example in Figure 4 below). Another individual stated, “And of course, the noise is just unbearable. They don’t stop…the clanging on the pipe, the blow off with the wells, pumps running, generators, trucks coming down the hill with their engine brakes on, blowing their horn every time they want another truck to move.”
Figure 4. Aerial view of oil and gas infrastructure next to a home in Scenery Hill, PA. Image courtesy of Lois Bower-Bjornson from the Clean Air Council.
Impacts to outdoor recreation activities
Impacts to outdoor recreation activities such as hunting, fishing, and hiking were another recurring theme throughout the interviews. Again, a majority of participants believed their opportunities to partake in outdoor recreation have been limited since fracking operations began in their area.
Among the top concerns was deteriorating air quality and increasing numbers of ozone action days, or days when the air quality index (AQI) for ozone reaches an unhealthy level for sensitive populations. Various participants expressed concerns about letting their children outside due to harmful air emissions and odors originating from well pads or compressor stations. Excessive truck traffic was also a safety concern that was mentioned, especially for those individuals with access roads on or neighboring their property.
Additionally, one individual noted landscape changes in areas commonly used for hiking stating, “You might be hiking along a trail and then realize that you’re no longer on the trail. You’re actually on a pipeline cut. Or you’ll get confused while you’re hiking because you’ll intersect with a road that was developed for a well pad, and it’s not on your map.” Along with hiking, participants also noted a change in hunting and fishing opportunities since fracking moved into the region. Concerns were expressed regarding harvesting any fish or wild game due to possible contamination from fracking chemicals, especially near watersheds with known chemical spills.
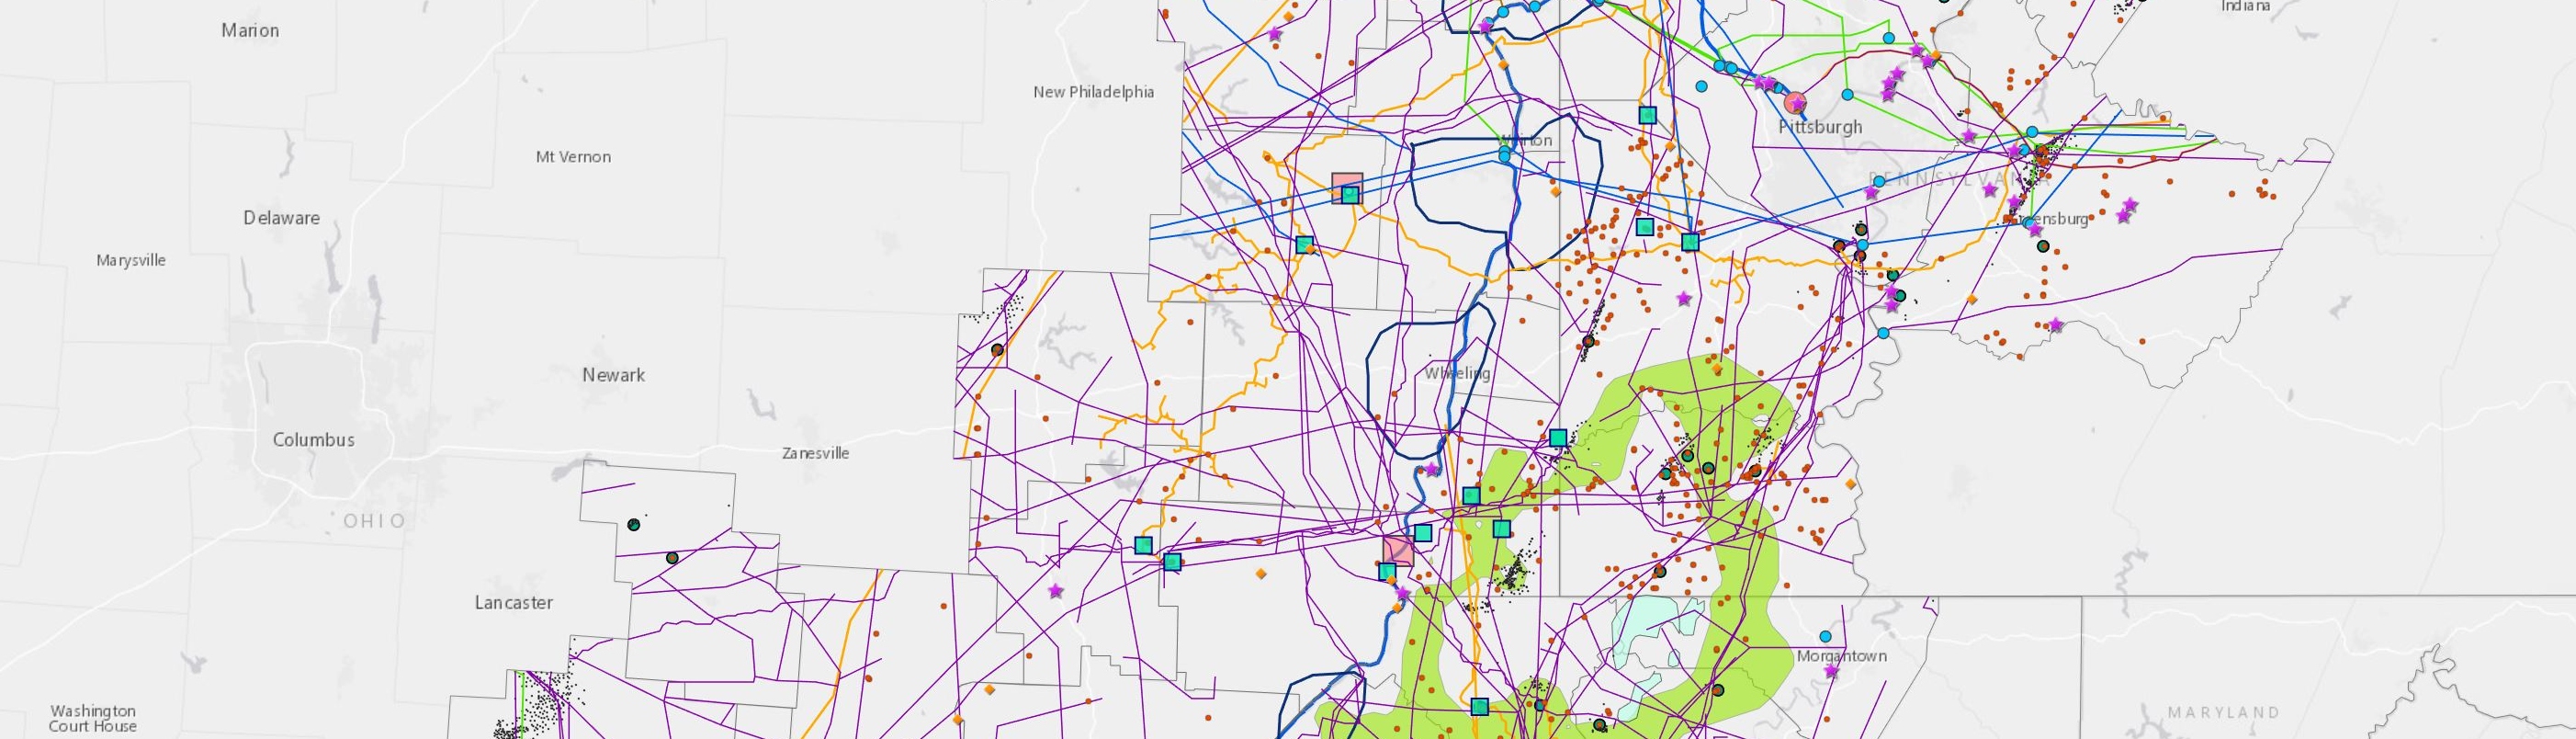
Going for a hike and immersing oneself in nature is a healthy way to unwind and relieve stress. However, a rising number of well pads and compressor stations are put in place near parks, hiking trails, and state game lands throughout Southwest Pennsylvania (Figure 5). Participants expressed concerns about feeling unable to escape oil and gas infrastructure, even when visiting these recreational areas. As one individual mentioned, “It really does change your experience of the outdoors. And, you know, it’s an area that’s supposed to be a protected natural area. Then you know you can’t really get away. Even there in public lands far away from buildings and roads. And you can’t really get away from it.”
Figure 5. A map of active oil and gas well pads and compressor stations in Washington County, Pennsylvania. Map layers also indicate wells pads and compressor stations within 1 mile of a park, hiking trail, ball park, or state game land.
But what are the mental health impacts that result from the changing physical landscape brought about by fracking? Aside from the physical health effects caused by fracking activity — such as respiratory illnesses from air pollution or skin irritation from contaminated well water — these landscape changes have taken a toll on participants’ mental health as well.
Sentimental value and emotional distress
Many participants described the sentimental value of their property, and the beautiful scenery surrounding their generational family farms. But after fracking began on neighboring property, witnessing their tranquil family farm suddenly become surrounded by dusty access roads, excessive truck traffic, noise, and deteriorating air quality took a serious emotional and mental toll. When asked about the impact of the changing landscape, one participant stated, “It’s the emotional part of watching her childhood farm being destroyed while she is trying to do everything she can to rebuild it to the way it used to be.”
An additional emergent theme surrounding fracking landscape changes was surrounding agricultural impacts. Participants with agricultural land were asked additional questions about fracking’s impacts on their ability to use their farmland. One individual noted that one of their fields was now unusable due to large rocks and filter fabrics left from construction of a well pad, and redirected runoff uphill of their fields. The loss of productive farmland has further contributed to the mental and emotional stress. One participant added, “Our house is ruined, our health is ruined, and our farms are ruined.” In addition to agricultural impacts on large farms, multiple participants also mentioned concerns about their smaller-scale gardens, citing uncertainty about the impacts of air pollution and soil contamination on their produce.
Feelings of powerlessness and social tension
Some participants mentioned feelings of powerlessness against the oil and gas industry. Many families were not consulted prior to fracking operations beginning adjacent to their property. In some cases, this has resulted in significant declines in property values, leaving residents with no financial means to escape oil and gas activity. It is important to note that many residents are given temporary financial incentives to allow fracking on their land. However, to some, the monetary compensation failed to make up for the toll fracking took on their physical and mental health. Lastly, some participants also mentioned feeling stress and anxiety from the social tension resulting from fracking. Debates about the restrictions and regulations on fracking have divided many communities, leading to conflicts and social tensions between once-amiable neighbors.
Survey results
In addition to the interviews, an online survey was distributed to gain more insight as to where concerns about the changing physical landscape fell in relation to other effects associated with oil and gas development (such as poor air quality, water or soil contamination, truck traffic, and noise).
Nine individuals responded to the survey, all of whom indicated having oil and gas infrastructure within five miles of their home. All respondents also indicated that they participated in a wide variety of outdoor recreation activities such as hiking, wildlife viewing/photography, camping, hunting, and fishing.
Interestedly, only five respondents stated they felt fracking had a negative impact on their health, three responded they were unsure, and one responded no. However, all participants felt fracking had a negative impact on their surrounding environment. When discussing outdoor recreation, eight of nine respondents stated they felt fracking limited their access to outdoor recreation opportunities.
Next, respondents indicated that the level of concern related to the changing landscape brought about by fracking was equal to concerns about air pollution, water and soil contamination, noise, and truck traffic (using a 5-point likert scale). Lastly, one respondent stated that they closed their outdoor recreation tourism business due to blowdown emission (the release of gas from a pipeline to the atmosphere in order to relieve pressure in the pipe so that maintenance or testing can take place) and noise from fracking operations.
Conclusion and future directions
In summary, fracking operations have deeply impacted these individuals living in Washington County, Pennsylvania. Not only do residents experience deteriorating air quality, water contamination, and physical health effects, but the mental and emotional toll of witnessing multigenerational farms become forever changed can be overbearing. Other mental health impacts included rising social tensions, feelings of powerlessness, and continuous emotional distress. Fracking operations continue to change the physical landscape, tarnishing Southwest Pennsylvania’s natural beauty and threatening access to outdoor recreation opportunities. Unfortunately, those not living in the direct path of fracking operations struggle to grasp the severity of fracking’s impact on families living with oil and gas infrastructure on or near their property. More widespread awareness of fracking’s impacts is needed to educate communities and call for stricter enforcement of regulations for the oil and gas industry. As one resident summed up their experiences,
“Engines are running full blast, shining lights, and just spewing toxins out there. And you can’t get away from it. You just can’t. You can’t drink the water. You can’t breathe the air. You can’t farm the ground. And you’re stuck here.”
Hopefully, shedding light on residents’ experiences such as these will bring policymakers to reconsider fracking regulations to minimize the impact on public health and the surrounding environment.
By Emma Vieregge, FracTracker Summer 2020 Environmental and Health Fellow
Acknowledgements
The 2020 Environmental Health Fellowship was made possible by the Community Foundation for the Alleghenies and the Heinz Endowments.
Many thanks to all participants who took the time to share their experiences with me, Lois Bower-Bjornson with the Clean Air Council, Jessa Chabeau at the Southwest Pennsylvania Environmental Health Project, and the FracTracker team for all of their feedback and expertise.
Feature image courtesy of Lois Bower-Bjornson from the Clean Air Council.
References:
1 Beyer, K., Kaltenbach, A., Szabo, A., Bogar, S., Nieto, F., & Malecki, K. (2014). Exposure to Neighborhood Green Space and Mental Health: Evidence from the Survey of the Health of Wisconsin. International Journal of Environmental Research and Public Health,11(3), 3453-3472. doi:10.3390/ijerph110303453
2 Berman, M. G., Kross, E., Krpan, K. M., Askren, M. K., Burson, A., Deldin, P. J., . . . Jonides, J. (2012). Interacting with nature improves cognition and affect for individuals with depression. Journal of Affective Disorders,140(3), 300-305. doi:10.1016/j.jad.2012.03.012
3 Maas, J., Dillen, S. M., Verheij, R. A., & Groenewegen, P. P. (2009). Social contacts as a possible mechanism behind the relation between green space and health. Health & Place,15(2), 586-595. doi:10.1016/j.healthplace.2008.09.006
https://www.fractracker.org/a5ej20sjfwe/wp-content/uploads/2020/08/Fracking-SW-PA-feature-Lois-Bower-Bjornson-scaled.jpg6671500Intern FracTrackerhttps://www.fractracker.org/a5ej20sjfwe/wp-content/uploads/2025/09/2025-Wordmark-Logo.pngIntern FracTracker2020-08-20 11:07:572025-05-02 14:44:39Landscape Changes and Mental Health Impacts in Southwestern Pennsylvania Communities: A Qualitative Study
In this special one-day fundraiser event, two intrepid FracTracker teams will build and share a live virtual map as we travel throughout the Ohio River Valley Region documenting oil, gas, and its effects on our health, climate, and environment.
How many sites can we visit in one day? What will we find?
We’ll share our findings to build awareness about the plight of this region—and so many other places victimized by this rogue industry. Plus, viewers will gain a firsthand understanding of how FracTracker turns data into real-world impact.
Proceeds will benefit the ongoing work of FracTracker to decarbonize our economy and promote environmental justice.
Whether you are able to contribute financially at this time or not, we hope you’ll join us on this virtual journey. You’ll see regular video updates along the way as we share our progress, and watch as a story map is updated throughout the day.
Join our team of explorers in spirit and pledge your support! We’re excited to share this journey with you.
https://www.fractracker.org/a5ej20sjfwe/wp-content/uploads/2020/08/FracTracker-in-the-Field-promotion5-scaled.jpg8441500FracTracker Alliancehttps://www.fractracker.org/a5ej20sjfwe/wp-content/uploads/2025/09/2025-Wordmark-Logo.pngFracTracker Alliance2020-08-14 12:44:552021-04-15 14:16:11FracTracker in the Field: Building a Live Virtual Map
By Ted Auch, PhD, Great Lakes Program Coordinator and Shannon Smith, Manager of Communications & Development
The oil and gas industry continues to use rhetoric focusing on national security and energy independence in order to advocate for legislation to criminalize climate activists. Backlash against protestors and environmental stewards has only increased since the onset of COVID-19, suggesting that industry proponents are exploiting this public health crisis to further their own dangerous and controversial policies.[1]
Industry actors contributing to the wave of anti-protest bills include American Petroleum Institute (API), IHS Markit, The American Fuel & Petrochemical Manufacturers (AFPM), and most effectively, the American Legislative Exchange Council (ALEC), by way of its primary financial backer, Koch Industries (Fang, 2014, Shelor, 2017).
ALEC is the source of the model legislation “Critical Infrastructure Protection Act” of 2017, intended to make it a felony to “impede,” “inhibit,” “impair,” or “interrupt” critical infrastructure operation and/or construction. Close approximations – if not exact replicas – of this legislative template have been passed in 11 hydrocarbon rich and/or pathway states, and 8 more are being debated in 4 additional states.
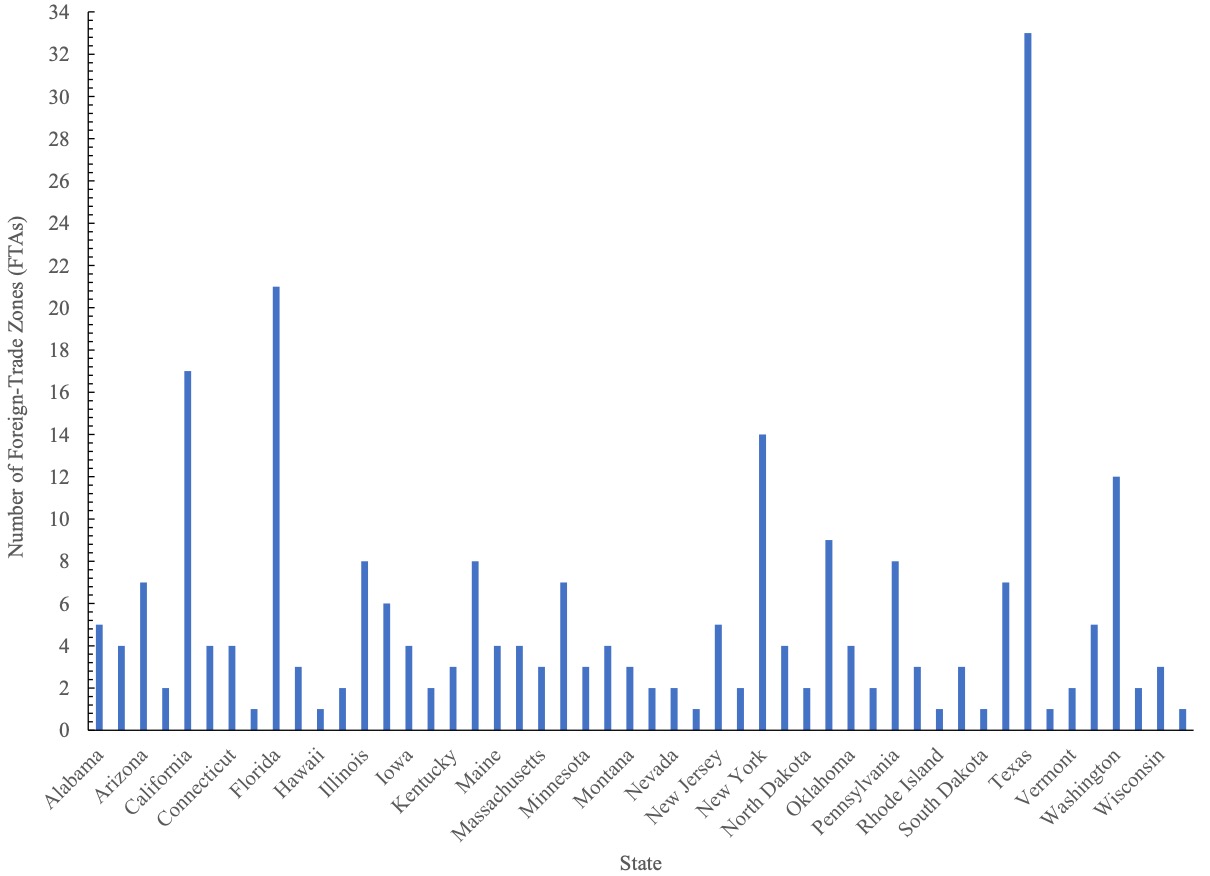
The “critical infrastructure” designation in ALEC’s “Critical Infrastructure Protection Act” is extremely broad, including over 70 pieces of infrastructure, from wastewater treatment and well pads, to ports and pipelines. However, along with the 259 Foreign Trade Zones (FTZ) (Figures 1 and 4) supervised by US Customs and Border Protection (CBP), security is of such importance because over 50% of this infrastructure is related to oil and gas. According to our analysis, there are more than 8,000 unique pieces of infrastructure that fall under this designation, with over 10% in the Marcellus/Utica states of Ohio, West Virginia, and Pennsylvania. See Figure 1 for the number of FTZ per state.
Regarding FTZ, the US Department of Homeland Security doesn’t attempt to hide their genuine nature, boldly proclaiming them “… the United States’ version of what are known internationally as free-trade zones … to serve adequately ‘the public interest’.” If there remains any confusion as to who these zones are geared toward, the US Department of Commerce’s International Administration (ITA) makes the link between FTZ and the fossil fuel industry explicit in its FTZ FAQ page, stating “The largest industry currently using zone procedures is the petroleum refining industry.” (Figure 2)
Figure 1. Number of Foreign-Trade Zones (FTZ) by state as of June 2020.
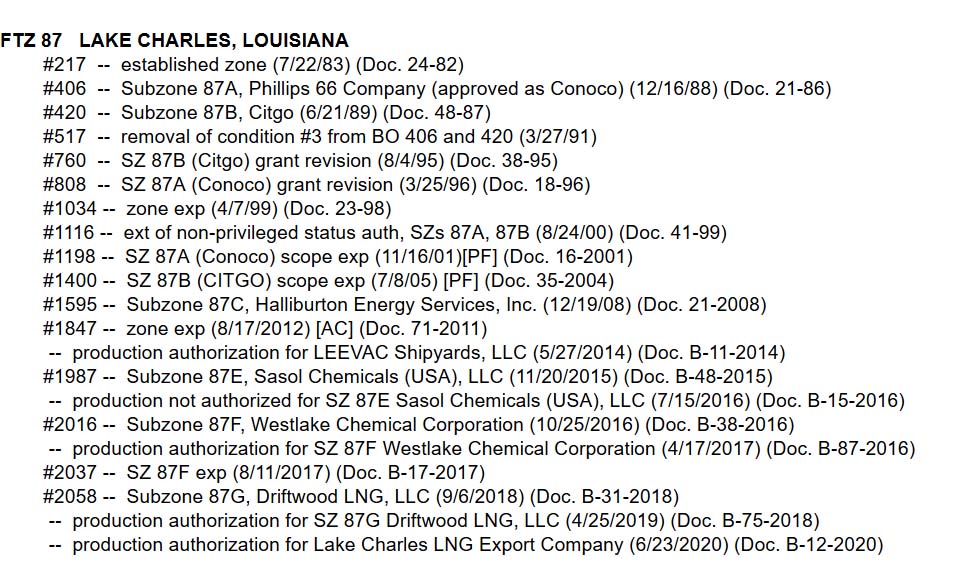
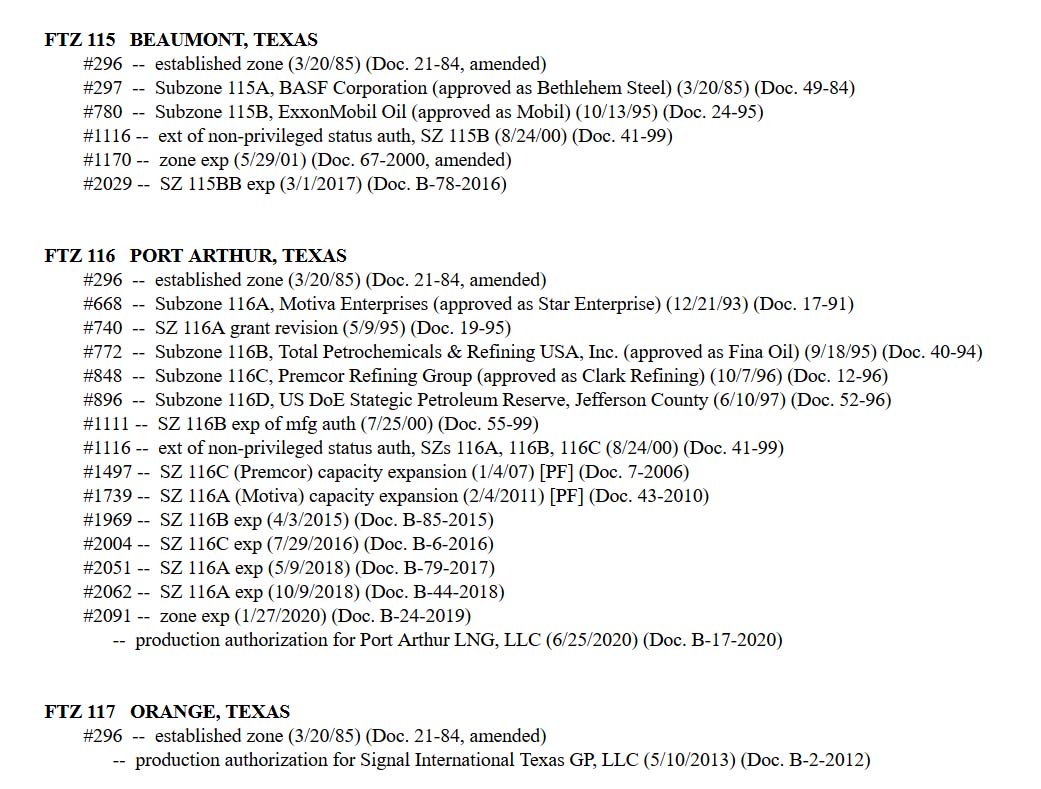
Figure 2. Foreign-Trade Zone (FTZ) Board of Actions in Zones 87 in Lake Charles, LA, 115-117 in and around Port Arthur, TX, and 122 in Corpus Christi, TX. (click on the images to enlarge)
Foreign-Trade Zone (FTZ) Board of Actions in Zone 87 in Lake Charles, Louisiana
Foreign-Trade Zone (FTZ) Board of Actions in Zones 115-117 in and around Port Arthur, Texas
Foreign-Trade Zone (FTZ) Board of Actions in Zone 122 in Corpus Christi, Texas
Much of the oil, gas, and petrochemical industries’ efforts stem from the mass resistance to the Dakota Access Pipeline (DAPL). Native American tribes and environmental groups spent months protesting the environmentally risky $3.78 billion dollar project, which began production in June 2017, after Donald Trump signed an executive order to expedite construction during his first week in office. The Standing Rock Sioux tribe also sued the US government in a campaign effort to protect their tribal lands. The world watched as Energy Transfer Partners (ETP), the company building the pipeline, destroyed Native artifacts and sacred sites, and as police deployed tear gas and sprayed protesters with water in temperatures below freezing.
ETP’s bottom line and reputation were damaged during the fight against DAPL. Besides increasingly militarized law enforcement, the oil and gas industry has retaliated by criminalizing similar types of protests against fossil fuel infrastructure. However, the tireless work of Native Americans and environmental advocates has resulted in a recent victory in March 2020, when a federal judge ordered a halt to the pipeline’s production and an extensive new environmental review of DAPL.
Just days ago, on July 6, 2020, a federal judge ruled that DAPL must shut down until further environmental review can assess potential hazards to the landscape and water quality of the Tribe’s water source. This is certainly a victory for the Standing Rock Sioux Tribe and other environmental defenders, but the decision is subject to appeal.
Since the DAPL conflict began, the industry has been hastily coordinating state-level legislation in anticipation of resistance to other notable national gas transmission pipelines, more locally concerning projects like Class II Oil and Gas Waste Injection Wells, and miles of gas gathering pipelines that transport increasing streams of waste – as well as oil and gas – to coastal processing sites.
The following “critical infrastructure” bills have already been enacted:
STATE
BILL
TITLE
DATE PASSED
West Virginia
HB 4615
NEW PENALTIES FOR PROTESTS NEAR GAS AND OIL PIPELINES
3/25/20
South Dakota
SB 151
NEW PENALTIES FOR PROTESTS NEAR PIPELINES AND OTHER INFRASTRUCTURE
3/18/20
Kentucky
HB 44
NEW PENALTIES FOR PROTESTS NEAR PIPELINES AND OTHER INFRASTRUCTURE
3/16/20
Wisconsin
AB 426
NEW PENALTIES FOR PROTESTS NEAR GAS AND OIL PIPELINES
11/21/19
Missouri
HB 355
NEW PENALTIES FOR PROTESTS NEAR GAS AND OIL PIPELINES
7/11/19
Texas
HB 3557
NEW CRIMINAL AND CIVIL PENALTIES FOR PROTESTS AROUND CRITICAL INFRASTRUCTURE
6/14/19
Tennessee
SB 264
NEW PENALTIES FOR PROTESTS NEAR GAS AND OIL PIPELINES
5/10/19
Indiana
SB 471
NEW PENALTIES FOR PROTESTS NEAR CRITICAL INFRASTRUCTURE
5/6/19
North Dakota
HB 2044
HEIGHTENED PENALTIES FOR PROTESTS NEAR CRITICAL INFRASTRUCTURE
4/10/19
Louisiana
HB 727
HEIGHTENED PENALTIES FOR PROTESTING NEAR A PIPELINE
5/30/18
Oklahoma
HB 1123
NEW PENALTIES FOR PROTESTS NEAR CRITICAL INFRASTRUCTURE
5/3/17
There are an additional eight bills proposed and under consideration in these six states:
STATE
PENDING
TITLE
DATE PROPOSED
Louisiana
HB 197
NEW PENALTIES FOR PROTESTS NEAR CRITICAL INFRASTRUCTURE
2/24/20
Minnesota
HF 3668
NEW PENALTIES FOR PROTESTS NEAR GAS AND OIL PIPELINES
2/24/20
Mississippi
HB 1243
NEW PENALTIES FOR PROTESTS NEAR CRITICAL INFRASTRUCTURE
2/19/20
Alabama
SB 45
NEW PENALTIES FOR PROTESTS NEAR GAS AND OIL PIPELINES
2/4/20
Minnesota
HF 2966
NEW PENALTIES FOR PROTESTS NEAR OIL AND GAS PIPELINES
1/31/20
Minnesota
SF 2011
NEW PENALTIES FOR PROTESTS NEAR GAS AND OIL PIPELINES
3/4/19
Ohio
SB 33
NEW PENALTIES FOR PROTESTS NEAR CRITICAL INFRASTRUCTURE
2/12/19
Illinois
HB 1633
NEW PENALTIES FOR PROTESTS NEAR CRITICAL INFRASTRUCTURE
1/31/19
Desperate Backlash Against Peaceful Protest
Activists and organizations like the American Civil Liberties Union (ACLU) are framing their opposition to such legislation as an attempt to stave off the worst Orwellian instincts of our elected officials, whether they are in Columbus or Mar-a-Lago. On the other hand, industry and prosecutors are framing these protests as terroristic acts that threaten national security, which is why sentencing comes with a felony conviction and up to ten years in prison. The view of the FBI’s deputy assistant director and top official in charge of domestic terrorism John Lewis is that, “In recent years, the Animal Liberation Front and the Earth Liberation Front have become the most active, criminal extremist elements in the United States … the FBI’s investigation of animal rights extremists and ecoterrorism matters is our highest domestic terrorism investigative priority.”
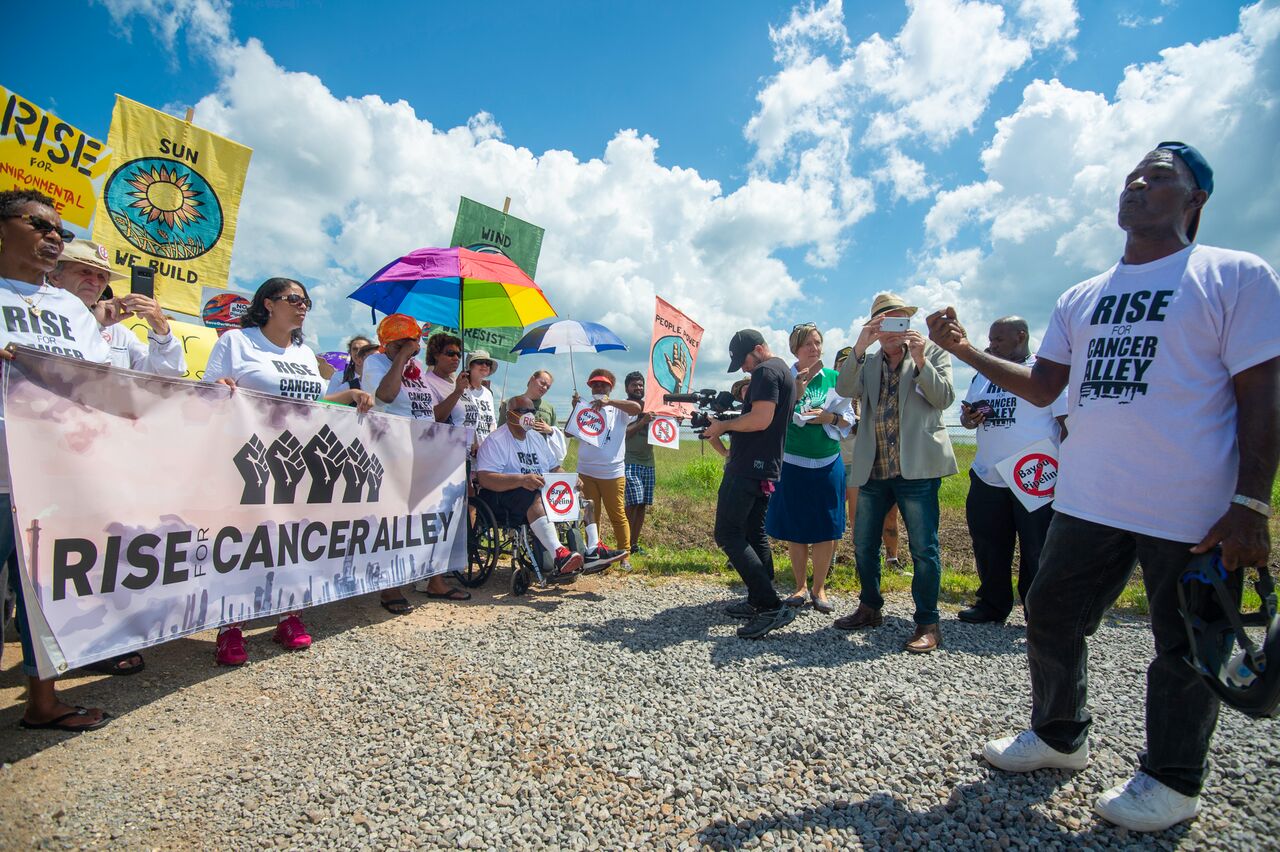
It shocked many when last week, two protesters in the petrochemical-laden “Cancer Alley” region of Louisiana were arrested and charged under the state’s felony “terrorist” law. Their crime? Placing boxes of nurdles – plastic pellets that are the building blocks of many single-use plastic products – on the doorsteps of fossil fuel lobbyists’ homes. To make matters more ridiculous, the nurdles were illegally dumped by the petrochemical company Formosa Plastics.[2] This is outrageous indeed, but is the sort of legally-sanctioned oppression that fossil fuel industry lobbyists have been successfully advocating for years.
American Fuel & Petrochemical Manufacturers (AFPM) stated in a letter of support for ALEC’s legislative efforts:
“In recent years, there has been a growing and disturbing trend of individuals and organizations attempting to disrupt the operation of critical infrastructure in the energy, manufacturing, telecommunications, and transportation industries. Energy infrastructure is often targeted by environmental activists to raise awareness of climate change and other perceived environmental challenges. These activities, however, expose individuals, communities, and the environment to unacceptable levels of risk, and can cause millions of dollars in damage … As the private sector continues to expand and maintain the infrastructure necessary to safely and reliably deliver energy and other services to hundreds of millions of Americans, policymakers should continue to consider how they can help discourage acts of sabotage … Finally, it will also hold organizations both criminally and vicariously liable for conspiring with individuals who willfully trespass or damage critical infrastructure sites.”
Those organizations deemed ‘criminally and vicariously liable’ would in some states face fines an order of magnitude greater than the actual individual, which would cripple margin-thin environmental groups around the country, and could amount to $100,000 to $1,000,000. The AFPM’s senior vice president for federal and regulatory affairs Derrick Morgan referred to these vicarious organizations as “inspiring … organizations who have ill intent, want to encourage folks to damage property and endanger lives …”
One of the most disturbing aspects of this legislation is that it could, according to the testimony and additional concerns of ACLU of Ohio’s Chief Lobbyist Gary Daniels, equate “‘impeding’ and ‘inhibiting’ the ‘operations’ of a critical infrastructure site” with acts as innocuous as Letters to the Editor, labor strikes or protests, attending and submitting testimony at hearings, or simply voicing your concern or objections to the validity of industry claims and its proposals with emails, faxes, phone calls, or a peaceful protest outside critical infrastructure that raises the concern of site security. Mr. Daniels noted in his additional written testimony that the latter, “may prove inconvenient to the site’s staff, under SB 250 they would be an F3 [Third Degree Felony], and that is without someone even stepping foot on or near the property, as physical presence is not required to be guilty of criminal mischief, as found in/defined in Sec. 2907.07(A)(7) of the bill.”
Figure 3. A rally held by the Louisiana-based nonprofit RISE St. James.
This connection, when enshrined into law, will have a chilling effect on freedom of speech and assembly, and will stop protests or thoughtful lines of questioning before they even start. As the Ohio Valley Environmental Coalition (OVEC) put it in their request for residents to ask the governor to veto the now-enacted HB 4615, such a bill is unnecessary, duplicative, deceitful, un-American, unconstitutional, and “will further crowd our jails and prisons.”
To combat such industry-friendly legislation that erodes local government control in Ohio, lawmakers like State Senator Nikki Antonio are introducing resolutions like SR 221, which would, “abolish corporate personhood and money-as-speech doctrine” made law by the Supreme Court of the United States’ rulings in Citizens United v. FEC and Buckley v. Valeo. After all, the overarching impact of ALEC’s efforts and those described below furthers privatized, short-term profit and socialized, long-term costs, and amplifies the incredibly corrosive Citizen’s United decision a little over a decade ago.
Further Criminalization of Protest, Protections for Law Enforcement
Simultaneously, there is an effort to criminalize protest activities through “riot boosting acts,” increased civil liability and decreased police liability, trespassing penalties, and new sanctions for protestors who conceal their identities (by wearing a face mask, for example).
The following bills have already been enacted:
STATE
BILL
TITLE
DATE PASSED
South Dakota
SB 189
EXPANDED CIVIL LIABILITY FOR PROTESTERS AND PROTEST FUNDERS
3/27/19
West Virginia
HB 4618
ELIMINATING POLICE LIABILITY FOR DEATHS WHILE DISPERSING RIOTS AND UNLAWFUL ASSEMBLIES
3/10/18
North Dakota
HB 1426
HEIGHTENED PENALTIES FOR RIOT OFFENCES
2/23/17
North Dakota
HB 1293
EXPANDED SCOPE OF CRIMINAL TRESPASS
2/23/17
North Dakota
HB 1304
NEW PENALTIES FOR PROTESTERS WHO CONCEAL THEIR IDENTITY
2/23/17
In addition, the following bills have been proposed and are under consideration:
STATE
PENDING
TITLE
DATE PROPOSED
Rhode Island
H 7543
NEW PENALTIES FOR PROTESTERS WHO CONCEAL THEIR IDENTITY
2/12/20
Oregon
HB 4126
HARSH PENALTIES FOR PROTESTERS WHO CONCEAL THEIR IDENTITY
1/28/20
Tennessee
SB 1750
NEW PENALTIES FOR PROTESTERS WHO CONCEAL THEIR IDENTITY
1/21/20
Ohio
HB 362
NEW PENALTIES FOR PROTESTERS WHO CONCEAL THEIR IDENTITY
10/8/19
Pennsylvania
SB 887
NEW PENALTIES FOR PROTESTS NEAR “CRITICAL INFRASTRUCTURE”
10/7/19
Massachusetts
HB 1588
PROHIBITION ON MASKED DEMONSTRATIONS
1/17/19
All the while, the Bundy clan of Utah pillage – and at times – hold our public lands hostage, and white male Michiganders enter the state capital in Lansing armed for Armageddon, because they feel that COVID-19 is a hoax. We imagine that it isn’t these types of folks that West Virginia State Representatives John Shott and Roger Hanshaw had in mind when they wrote and eventually successfully passed HB 4618, which eliminated police liability for deaths while dispersing riots and unlawful assemblies.
Contrarily, South Dakota’s SB 189, or “Riot Boosting Act,” was blocked by the likes of US District Judge Lawrence L. Piersol, who wrote:
“Imagine that if these riot boosting statutes were applied to the protests that took place in Birmingham, Alabama, what might be the result? … Dr. King and the Southern Christian Leadership Conference could have been liable under an identical riot boosting law.”
FracTracker collaborated with Crude Accountability on a report documenting increasing reprisals against environmental activists in the US and Eurasia. Read the Report.
Figure 4. Photo of US Treasury Department signage outlining the warning associated with BP’s Whiting, IN, oil refinery designated a Foreign Trade Zone (FTZ). Photo by Ted Auch July 15th, 2015
In all fairness to Mr. Emanuel, he was referring to the Obama administration’s support for the post-2008 bipartisan Wall Street bailout. However, it is critical that we acknowledge the push for critical infrastructure legislation has been most assuredly bipartisan, with Democratic Governors in Kentucky, Louisiana, and Wisconsin signing into law their versions on March 16th of this year, in May of 2018, and in November of 2019, respectively.
Related Legislation in Need of Immediate Attention
In Columbus, Ohio, there are several pieces of legislation being pushed in concert with ALEC-led efforts. These include the recently submitted HB 362, that would “create the crime of masked intimidation.” Phil Plummer and George F. Lang sponsor the bill, with the latter being the same official who introduced HB 625, a decidedly anti-local control bill that would preempt communities from banning plastic bags. Most of the general public and some of the country’s largest supermarket chains have identified plastic bag bans as a logical next step as they wrestle with their role in the now universally understood crimes plastics have foisted on our oceans and shores. As Cleveland Scene’s Sam Allard wrote, “bill mills” and their willing collaborators in states like Ohio cause such geographies to march “boldly, with sigils flying in the opposite direction” of progress, and a more renewable and diversified energy future.
With respect to Plummer and Lang’s HB 362, two things must be pointed out:
1) It is eerily similar to North Dakota’s HB 1304 that created new penalties for protestors who conceal their identity, and
So, when elected officials as far away as Columbus copy and paste legislation passed in the aftermath of the DAPL resistance efforts, it is clear the message they are conveying, and the audience(s) they are trying to intimidate.
Plummer and Lang’s HB 362 would add a section to the state’s “Offenses Against the Public Peace,” Chapter 2917, that would in part read:
No person shall wear a mask or disguise in order to purposely do any of the following:
(A) Obstruct the execution of the law;
(B) Intimidate, hinder, or interrupt a person in the performance of the person’s legal duty; or
(C) Prevent a person from exercising the rights granted to them by the Constitution or the laws of this state.
Whoever violates this proposed section is guilty of masked intimidation. Masked intimidation is a first degree misdemeanor. It was critical for the DAPL protestors to protect their faces during tear gas and pepper spray barrages, from county sheriffs and private security contractors alike.
At the present moment, masks are one of the few things standing between COVID-19 and even more death. Given these realities, it is stunning that our elected officials have the time and/or interest in pushing bills such as HB 362 under the thin veil of law and order.
But judging by what one West Virginia resident and former oil and gas industry draftsman,[3] wrote to us recently, elected officials do not really have much to lose, given how little most people think of them:
“Honestly, it doesn’t seem to matter what we do. The only success most of us have had is in possibly slowing the process down and adding to the cost that the companies incur. But then again, the increase in costs probably just gets passed down to the consumers. One of the biggest drawbacks in my County is that most, if not all, of the elected officials are pro drilling. Many of them have profited from it.”
The oil, gas, and petrochemical industries are revealing their weakness by scrambling to pass repressive legislation to counteract activists. But social movements around the world are determined to address interrelated social and environmental issues before climate chaos renders our planet unlivable, particularly for those at the bottom of the socioeconomic ladder. We hope that by shining a light on these bills, more people will become outraged enough to join the fight against antidemocratic legislation.
This is Part I of a two-part series on concerning legislation related to the oil, gas, and petrochemical industries. Part II focuses on bills that would weaken environmental regulations in Ohio, Michigan, and South Dakota.
By Ted Auch, PhD, Great Lakes Program Coordinator and Shannon Smith, Manager of Communications & Development
[1] See Naomi Klein’s concept of the Shock Doctrine for similar trends.
[2] The community-based environmental organization RISE St. James has been working tirelessly to prevent Formosa Plastics from building one of the largest petrochemical complexes in the US in their Parish. Sharon Lavigne is a leading member of RISE St. James, and is an honored recipient of the 2019 Community Sentinel Award for Environmental Stewardship. Read more on Sharon’s work with RISE St. James here.
[3] This individual lives in Central West Virginia, and formerly monitored Oil & Gas company assets in primarily WV, PA, NY, VA, MD & OH, as well as the Gulf Coast. Towards the end of this individual’s career, they provided mapping support for the smart pigging program, call before you dig, and the pipeline integrity program.
For the past two years, a grand jury empaneled by Pennsylvania Attorney General Josh Shapiro has been investigating what they see as an oil and gas industry that has run amok. The Attorney General admonished the Pennsylvania Department of Environmental Protection (DEP) and to a lesser degree, the Department of Health (DOH), both of which they claim have conducted insufficient oversight of the industry, allowing serious problems to happen over and over again since the arrival of fracking in the Marcellus Shale sixteen years ago.
Mr. Shapiro claims that Pennsylvania should know better, as it is still dealing with the health and environmental impacts of mining and oil and gas operations that have been shuttered for decades. In fact, it was almost 50 years ago that the state Environmental Rights Amendment was adopted to the Pennsylvania constitution by a nearly 4 to 1 margin of Pennsylvania voters. It states:
Article I, Section 27: The people have a right to clean air, pure water, and to the preservation of the natural, scenic, historic and esthetic values of the environment. Pennsylvania’s public natural resources are the common property of all the people, including generations yet to come. As trustee of these resources, the Commonwealth shall conserve and maintain them for the benefit of all the people.
As a part of the state’s constitution, it is a fundamental part of the law of the land.
Criminal Charges
The Attorney General said that the grand jury heard hundreds of hours of expert testimony and impacted residents, and charges have already been issued against two companies – Range Resources and Cabot.
These moves are not without their critics, however. Range Resources pleaded no contest to charges of environmental crimes at several sites, which was compounded by a pattern of not informing local residents about the mishaps and potential impacts. In one of these cases, the grand jury found that the company became aware of a contamination event stemming from a shredded liner in a wastewater impoundment, for which they proceeded to do nothing about for three years, resulting in a contaminated aquifer. The company was further accused of falsifying laboratory data related to the case to affect the outcome of related civil suits.
For all of incidents reviewed, the company was slapped with a modest $50,000 fine, and agreed to a $100,000 contribution to a watershed group in the area. This can hardly be considered a deterrent; for a multi-billion dollar company in an industry where each well costs millions of dollars to drill, this amounts to nearly nothing beyond the routine cost of doing business.
Cabot’s charges stem from an infamous incident in 2008 in Dimock Township, Susquehanna County, that was highlighted in the movie GasLand. One of the wells exploded, and soon afterwards, neighbors began to notice contamination of their well water. Contaminants included methane, arsenic, barium, DEHP, glycol compounds, manganese, phenol, and sodium – a toxic cocktail consistent with hydraulic fracturing operations. As is common with many drilling contamination events, residents lost their water supplies and began to experience a series of health effects from the chemicals that they were exposed to. To this day, Cabot denies responsibility.
Obviously, it is difficult to put an entire corporation in jail, but some hold that employees who engaged in negligence or subterfuge certainly could be, or perhaps executives who oversaw or authorized such activities. Another possible outcome would include placing serious restrictions on the offending companies’ activities within the Commonwealth. As a means of comparison, please take a moment to browse through a list of operators that are banned from drilling activities in Texas. Honestly, this may take a few moments, because there are so many of them. One wonders what it would take ban a company from drilling in Pennsylvania.
But the focus of the Attorney General’s presentation was on the government’s shortcomings. Case after case of water contamination, gumming up expensive well pumps, and making water undrinkable. Many people had similar health complaints, including rashes, respiratory issues, nosebleeds, as well as pet and livestock health concerns and deaths. Mr. Shapiro’s question was clear: how were these problems were allowed to keep happening?
There is a 2020 grand jury seated as we speak, so this is certainly not the end of the story.
This map of 15,164 unconventional violations in Pennsylvania speaks to the issues presented in the report.
The grand jury developed a list of suggestions to move forward. They include:
Enact a 2,500-foot setback from homes to well sites. This is a very large increase over the current 500-foot standard, which Mr. Shapiro says is clearly insufficient to protect Pennsylvanians, as is evidenced by 16 years of documented problems.
Disallow secret injections of chemicals in hydraulic fracturing fluids. As FracTracker learned in our project with Partnership for Policy Integrity, companies injected 13,632 secret chemicals into over 2,500 wells in Pennsylvania just five years.
Enact common-sense toxic waste transportation, so that first responders and the public at large can find out when oil and gas waste has been transported. We find it interesting that the Attorney General chose the words “toxic waste” rather than “residual waste,” which we consider to be a loophole term that was invented to sidestep more stringent regulations.
Gathering lines for fracking wells need to be regulated based on risk, not size.
Reporting for air pollution needs to be aggregated by site, rather than reporting dozens of emission sources separately. This will allow researchers to better understand the cumulative risk at such locations.
A comprehensive public health study of the effects of exposure to contaminated air and water from fracking operations must be conducted. The Attorney General notes that the Department of Health has agreed with this recommendation, and preparations to conduct this study are underway.
The revolving door between regulators and industry must be stopped. Mr. Shapiro notes that at the very least, this cozy relationship creates an appearance of impropriety, which in itself erodes the public trust. He then went on to mention an instance where an operator hired seven former DEP office employees all at once.
The Attorney General’s office does not have original jurisdiction on environmental crimes, and must wait for a referral from a district attorney or the DEP. The DEP has not been making such referrals, considering civil penalties and fines to be sufficient. The Attorney General disagrees, and wants to hear directly from the people of Pennsylvania. To that end, a hotline has been setup.
Mr. Shapiro then proceeded to take DEP to task for its response to the investigation itself. The Department refused to send top staff to testify, he said, fighting with the grand jury investigation every step of the way. They then attempted to mislead the public, saying that they had no opportunity for input. What’s more, the Attorney General said that they spewed industry talking points, claiming that hundreds of hours of testimony were based on hearsay, and that a variety of the serious health impacts experienced by Pennsylvanians were, “not significant.”
In contrast, the Department of Health sent Secretary Rachel Levine to participate in the proceedings, who saw this as an opportunity to uncover her department’s shortcomings with respect to fracking over the past 16 years, and to forge a path forward in which they could do a better job in upholding their obligations.
While Mr. Shapiro characterized the response from DOH as earnest, DEP received no such accolades. “The DEP – let me be clear,” he said, “they need to clean up their act.”
By Matt Kelso, Manager of Data & Technology, FracTracker Alliance
Challenges have plagued Shell’s construction of the Falcon Pipeline System through Pennsylvania, Ohio, and West Virginia, according to documents from the Pennsylvania Department of Environmental Protection (DEP) and the Ohio Environmental Protection Agency (EPA).
Records show that at least 70 spills have occurred since construction began in early 2019, releasing over a quarter million gallons of drilling fluid. Yet the true number and volume of spills is uncertain due to inaccuracies in reporting by Shell and discrepancies in regulation by state agencies.
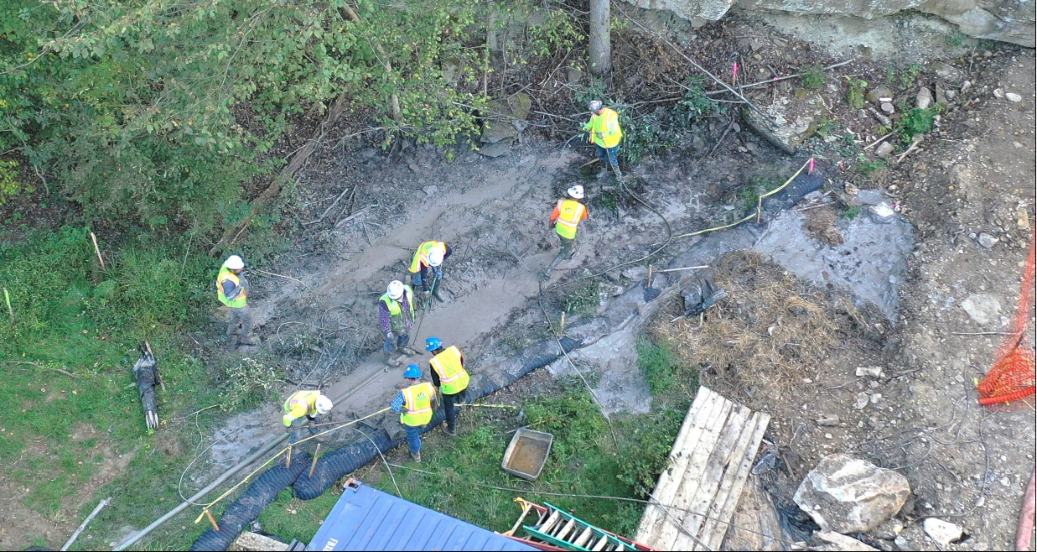
A drilling fluid spill from Falcon Pipeline construction near Moffett Mill Road in Beaver County, PA. Source: Pennsylvania DEP
Releases of drilling fluid during Falcon’s construction include inadvertent returns and losses of circulation – two technical words used to describe spills of drilling fluid that occur during pipeline construction.
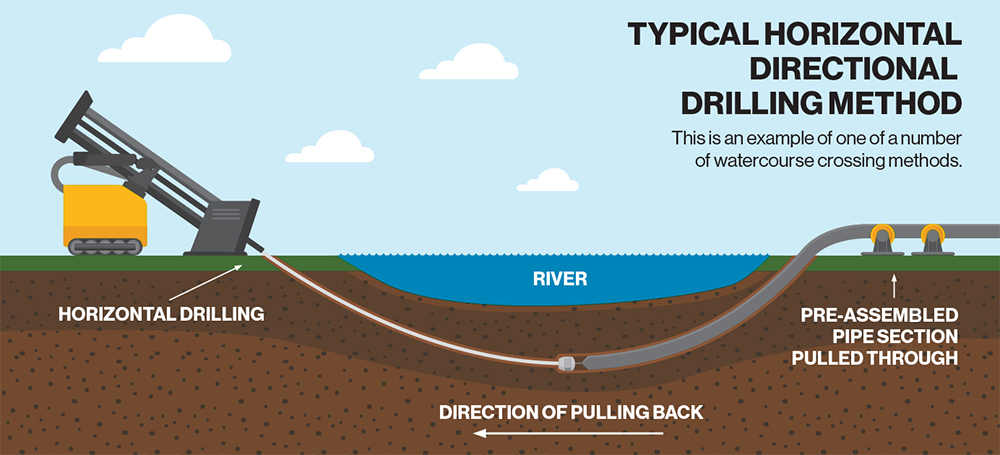
Drilling fluid, which consists of water, bentonite clay, and chemical additives, is used when workers drill a borehole horizontally underground to pull a pipeline underneath a water body, road, or other sensitive location. This type of installation is called a HDD (horizontal directional drill), and is pictured in Figure 1.
Figure 1. An HDD operation – Thousands of gallons of drilling fluid are used in this process, creating the potential for spills. Click to expand. Source: Enbridge Pipeline
Here’s a breakdown of what these types of spills are and how often they’ve occurred during Falcon pipeline construction, as of March, 2020:
Loss of circulation
Definition: A loss of circulation occurs when there is a decrease in the volume of drilling fluid returning to the entry or exit point of a borehole. A loss can occur when drilling fluid is blocked and therefore prevented from leaving a borehole, or when fluid is lost underground.
Cause: Losses of circulation occur frequently during HDD construction and can be caused by misdirected drilling, underground voids, equipment blockages or failures, overburdened soils, and weathered bedrock.
Construction of the Falcon has caused at least 49 losses of circulation releasing at least 245,530 gallons of drilling fluid. Incidents include:
15 losses in Ohio – totaling 73,414 gallons
34 losses in Pennsylvania – totaling 172,116 gallons
Inadvertent return
Definition: An inadvertent return occurs when drilling fluid used in pipeline installation is accidentally released and migrates to Earth’s surface. Oftentimes, a loss of circulation becomes an inadvertent return when underground formations create pathways for fluid to surface. Additionally, Shell’s records indicate that if a loss of circulation is large enough, (releasing over 50% percent of drilling fluids over 24-hours, 25% of fluids over 48-hours, or a daily max not to exceed 50,000 gallons) it qualifies as an inadvertent return even if fluid doesn’t surface.
Cause: Inadvertent returns are also frequent during HDD construction and are caused by many of the same factors as losses of circulation.
Construction of the Falcon has caused at least 20 inadvertent returns, releasing at least 5,581 gallons of drilling fluid. These incidents include:
18 inadvertent returns in Pennsylvania – totaling 5,546 gallons
2,639 gallons into water resources (streams and wetlands)
2 inadvertent returns Ohio – totaling 35 gallons
35 gallons into water resources (streams and wetlands)
However, according to the Ohio EPA, Shell is not required to submit reports for losses of circulation that are less than the definition of an inadvertent return, so many losses may not be captured in the list above. Additionally, documents reveal inconsistent volumes of drilling mud reported and discrepancies in the way releases are regulated by the Pennsylvania DEP and the Ohio EPA.
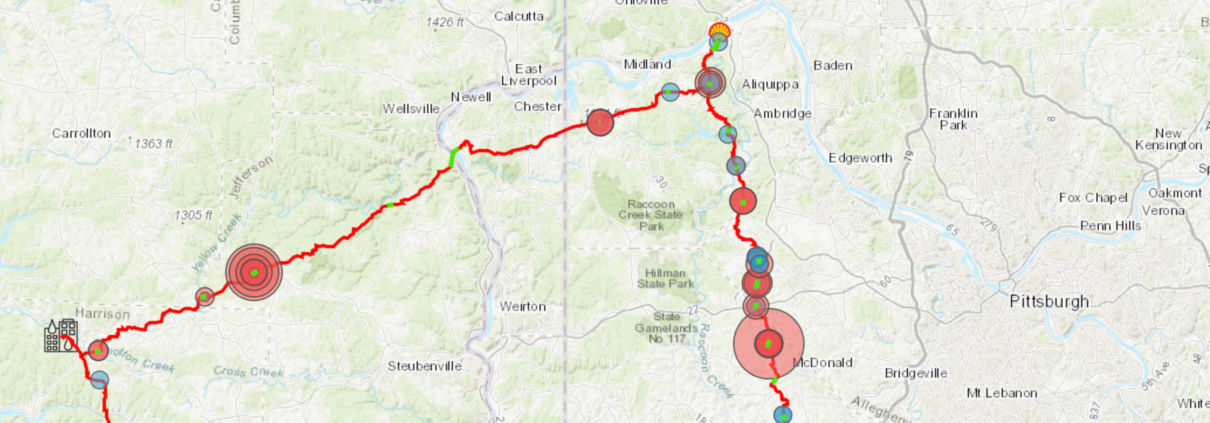
Very few of these incidents were published online for the public to see; FracTracker obtained information on them through a public records request. The map below shows the location of all known drilling fluid releases from that request, along with features relevant to the pipeline’s construction. Click here to view full screen, and add features to the map by checking the box next to them in the legend. For definitions and additional details, click on the information icon.
Our investigation into these incidents began early this year when we received an anonymous tip about a release of drilling fluids in the range of millions of gallons at the SCIO-06 HDD over Wolf Run Road in Jefferson County, Ohio. The source stated that the release could be contaminating drinking water for residents and livestock.
Working with Clean Air Council, Fair Shake Environmental Legal Services, and DeSmog Blog, we quickly discovered that this spill was just the beginning of the Falcon’s construction issues.
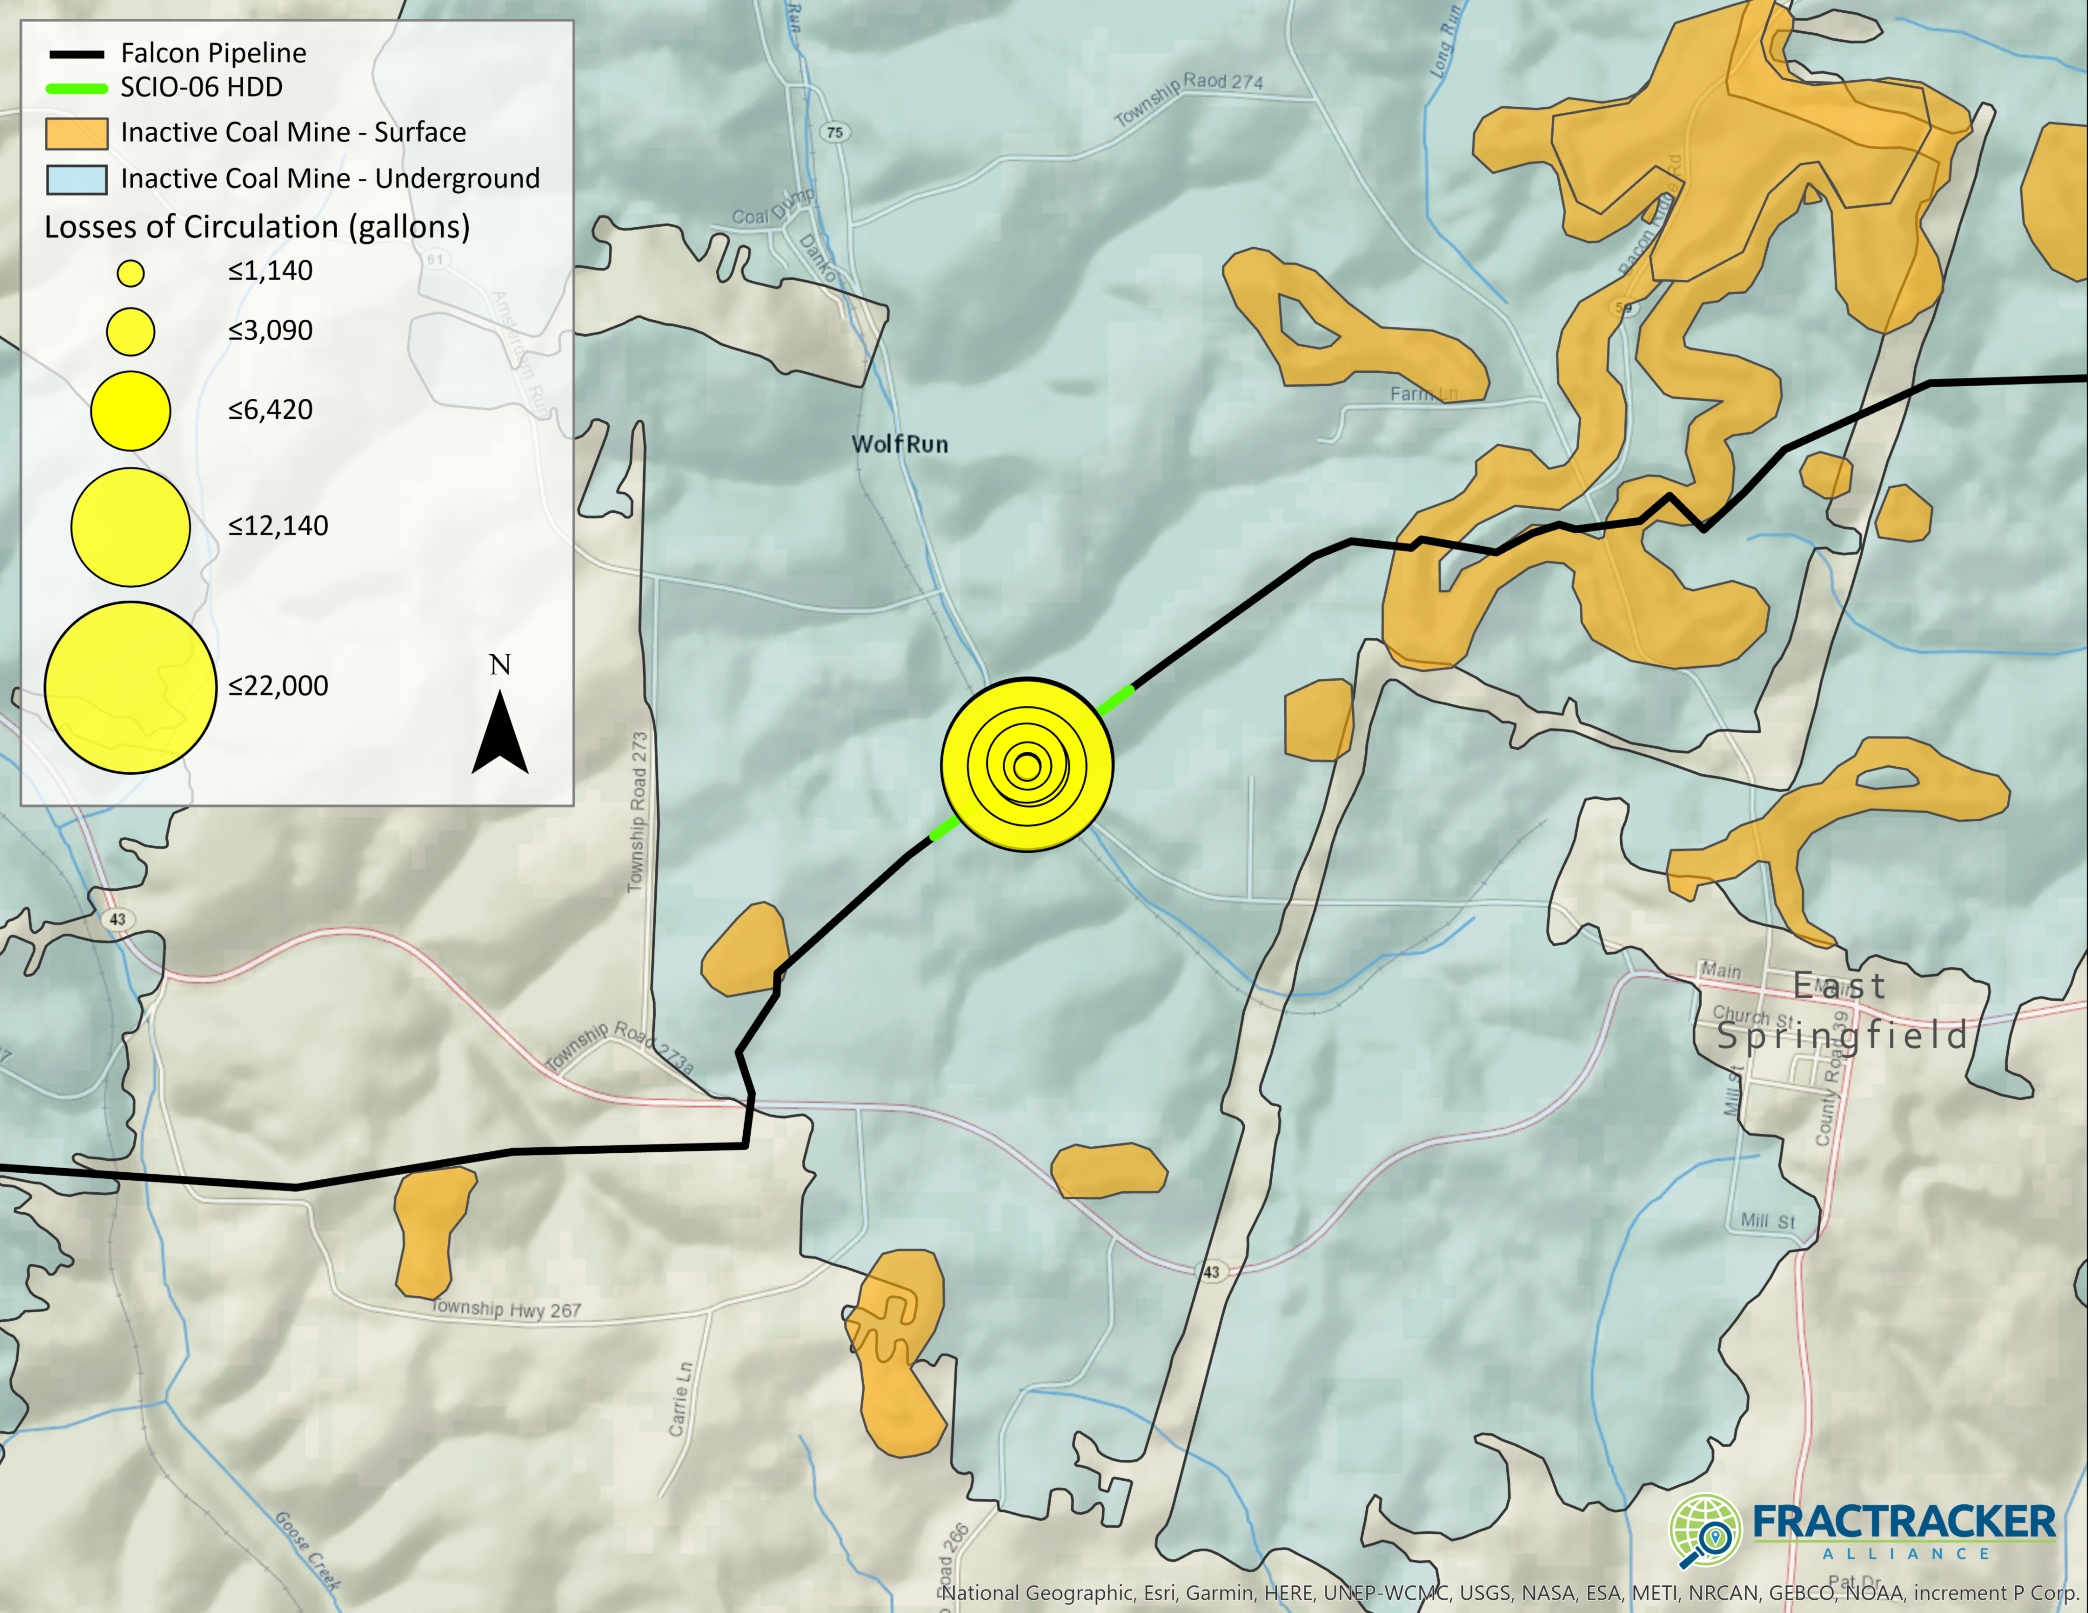
Documents from the Ohio EPA confirm that there were at least eight losses of circulation at this location between August 2019 and January 2020, including losses of unknown volume. The SCIO-06 HDD location is of particular concern because it crosses beneath two streams (Wolf Run and a stream connected to Wolf Run) and a wetland, is near groundwater wells, and runs over an inactive coal mine (Figure 2).
Figure 2. Losses of circulation that occurred at the SCIO-06 horizontal directional drill (HDD) site along the Falcon Pipeline in Jefferson County Ohio. Data Sources: OH EPA, AECOM
According to Shell’s survey, the coal mine (shown in Figure 2 in blue) is 290 feet below the HDD crossing. A hazardous scenario could arise if an HDD site interacts with mine voids, releasing drilling fluid into the void and creating a new mine void discharge.
A similar situation occurred in 2018, when EQT Corp. was fined $294,000 after the pipeline it was installing under a road in Forward Township, Pennsylvania hit an old mine, releasing four million gallons of mine drainage into the Monongahela River.
The Ohio EPA’s Division of Drinking and Ground Waters looked into the issues around this site and reported, “GIS analysis of the pipeline location in Jefferson Co. does not appear to risk any vulnerable ground water resources in the area, except local private water supply wells. However, the incident location is above a known abandoned (pre-1977) coal mine complex, mapped by ODNR.”
While we cannot confirm if there was a spill in the range of millions of gallons as the source claimed, the reported losses of circulation at the SCIO-06 site total over 60,000 gallons of drilling fluid. Additionally, on December 10th, 2019, the Ohio EPA asked AECOM (the engineering company contracted by Shell for this project) to estimate what the total fluid loss would be if workers were to continue drilling to complete the SCIO-06 crossing. AECOM reported that, in a “very conservative scenario based on the current level of fluid loss…Overall mud loss to the formation could exceed 3,000,000 gallons.”
Despite this possibility of a 3 million+ gallon spill, Shell resumed construction in January, 2020. The company experienced another loss of circulation of 4,583 gallons, reportedly caused by a change in formation. However, in correspondence with a resident, Shell stated that the volume lost was 3,200 gallons.
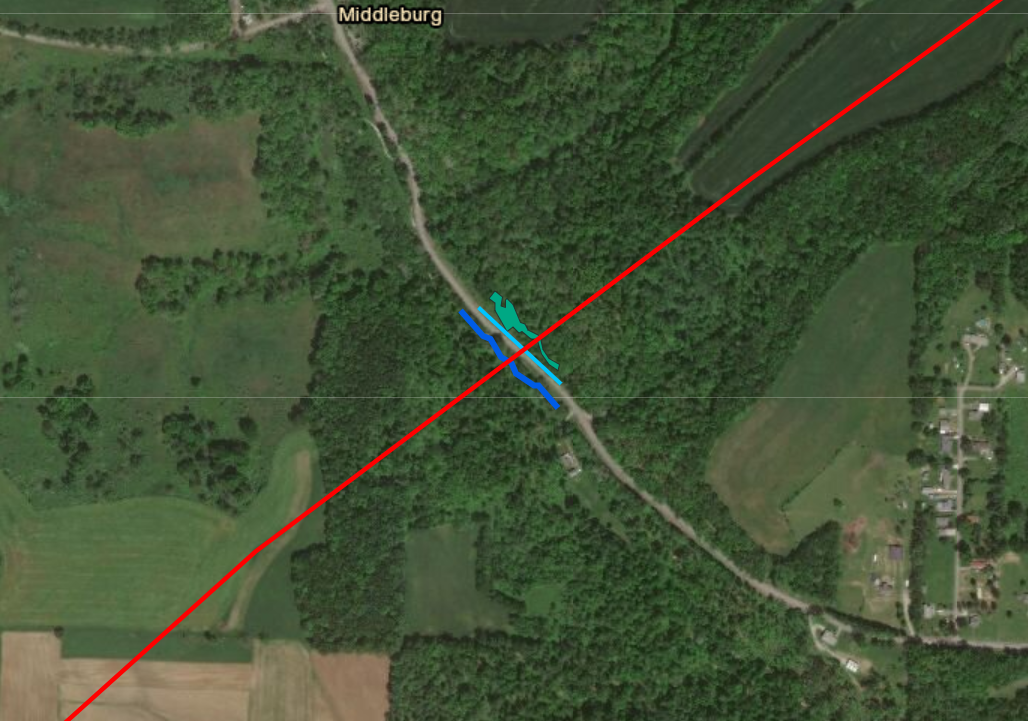
Whatever the amount, this January loss of circulation appears to have convinced Shell that an HDD crossing at this location was too difficult to complete, and in February 2020, Shell decided to change the type of crossing at the SCIO-06 site to a guided bore underneath Wolf Run Rd and open cut trench through the stream crossings (Figure 3).
Figure 3. The SCIO-06 HDD site, which may be changed from an HDD crossing to an open cut trench and conventional bore to cross Wolf Run Rd, Wolf Run stream (darker blue), an intermittent stream (light blue) and a wetland (teal). Click to expand.
An investigation by DeSmog Blog revealed that Shell applied for the route change under Nationwide Permit 12, a permit required for water crossings. While the Army Corps of Engineers authorized the route change on March 17th, one month later, a Montana federal court overseeing a case on the Keystone XL pipeline determined that the Nationwide Permit 12 did not meet standards set by federal environmental laws – a decision which may nullify the Falcon’s permit status. At this time, the ramifications of this decision on the Falcon remain unclear.
Inconsistencies in Reporting
In looking through Shell’s loss of circulation reports, we noted several discrepancies about the volume of drilling fluid released for different spills, including those that occurred at the SCIO-06 site. As one example, the Ohio EPA stated an email about the SCIO-06 HDD, “The reported loss of fluid from August 1, 2019 to August 14, 2019 in the memo does not appear to agree with the 21,950 gallons of fluid loss reported to me during my site visit on August 14, 2019 or the fluid loss reported in the conference call on August 13, 2019.”
In addition to errors on Shell’s end, our review of documents revealed significant confusion around the regulation of drilling fluid spills. In an email from September 26, 2019, months after construction began, Shell raised the following questions with the Ohio EPA:
when a loss of circulation becomes an inadvertent return – the Ohio EPA clarifies: “For purposes of HDD activities in Ohio, an inadvertent return is defined as the unintended return of any fluid to the surface, as well as losses of fluids to underground formations which exceed 50-percent over a 24-hour period and/or 25-percent loss of fluids or annular pressure sustained over a 48-hour period;”
when the clock starts for the aforementioned time periods – the Ohio EPA says the time starts when “the drill commences drilling;”
whether Shell needs to submit loss of circulation reports for losses that are less than the aforementioned definition of an inadvertent return – the Ohio EPA responds, “No. This is not required in the permit.”
How are these spills measured?
A possible explanation for why Shell reported inconsistent volumes of spills is because they were not using the proper technology to measure them.
Shell’s “Inadvertent Returns from HDD: Assessment, Preparedness, Prevention and Response Plan” states that drilling rigs must be equipped with “instruments which can measure and record in real time, the following information: borehole annular pressure during the pilot hole operation; drilling fluid discharge rate; the spatial position of the drilling bit or reamer bit; and the drill string axial and torsional loads.”
In other words, Shell should be using monitoring equipment to measure and report volumes of drilling fluid released.
Despite that requirement, Shell was initially monitoring releases manually by measuring the remaining fluid levels in tanks. After inspectors with the Pennsylvania DEP realized this in October, 2019, the Department issued a Notice of Violation to Shell, asking the company to immediately cease all Pennsylvania HDD operations and implement recording instruments. The violation also cited Shell for not filing weekly inadvertent return reports and not reporting where recovered drilling fluids were disposed.
In Ohio, there is no record of a similar request from the Ohio EPA. The anonymous source that originally informed us of issues at the SCIO-6 HDD stated that local officials and regulatory agencies in Ohio were likely not informed of the full volumes of the industrial waste releases based on actual meter readings, but rather estimates that minimize the perceived impact.
While we cannot confirm this claim, we know a few things for sure: 1) there are conflicting reports about the volume of drilling fluids spilled in Ohio, 2) according to Shell’s engineers, there is the potential for a 3 million+ gallon spill at the SCIO-06 site, and 3) there are instances of Shell not following its permits with regard to measuring and reporting fluid losses.
The inconsistent ways that fluid losses (particularly those that occur underground) are defined, reported, and measured leave too many opportunities for Shell to impact sensitive ecosystems and drinking water sources without being held accountable.
What are the impacts of drilling fluid spills?
Drilling fluid is primarily composed of water and bentonite clay (sodium montmorillonite), which is nontoxic. If a fluid loss occurs, workers often use additives to try and create a seal to prevent drilling fluid from escaping into underground voids. According to Shell’s “Inadvertent Returns From HDD” plan, it only uses additives that meet food standards, are not petroleum based, and are consistent with materials used in drinking water operations.
However, large inadvertent returns into waterways cause heavy sedimentation and can have harmful effects on aquatic life. They can also ruin drinking water sources. Inadvertent returns caused by HDD construction along the Mariner East 2 pipeline have contaminated many water wells.
Losses of circulation can impact drinking water too. This past April in Texas, construction of the Permian Highway Pipeline caused a loss that left residents with muddy well water. A 3 million gallon loss of circulation along the Mariner East route led to 208,000 gallons of drilling mud entering a lake, and a $2 million fine for Sunoco, the pipeline’s operator.
Our Falcon Public EIA Project found 240 groundwater wells within 1/4 mile of the pipeline and 24 within 1,000 ft of an HDD site. The pipeline also crosses near surface water reservoirs. Drilling mud spills could put these drinking water sources at risk.
But when it comes to understanding the true impact of the more than 245,000+ gallons of drilling fluid lost beneath Pennsylvania and Ohio, there are a lot of remaining questions. The Falcon route crosses over roughly 20 miles of under-mined land (including 5.6 miles of active coal mines) and 25 miles of porous karst limestone formations (learn more about karst). Add in to the mix the thousands of abandoned, conventional, and fracked wells in the region – and you start to get a picture of how holey the land is. Where or how drilling fluid interacts with these voids underground is largely unknown.
Other Drilling Fluid Losses
In addition to the SCIO-04 HDD, there are other drilling fluid losses that occurred in sensitive locations.
In Robinson Township, Pennsylvania, over a dozen losses of circulation (many of which occurred over the span of several days) released a reported 90,067 gallons of drilling fluid into the ground at the HOU-04 HDD. This HDD is above inactive surface and underground mines.
The Falcon passes through and near surface drinking water sources. In Beaver County, Pennsylvania, the pipeline crosses the headwaters of the Ambridge Reservoir and the water line that carries out its water for residents in Beaver County townships (Ambridge, Baden, Economy, Harmony, and New Sewickley) and Allegheny County townships (Leet, Leetsdale, Bell Acres, and Edgeworth). The group Citizens to Protect the Ambridge Reservoir, which formed in 2012 to protect the reservoir from unconventional oil and gas infrastructure, led efforts to stop Falcon Construction, and the Ambridge Water Authority itself called the path of the pipeline “not acceptable.”In response to public pressure, Shell did agree to build a back up line to the West View Water Authority in case issues arose from the Falcon’s construction.
Unfortunately, a 50-gallon inadvertent return was reported at the HDD that crosses the waterline (Figure 4), and a 160 gallon inadvertent return occurred in Raccoon Municipal Park within the watershed and near its protected headwaters (Figure 5). Both of these releases are reported to have occurred within the pipeline’s construction area and not into waterways.
Figure 4) HOU-10 HDD location on the Falcon Pipeline, where 50 gallons were released on the drill pad on 7/9/2019
Figure 5) SCIO-05 HDD location on the Falcon Pipeline, where 160 gallons were released on 6/10/19, within the pipeline’s LOD (limit of disturbance)
Farther west, the pipeline crosses through the watershed of the Tappan Reservoir, which provides water for residents in Scio, Ohio and the Ohio River, which serves over 5 million people.
A 35- gallon inadvertent return occurred at a conventional bore within the Tappan Lake Protection Area, impacting a wetland and stream. We are not aware of any spills impacting the Ohio River.
Pipelines in a Pandemic
This investigation makes it clear that weak laws and enforcement around drilling fluid spills allows pipeline construction to harm sensitive ecosystems and put drinking water sources at risk. Furthermore, regulations don’t require state agencies or Shell to notify communities when many of these drilling mud spills occur.
The problem continues where the 97-mile pipeline ends – at the Shell ethane cracker. In March, workers raised concerns about the unsanitary conditions of the site, and stated that crowded workspaces made social distancing impossible. While Shell did halt construction temporarily, state officials gave the company the OK to continue work – even without the waiver many businesses had to obtain.
The state’s decision was based on the fact it considered the ethane cracker to “support electrical power generation, transmission and distribution.” The ethane cracker – which is still months and likely years away from operation – does not currently produce electrical power and will only provide power generation to support plastic manufacturing.
This claim continues a long pattern of the industry attempting to trick the public into believing that we must continue expanding oil and gas operations to meet our country’s energy needs. In reality, Shell and other oil and gas companies are attempting to line their own pockets by turning the country’s massive oversupply of fracked gas into plastic. And just as Shell and state governments have put the health of residents and workers on the line by continuing construction during a global pandemic, they are sacrificing the health of communities on the frontlines of the plastic industry and climate change by pushing forward the build-out of the petrochemical industry during a global climate crisis.
This election year, while public officials are pushing forward major action to respond to the economic collapse, let’s push for policies and candidates that align with the people’s needs, not Big Oil’s.
By Erica Jackson, Community Outreach & Communications Specialist, FracTracker Alliance
https://www.fractracker.org/a5ej20sjfwe/wp-content/uploads/2020/06/FalconPipelineFrontPage-scaled.jpg4301500Erica Jacksonhttps://www.fractracker.org/a5ej20sjfwe/wp-content/uploads/2025/09/2025-Wordmark-Logo.pngErica Jackson2020-06-16 11:47:062021-04-15 14:16:44Falcon Pipeline Construction Releases over 250,000 Gallons of Drilling Fluid in Pennsylvania and Ohio
Unconventional wells in Pennsylvania were always resource-intensive, but the maps below show how the amount of water used per well has grown significantly in recent years. In 2013, these wells used an average of 5.8 million gallons per well. By 2019, that figure had increased 145%, consuming more than 14.3 million gallons per well. This is a glimpse into the unsustainable resource demands of this industry and the decreasing energy returned on investment.
As fracking proponents will eagerly remind you, hydraulic fracturing was invented decades ago – back in 1947 – so the practice has been in use for quite a while. What really separates modern unconventional shale gas wells from the supposedly traditional, conventional wells is more a matter of scale than anything else. While conventional wells are typically fracked with tens of thousands of gallons of fluid, their unconventional counterparts are far thirstier, consuming millions of gallons per well.
And of course, more inputs translate into more outputs — not necessarily in the form of gas, but in the form of toxic, radioactive waste. This creates a slew of problems ranging from health impacts, to increased transportation, to disposal.
However, this increase in consumption has continued to grow on a per-well basis, so that wells drilled in recent years aren’t really in the same category as wells drilled a decade ago at the beginning of Pennsylvania’s unconventional boom.
In Pennsylvania, unconventional wells are primarily drilled into two deep shale layers, the Devonian-aged Marcellus Shale, which is about 390 million years old, and the Utica Shale from the Late Ordovician period, which was deposited about 60 million years before the Marcellus. These formations have been known about for decades, but did not yield enough gas justify the expense of drilling until the 21st century, when horizontal drilling allowed for a much greater surface area of exposure to the shale formations. However, stimulating this increased distance also requires significantly more fracking fluid – a mixture of water, sand, and chemicals – which increased the consumptive use of water by several orders of magnitude. And in the end, all of this extra work that is required to extract the gas from the ground has made the industry unprofitable, as high production numbers have outpaced demand.
FracFocus Data
As residents in shale fields around the country started to see impacts to their drinking water, they began to demand to know more about what was injected into the ground around them. The industry’s response was FracFocus, a national registry to address the water component of this question, if not the issue of fracking chemicals. In the early days, visitors to the site could only access data one well at a time, so systematic analyses by third parties were precluded. Additionally, record keeping was sloppy, with widespread data entry issues, incorrect locations, duplicate entries, and so forth.
Many of these issues were addressed with the rollout of FracFocus 2.0 in May of 2013. This fixed many of the data entry issues, such as the six different spellings of “Susquehanna” that were used, and enabled downloads of the entire data set. For that reason, when we wanted to look at changes over time, our analysis started in 2013, where only minimal obvious corrections were required at the county level.
Unconventional wells in Pennsylvania were always resource-intensive, but this GIF shows that the amount of water used per well has grown significantly in recent years. In 2013, these wells used an average of 5.8 million gallons per well. By 2019, that figure had increased 145%, consuming more than 14.3 million gallons per well. This is a glimpse into the unsustainable resource demands of this industry and the decreasing energy returned on investment.
However, statewide data is available since 2008, and as long as we keep in mind the data quality issues from the earlier years, the results are even more stark.
Year
FracFocus Reports
Total Water (gal)
Average Water per Well (gal)
Maximum Water (gal)
2008
2
4,117,827
4,117,827
4,117,827
2009
19
37,415,216
4,157,246
6,176,104
2010
57
123,747,550
4,267,157
7,595,793
2011
1,174
786,513,944
4,345,381
12,146,478
2012
1,375
2,721,696,367
4,676,454
14,247,085
2013
1,272
7,431,752,338
5,842,573
19,422,270
2014
1,277
10,359,150,398
8,112,099
26,927,838
2015
904
8,216,787,382
9,089,367
32,049,750
2016
589
5,933,622,817
10,074,063
32,701,940
2017
710
8,547,034,675
12,038,077
38,681,496
2018
805
10,901,333,749
13,542,030
36,812,580
2019
686
9,811,475,207
14,302,442
39,329,556
2020
76
986,425,600
12,979,284
29,177,980
Grand Total
8,946
65,861,073,069
9,248,852
39,329,556
Figure 1: While the total number of frack jobs reported to FracFocus has declined over the years, the amount of water per well has increased substantially.
In terms of the total number of unconventional wells drilled, the boom years in Pennsylvania were around 2010 to 2014, with more than 1,000 wells drilled each of those years, a total that has not been achieved again since. It is important to note that in this FracFocus data, we are not counting the wells, per se, but the reported instances of well stimulation through hydraulic fracturing, commonly called frack jobs. In the earliest portion of the date range, submitting data to FracFocus was voluntary, and therefore the total activity from 2008 through 2010 is vastly undercounted, but we have included what data was available.
It should be noted that the average consumption for frack jobs started in 2020 are down from the 2019 totals, however, the sample size is considerably smaller. This smaller sample due, in part, to reduced drilling activity due to oversupply of gas in the Northeast, but also due to the fact that the year is still in progress. This analysis is based on data downloaded from FracFocus in April 2020.
Changes Over Time
As we examine changes in the average water consumption over time from Figure 1, we can see that operators in Pennsylvania averaged between 4-5 million gallons of water per well from 2008 to 2012. The numbers take off from there, tripling to more than 14 million gallons for 2019, the last full year available. At the same time, drilling operators began experimenting with truly monstrous quantities of water. In 2008, the only well with water data available used just over 4.1 million gallons. By 2019, there was a well that used 39.3 million gallons of water, almost a tenfold increase.
From late 2008 through early 2020, the industry recorded the use of 65.8 billion gallons of water in unconventional wells. Since we know that many wells during the early boom years did not report to FracFocus, the actual usage must be substantially higher. For the years with the most reliable and complete data – 2013 to 2019 – total water consumption ranged from 5.9 to 10.9 billion gallons per year. For context, the average Pennsylvanian uses about 100 gallons per day, or 36,500 gallons per year.
That means that the 10.9 billion gallons that were pumped into fracked wells in 2018 equals the total usage of 298,667 residents for an entire year. Alternatively, that water could have filled 16,517 Olympic-sized swimming pools. It is equivalent to 33,455 acre-feet, meaning it could fill an acre-sized column of water that stretches more than six miles high.
Surely, there must be a better way to make use of our precious resources than to turn millions upon millions of gallons of water into toxic waste.
By Matt Kelso, Manager of Data & Technology, FracTracker Alliance
https://www.fractracker.org/a5ej20sjfwe/wp-content/uploads/2020/05/waterfall-1806956_1920.jpg7241500Matt Kelso, BAhttps://www.fractracker.org/a5ej20sjfwe/wp-content/uploads/2025/09/2025-Wordmark-Logo.pngMatt Kelso, BA2020-05-29 16:22:102021-04-15 14:16:48Fracking Water Use in Pennsylvania Increases Dramatically
Air pollution from Pennsylvania shale gas compressor stations is a significant, worsening public health concern.
By Cynthia Walter, Ph.D.
Dr. Walter is a retired biology professor who has worked on shale gas industry pollution since 2009 through Westmoreland Marcellus Citizens Group, Protect PT and other groups. Contact: walter.atherton@gmail.com
Executive Summary
Compressor Stations (CS) in the gas industry are sources of serious air pollutants known to harm humans and the environment. CS are permanent facilities required to transport gases from wells to major pipelines and along pipelines. Additional operations and equipment located at CS also emit toxins. In the last 20 years, CS abundance and sizes have dramatically increased in shale gas extraction areas across the US. This report will focus on CS in and near Southwestern Pennsylvania. Numbers of CS there have risen more than tenfold in the last decade in response to well completions and pipelines after the local fracking boom began in 2005. For example, Westmoreland County, Pennsylvania, had two CS before 2005 and now has 50 CS corresponding with about 341 active shale gas wells. In Pennsylvania, state regulations allow CS to be as close as 750 feet from homes, schools, and businesses. Emission monitoring relevant to public health exposure is limited or absent.
Current Pennsylvania policies allow rapid CS expansion. Also, regulations do not address public health risks due to several major flaws. First, permits allow annual totals of emitted toxins using models that assume constant releases, but substantial emissions from CS occur in peaks that expose citizens to concentrations may impair health, ranging from asthma to cancer. Second, permits do not address the fact that CS simultaneously release many serious air toxins including benzene and formaldehyde, and particulates that carry toxins into lungs. This allowance of multiple toxin release does not reflect the well-established science that public health risks multiply when people are exposed to several toxins at once. Third, permit reviews rarely consider nearby known air pollution sources contributing to aggregate air toxin exposures that occur in bursts and continually. Fourth, permits do not require operators to provide public access to real-time reports of air pollutants released by CS and ambient air quality near CS.
Poor air quality causes harm directly, e.g. respiratory distress, and indirectly, e.g., through increased vulnerability to respiratory viruses. The annual cost of damages from air pollution from CS was estimated at $4 million-$24 million in Pennsylvania based on emissions from CS in 2011. These damages include harm to human and livestock health and losses of crops and timber. After 2011, CS and gas infrastructures continue to expand, with increasing air pollution and damages, especially in shale gas areas. These costs must be compared to the benefits of using alternative energy sources. For example, in a neighboring state, New York, shifting to renewable energy will save tens of billions of dollars annually in air pollution costs, prevent thousands of premature deaths each year, and trigger substantial job creation, based on peer-reviewed research using US government data.
Recommendations
Constant air monitoring must occur at current compressor stations and nearby sites important to the public, such as schools. The peak concentrations and totals for substances relevant to public health must be recorded and made available to the public in real time.
Air pollution from compressor stations must become an important part of measuring and modeling pollution exposures from all components of the shale gas industry.
Permits for new compressor stations must be revised to better protect the public in ways including, but not limited to the following:
Location, e.g., increased general setback limits and expanded limits for sensitive sites such as schools, senior care facilities and hospitals
Emission limits for criteria air pollutants and hazardous air pollutants including Radon, especially limits for peak concentrations and annual totals
Monitoring air quality within the station, at the fence-line and in key sites nearby, such as schools, using information from air movement models to select locations and heights.
Limits for CS size based on aggregate pollution from other local air pollution sources.
Costs of harm from CS and other shale gas activities must be compared to alternatives.
CS emissions contribute major air pollutants to the total pollution from unconventional gas development (UCGD), but their role in regional air quality problems has not always been noted. In 2009, when UCGD operations were only a few years in this region and many CS had not yet been built, CS emissions were estimated to be a small component. Now, in 2020, gas transport requirements have increased, leading to many more and larger CS. The amounts of CS emissions have increased accordingly, based on estimates by Carnegie Mellon University atmospheric researcher, Robinson (Figure 1). Part of the reason that CS are such a major pollution source is that they run constantly, in contrast to machinery for well development and trucking that fluctuate with the market for new wells.
Figure 1. Relative contribution of compressor stations and other components of shale gas industry to Nitrous Oxides (NOx) and Volatile Organic Compounds (VOC). Source: Clean Air Council- adapted from webinar by Alan Robinson.
Air pollutants in CS emissions vary substantially in chemistry and concentrations due to differences in equipment (Table 1). Emissions in CS can come from several types of sources described below.
Engines: Compression engines powered with methane release nitrogen oxides (NOx), carbon monoxide (CO), volatile organic compounds (VOCs) and hazardous air pollutants (HAP). Diesel engines release those pollutants as well as sulfur dioxide (SO2) and substantial particulate matter. In addition, diesel storage on site is a hazard. Electric engines produce less pollutants, but they are much less common than fossil fuel engines in southwestern Pennsylvania. CS operators can vary the use of engines at a station, and therefore, emissions vary during partial or full shutdowns and start-up periods.
Blowdowns: Toxic emissions dramatically increase during blowdowns, a procedure that is scheduled or used as needed to release the build-up of gases. Blowdown frequency and emissions vary with the rate of gas transport and the chemistry of transported gases. The full extent of emissions from any CS, therefore, is not known. Blowdowns can release a wide range of substances, and when flaring is used to burn off gases, the combustion creates new substances and additional particulates. Blowdowns are the most likely source of peaks in emissions at continuously operated CS. For example, Brown et al. (2015) used PA DEP measures of a CS in Washington County, Pennsylvania, alongside likely blowdown frequencies and weather models to predict peak emission frequency. They estimated nearby residents would experience over 118 peak emissions per year.
Non-compression Procedures: CS facilities are often the location for equipment that separate gases, remove water and other fluids, and run pipeline testing operations called pigging. These activities can be constant or intermittent and release a wide range of substances which may or may not be included in estimates for a permit. In addition, some of the processing releases gases which are flared at the facility, thus releasing a range of combustion by-products and particulate pollution. For example, the Shamrock CS operated by Dominion Transfer Inc. includes equipment for dehydration, glycol processing and pigging. The Janus facility operated by EQT includes dehydration and flaring. Permitted emissions for those facilities are listed in Table 1.
Storage Tank Emissions: CS often include storage tanks that hold substances known to release fumes. For example, the Shamrock CS was permitted to have an above ground storage tank of 3000 gallons for drip gas and a 1000-gallon tank for used oil, both of which release volatile organic compounds. The EQT Janus CS has two 8,820-gallon tanks. Gas releases from such tanks could be controlled and recorded by the operator or they could be unrecorded leaks.
Fugitive emissions: Gas leaks, called fugitive emissions, occur readily from many components in CS facilities; such problems will increase as equipment ages. A study of CS stations in Texas is an example.
“In the Fort Worth, TX area, researchers evaluated compressor station emissions from eight sites, focusing in part on fugitive emissions. A total of 2,126 fugitive emission points were identified in the four month field study of 8 compressor stations: 192 of the emission points were valves; 644 were connectors (including flanges, threaded unions, tees, plugs, caps and open-ended lines where the plug or cap was missing); and 1,290 were classified as Other Equipment. The Other category consists of all remaining components such as tank thief hatches, pneumatic valve controllers, instrumentation, regulators, gauges, and vents. 1,330 emission points were detected with an IR camera (i.e. high-level emissions) and 796 emission points were detected by Method 21 screening (i.e. low-level emissions). Pneumatic Valve Controllers were the most frequent emission sources encountered at well pads and compressor stations.”
Eastern Research Group (2011).
Table 1. Examples of air pollutants allowed for release by compressor stations. Air pollutants (pounds/year) are estimates provided by the companies for permits in West Virginia and Pennsylvania in recent years. Total compressor engine horsepower (hp) is noted. Sources: Janus and Tonkin CS Permits at WV DEP website. Shamrock CS permit. Buffalo CS, Washington, Co PA – PENNSYLVANIA BULLETIN, VOL. 45, NO. 16 APRIL 18, 2015.
Pollutant
Term
Janus (WV)
22,000 hp
Tonkin (WV)
4390 hp
Shamrock* (PA)
4140 bhp
Buffalo ** (PA) 20,000 hp + 5,000 bhp
Nitrogen Oxides
NOx
254,400
248,000
170,000
155,800
Volatile Organic Compounds
VOC
191,200
30,000
66,000
77,000
Carbon Monoxide
CO
118,200
80,000
154,000
144,400
Sulfur Dioxide
SO2
1,400
400
10,000
5,400
Hazardous Air Pollutants-Total
HAP
48,200
3,280
19,400
30,000
Formaldehyde
1,080
12,800
12,200
Benzene
540
Ethylbenzene
60
Toluene
140
Xylene
200
Hexane
500
Acetaldehyde
600
Acrolein
160
Total Particulate Matter
(PM-2.5, PM-10-separate or combined)
PM
18,200
11,000
32,000
PM-10 32,000
PM-2.5 32,000
TOTAL TOXINS
631,600
372,680
417,400
444,600
Carbon Dioxide Equivalents
CO2-e
29,298,000
27,200,000
367,000,000
214,514,000
Health Effects of Compressor Station Emissions
Several toxic chemicals are released by individual CS in amounts that range from a few thousand pounds to a quarter of a million pounds per year (Tables 1 & 2) as described below.
Nitrous Oxides (NOx) are often the largest total amount of emissions from fossil fuel machinery. In CS, these oxides are formed when a fossil fuel such as methane or diesel is combusted to produce the energy to compress and propel gases. NOx contribute to acid rain. Excess acids in rain lower the pH of waters, in some cases to levels that dissolve toxic metals in drinking water supplies. NOx also trigger the formation of ozone, a substance well known to impair lungs.
Ozone forms when oxygen reacts with nitrous oxides, carbon monoxide, and a wide range of volatile organic compounds. Ozone exposure can trigger asthma and heart attacks in sensitive individuals, and for healthy people, ozone causes breathing problems in the short term and eventual scarring of lungs and impaired function.
Volatile Organic Compounds (VOCs) are gaseous compounds containing carbon, such as benzene and formaldehyde. In air pollution regulation, the EPA lists many compounds as VOC, but excludes carbon dioxide, carbon monoxide, methane and butane. Many VOC’s are toxic in themselves (Tables 2, 3 and 4). Also, several VOC’s react to form ozone. https://www.epa.gov/air-emissions-inventories/what-definition-voc
Carbon Monoxide (CO) is another product of fossil fuel combustion and another contributor to ozone formation. CO is directly toxic because it prevents oxygen from binding to the blood.
Sulfur Dioxide (SO2) adds to lung irritation. It also contributes to acid rain, lowering the pH of water and increasing the ability of toxic metals to dissolve in water supplies.
Hazardous Air Pollutants (HAP) include highly toxic substances such as formaldehyde and benzene, which are known carcinogens, as well as the other substances known to be emitted from CS (Tables 3 & 4). The EPA lists 187 substances as HAP, which include many VOC’s as well as some non-organic chemicals such as arsenic and radionuclides including Radon. (https://www.epa.gov/haps/initial-list-hazardous-air-pollutants-modifications)
Particulate Matter (PM) usually refers to particles in small size classes. Most state or federal regulations address measures of particles less than 10 microns (PM-10) and some monitoring systems separate out particles less than 2.5 microns (PM-2.5). Particles in either of those size ranges are not visible, but highly damaging because they travel deep into the lungs where they irritate tissues and impair breathing. Also, these tiny particles carry toxins from air into the blood passing through the lungs. This blood transports substances directly to the brain where toxins can quickly impair the nervous system and subsequently impact other organs. (https://www.epa.gov/pm-pollution/particulate-matter-pm-basics)
Health impacts from many of the substances released by CS are well-known in medical research. For example, many of the VOC and HAP compounds permitted for release by state agencies are known carcinogens (Table 3). Many of these substances also impact the nervous system as shown in the organic compounds measured in CS in PA and listed in Table 4. Also, a study of 18 CS in New York by Russo and Carpenter (2017) found that all 18 CS released substances with known impacts on the nervous system and total annual emissions were over five million pounds, among the highest of all types of emissions (Table 5). Russo and Carpenter also found high annual emissions of over five million pounds for substances known to be associated with each of the following other health problems: digestive problems, circulatory disorders, and congenital malformations.
Congenital defects were significantly more common for mothers living in a 10-mile radius of denser shale gas development in Colorado compared to reference populations (MacKenzie et al. 2014). Currie et al. (2017) examined over a million birth records in Pennsylvania and found statistically significant increased frequencies of low birth weight and negative health scores for infants born to mothers within 3 km of unconventional gas wells compared to matching populations more distant from shale gas developments. Such developments include a wide range of gas infrastructure including CS and also high truck traffic and fracking. One plausible mechanism for harm to developing babies is exposure to VOCs such as benzene, toluene and xylene associated with CS and well operations. These VOC’s are classified by the Agency for Toxic Substances and Disease Registry as known to cross the placental barrier and cause harm to the fetus including birth deformities.
In sum, CS are a significant source of air pollutants with direct and indirect impacts on health. One indirect impact especially important during the COVID-19 pandemic in 2020, is the increased incidence and severity of respiratory viral infections in populations living in areas with poor air quality. Ciencewicki, and Jaspers (2007) write, “a number of studies indicate associations between exposure to air pollutants and increased risk for respiratory virus infections.”
Table. 2. Health effects of air pollutants permitted for release by compressor stations.
Pollutant
Health Effects
Particulate Matter
Impairs lungs and transfers toxins into body when microscopic particles carry chemicals deep into lungs and release into bloodstream.
Nitrogen Oxides
Forms ozone that impairs lung function which can trigger asthma and heart attacks and scars lungs in the long term.
Forms acid rain that dissolves toxic metals into water supplies.
Volatile Organic Compounds
Includes a wide variety of gaseous organic compounds, some of which cause cancer. Many VOC react to form ozone that impairs lungs as noted above.
Carbon Monoxide
Blocks ability of blood to carry oxygen.
Also forms ozone that impairs lungs as noted above.
Sulfur Dioxide
Irritates lungs, triggering respiratory and heart distress.
Forms acid rain that dissolves toxic metals into water supplies.
Hazardous Air Pollutants
Category of various toxic compounds many of which impact the nervous system. Includes formaldehyde, benzene and several other carcinogens.
Total Toxins
Sum of emissions of all toxins. Exposure to multiple toxins exacerbates harm directly through impairment of lungs and circulatory system and indirectly through injury to detoxification mechanisms, such as liver function.
Carbon Dioxide Equivalents
A measure of the combined effects of greenhouse gases such as CO2 and Methane expressed in a standard unit equivalent to the heat trapping effect of CO2. Greenhouse gases trap heat and worsen climate change and related harm to health when increased air temperatures directly cause stress directly and indirectly accelerate ozone formation.
Table 3. Gas industry list of carcinogenicity rating for Hazardous Air Pollutants (HAPs) released by compressor stations in a factsheet prepared by EQT for Janus compressor, WV. 2015 Source: DEP.
Substance
Type
Known/Suspected Carcinogen
Classification
Acetaldehyde
VOC
Yes
B2-Probable Human Carcinogen
Acrolein
VOC
No
Inadequate Data
Benzene
VOC
Yes
Category A – Known Human Carcinogen
Ethyl-benzene
VOC
No
Category D Not Classifiable
Biphenyl
VOC
Yes
Suggested Evidence of Carcinogenic Potential
1,3 Butadiene
VOC
Yes
B2-Probable Human Carcinogen
Formaldehyde
VOC
Yes
B1- Probable Human Carcinogen
n-Hexane
VOC
No
Inadequate Data
Naphthalene
VOC
Yes
C- Possible human Carcinogen
Toluene
VOC
No
Inadequate Data
2,3,4-Trimethlypentane
VOC
No
Inadequate Data
Xylenes
VOC
No
Inadequate Data
Table 4. Center for Disease Control list of health effects for volatile organic carbons measured by PA DEP near compressor station. Source: CDC.
Substance
Exposure Symptoms
Target Organs
Ethylbenzene
Irritation to eyes and nose; nausea, headache; neuropath; numb extremities, muscle weakness; dermatitis; dizziness
Eyes, skin, respiratory system, central nervous system, peripheral nervous system
n-Butane
Drowsiness
Central nervous system
n-Hexane
Irritation to eyes, skin & respiratory system; headache, dizziness; nausea
Eyes, skin, respiratory system, central nervous system
2-Methyl Butane
n/a
n/a
Iso-butane
Drowsiness, narcosis, asphyxia
Central nervous system
Table 5. Amounts of pollutants known to be associated with health impacts in a review of 18 New York compressor stations. Emissions were grouped and tallied based on their impacts on disorders classified by ICD codes as defined by the International Statistical Classification of Diseases and Related Health Problems (ICD), a medical classification list by the World Health Organization. Source: Copy of Table 3.17b, Russo and Carpenter 2017.
ICD-10
Facilities
Chemicals
Pounds
#
Description
‘08
‘11
‘14
Tot
‘08
‘11
‘14
Tot
2008
2011
2014
Total
1
Q00-Q89
Congenital malformations and deformations
18
18
17
18
57
54
54
57
4,393,806
6,607,676
5,900,691
16,902,175
1.1
Q00-Q07
Nervous system
18
18
17
18
16
16
16
16
4,068,877
5,882,704
5,258,344
15,209,926
1.2
Q10-Q18
Eye, ear, face and neck
15
15
12
15
4
4
4
4
5,825
19,569
11,475
36,869
1.3
Q20-Q28
Circulatory system
18
18
17
18
10
10
10
10
4,269,779
6,336,905
5,651,896
16,258,581
1.4
Q30-Q34
Respiratory system
14
8
7
14
4
4
4
4
150
107
113
372
1.5
Q35-Q45
Digestive system
18
18
17
18
17
17
17
17
4,386,043
6,586,345
5,884,324
16,856,713
1.6
Q50-Q56
Genital organs
6
7
8
8
2
2
2
2
1,399
4,373
2,612
8,385
1.7
Q60-Q64
Urinary system
18
17
16
18
9
9
9
9
119,382
254,922
237,359
611,663
1.8
Q65-Q79
Musculoskeletal system
18
18
16
18
19
19
19
19
122,314
262,300
243,932
628,547
1.9
Q80-Q89
Other
18
18
17
18
55
52
52
55
2,124,445
3,614,575
3,413,375
9,152,395
2
Q90-Q99
Chromosomal abnormalities, nec
18
18
16
18
30
31
31
32
120,669
256,739
239,709
617,118
Q00-Q99
Total
18
18
17
18
57
56
56
59
4,393,806
6,607,676
5,900,691
16,902,175
Regional Air Toxins and Cancer Risk in Southwestern Pennsylvania
Cancer risks from HAPs have been elevated for many years in several areas of Southwestern PA, as noted in a map from 2005 (Figure 2), when most air pollution was from urban traffic and single sources such as coke works and unconventional gas development (UCGD) had just begun in the region. The cancer risk pattern changed by 2014 (Figure 3). The specific numbers of excess cancer risk predicted for each location cannot be compared between the two maps because each map was produced using different sources of information and models. The pattern, however, can be compared and shows that elevated cancer risk is now more widespread across Southwestern PA and no longer primarily in Allegheny County.
Cancer risk maps are constructed by the EPA office of National Air Toxics Assessment (NATA) using models of reported air toxics and their relationship to cancer as a risk factor, as defined by NATA: “A risk level of “N”-in-1 million implies that up to “N” people out of one million equally exposed people would contract cancer if exposed continuously (24 hours per day) to the specific concentration over 70 years (an assumed lifetime). This would be in addition to cancer cases that would normally occur in one million unexposed people.” (https://www.epa.gov/national-air-toxics-assessment/nata-glossary-terms) In the current context, the NATA models are useful to compare the relative differences in air quality from a public health perspective, assuming the data on air pollutants is complete.
Another, very different statistic regarding cancer is the rate of cancer, also called the incidence. This number is based on actual reported cases and applies to cancers that occur due to all causes. The cancer rate, therefore, is a much higher number than a risk factor. For example, according to the US Center for Disease Control, the annual rate of new cases of cancer in PA in 2016, the most recent year reported, was 482.5 per 100,000 people. Compared to other states, PA is among the ten states with the highest cancer incidence. In the US, one in four people die from cancer, placing it second to heart disease as a leading cause of death. (https://gis.cdc.gov/Cancer/USCS/DataViz.html). Compared to other nations, the US has the fifth highest cancer rate, with 352 new cases each year per 100,000 people. (https://www.wcrf.org/dietandcancer/cancer-trends/data-cancer-frequency-country)
Compressor station emissions contribute to air pollutants known to be associated with cancer. For example, in a review of emissions for 18 CS in New York, Russo and Carpenter (2017) found that most or all CS released substances associated with a wide range of cancers (Table 6). Up to 56 such chemicals were emitted in amounts that totaled over 1 million pounds each year.
Maps of cancer risk are likely to be under-reporting risk levels in both the amount rates of risk and also the locations. Cancer risks from serious air pollutants cannot be properly mapped for several reasons. First, reports on concentrations of HAP in emissions are limited. HAP emissions are in accounts required only from large facilities, and thus, smaller operations, such as many CS, are likely be ignored. Second, general air quality monitoring stations are limited in location and do not measure HAP. For example, the PA DEP maintains 47 air quality stations dispersed among over 60 counties (http://www.dep.state.pa.us/dep/deputate/airwaste/aq/aqm/pollt.html). Most stations report hourly measures of Ozone and PM-2.5, and only a handful also monitor one or more other substances such as CO, NOx, SO ₂ or H2S. One county in Southwestern PA has additional air quality stations. Allegheny has a county health department that maintains 17 stations to report real-time air quality based on Ozone, SO2 or PM-2.5 (https://alleghenycounty.us/Health-Department/Programs/Air-Quality/Air-Quality.aspx).
In sum, cancer risk estimates from air pollution fall short in the following ways:
Estimates of air quality do not reflect the reality of air pollution from CS as well as many other new sources such as increased truck traffic associated with shale gas development.
Tallies of annual emissions do not represent the actual exposures of individuals to pulses of toxins.
Models of air pollution and cancer are not sufficiently based on real world studies of impacts from multiple toxins in short and long-term exposures.
Figure 2. Cancer risk map in Southwestern Pennsylvania in 2005 from the National Air Toxics Assessment program in the EPA. Total Lifetime Cancer Risk from Hazardous Air Pollutants (HAP) per million. Colors indicate yellow for 28-78, gold for 79-95, light orange for 99-148, orange for 149-271, bright orange for 272-517, and red for 518-744 excess cancer risk per million. (https://www.epa.gov/national-air-toxics-assessment)
Figure 3. Cancer risk map in Southwestern Pennsylvania in 2014 from the National Air Toxics Assessment in the EPA. Facilities are locations where air quality information was available for modeling. Total Risk of cancer as a baseline was assumed to be 1 per 1,000,000. Estimates of risk predict known air pollution sources alone will cause 1-24 excess cancers per million in Light Pink areas, 25-49 excess cancers per million in Gray areas, and 50-74 excess cancers per million in Blue areas. Source: EPA.
Table 6. Amounts of pollutants known to be associated with cancer in a review of 18 New York compressor stations. Emissions were grouped and tallied based on their impacts on disorders classified by ICD codes as defined by the International Statistical Classification of Diseases and Related Health Problems (ICD), a medical classification list by the World Health Organization. Source: Copy of Table 3b, Russo and Carpenter 2017.
ICD-10
Facilities
Chemicals
Pounds
#
Code
Description
‘08
‘11
‘14
Tot
‘08
‘11
‘14
Tot
2008
2011
2014
Total
1
C00-C97
Malignant neoplasms
18
18
17
18
53
54
54
56
744,394
1,679,621
1,583,745
4,007,761
2
C00-C14
Lip, oral cavity and pharynx
18
18
16
18
12
14
14
14
118,992
254,897
238,943
612,833
3
C15-C26
Digestive organs
18
18
16
18
37
38
38
38
121,690
258,670
241,866
622,227
4
C30-C39
Respiratory system and intrathoracic organs
18
18
17
18
36
37
37
38
740,798
1,673,574
1,579,882
3,994,254
5
C40-C41
Bone and articular cartilage
18
18
17
18
33
34
34
35
694,106
1,551,399
1,492,704
3,738,210
6
C43-C44
Skin
16
15
13
16
12
12
12
14
2,362
5,008
4,029
11,400
7
C45-C49
Connective and soft tissue
17
17
15
17
17
17
17
17
1,929
5,074
4,639
11,643
8
C50-C58
Breast and female genital organs
18
18
16
18
23
25
25
25
361,015
823,303
663,237
1,847,556
9
C60-C63
Male genital organs
18
17
16
18
12
13
13
13
111,217
233,176
224,147
568,541
10
C64-C68
Urinary organs
18
18
16
18
24
24
24
25
119,062
255,474
238,596
613,133
11
C69-C72
Eye, brain and central nervous system
18
18
16
18
20
20
20
20
121,282
258,655
241,954
621,892
12
C73-C75
Endocrine glands and related structures
18
17
16
18
10
10
10
10
112,911
235,120
225,269
573,300
13
C76-C80
Secondary and ill-defined
17
16
14
17
6
6
6
6
2,054
5,690
5,771
13,516
14
C81-C96
Malignant neoplasms, stated or presumed to be primary, of lymphoid, haematopoietic and related tissue
18
18
16
18
31
31
31
31
364,338
833,140
671,245
1,868,724
15
C97
Malignant neoplasms of independent (primary) multiple sites
0
0
0
0
0
0
0
0
0
0
0
0
16
D00-D09
In situ neoplasms
16
15
13
16
3
3
3
3
3,313
7,557
6,606
17,477
17
D10-D36
Benign neoplasms
17
17
14
17
27
27
27
27
12,499
35,013
23,068
70,580
18
D37-D48
Neoplasms of uncertain or unknown behavior
18
18
16
18
39
40
40
41
121,277
257,142
240,115
618,535
Measurements of Compressor Station Emissions
Studies of real-world concentrations of air pollutants from CS emissions are lacking, but some reports exist. Of these, a few records are in peer-reviewed studies, and cited in reviews such as Saunders et al. 2018. A few published reports are described below. They all show the high variation over time for CS emissions and the occurrence of peak concentrations.
Macey et al. (2014) observed ambient air near CS contained toxins at concentrations that impair health. They collected grab samples of air from industrial sites including CS in Arkansas and Pennsylvania and analyzed them for toxins using EPA approved methods. Most of the CS studied in Arkansas (Table 6) and Pennsylvania (Table 7) released formaldehyde at amounts associated with a cancer risk from exposure to this substance of 1/10,000 which is equivalent to 100 times higher risk than the widely accepted baseline risk of 1 per million. This means the amounts of formaldehyde found near CS substantially increased the risk of cancer using well-established federal analyses (https://www.atsdr.cdc.gov/hac/phamanual/appf.html). Some toxins Macey et al. recorded are less well studied than formaldehyde and benzene. For example, 1,3-butadiene is classified by the EPA as a known human carcinogen, but a calculation of cancer risk for this substance is lacking. Air samples in the Macey study were collected close to the CS (e.g., 30-42m) and at greater distances (e.g., 254-460m). Those distant samples were well beyond the 750-foot set-back rule for Pennsylvania. At all these distances, air movement modeling predicts that toxins released from a source such as a CS are likely to travel downwind within the air mass under most weather conditions, thus exposing residents near and further from CS. Many people, therefore, in homes, schools and businesses that are downwind of CS are likely to experience serious air toxins at concentrations that harm their health.
Air toxins were also measured by the Pennsylvania Department of Environmental Protection in 2010 in a variety of unconventional gas extraction facilities including one CS in Washington County, PA. Brown et al. (2015) reported these data, showing the concentrations that citizens could experience near a compressor station varied greater than tenfold within a day and among consecutive days (Table 8). The length of time for peak concentrations was unknown, but Brown et al. used a model of weather including wind patterns to estimate citizens are likely to experience 118 peak concentrations per year.
Goetz et al. (2015) sampled air in Marcellus shale regions of Pennsylvania for short periods (1-2.5 hrs.) at distances 480-1100 meters from eight CS, four with relatively small capacity (5,000-9,000 hp) and four with moderate capacity (14,000-17,000 hp). They found that each CS had a different pattern of relatively higher concentrations of some pollutants, such as NOX versus other pollutants, e.g., CO. Also, totals of all pollutants did not correlate with compressor engine capacity, probably because the CS they sampled include a mix of engines using fossil fuels and electric power. Goetz et al. concluded with recommendations for more comprehensive and longer-term monitoring to better understand air pollution from CS and all components in shale gas development.
Radionuclides in CS emissions are almost never measured, even though Marcellus shales are well known for containing elevated amounts of radiologic substances such as uranium, radium and radon. The only published report of testing for radionucleotides in CS emissions in PA was a test of a single CS emission for one period of time. In a review of radiation in shale gas industry components, the Pennsylvania Department of Environmental Protection (PA DEP) measured radon (Rn) in ambient air at one CS by deploying sample bags in four cardinal directions at the fence line at a height of 5 feet for 62 days. They reported Rn concentrations of 0.1-0.8 pCi/L, values they stated were within the range of outdoor air in the US. (https://www.dep.pa.gov/Business/Energy/OilandGasPrograms/OilandGasMgmt/Oil-and-Gas-Related-Topics/Pages/Radiation-Protection.aspx) Given the high variation of amounts of emissions from CS and variable chemistry in sources of gases released from combustion, blowdowns and leaks, frequent testing for radionucleotides should be standard in monitoring CS emissions.
Methane is the substance tracked most often in emissions from CS and other gas industry facilities because of its central role in operations, requirements to avoid explosive concentrations, and readily available measurement technology, in comparison to other substances emitted from CS. Although methane emissions from CS are not always correlated with amounts of other, more toxic emissions, patterns observed in plumes of methane from CS are likely to reflect elevated concentrations of other harmful substances from CS.
Nathan et al (2015) sampled methane emissions from one CS in the Barnett shale region using a sensor carried on a model aircraft. The open-path, laser sensor produced measures with a precision of 0.1 ppmv over short intervals, allowing researchers to see emission variation in time and space as the aircraft changed position. Based on 22 flights within a week period, they observed a substantial range in methane released from 0.3 – 73 g CH4 per second. These values calculate to 0.02 – 6.3 metric tons of methane per day, a range that matches that estimated by Goetz of 0.5 – 9 metric tons per day. In addition, Nathan et al. found high variability in concentrations at different heights, as the emission plumes shifted in response to wind velocity, direction and topography. They recommend caution in interpretations of ground-based emission monitors and called for more monitoring of air movements and emissions at different elevations.
Payne et al. 2017 confirmed these ideas when they mapped plumes of methane in CS in New York and Pennsylvania using a sensor capable of recording methane in parts per million (ppm) every 0.25 – 5 seconds. The sensor was located on a mobile unit that marked GPS location. They found high variability in the shape and extent of plumes. For example, one of most extensive plumes was recorded near Dimock, Pennsylvania in a locale with CS as the only major source of methane. Researchers recorded the highest concentrations of methane in the study, 22 ppm, at 500 m from the CS, with a second peak of 0.6 ppm noted over 1 km from the CS and elevated methane as far as 3 km from the site (Figure 4). Wind direction did not always predict the shape of the plume, but data collection was restricted by the path of the sensor and the transport vehicle (Figure 8). Most importantly, they found that …“during atmospheric temperature inversions, when near-ground mixing of the atmosphere is limited or does not occur, residents and properties located within 1 mile of a compressor station can be exposed to rogue methane from these point sources.” These residents are likely to also experience excess toxins from CS as well, especially under such weather conditions.
Exposure to peak concentrations of air pollutants have dramatic effects on health for several reasons. First, lungs carry toxins into the blood within seconds, and the blood quickly transfers compounds to the brain and other vital organs. Many of the substances released by compressor stations impact the central nervous system as seen in Table 3, and these toxins are released simultaneously. Citizens, therefore inhaling a plume of emissions will have impacts from the total of these compounds. The health impacts for these combined toxins are unknown, and especially of concern during pregnancy and child development. Exposure studies in animals and humans test individual substances and the Center for Disease Control and NIOSH use these to develop exposure guidelines for a healthy adult in a work-place. In contrast, residents near compressor stations will include citizens of all ages with various health conditions. For example, the American Lung Association determined that over 50% of the 360,000 residents of Westmoreland County are at greater risk for health impairment due to air pollution because they have one or more of these conditions: asthma, diabetes, heart disease, respiratory illness, advanced age (https://www.lung.org/our-initiatives/healthy-air/sota/key-findings/people-at-risk.html).
In sum, the research on CS emissions of methane, air pollutants such as NOx, and hazardous air pollutants such as formaldehyde and benzene, all indicate exposures to CS emissions pose a threat to public health, but the emissions have not yet been fully quantified and modeled. Documenting CS contributions to harmful ambient air quality is feasible, however. The published studies from as far back as 2011 indicate that instrumentation to record substances and weather are readily available. Activities within a station such as compressor function, blowdowns, venting and flaring are all recorded by operators, but such reports are not released to researchers or the public. The science of models that predict public health risks in response to air pollution exposure are highly developed. In sum, operators of CS have the technology to measure emissions and ambient air quality and scientists have the models, but lack of industry data prevents the public from knowing impacts from CS.
Table 6. Air toxins found in grab samples near Arkansas compressor stations including concentrations, the Agency for Toxic Substances and Disease Registry (ASTDR), Minimum Risk Level (MRL) exceedance, and the Environmental Protection Agency (EPA) Integrated Risk Information System (IRIS) cancer risk. Source: Copy of Table 4 from Macey et al. 2014.
State/ID
County
Nearest infrastructure
Chemical
Concentration (μg/m3)
ATSDR MRLs
exceeded
EPA IRIS cancer risk exceeded
AR-3136-003
Faulkner
355 m from compressor
Formaldehyde
36
C
1/10,000
AR-3136-001
Cleburne
42 m from compressor
Formaldehyde
34
C
1/10,000
AR-3561
Cleburne
30 m from compressor
Formaldehyde
27
C
1/10,000
AR-3562
Faulkner
355 m from compressor
Formaldehyde
28
C
1/10,000
AR-4331
Faulkner
42 m from compressor
Formaldehyde
23
C
1/10,000
AR-4333
Faulkner
237 m from compressor
Formaldehyde
44
C, I
1/10,000
AR-4724
Van Buren
42 m from compressor
1,3-butadiene
8.5
n/a
1/10,000
AR-4924
Faulkner
254 m from compressor
Formaldehyde
48
C, I
1/10,000
C = chronic; I = intermediate.
Table 7. Air toxins found in grab samples near Pennsylvania compressor stations including concentrations, the Agency for Toxic Substances and Disease Registry (ASTDR), Minimum Risk Level (MRL) exceedance, and the Environmental Protection Agency (EPA) Integrated Risk Information System (IRIS) cancer risk. Source: Copy of Table 5 from Macey et al. 2014
State
ID
County
Nearest infrastructure
Chemical
Concentration (μg/m3)
ATSDR MRLs
exceeded
EPA IRIS cancer risk exceeded
PA-4083-003
Susquehanna
420 m from compressor
Formaldehyde
8.3
1/10,000
PA-4083-004
Susquehanna
370 m from compressor
Formaldehyde
7.6
1/100,000
PA-4136
Washington
270 m from PIG launcha
Benzene
5.7
1/100,000
PA-4259-002
Susquehanna
790 m from compressor
Formaldehyde
61
C, I, A
1/10,000
PA-4259-003
Susquehanna
420 m from compressor
Formaldehyde
59
C, I, A
1/10,000
PA-4259-004
Susquehanna
230 m from compressor
Formaldehyde
32
C
1/10,000
PA-4259-005
Susquehanna
460 m from compressor
Formaldehyde
34
C
1/10,000
C = chronic; A = acute; I = intermediate.
aLaunching station for pipeline cleaning or inspection tool.
Table 8. Variation in air pollutants measured in ug/cubic meter by PA DEP during two sampling times per day for three consecutive days near a compressor station in Southwest PA. Source: Copied from Table 1. Brown et al. 2015 based on data from Southwestern Pennsylvania Short Term Marcellus Ambient Air Sampling Report, Pennsylvania Department of Environmental Protection, Nov. 2010.
May 18
May 19
May 20
Chemical
Morning
Evening
Morning
Evening
Morning
Evening
3-day Average
Ethylbenzene
No detect
No detect
964
2015
10,553
27,088
13,540
n-Butane
385
490
326
696
12,925
915
5,246
n-Hexane
No detect
536
832
11,502
33,607
No detect
15,492
2-Methyl Butane
No detect
230
251
5137
14,271
No detect
6,630
Iso-butane
397
90
No detect
1481
3,817
425
2070
Figure 4. Methane emission plumes from compressor stations near Dimock, Pennsylvania (left) and Springvale, Pennsylvania (right). Source: Copied from Payne et al. 2017.
Compressor Station Locations
Prior to 2008, compressor stations were infrequent with one or a few per county broadly distributed across PA as part of gas transport from locations outside of PA (Figure 5). These pipelines were mainly an issue for public health in the case of explosions. Major transmission pipelines use pressures up to 1500 psi. Leaks, therefore, release large amounts of gas much of which is not noticed because it lacks the mercaptan odorant added to household methane. For example, the 30-inch Spectra gas pipeline that exploded in 2016 in Westmoreland County caused a hole 12 feet deep and1500 square feet in area and burned 40 acres. The PA DEP claimed to have measured air quality, but they did not arrive until long after the plume from the fire traveled downwind. This pipeline was transporting gas from one of the largest gas storage facilities in the country, the Sunoco Gas Depot in Delmont, Pennsylvania to New Jersey as part of over 9,000 miles of pipelines in the Texas Eastern system from the Gulf Coast to the Northeast. That section of pipeline was built in 1981 and had recently been increased in pressure, probably using older or newer compressors in nearby locations. Faulty joints between pipeline sections were blamed for the catastrophic release of gas. (Phillips, S. 2016. State Impact, NPR). Immediately after the explosion, while gas continued to pour out of the pipeline, emergency workers needed at least one hour to locate shut-off locations. In general, pipeline shut-offs are sited at compressors stations or at intervals along a pipeline.
CS abundance in counties with shale gas extraction increased over tenfold in the decade after 2005 when the gas industry obtained exemptions to the Clean Water Act and began unconventional gas extraction in Pennsylvania (Figure 6). Permit applications for new wells, pipelines and CS continue throughout southwest Pennsylvania. In PA, the Oil and Gas law states the following: “ In order to allow for the reasonable development of oil and gas resources, a local ordinance … Shall authorize natural gas compressor stations as a permitted use in agricultural and industrial zoning districts and as a conditional use in all other zoning districts, if the natural gas compressor building meets the following standards:….(i) is located 750 feet or more from the nearest existing building or 200 feet from the nearest lot line, whichever is greater, unless waived by the owner of the building or adjoining lot;” (Pennsylvania Statutes Title 58 Pa.C.S.A. Oil and Gas §3304). CS and many aspects of the shale gas industry are controlled by this state law.
Each stage of gas extraction involves emissions that can be close or far from the well pad. Most emissions involve diesel engines. Diesel engines are well-known to produce substantial amounts of VOC’s, NOx and particulate pollution (PM-2.5, PM-10). Well pad construction requires intense activity by diesel trucks and earth moving equipment. Well drilling uses diesel engines. From 3 – 5 million gallons of water are used for each fracking event and up to 300 truck visits are needed to transport water for the many wells that are not close to water supplies from piped sources. Trucks are used to transport the 1 – 2 million gallons of produced water that emerges from the well for disposal in injection wells likely to be distant from most wells. Additional waste is carried long distances as well, including drill cuttings and sludge. For example, shale gas industry waste was handled for years in Max Environmental, one of the largest industrial waste sites in the eastern US located in Yukon, Westmoreland County since the 1960’s. Within one mile of Yukon is Reserved Environmental, a waste facility with operations focused since 2008 on processing sludge from fracking into solid cakes to be trucked to other landfills. In sum, all stages of shale gas industry contribute to many poorly documented sources of air pollution likely to be near CS.
The density of CS in some areas such as southwest Pennsylvania impacts the local and regional air quality. For example, Westmoreland County has 50 CS and 341 shale gas wells (https://www.fractracker.org) and some neighboring counties have even more shale gas emission sources. People in Westmoreland County receive pollutants from shale gas activities in their immediate vicinity and additional air pollutants from CS and other industries in neighboring counties. Wind patterns shown in Figure 7 indicate Westmoreland County is frequently downwind from Washington County, a county with a very high density of shale gas operations, and Eastern Allegheny County where large industries such as coke works release substantial amounts of air pollutants.
Figure 5. Compressor Stations prior to 2008 and in around 2013. Source: Copied from article by James Hilton in Pittsburgh Post-Gazette.
Figure 6. Compressor Stations in Pennsylvania mapped in 2019. Source: FracTracker Alliance. 2000.
Figure 7. Wind patterns at small airports around Pennsylvania 1991-2005 showing predominant direction of wind and velocity in knots (Orange 0 – 4, Yellow 4 – 7, Turquoise 7 – 11, Medium Blue 11 – 17, Dark Blue 17 – 21). Source: The Pennsylvania State Climatologist.
Costs of Compressor Stations and Air Pollution
As permanent, constant sources of air and noise pollution and safety risks, CS add significant costs to communities. Poor air quality alone is well-established as an economic drain for a region due to many factors including increased health care, lower property values, a declining tax base, and difficulty in attracting new businesses or housing development. Litovitz et al. (2013) estimated that, compared to other activities of shale gas extraction, CS made up the majority of the annual emissions of important air toxins in 2011, and therefore a majority of the damages from air pollution, totaling 4 – 24 million dollars of the 7 – 32 million dollars of the aggregate air pollution damages from gas operations (Table 9).
Litovitz and others recognize that the costs of damages from the gas industry air pollution in 2011 may appear smaller than the state-wide impacts from other industries, such as coal burning power plants and coke production, but that appearance deserves a second look. First, shale gas extraction activities are concentrated in a few regions of Pennsylvania, and local air quality is most relevant to public health and local economics such as property values. Second, emissions from gas extraction in 2011 was only in its early stages in Pennsylvania and shale gas operations will expand greatly unless regulations change, while coal-fired power plants are declining due to the advanced age of most facilities. For example, in Westmoreland County, PA alone there are over 50 CS in 2020, the number currently in the entire state of New York, where unconventional gas development was suspended due, in large part, to concerns for public health. Costs from one aspect of an energy sector can be viewed in the context of economic and other benefits of alternative energy efforts. For example, Jacobson et al. (2013) estimated that shifting to clean, renewable energy in NY state would prevent 4000 premature deaths each year and save $33 billion/year through air pollution reductions that impact health care, crop production and other costs. Jacobson et al. used government data in their models regarding health benefits and also identified substantial job growth during and after the transition away from fossil fuels toward renewable energy. Pennsylvania has the potential to attain similar benefits in air quality, public health, savings and job growth gained from a shift to clean, renewable energy in place of fossil fuels.
Table 9. a) Emissions from shale gas industry in 2011 throughout Pennsylvania in metric tons per year. b) Costs of damages due to air pollution from shale gas extraction in 2011 throughout Pennsylvania. Copied from Tables 5 and 6 in Litovitz et al. 2013.
a)
Activities
VOC
NOx
PM2.5
PM10
SOx
(1) Transport
31–54
550–1000
16–30
17–30
0.82–1.4
(2) Well drilling and hydraulic fracturing
260–290
6600–8100
150–220
150–220
6.6–190
(3) Production
71–1800
810–1000
15–78
15–78
4.8–6.2
(4) Compressor stations
2200–8900
9300–18 000
280–1100
280–1100
0–340
Totalᵃ
2500–11 000
17 000–28 000
460–1400
460–1400
12–540
ᵃ These totals are reported to two significant figures, as are all intermediate emissions values in this document. The activity emissions may not exactly sum to the totals.
b)
Activities
Timeframe
Total regional damage for 2011 ($2011)
Average per well or per MMCF damage ($2011)
(1) Transport
Development
$320 000–$810 000
$180–$460 per well
(2) Well drilling, fracturing
Development
$2 200 000–$4 700 0
$1 200-$2 700 per well
(3) Production
Ongoing
$290 000–$2 700 0
$0.27-$2.60 per MMCF
(4) Compressor stations
Ongoing
$4 400 000–$24 000 000
$4.20-$23.00 per MMCF
(1)-(4) Aggregated
Both
$7 200 000–$32 000 000
NA
Major Studies Cited in Text:
Brown, David, Celia Lewis, Beth I. Weinberger and Heather Bonaparte. 2014. Understanding air exposure from natural gas drilling put air standards to the test. Reviews in Environmental Health. https://doi.org/10.1515/reveh-2014-0002
Brown, David, Celia Lewis and Beth I. Weinberger. 2015. Human exposure to unconventional natural gas development; a public health demonstration of high exposure to chemical mixtures in ambient air. Journal of Environmental Science and Health (Part A) 50: 460-472.
Ciencewicki, J. and I. Jaspers 2007. Air Pollution and Respiratory Viral Infection. Inhalation Toxicology 19:1135–1146, DOI: https://doi.org/10.1080/08958370701665434
Currie, J, M Greenstone and K Meckel. 2017. Hydraulic fracturing and infant health: New evidence from Pennsylvania. Science Advances 2017;3:e1603021
Goetz, J.D. E. Floerchinger, E., C. Fortner, J. Wormhoudt, P. Massoli, W. Berk Knighton, S.C. Herndon, C.E. Kolb, E. Knipping, S. L. Shaw, and P. F. DeCarlo. 2015. Atmospheric Emission Characterization of Marcellus Shale Natural Gas Development Sites. Environ. Sci. Technol. 49, 7012−7020. DOI: https://doi.org/10.1021/acs.est.5b00452
Jacobson, MZ, RW Howarth, MA Delucchi, ST Scobie, JH Barth, M Dvorak, M Klevze, H. Hatkhuda, B. Mirand, NA Chowdhury, R Jones, L Plano, AR Ingraffea. 2013. Examining the feasibility of converting New York State’s all-purpose energy infrastructure to one using wind, water, and sunlight. Energy Policy 57: 585-601.
Litovitz, A., A. Curtright, S. Abramzon, N. Burger and C. Samaras. 2013. Estimation of regional air-quality damages from Marcellus Shale natural gas extraction in Pennsylvania. Environ. Res. Lett. 8; 014017 (8pp) doi:10.1088/1748-9326/8/1/014017. https://iopscience.iop.org/article/10.1088/1748-9326/8/1/014017/meta
Macey, G.P., Breech, R., Chernaik, M. (2014) Air concentrations of volatile compounds near oil and gas production: a community-based exploratory study. Environ Health 13, 82 (2014). https://doi.org/10.1186/1476-069X-13-82
McKenzie, LM, G Ruisin, RZ Witter, DA Savitz, LS Newman, JL Adgate. 2014. Birth Outcomes and Maternal Residential Proximity to Natural Gas Development in Rural Colorado. Environmental Health Perspectives Vol 22. http://dx.doi.org/10.1289/ehp.1306722.
Payne, RA, P Wicker, ZL Hildenbrand, DD Carlton, and KA Schug. 2017. Characterization of methane plumes downwind of natural gas compressor stations in Pennsylvania and New York. Science of The Total Environment 580:1214-1221
Russo, PN and DO Carpenter 2017. Health Effects Associated with Stack Chemical Emissions from NYS Natural Gas Compressor Stations: 2008-2014 Institute for Health and the Environment, A Pan American Health Organization / World Health Organization Collaborating Centre in Environmental Health, University at Albany, 5 University Place, Rensselaer New York. Https://www.albany.edu/about/assets/Complete_report.pdf
Saunders, P.J., D. McCoy. R. Goldstein. A. T. Saunders and A. Munroe. 2018. A review of the public health impacts of unconventional natural gas development Environ Geochem Health 40:1–57. https://doi.org/10.1007/s10653-016-9898-x
Appendix
Compressor Stations in Westmoreland Co. PA in Dec 2019, based on information from FracTracker Alliance, Pennsylvania Department of Environmental Protection Air Quality Report, and the Department of Homeland Security.
ID #
Facility #
Name/Operator
Municipality
Latitude
Longitude
Status
627743
645570
CNX GAS CO/HICKMAN COMP STA
Bell Twp
40.5174
-79.5498
Active
693305
696606
PEOPLES TWP/RUBRIGHT COMP STA
Bell Twp
40.5278
-79.5561
Active
626482
644726
CNX GAS CO/BELL POINT COMP STA
Bell Twp
40.5413
-79.5338
Active
na
na
NORTH OAKFORD
Delmont
40.4018
-79.5597
Active
714057
713241
RW GATHERING LLC/ECKER BERGMAN RD COMP STA
Derry Twp
40.3533
-79.3028
Active
760724
752063
RE GAS DEV/ORGOVAN COMP STA
Derry Twp
40.3857
-79.4019
Active
736807
732436
RW GATHERING LLC/SALEM COMP STA
Derry Twp
40.3908
-79.3361
Active
714057
713241
RW GATHERING LLC/ECKER BERGMAN RD COMP STA
Derry Twp
40.3533
-79.3028
Active
774714
766854
EQT GATHERING LLC/DERRY COMP STA
Derry Twp
40.4511
-79.3161
Active
na
na
Layman Compressor, Range Resources Appalachia, LLC
East Huntingdon
40.1113
-79.6345
Unknown
na
na
Key Rock Energy/LLC
East Huntingdon
40.1228
-79.6489
Unknown
662759
673466
Kriebel Minerals Inc./Sony Compressor Station (Inactive)
East Huntingdon
40.181
-79.5882
Unknown
662781
673477
Lynn Compressor, Kriebel Minerals Inc.
East Huntingdon
40.1798
-79.5557
Unknown
636316
660570
Range Resources Appalachia/ Layman Compressor Station
East Huntingdon
40.1086
-79.6359
Unknown
na
na
Keyrock Energy LLC/ Hribal Compresor Station, East Huntingdon, Pa. (active)
East Huntingdon
40.1353
-7905653
Unknown
761545
752755
KeyRock Energy LLC/ Hribal Compressor Station (Active)
East Huntingdon
40.1333
-79.55
Unknown
649767
663499
Range Resources Appalachia/Schwartz Comp. Station
East Huntingdon
40.0879
-79.601
Unknown
652968
665874
TEXAS KEYSTONE/FAIRFIELD TWP COMP STA
Fairfield Twp
40.3363
-79.1786
Active
557780
572987
EQUITRANS LP/W FAIRFIELD COMP STA
Fairfield Twp
40.3333
-79.1167
Active
675937
683303
DIVERSIFIED OIL & GAS LLC/MURPHY COMP SITE
Fairfield Twp
40.3362
-79.1122
Active
812881
806928
TEXAS KEYSTONE INC/ MURPHY COMP STA
Fairfield Twp
40.3543
-79.1123
Active
na
na
SOUTH OAKFORD/Dominion
Greensburg
40.365
-79.5585
Unknown
na
na
OAKFORD
Greensburg
40.3848
-79.5489
Active
na
na
DELMONT
Geensburg
40.382
-79.5554
Active
496667
626720
Silvis Compressor Station, Exco Resources Pa. Inc
Hempfield
40.2022
-79.5526
Unknown
na
na
Dominion Trans Inc., Lincoln Heights
Hempfield Township
40.3004
-79.6193
Active
812660
806731
CNX Gas Co. LLC
Hempfield Township
40.2957
-79.6277
Active
812661
806732
CNX Gas Co. LLC/ Jackson Compressor Station, Status: Active
Hempfield Township
40.2931
-79.6119
Unknown
601521
626775
PEOPLES NATURAL GAS CO/ARNOLD COMP STA
Lower Burrell City
40.3623
-79.4316
Active
812883
806930
TEXAS KEYSTONE INC/LOYALHANNA
Loyalhanna Twp
40.4514
-79.4727
Inactive
na
na
J.B. TONKIN
Murrysville Boro
40.4629
-79.6402
Active
815083
809310
HUNTLEY & HUNTLEY INC/BOARST COMP STA
Murrysville Boro
40.4686
-79.6417
Inactive
735725
731655
MTN GATHERING LLC/10078 MAINLINE COMP STA
Murrysville Boro
40.4708
-79.65
Active
241708
276314
Dominion Trans Inc/Jeannette
Penn Township
40.3317
-79.5935
inactive
na
701239
DOMINION ENERGY TRANS INC/ROCK SPRINGS COMP STA
Salem Twp
40.4052
-79.5546
Unknown
na
na
OAKFORD
Salem Twp
40.4052
-79.5546
Unknown
465965
495182
EQT GATHERING/SLEEPY HOLLOW COMP STA
Salem Twp
40.3634
-79.5426
Inactive
465965
495182
EQT GATHERING/SLEEPY HOLLOW COMP STA
Salem Twp
40.3634
-79.5426
Inactive
483173
512126
COLUMBIA GAS TRANS CORP/DELMONT COMP STA
Salem Twp
40.3871
-79.5638
Active
707759
708010
LAUREL MTN MIDSTREAM OPR LLC/SALEM COMP STA
Salem Twp
40.3782
-79.4929
Active
459024
488214
CNX Gas Co./ Jacobs Creek Compressor Station,
South Huntingdon Twp
40.1172
-79.6681
Unknown
634559
650802
Rex Energy I LLC/Launtz
Unity Twp
40.3325
-79.4295
Unknown
na
668776
Keyrock Energy LLC/ Unity Compressor Station
Unity Twp
40.2251
-79.5109
Unknown
na
na
Nelson/RE Gas Dev LLC
UnityTwp
40.3378
-79.4348
Unknown
657366
66932
People’s Natural Gas/ Latrobe Compressor Station
Unity Twp
40.3075
-79.4369
Inactive
812662
806733
CNX Gas Co. LLC, Troy Compressor Station
Unity Twp
na
na
Unknown
657366
564168
Dominion Peoples (Inactive)
Unity Twp
40.3073
-79.4371
Inactive
815196
809457
HUNTLEY & HUNTLEY INC/WASHINGTON STATION
Washington Twp
40.4967
-79.6206
Active
605562
629821
PEOPLES NATURAL GAS/MERWIN COMP STA
Washington Twp
40.5083
-79.6203
Active
815203
809466
HUNTLEY & HUNTLEY INC/TARPAY STA
Washington Twp
40.5222
-79.6186
Active
na
na
Mamont (CNX GAS CO/MAMONT COMP STA)
Washington Twp
40.5046
-79.5862
Unkown
741197
735870
CONE MIDSTREAM PARTNERS LP/MAMONT COMP STA
Washington Twp
40.5067
-79.5644
Active
Feature image of a compressor station within Loyalsock State Forest, PA. Photo by Brook Lenker, FracTracker Alliance, June 2016.
Pennsylvania’s House Bill 1100, sponsored by state Rep. Mike Turzai, has passed through the House and Senate with broad bipartisan support. If approved, the bill would provide billions of dollars in subsidies to energy and fertilizer companies that use fracked natural gas as feedstock.
The Bill is part of “Energize PA,” a package of bills that encourage natural gas and petrochemical development by providing companies with streamlined permitting processes and subsidies. The Shell ethane cracker plant in Beaver County received $1.6 billion in state subsidies, the largest tax break in state history. HB1100 would provide similar tax credits to additional petrochemical and natural gas projects.
According to its Republican sponsors, HB1100 is “designed to make Pennsylvania attractive to outside businesses, create family-sustaining jobs and provide economic benefits to underserved regions, without creating any new fees or taxes.” Indeed, the cumulative wage impacts of the Appalachian basin shale gas build-out was around $21 billion from 2004 to 2016, according to a 2019 Carnegie Mellon University study.
March 25, 2020 Update
After weeks of sitting on the bill, the Pennsylvania General Assembly passed HB1100, and the Pennsylvania Senate submitted it to Governor Wolf on March 18. This came amidst the chaos of the COVID-19 outbreak. The Governor is still expected to veto the bill, after which point, the General Assembly is likely to attempt an override.
March 27, 2020 Update
Governor Wolf said in his press release:
“Rather than enacting this bill, which gives a significant tax credit for energy and fertilizer manufacturing projects, we need to work together in a bipartisan manner to promote job creation and to enact financial stimulus packages for the benefit of Pennsylvanians who are hurting as they struggle with the substantial economic fallout of COVID-19.” Read the full press release here.
However, both Energize PA and HB1100 have been criticized for their overall economic inefficacy and environmental externalities. The aforementioned CMU study found that the cumulative air pollution damage cost about $23 billion and the cumulative greenhouse gas damage reached $34 billion, leading the authors to conclude that the negative environmental and health externalities outweigh the benefits of shale gas development.
Diana Polson, Senior Policy Analyst at Pennsylvania Budget and Policy Center, has also raised concerns about the economics of the petrochemical buildout in Pennsylvania. At a recent town hall meeting in Millvale, Pennsylvania, she made the point that tax incentives are rarely a deciding factor in a company’s decision on where to operate. This means that initiatives like “Energize PA” have little impact in terms of private investment decisions. Many factors outweigh the impact that tax credits have on a private company’s bottom line, such as proximity to a strong workforce, other existing industries, and access to supply chains.
Employment
What about job creation? The Pennsylvania Department of Revenue estimates that the HB1100 tax credit program would cost the Commonwealth $22 million per plant per year over the next 30 years. Diana Polson estimates that this would equate to about $8.8 million per permanent job over the course of the tax break.
This cost-to-job ratio is unacceptable to representatives like Sara Innamorato. “According to Shell, the cracker plant in Beaver will support 6,000 construction jobs at the peak of work, but will only lead to a possible 600 permanent jobs. Each of these jobs costs $2.75 million in subsidies — money that could have sustained many more families currently struggling to make ends meet in our communities,” the State Representative wrote. “Imagine how many workers we could employ with that level of investment in rebuilding our crumbling roads and bridges, replacing lead pipes, and repairing bus-swallowing sinkholes.”
Corporate tax revenue has fallen to 14% of Pennsylvania’s General Fund revenue, about half of what it was in the 1970’s. Without these corporate tax cuts, Pennsylvania would have about $4 billion more in corporate tax revenue per year than it does today. Critics like Innamorato believe that the state should respond to an already large public investment deficit by subsidizing investments such as education, human services, infrastructure, and environmental protection. HB1100 runs counter such public investments, particularly Democratic Governor Tom Wolf’s efforts to instate a severance tax on fracking operations that would subsidize infrastructure projects.
Environmental & Climate Impacts
Critics of HB1100 also raise environmental concerns. Much of the petrochemical buildout in the Appalachian basin would produce plastics, exacerbating the problem of single-use plastic pollution. There are also worries about the industry’s contributions to climate change. A recent report co-authored by FracTracker Alliance and the Center for Environmental Integrity found that plastic production and incineration in 2019 contributed greenhouse gas emissions equivalent to that of 189 new 500-megawatt coal power plants. If plastic production and use grow as currently planned, these emissions could rise to the equivalent to the emissions released by more than 295 coal-fired power plants. Locking in these emissions for decades to come has some wondering how Pennsylvania will reach its carbon budget goal of 58 million tons of CO2 in 2050.
Health Concerns
In addition to economic and environmental concerns, HB1100 has come under criticism for its potential to worsen the health impacts associated with natural gas and petrochemical development, which range from asthma attacks, cardiovascular disease, strokes, abnormal heart rhythms and heart attacks. Research has also shown that natural gas and petrochemical development increase the risk of cancer, and there is growing evidence that air pollution affects fetal development and adverse birth outcomes.
Moving Forward
It is now in the hands of Governor Wolf to either pass or veto HB1100. Wolf’s spokesman J.J. Abbott said that the governor “believes such projects should be evaluated on a specific case-by-case basis. However, if there was a specific project, he would be open to a conversation.”
One in three jobs in Pennsylvania’s energy sector are in clean energy. Many taxpayers will continue to push for policies that support this kind of job creation and investment in public services and infrastructure. Will our Commonwealth leaders listen, or will they continue to prioritize fossil fuel companies?
Learn More
Visualize the petrochemical buildout by exploring FracTracker’s maps.
Penn Future and dozens of other groups are holding a press conference in Harrisburg on March 9th.
Harrisburg Press Conference - March 9
When: Monday, March 9, 10:00 – 11:00 AM
Where: Pennsylvania State Capitol – Main Rotunda
State and Third Street
Harrisburg, PA 17101
The list of speakers is subject to change. Current confirmed speakers include: Jacquelyn Bonomo, President and C.E.O., PennFuture State Representative Sara Innamorato, (21st House District) State Representative Chris Rabb, (200th House District) State Representative Carolyn Comitta, (156th House District) State Senator Katie Muth, (44th Senatorial District) Veronica Coptis, Executive Director, The Center for Coalfield Justice Ashleigh Deemer, Deputy Director, PennEnvironment Rabbi Daniel Swartz, Temple Hesed Briann Moye, One Pennsylvania
You can contact PennFuture Western Pennsylvania Outreach Coordinator, Kelsey Krepps, at krepps@pennfuture.org or (412) 224 – 4477 with any questions or concerns.
Cover photo showing early construction (2016) of the Shell Ethane Cracker in Beaver County, PA. By Ted Auch, FracTracker Alliance. Aerial assistance provided by LightHawk. Provided by FracTracker Alliance, fractracker.org/photos.
https://www.fractracker.org/a5ej20sjfwe/wp-content/uploads/2020/03/Shell-Ethane-Cracker-6-scaled.jpg8171500Shannon Smithhttps://www.fractracker.org/a5ej20sjfwe/wp-content/uploads/2025/09/2025-Wordmark-Logo.pngShannon Smith2020-03-05 12:57:122021-04-15 14:16:54House Bill 1100: What you need to know
FracTracker Alliance has released a new national map, filled with energy and petrochemical data. Explore the map, continue reading to learn more, and see how your state measures up!
This map has been updated since this blog post was originally published, and therefore statistics and figures below may no longer correspond with the map
The items on the map (followed by facility count in parenthesis) include:
For oil and gas wells, view FracTracker’s state maps.
Transportation & Storage
Natural gas compressor stations (1,367) – Facilities built along a pipeline route that pressurize natural gas to keep it flowing through the pipeline.
Crude oil rail terminals (94) – Rail terminals that load and unload crude oil (liquid hydrocarbons that have yet to be processed into higher-value petroleum products).
Liquefied natural gas import/export terminals (8) – Facilities that can a) liquefy natural gas so it can be exported as LNG (liquefied natural gas) and/or b) re-gasify LNG so it can be used as natural gas. Natural gas is transported in a liquid state because it takes up less space as a liquid than as a gas.
Natural Gas Underground Storage (486) – Locations where natural gas is stored underground in aquifers, depleted gas fields, and salt formations.
Petroleum Product Terminals (1,484) – Terminals with a storage capacity of 50,000 barrels or more and/or the ability to receive volumes from tanker, barge, or pipeline. Petroleum products include products “produced from the processing of crude oil and other liquids at petroleum refineries, from extraction of liquid hydrocarbons at natural gas processing plants, and from production of finished petroleum products at blending facilities.”
Petroleum Ports (242) – A port that can import and/or export 200,000 or more short tons of petroleum products a year.
Natural gas import/export pipeline facility (54) – A facility where natural gas crosses the border of the continental United States.
Pipelines
Crude oil pipelines – major crude oil pipelines, including interstate truck lines and selected intrastate lines, but not including gathering lines.
Natural gas liquid pipelines – Also referred to as hydrocarbon gas liquid pipelines, they carry the heavier components of the natural gas stream which are liquid under intense pressure and extreme cold, but gas in normal conditions.
Natural gas pipelines– Interstate and intrastate natural gas pipelines. Due to the immensity of this pipeline network and lack of available data, this pipeline layer in particular varies in degree of accuracy.
Petroleum Product Pipelines – Major petroleum product pipelines.
Recent Pipeline Projects – Pipeline projects that have been announced since 2017. This includes projects in various stages, including under construction, complete, planned or canceled. Click on the pipeline for the status.
Processing & Downstream
Natural Gas Processing Plants (478) – Plants that separate impurities and components of the natural gas stream.
Chemical plants (36) – Includes two types of chemical plants – petrochemical production and ammonia manufacturing – that report to EPA’s Greenhouse Gas Reporting Program.
Ethylene Crackers (30) – Also referred to as ethane crackers, these petrochemical complexes that converts ethane (a natural gas liquid) into ethylene. Ethylene is used to make products like polyethylene plastic.
Petroleum Refineries (135) – A plant that processes crude oil into products like petroleum naphtha, diesel fuel, and gasoline.
Power Plants (9,414) – Electric generating plants with a capacity of at least one megawatt, sorted by energy source.
Wind Turbines (63,003) – Zoom in on wind power plants to see this legend item appear.
Natural Resources
Shale Plays (45) – Tight oil and gas shale plays, which are formations where oil and gas can be extracted.
Major Rivers
Solar Energy Potential – Potential solar energy generation, in kilowatt-hours per square meter per day – averaged annually.
This map is by no means exhaustive, but is exhausting. It takes a lot of infrastructure to meet the energy demands from industries, transportation, residents, and businesses – and the vast majority of these facilities are powered by fossil fuels. What can we learn about the state of our national energy ecosystem from visualizing this infrastructure? And with increasing urgency to decarbonize within the next one to three decades, how close are we to completely reengineering the way we make energy?
Key Takeaways
Natural gas accounts for 44% of electricity generation in the United States – more than any other source. Despite that, the cost per megawatt hour of electricity for renewable energy power plants is now cheaper than that of natural gas power plants.
The state generating the largest amount of solar energy is California, while wind energy is Texas. The state with the greatest relative solar energy is not technically a state – it’s D.C., where 18% of electricity generation is from solar, closely followed by Nevada at 17%. Iowa leads the country in relative wind energy production, at 45%.
The state generating the most amount of energy from both natural gas and coal is Texas. Relatively, West Virginia has the greatest reliance on coal for electricity (85%), and Rhode Island has the greatest percentage of natural gas (92%).
With 28% of total U.S. energy consumption for transportation, many of the refineries, crude oil and petroleum product pipelines, and terminals on this map are dedicated towards gasoline, diesel, and other fuel production.
Petrochemical production, which is expected to account for over a third of global oil demand growth by 2030, takes the form of chemical plants, ethylene crackers, and natural gas liquid pipelines on this map, largely concentrated in the Gulf Coast.
Electricity generation
The “power plant” legend item on this map contains facilities with an electric generating capacity of at least one megawatt, and includes independent power producers, electric utilities, commercial plants, and industrial plants. What does this data reveal?
In terms of the raw number of power plants – solar plants tops the list, with 2,916 facilities, followed by natural gas at 1,747.
In terms of megawatts of electricity generated, the picture is much different – with natural gas supplying the highest percentage of electricity (44%), much more than the second place source, which is coal at 21%, and far more than solar, which generates only 3% (Figure 1).
Figure 1. Electricity generation by source in the United States, 2019. Data from EIA.
This difference speaks to the decentralized nature of the solar industry, with more facilities producing less energy. At a glance, this may seem less efficient and more costly than the natural gas alternative, which has fewer plants producing more energy. But in reality, each of these natural gas plants depend on thousands of fracked wells – and they’re anything but efficient.
The cost per megawatt hour of electricity for a renewable energy power plants is now cheaper than that of fracked gas power plants. A report by the Rocky Mountain Institute, found “even as clean energy costs continue to fall, utilities and other investors have announced plans for over $70 billion in new gas-fired power plant construction through 2025. RMI research finds that 90% of this proposed capacity is more costly than equivalent [clean energy portfolios, which consist of wind, solar, and energy storage technologies] and, if those plants are built anyway, they would be uneconomic to continue operating in 2035.”
The economics side with renewables – but with solar, wind, geothermal comprising only 12% of the energy pie, and hydropower at 7%, do renewables have the capacity to meet the nation’s energy needs? Yes! Even the Energy Information Administration, a notorious skeptic of renewable energy’s potential, forecasted renewables would beat out natural gas in terms of electricity generation by 2050 in their 2020 Annual Energy Outlook.
This prediction doesn’t take into account any future legislation limiting fossil fuel infrastructure. A ban on fracking or policies under a Green New Deal could push renewables into the lead much sooner than 2050.
In a void of national leadership on the transition to cleaner energy, a few states have bolstered their renewable portfolio.
Figure 2. Electricity generation state-wide by source, 2019. Data from EIA.
One final factor to consider – the pie pieces on these state charts aren’t weighted equally, with some states’ capacity to generate electricity far greater than others. The top five electricity producers are Texas, California, Florida, Pennsylvania, and Illinois.
Transportation
In 2018, approximately 28% of total U.S. energy consumption was for transportation. To understand the scale of infrastructure that serves this sector, it’s helpful to click on the petroleum refineries, crude oil rail terminals, and crude oil pipelines on the map.
Transportation Fuel Infrastructure. Data from EIA.
The majority of gasoline we use in our cars in the US is produced domestically. Crude oil from wells goes to refineries to be processed into products like diesel fuel and gasoline. Gasoline is taken by pipelines, tanker, rail, or barge to storage terminals (add the “petroleum product terminal” and “petroleum product pipelines” legend items), and then by truck to be further processed and delivered to gas stations.
China leads the world in this movement. In 2018, just over half of the world’s electric vehicles sales occurred in China. Analysts predict that the country’s oil demand will peak in the next five years thanks to battery-powered vehicles and high-speed rail.
In the United States, the percentage of electric vehicles on the road is small but growing quickly. Tax credits and incentives will be important for encouraging this transition. Almost half of the country’s electric vehicle sales are in California, where incentives are added to the federal tax credit. California also has a “Zero Emission Vehicle” program, requiring electric vehicles to comprise a certain percentage of sales.
We can’t ignore where electric vehicles are sourcing their power – and for that we must go back up to the electricity generation section. If you’re charging your car in a state powered mainly by fossil fuels (as many are), then the electricity is still tied to fossil fuels.
Petrochemicals
Many of the oil and gas infrastructure on the map doesn’t go towards energy at all, but rather aids in manufacturing petrochemicals – the basis of products like plastic, fertilizer, solvents, detergents, and resins.
Natural gas processing plants separate components of the natural gas stream to extract natural gas liquids like ethane and propane – which are transported through the natural gas liquid pipelines. These natural gas liquids are key building blocks of the petrochemical industry.
Ethane crackers process natural gas liquids into polyethylene – the most common type of plastic.
The chemical plants on this map include petrochemical production plants and ammonia manufacturing. Ammonia, which is used in fertilizer production, is one of the top synthetic chemicals produced in the world, and most of it comes from steam reforming natural gas.
As we discuss ways to decarbonize the country, petrochemicals must be a major focus of our efforts. That’s because petrochemicals are expected to account for over a third of global oil demand growth by 2030 and nearly half of demand growth by 2050 – thanks largely to an increase in plastic production. The International Energy Agency calls petrochemicals a “blind spot” in the global energy debate.
Petrochemical development off the coast of Texas, November 2019. Photo by Ted Auch, aerial support provided by LightHawk.
Investing in plastic manufacturing is the fossil fuel industry’s strategy to remain relevant in a renewable energy world. As such, we can’t break up with fossil fuels without also giving up our reliance on plastic. Legislation like the Break Free From Plastic Pollution Act get to the heart of this issue, by pausing construction of new ethane crackers, ensuring the power of local governments to enact plastic bans, and phasing out certain single-use products.
“The greatest industrial challenge the world has ever faced”
Mapped out, this web of fossil fuel infrastructure seems like a permanent grid locking us into a carbon-intensive future. But even more overwhelming than the ubiquity of fossil fuels in the US is how quickly this infrastructure has all been built. Everything on this map was constructed since Industrial Revolution, and the vast majority in the last century (Figure 3) – an inch on the mile-long timeline of human civilization.
Figure 3. Global Fossil Fuel Consumption. Data from Vaclav Smil (2017)
In fact, over half of the carbon from burning fossil fuels has been released in the last 30 years. As David Wallace Wells writes in The Uninhabitable Earth, “we have done as much damage to the fate of the planet and its ability to sustain human life and civilization since Al Gore published his first book on climate than in all the centuries—all the millennia—that came before.”
What will this map look like in the next 30 years?
A recent report on the global economics of the oil industry states, “To phase out petroleum products (and fossil fuels in general), the entire global industrial ecosystem will need to be reengineered, retooled and fundamentally rebuilt…This will be perhaps the greatest industrial challenge the world has ever faced historically.”
Is it possible to build a decentralized energy grid, generated by a diverse array of renewable, local, natural resources and backed up by battery power? Could all communities have the opportunity to control their energy through member-owned cooperatives instead of profit-thirsty corporations? Could microgrids improve the resiliency of our system in the face of increasingly intense natural disasters and ensure power in remote regions? Could hydrogen provide power for energy-intensive industries like steel and iron production? Could high speed rail, electric vehicles, a robust public transportation network and bike-able cities negate the need for gasoline and diesel? Could traditional methods of farming reduce our dependency on oil and gas-based fertilizers? Could zero waste cities stop our reliance on single-use plastic?
Of course! Technology evolves at lightning speed. Thirty years ago we didn’t know what fracking was and we didn’t have smart phones. The greater challenge lies in breaking the fossil fuel industry’s hold on our political system and convincing our leaders that human health and the environment shouldn’t be externalized costs of economic growth.
https://www.fractracker.org/a5ej20sjfwe/wp-content/uploads/2020/02/National-map-feature-3.png400900Erica Jacksonhttps://www.fractracker.org/a5ej20sjfwe/wp-content/uploads/2025/09/2025-Wordmark-Logo.pngErica Jackson2020-02-28 17:35:142022-05-02 15:21:42National Energy and Petrochemical Map
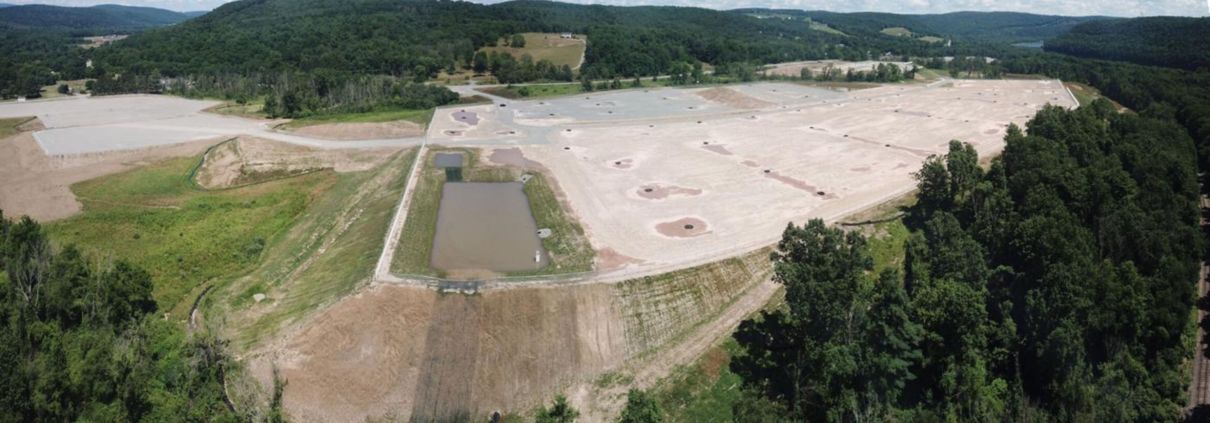

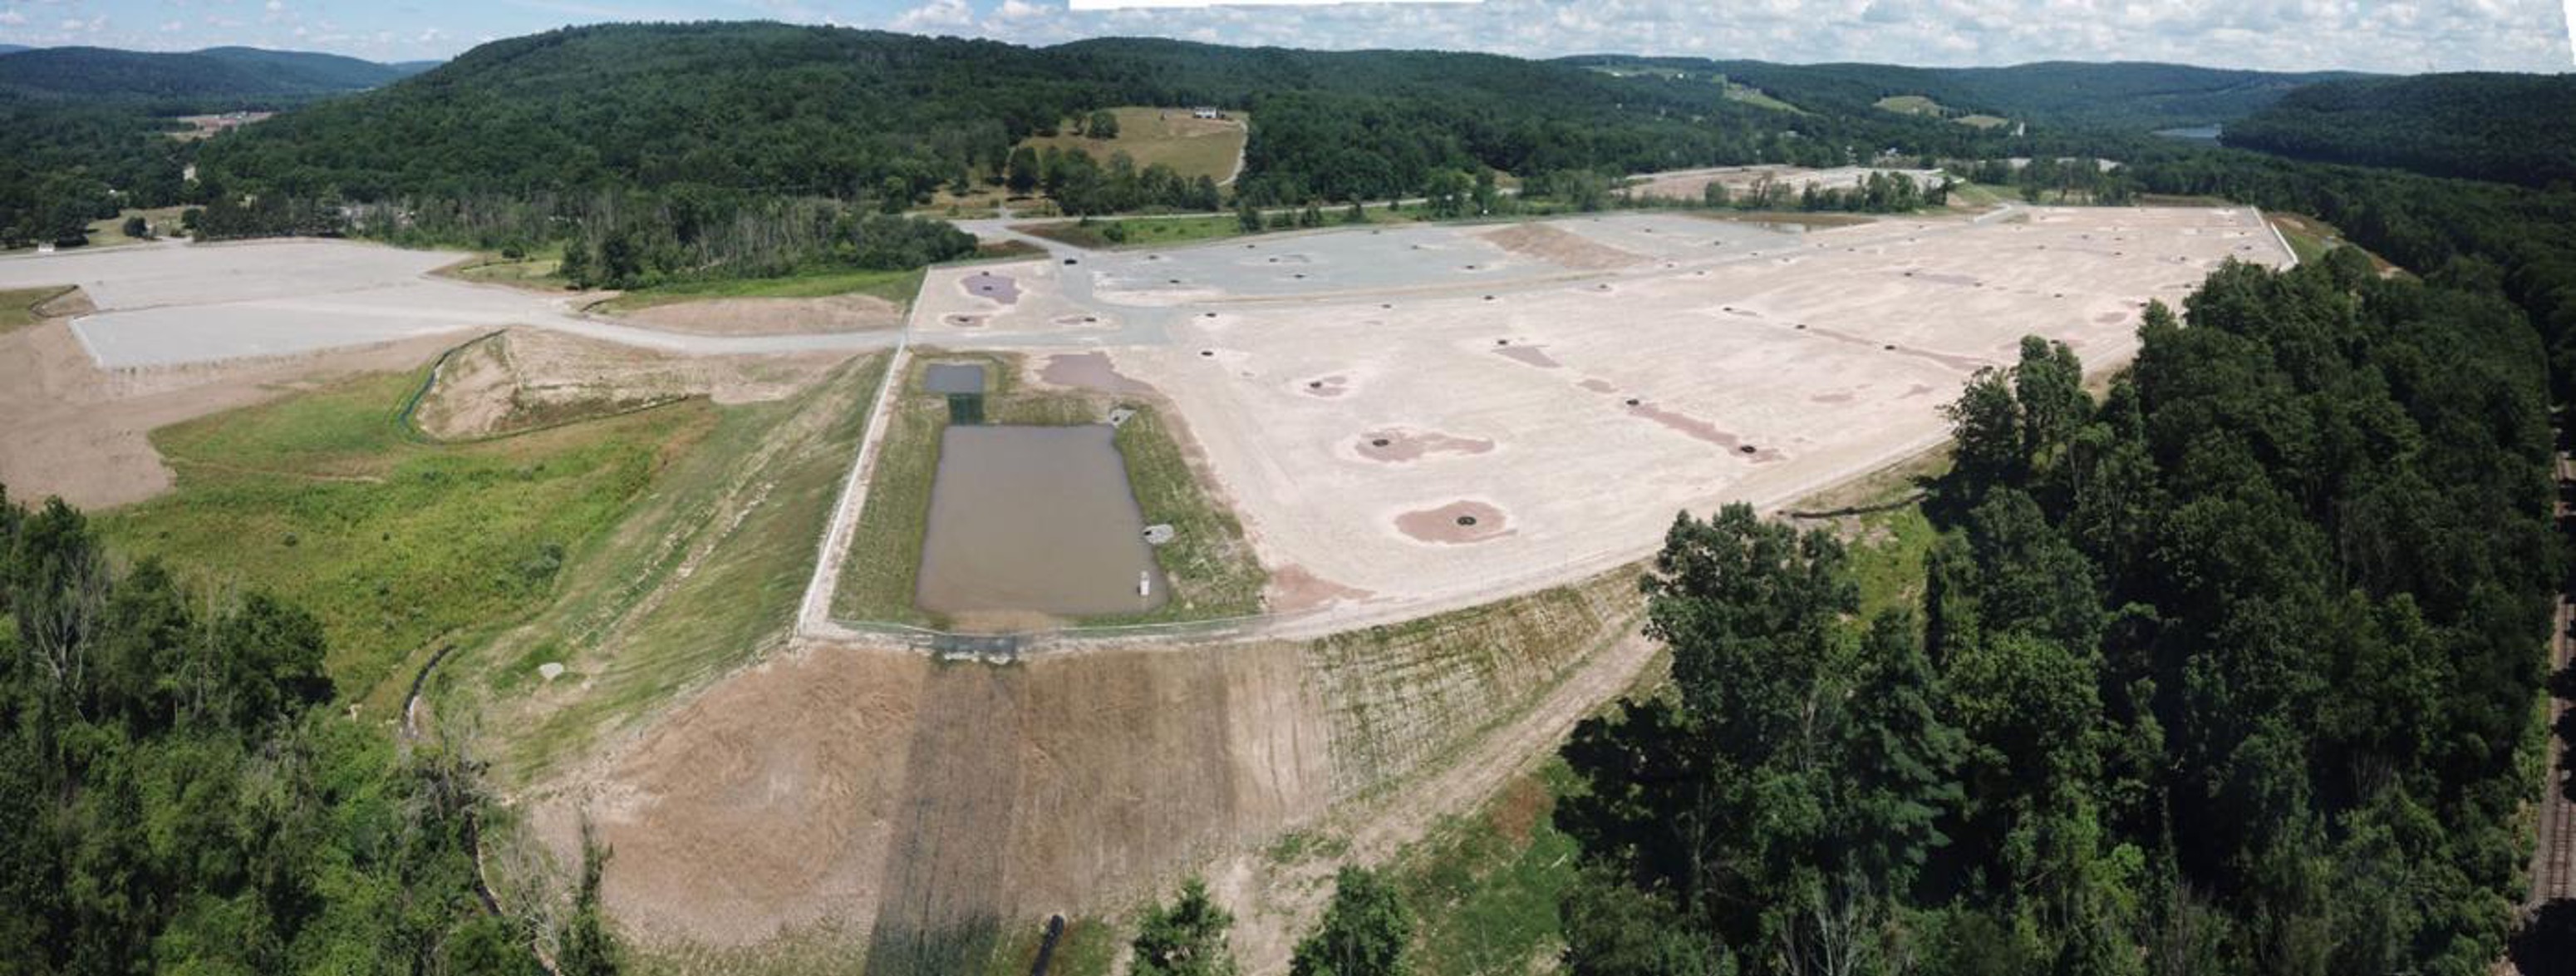
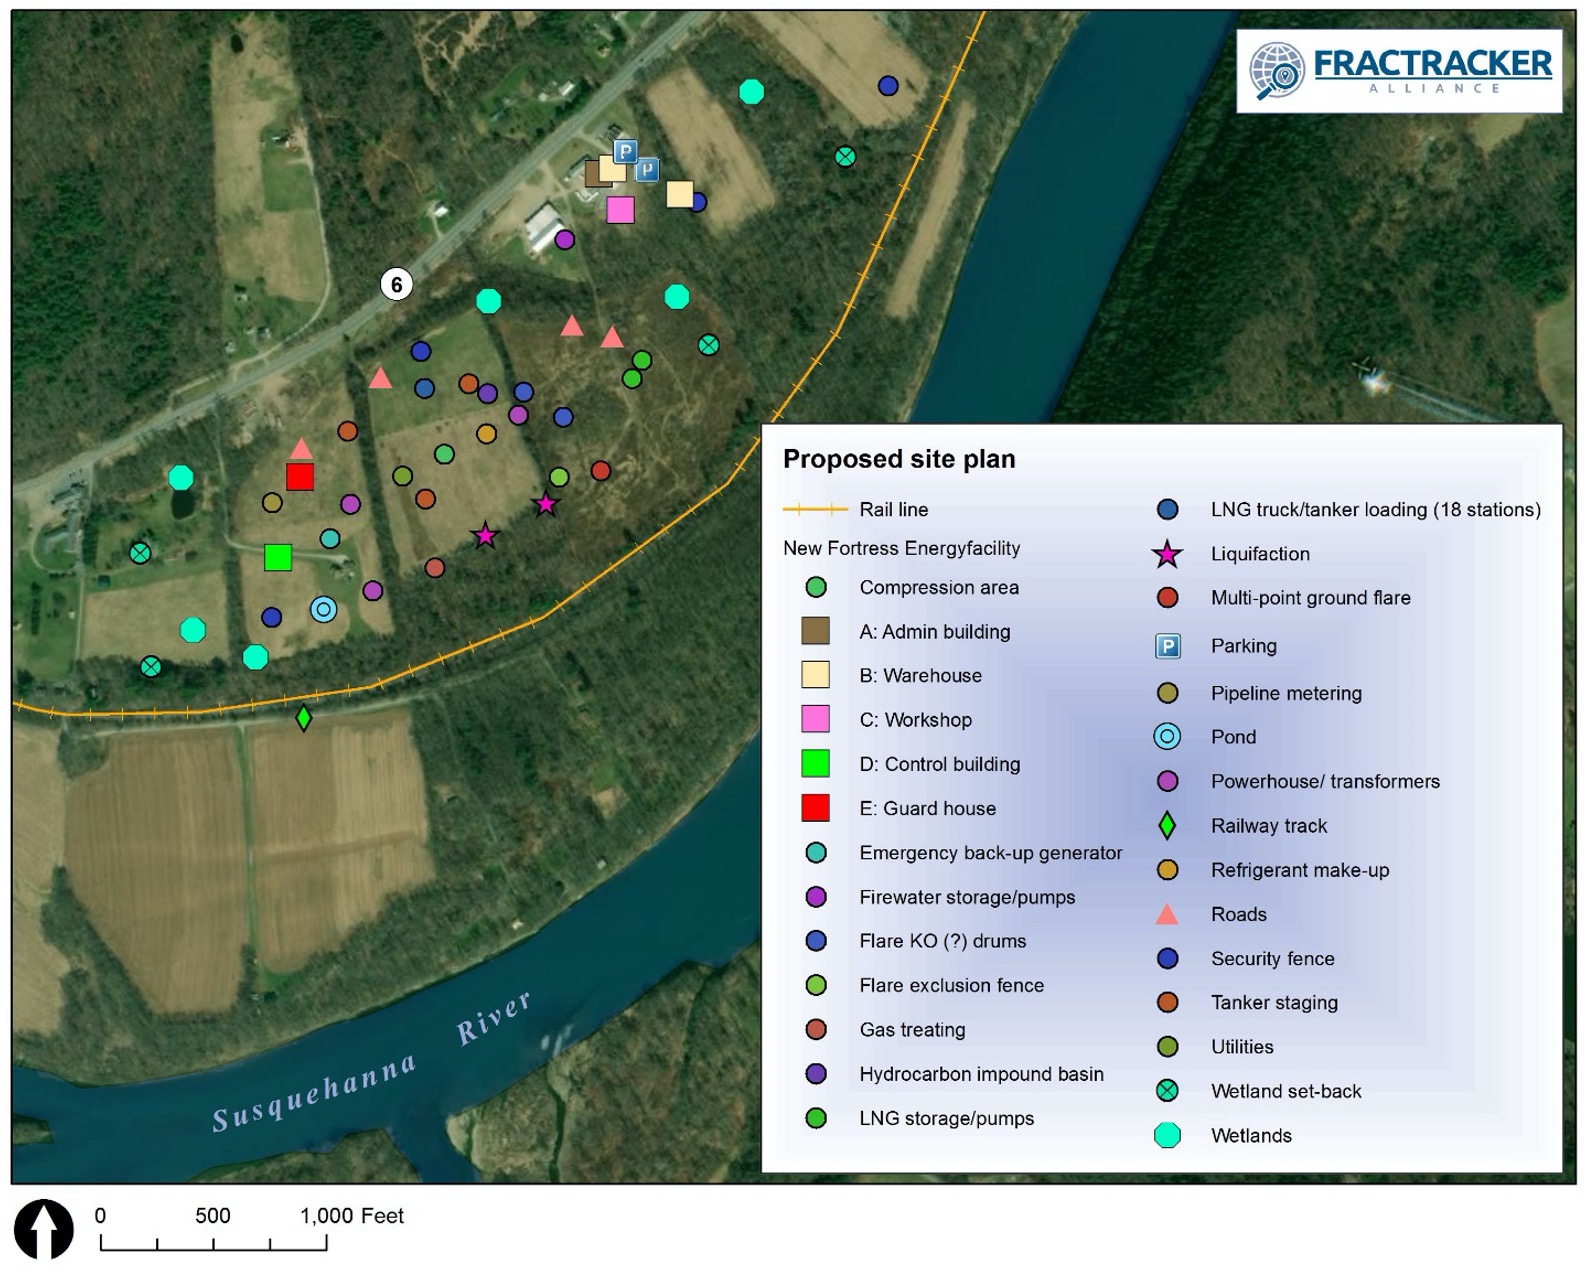
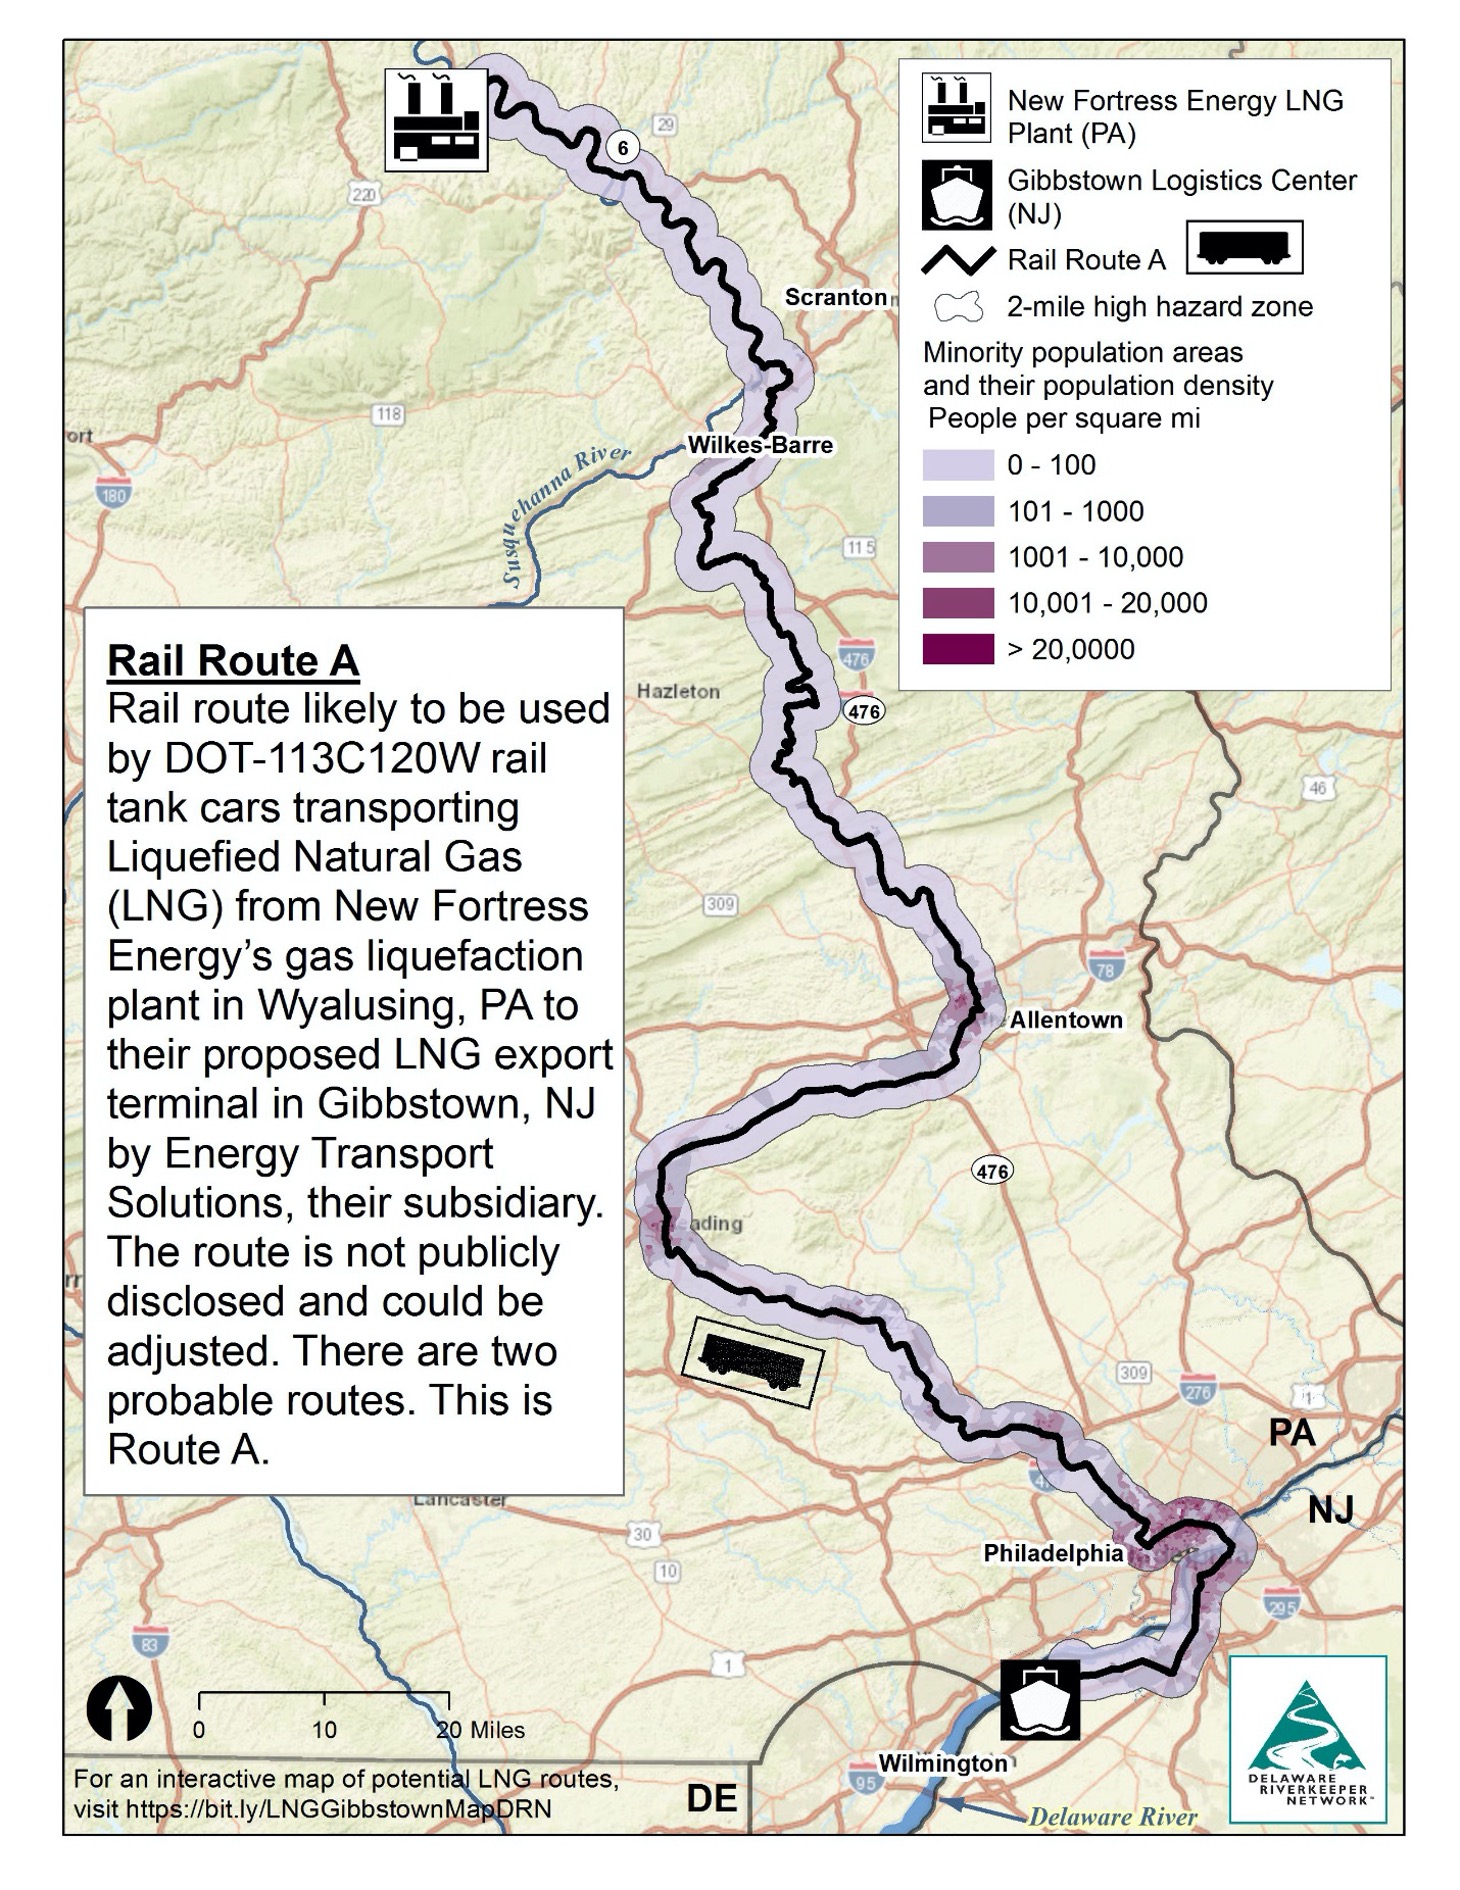
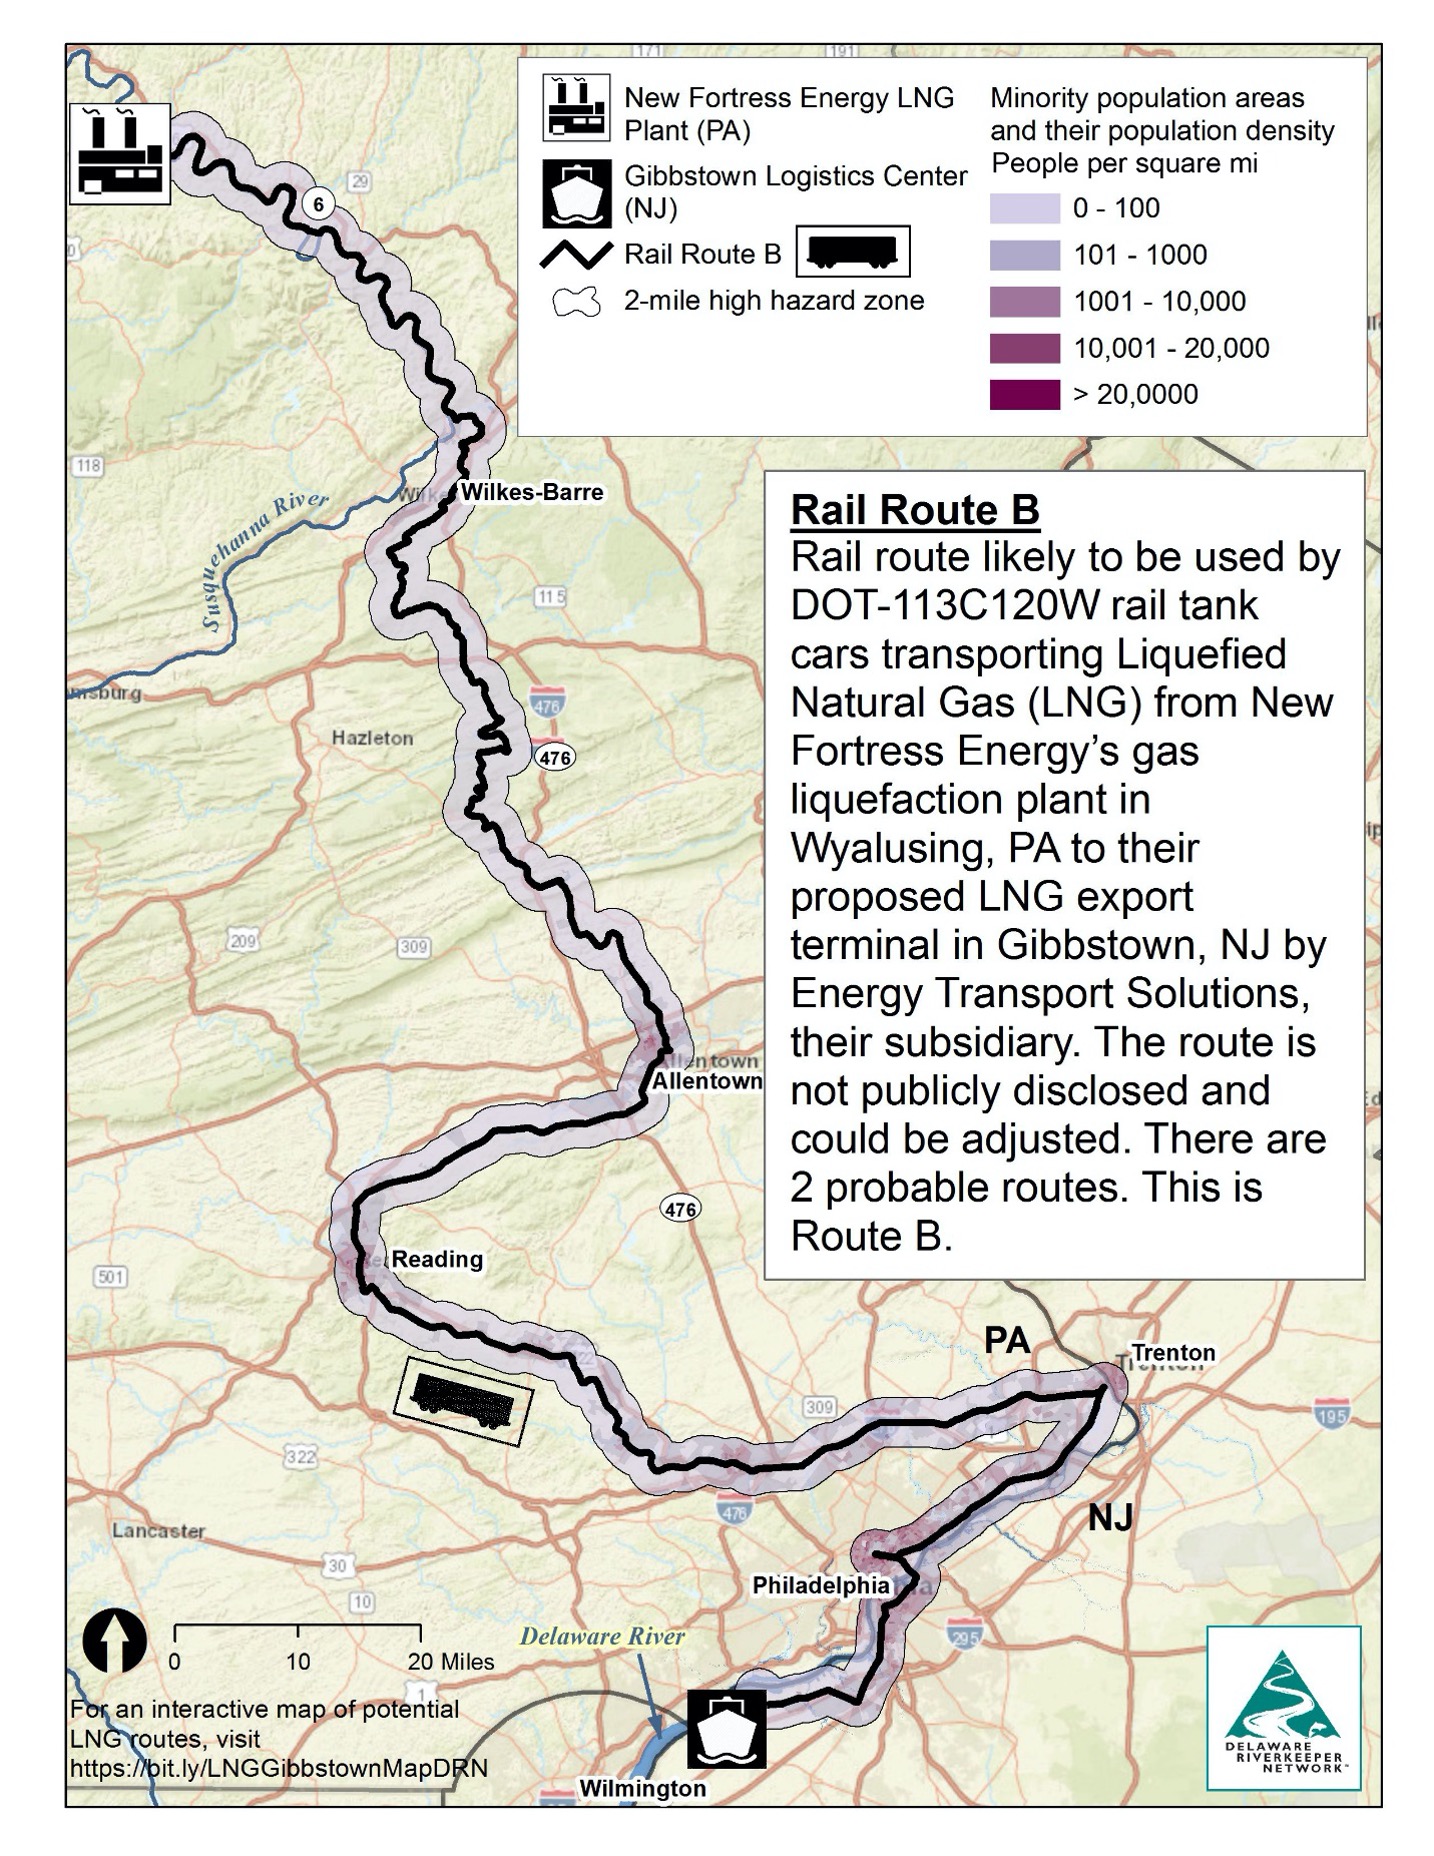
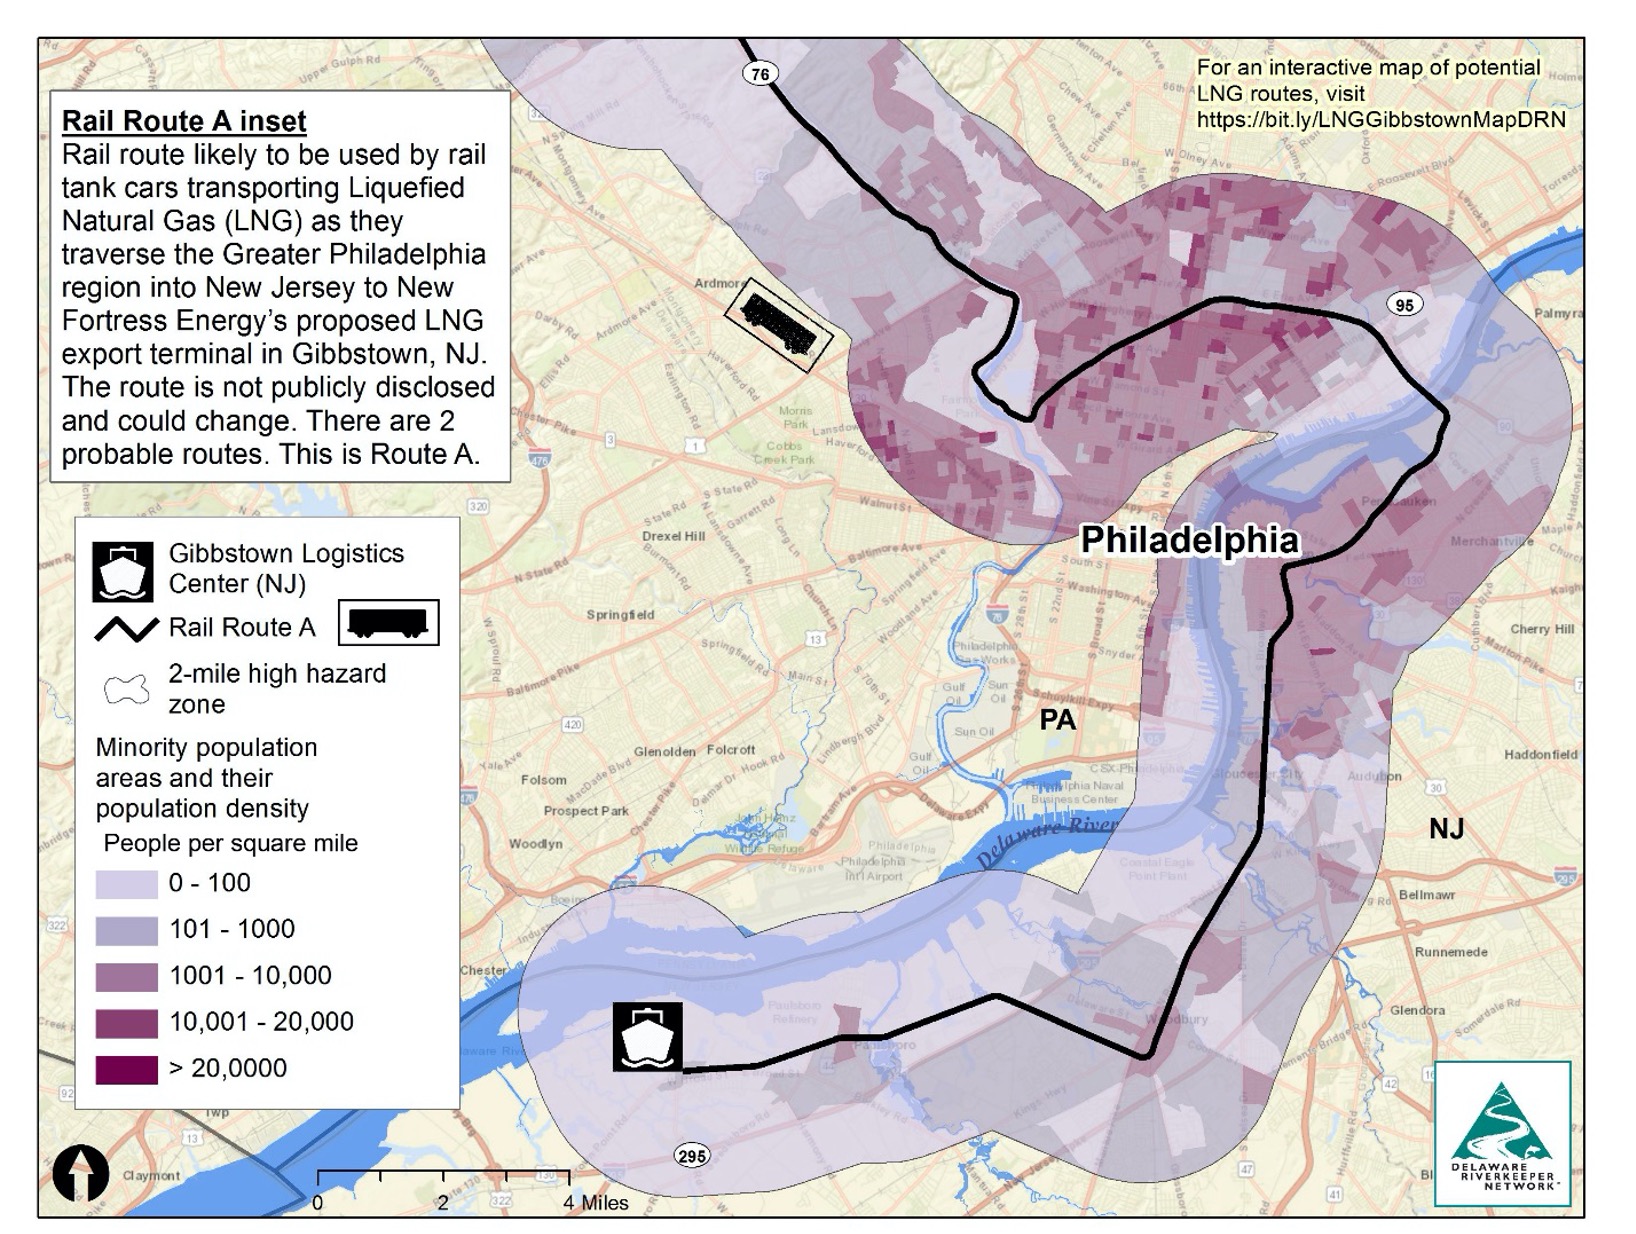
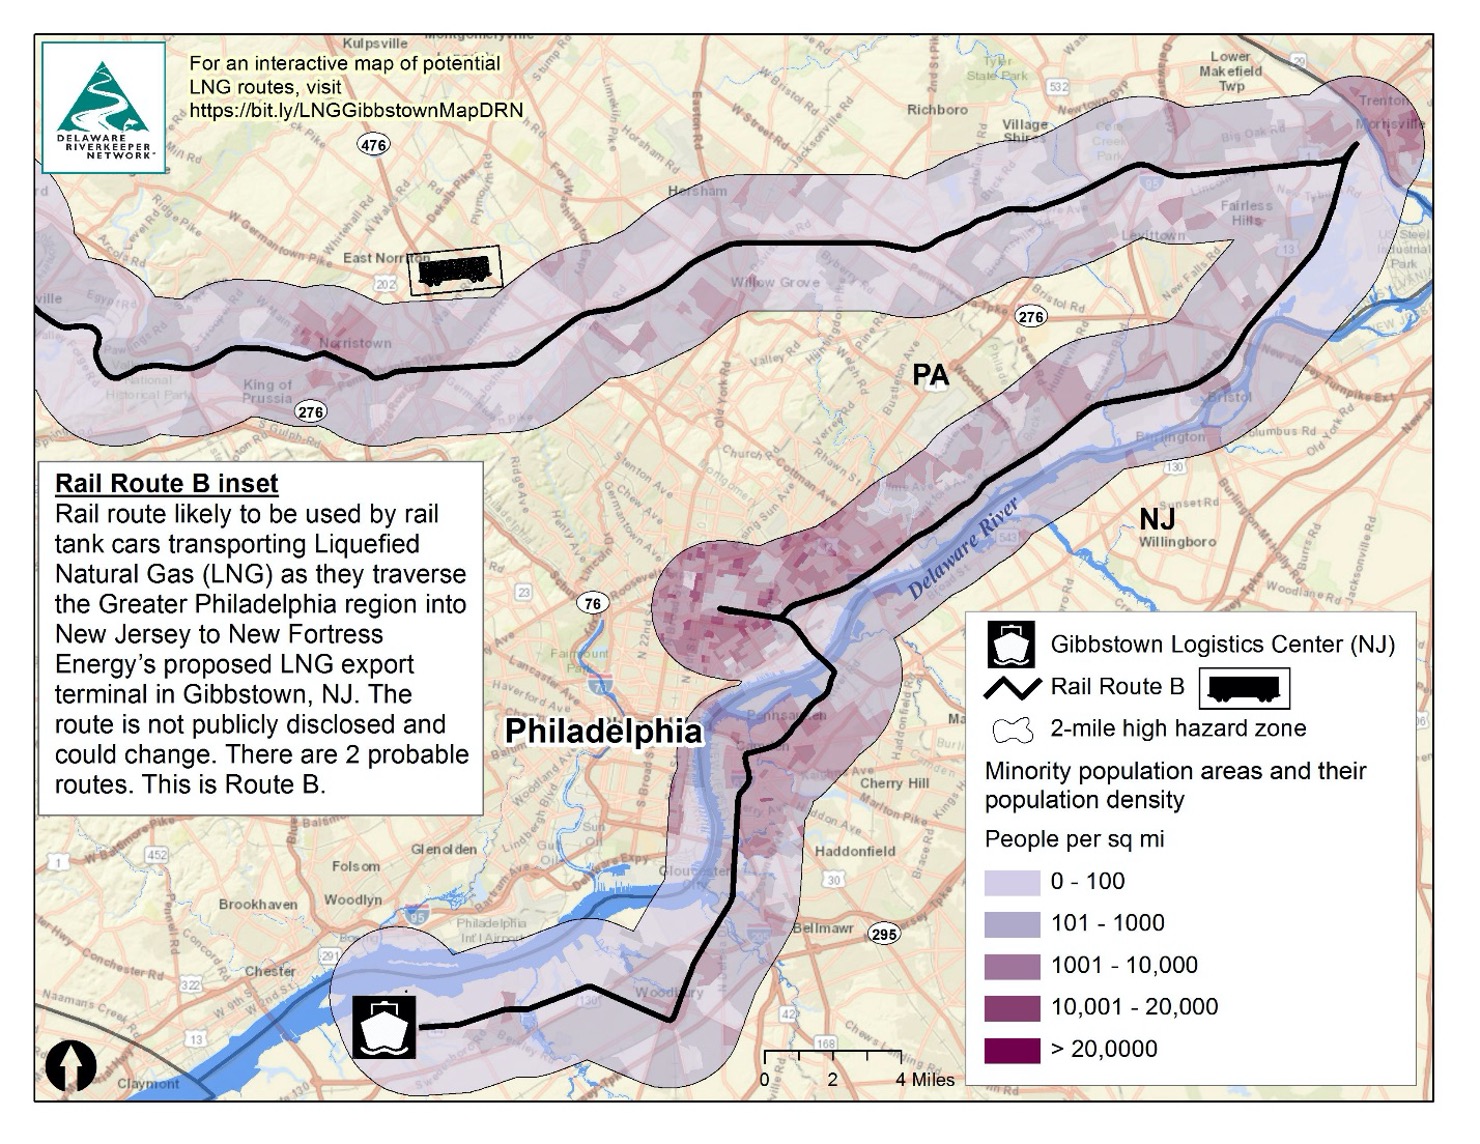
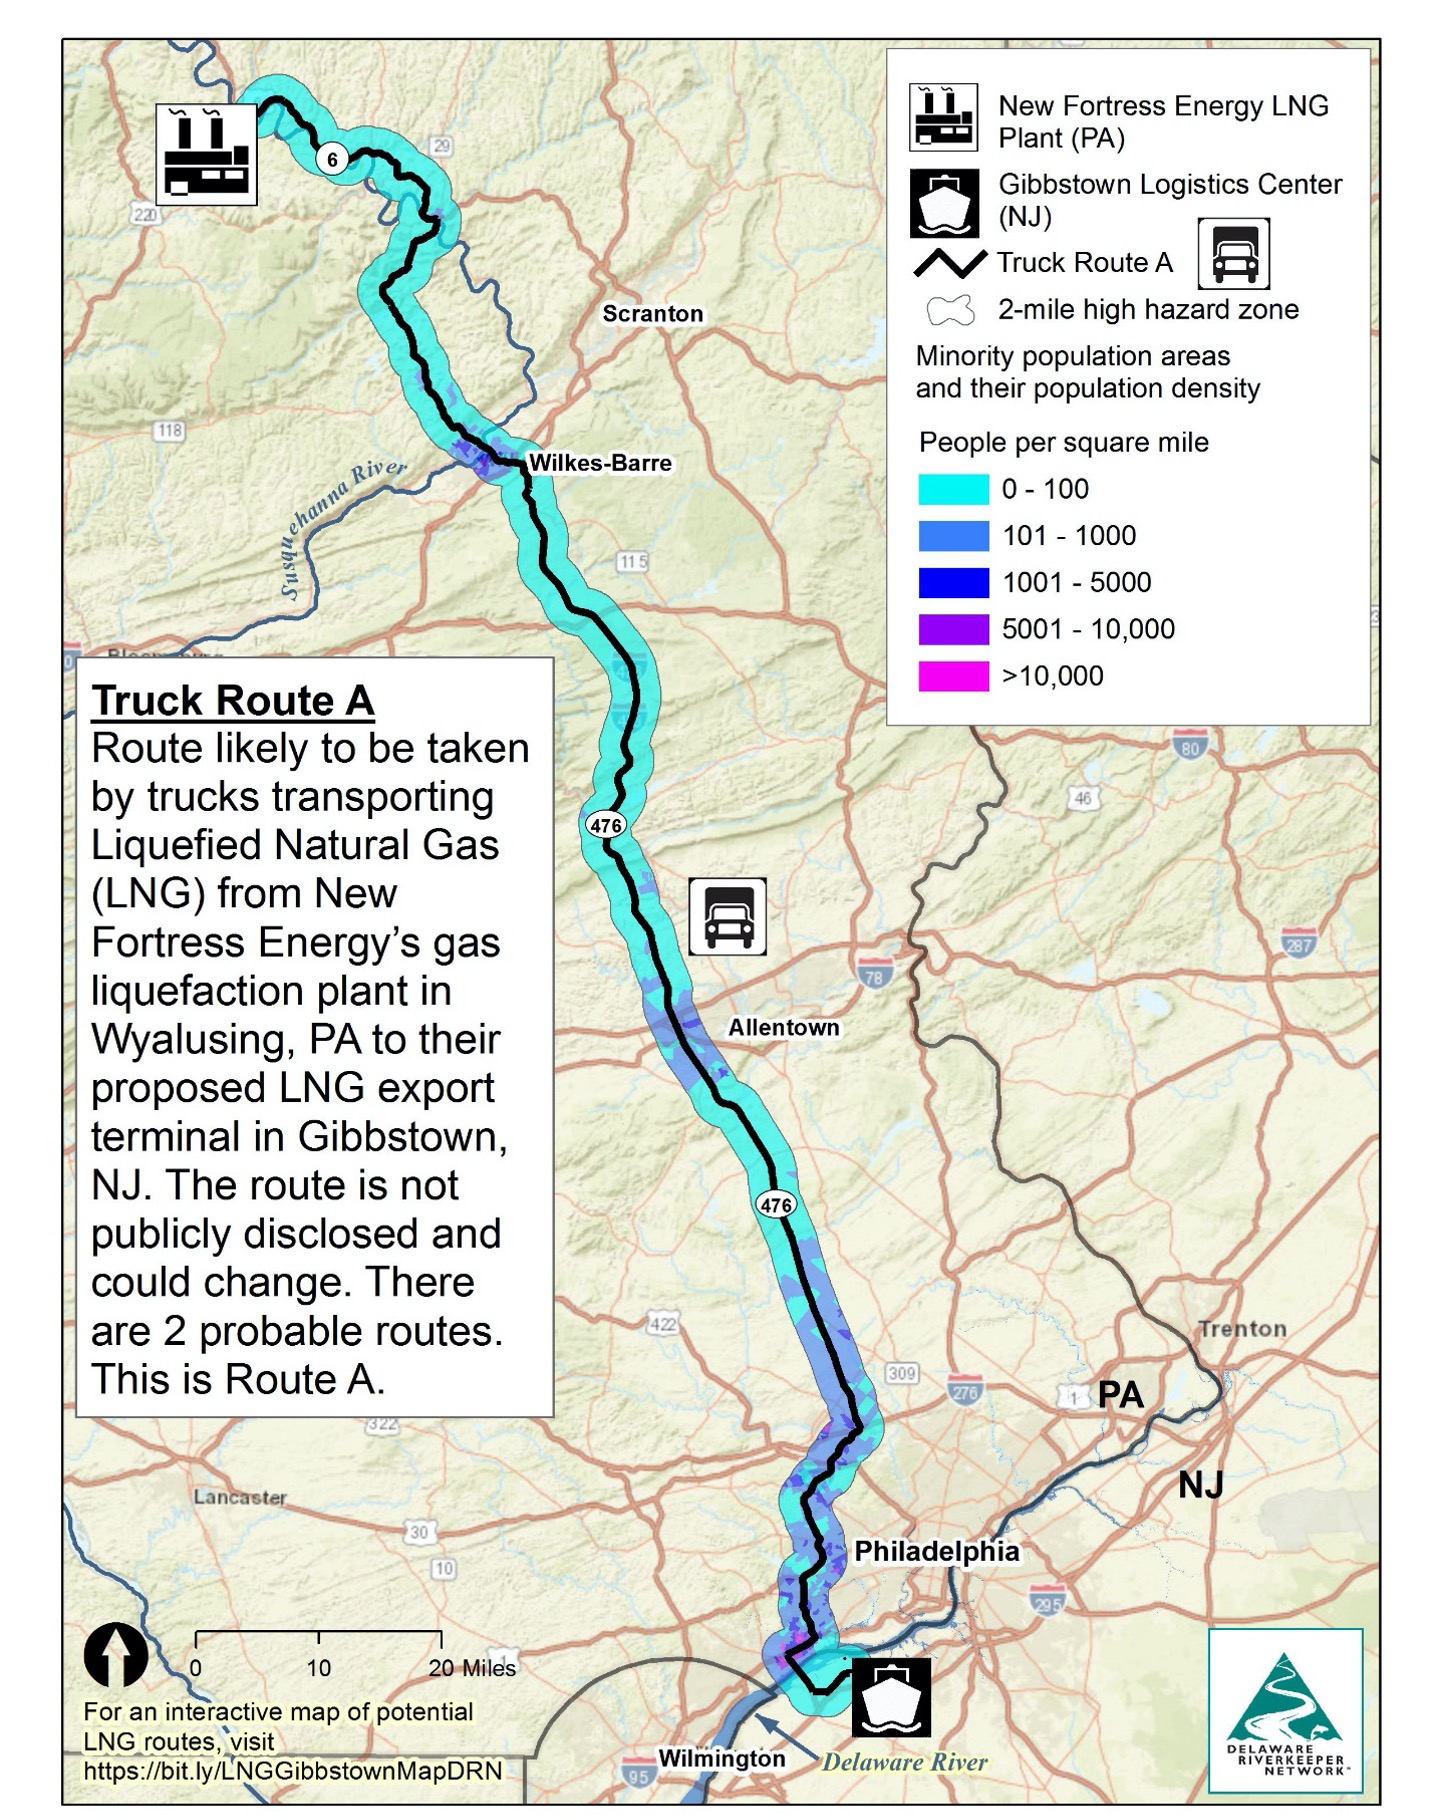
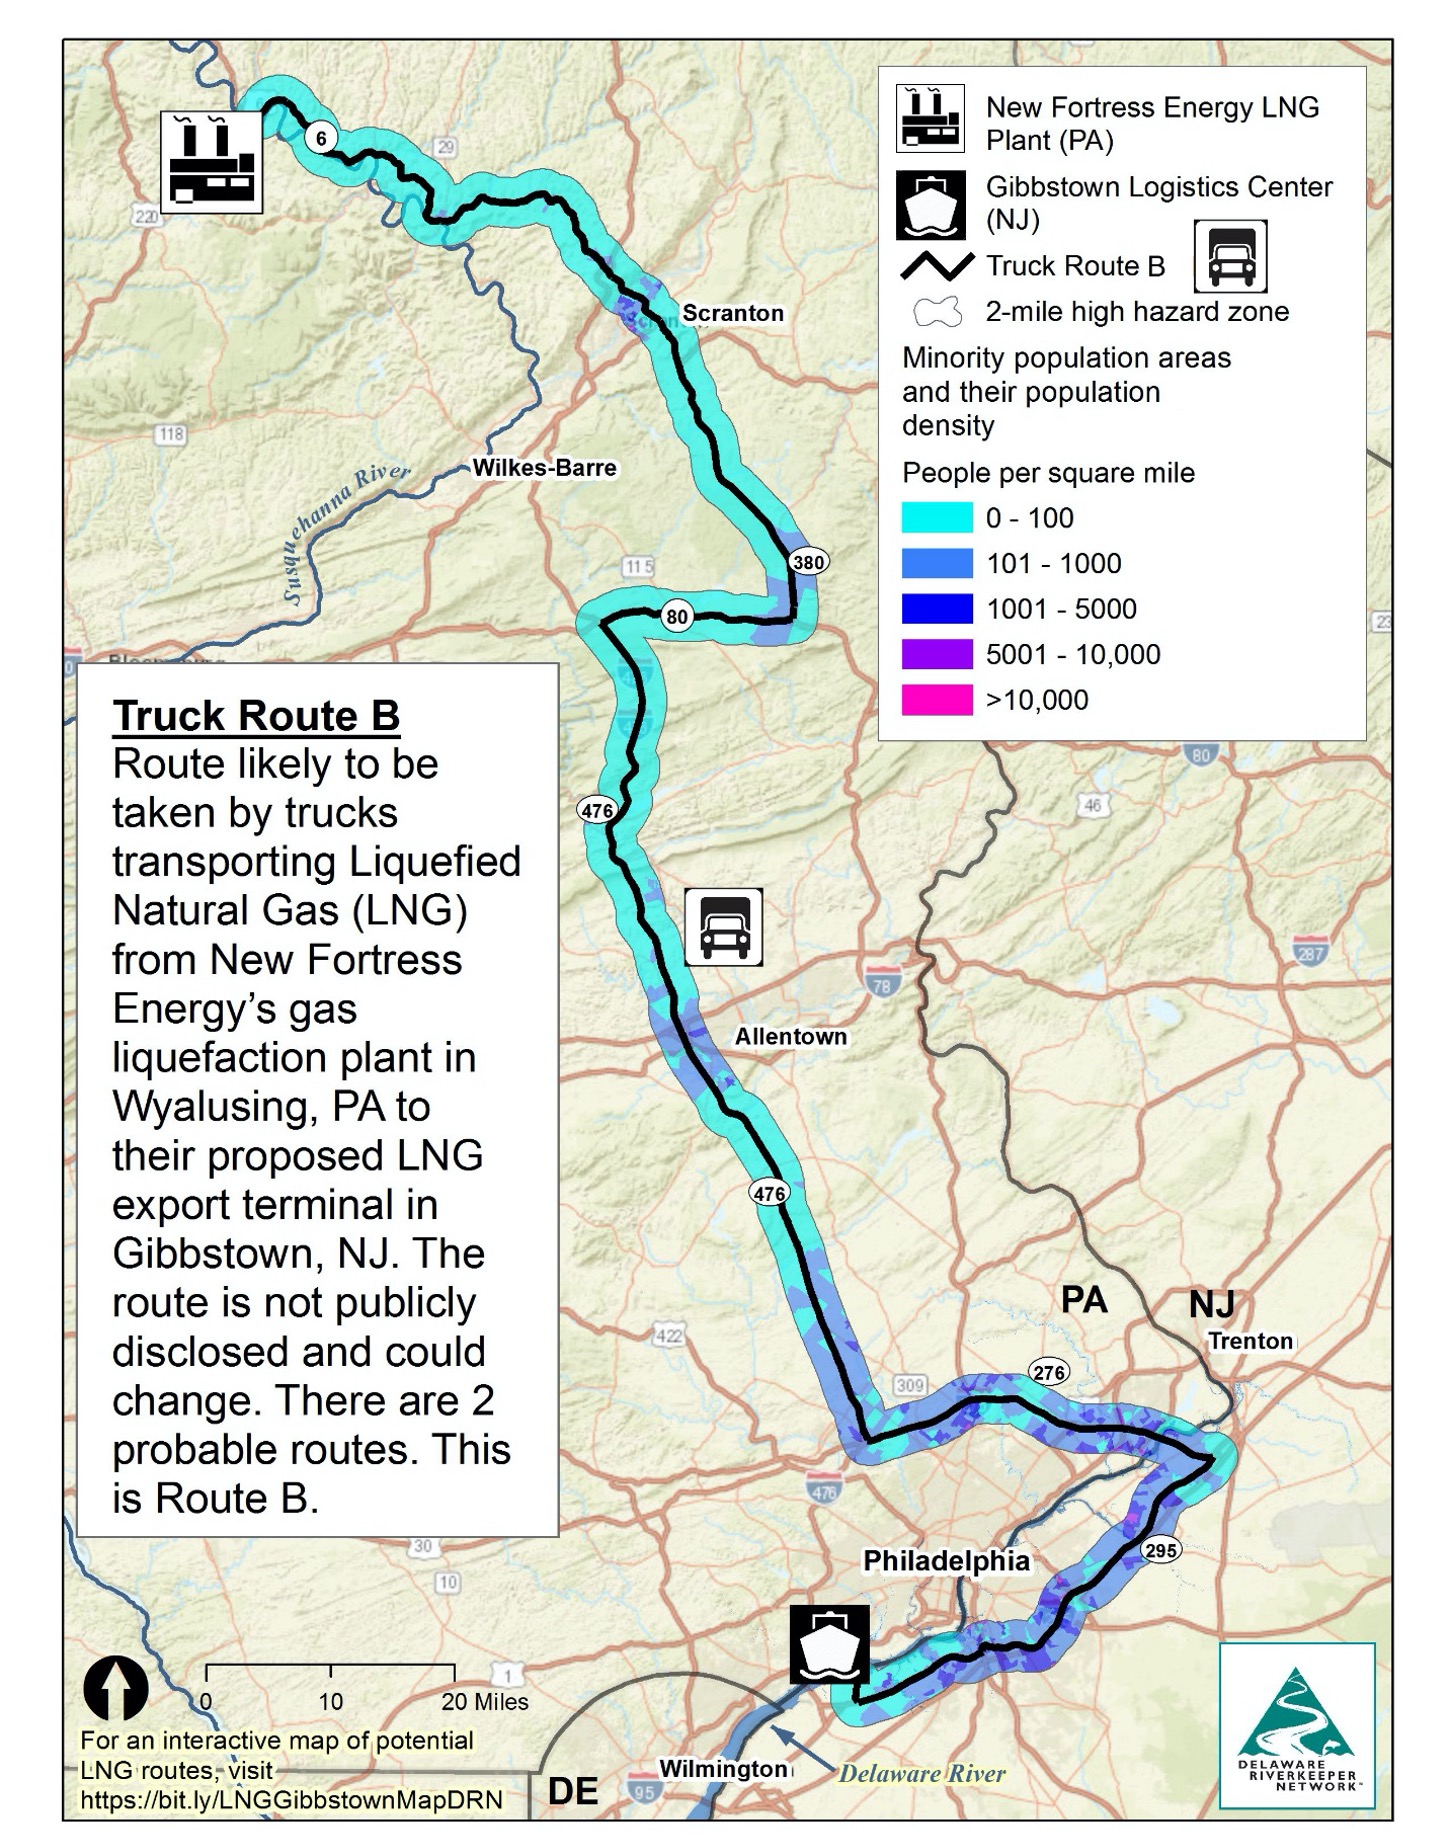
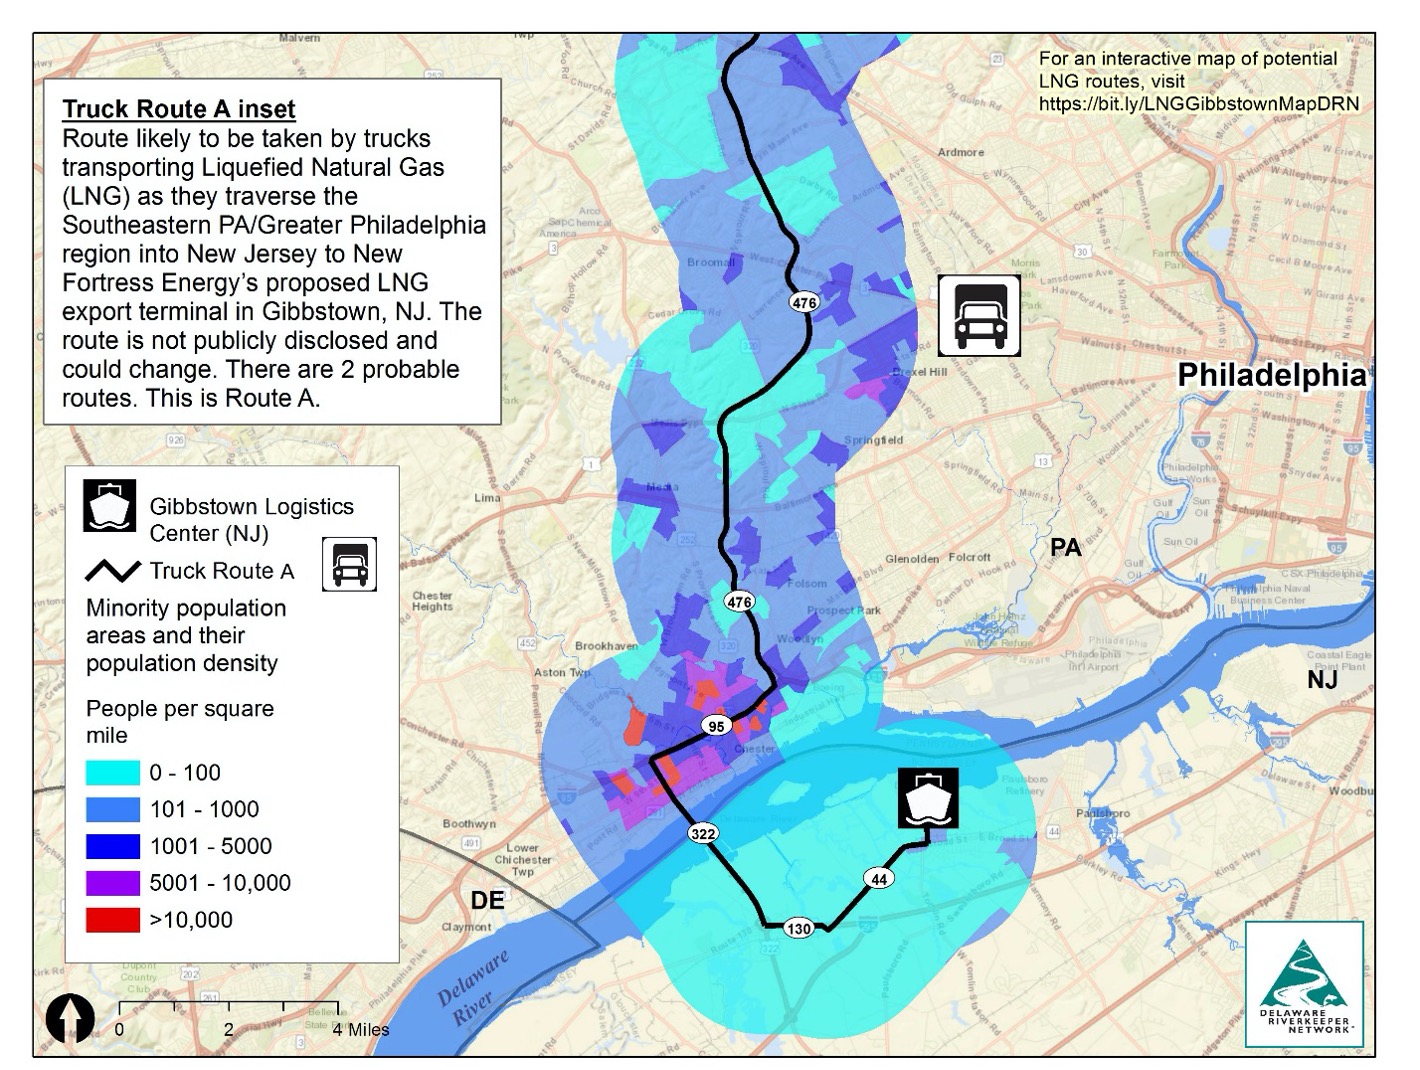
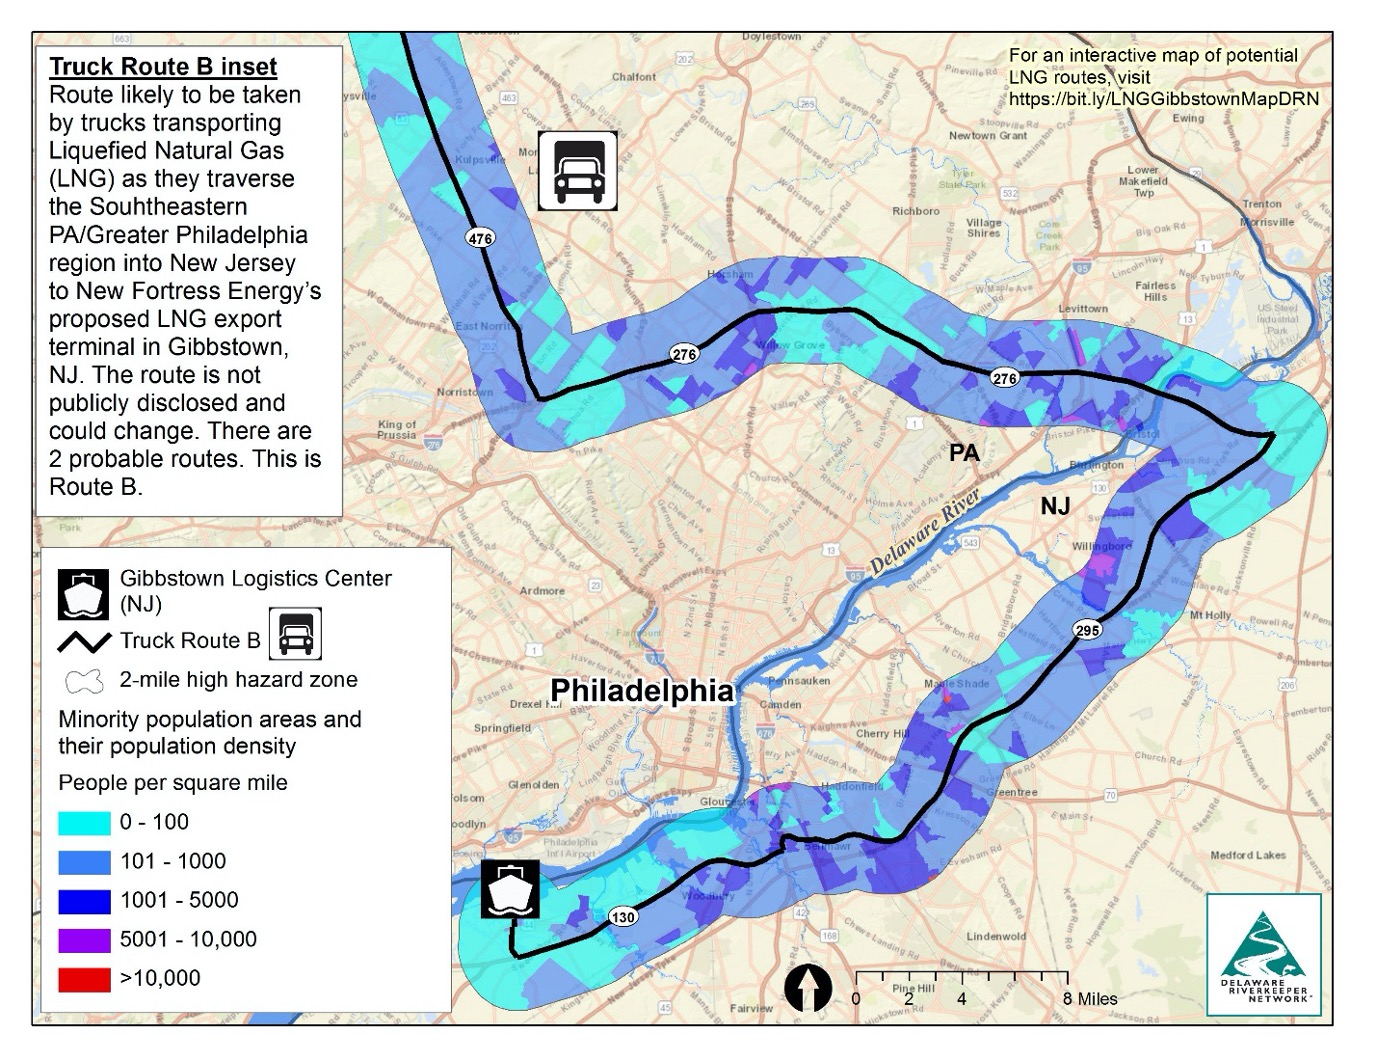
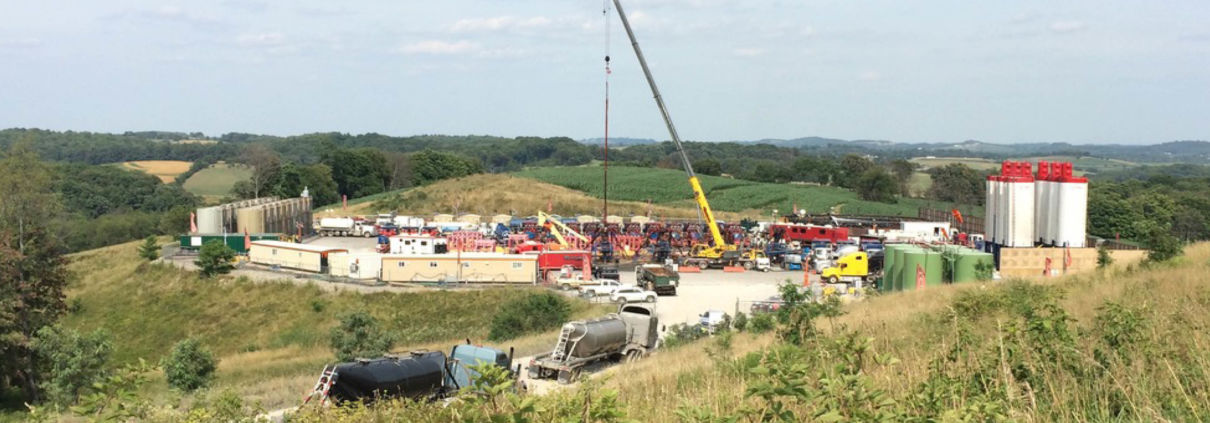 Image courtesy of Lois Bower-Bjornson from the Clean Air Council.