The FracTracker Alliance tends to look mostly at the impacts of drilling, from violations affecting surface and ground water to forest fragmentation to neighbors breathing diesel exhaust near disposal wells. We also try to give residents tools to help predict where future activity will occur, but as this article details, such predictive tools can do little more than trail moving targets. To that end, we have taken a look into areas where gas production is high for unconventional wells in the state, which are likely sites of future development.
The Pennsylvania Department of Environmental Protection’s (DEP) Production Report is self-reported by the various operators active in the state. Unconventional wells generate a large quantity of natural gas, measured in thousands of cubic feet (Mcf), as well as limited amounts of oil and condensate, both of which are measured in 42 gallon barrels. In this analysis, we are only considering the gas production.
In the map above, you can click on any well to learn more about the production values, along with a variety of other information including the well’s formation and age. The age was calculated by counting days from the spud date to the end of the report cycle, March 31, 2019.
Top Average Gas Production by County – April 2018 to March 2019
County
Producing Wells
Avg. Production (Mcf)
Production Rank
Avg. Age of Producing Wells
Age Rank
Wyoming
251
1,269,156
1
5 Yr / 10 Mo / 4 Days
12
Sullivan
128
1,087,868
2
5 Yr / 2 Mo/ 24 Days
8
Allegheny
117
1,075,018
3
4 yr/ 2 Mo / 7 Days
2
Susquehanna
1,429
1,066,734
4
5 Yr / 6 Mo / 22 Days
10
Greene
1,131
796,755
5
5 yr / 10 Mo / 28 Days
13
Figure 1 – This table shows the top five counties in Pennsylvania for per-well unconventional gas production. The final column shows the county ranking for the average age of wells, from youngest to oldest
We can also see this data summarized by county, where average production and age values are available on a county by county basis (see Figure 1). Hydrocarbon wells are known to decrease production steeply over time, a phenomenon known as the decline curve, so it is not surprising to see a relatively young inventory of wells represented in the list of top five counties with per-well gas production. Age is not the only factor in production values, however, as certain geographies simply contain more accessible gas resources than others.
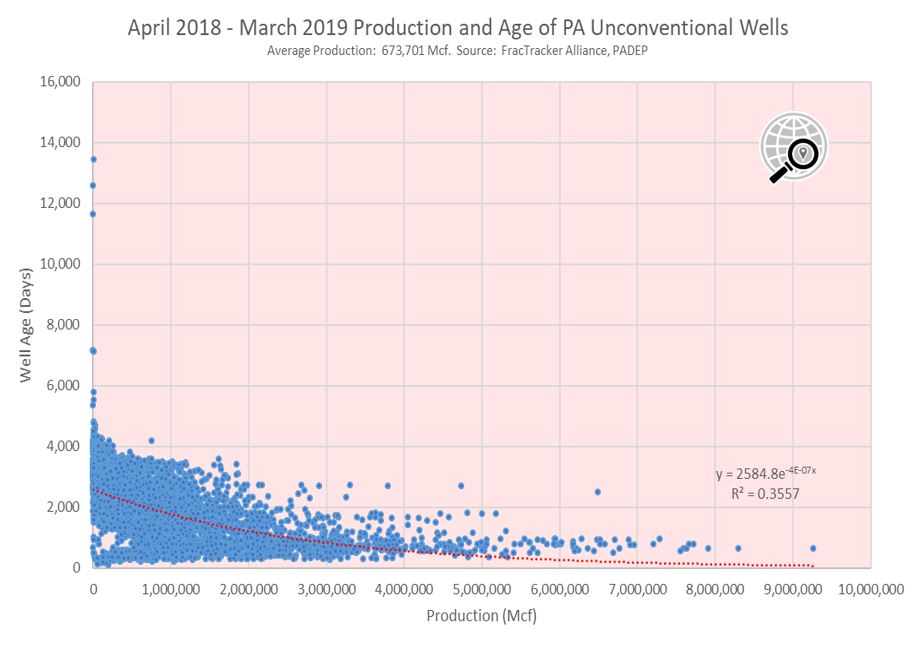
Figure 2 – 12 month gas production and age of well. Production is usually much higher during the earliest phases of the well’s production life. This does not include wells that have been plugged or taken out of production. Click on image for full-sized view.
In Figure 2, we look at the production of all unconventional wells in the state, expecting to see the highest production in younger wells. This mostly appears to be the case, but as mentioned above, there are also hot and cold spots with respect to production. A notable variable in this consideration is producing formation.
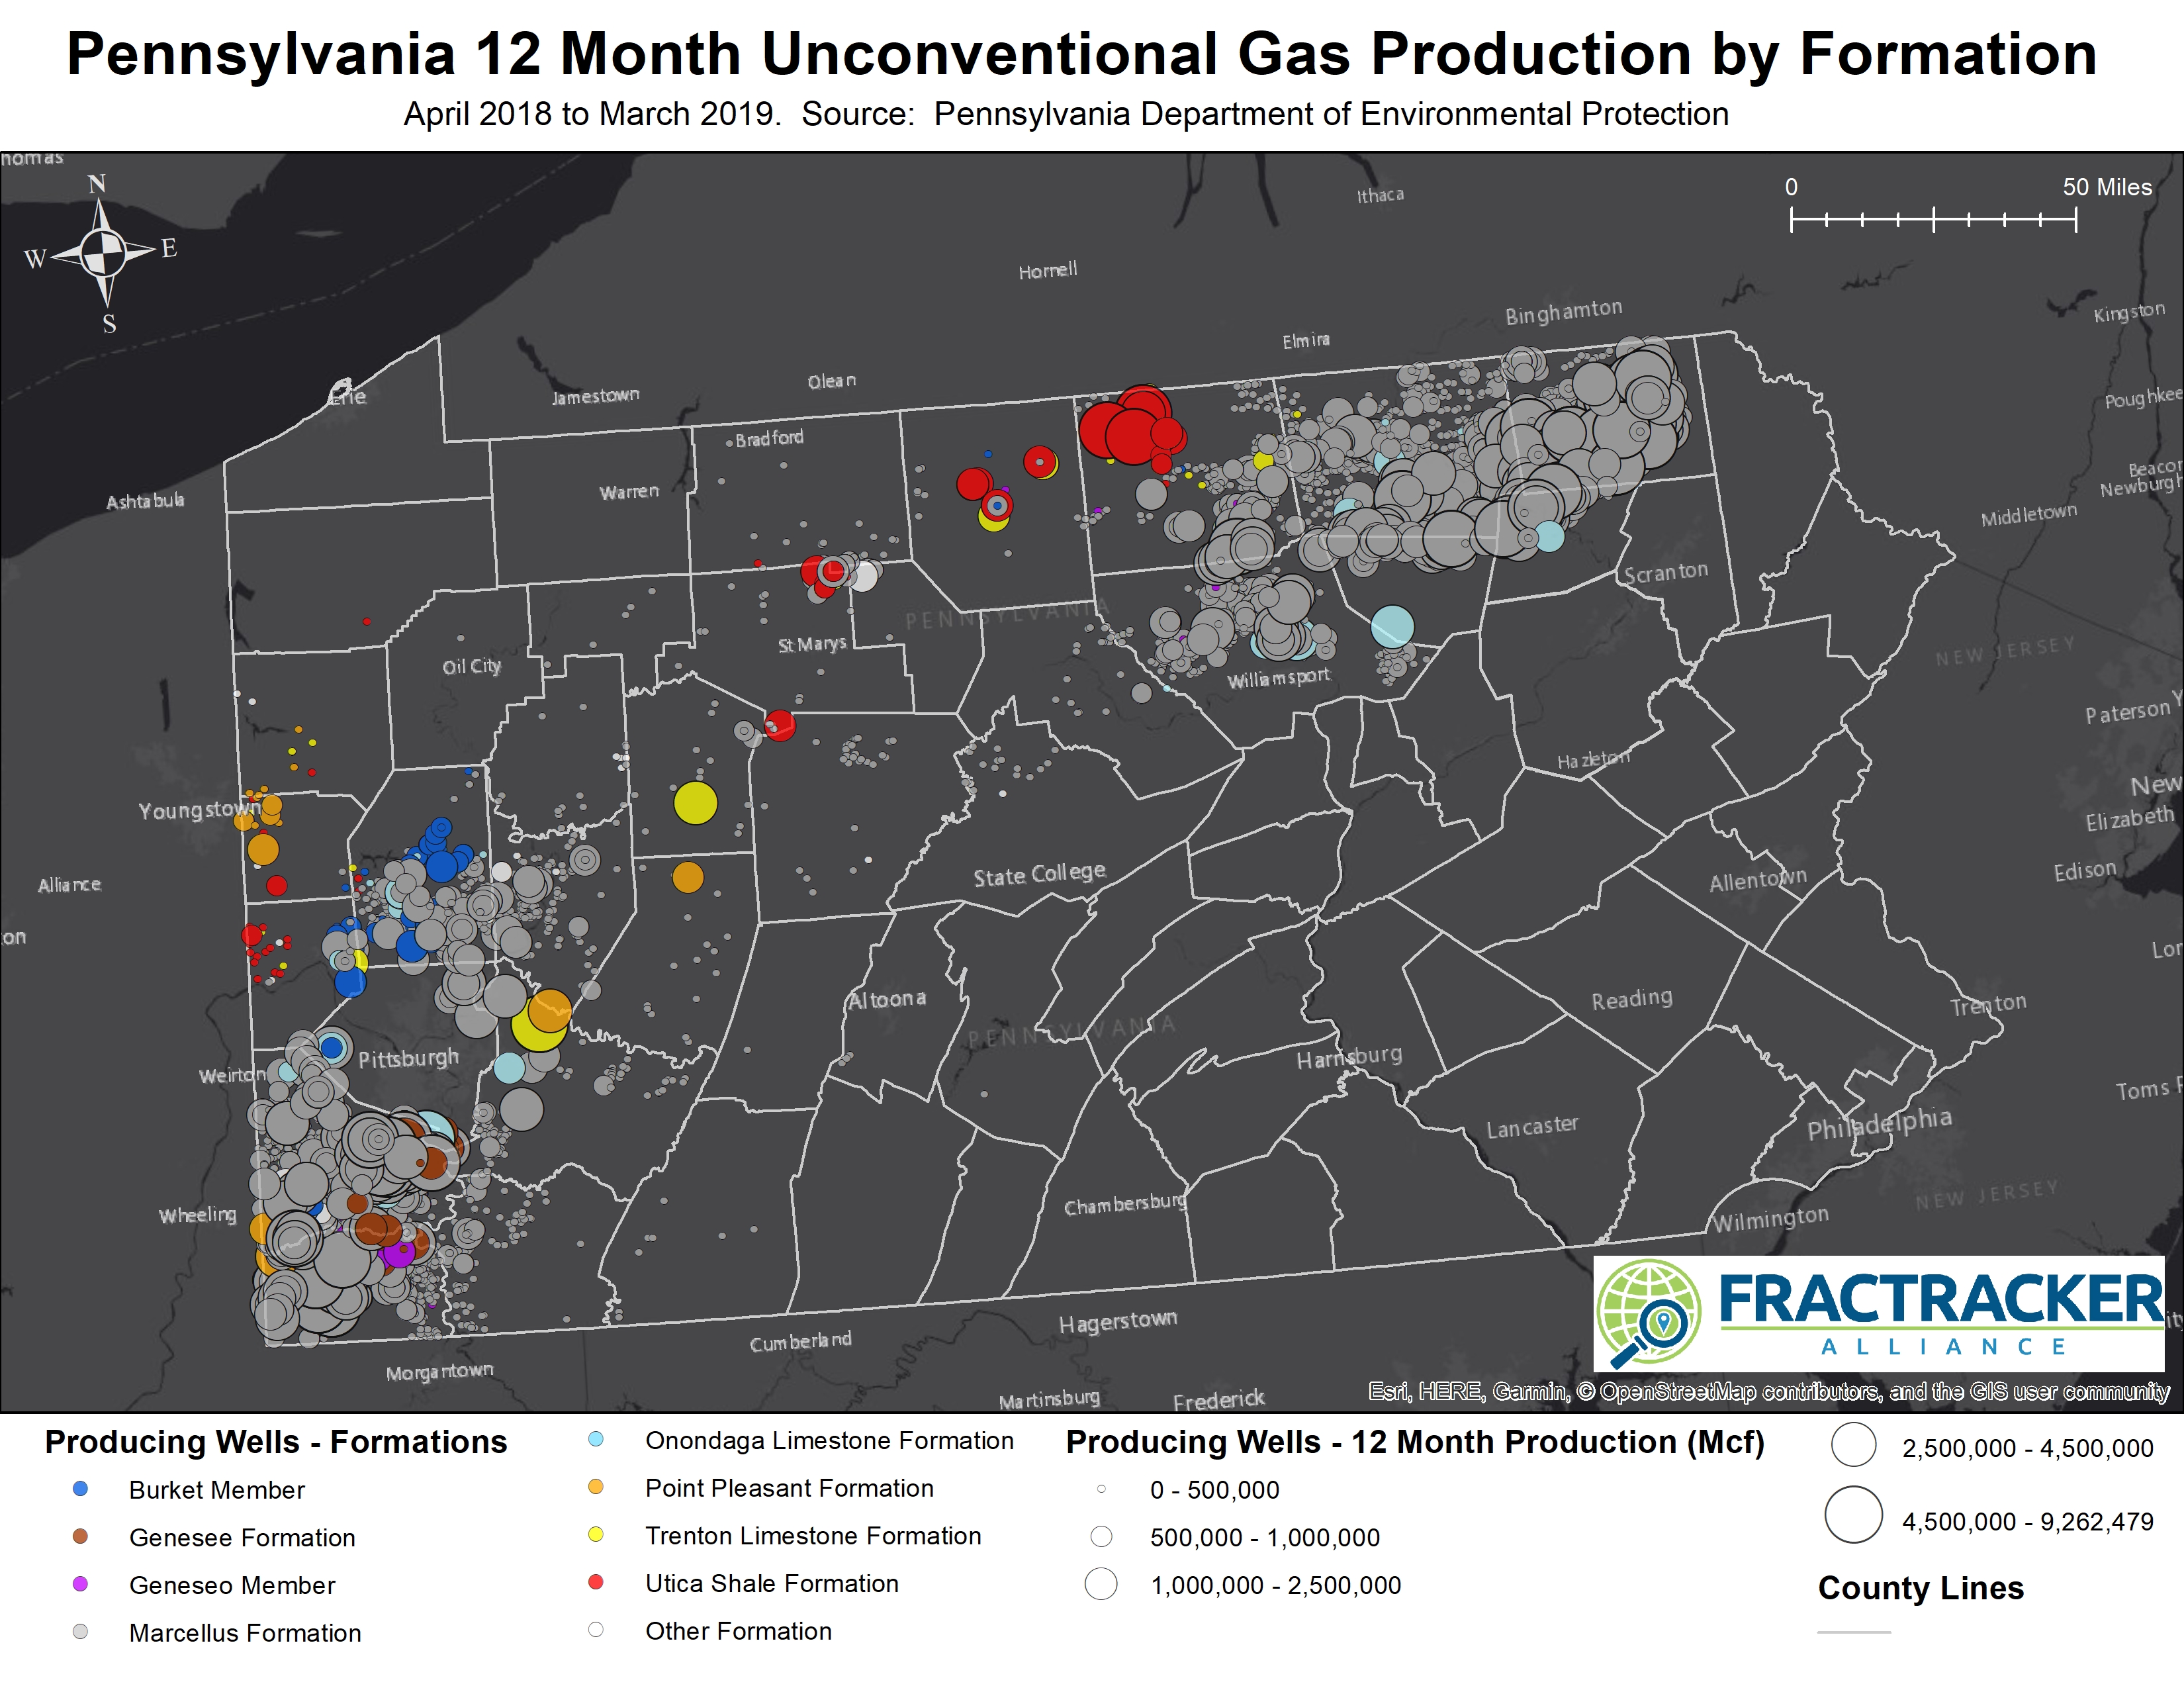
Since 93% (8,730 out of 9,404) of unconventional wells reporting gas production are in the Marcellus Shale Formation, the traditional hot spots in the northeastern and southwestern portions of the state heavily skew the overall totals in terms of both production and number of wells. Other formations of note include the Onodaga Limestone (137 wells, 1.5% of total), Burket Member (117 wells, 1.2%), Genesee Formation (104 wells, 1.1%), and the Utica Shale (99 wells, 1.1%) (Figure 3).
Figure 3 – Unconventional gas production over 12 months, showing formation. Click on image for full-sized view.
Drillers have been exploring some of these formations for decades. In fact, the oldest producing well that is currently classified as unconventional was 13,435 days old as of March 31, which works out to 36 years, 9 months, and 12 days.
However, this is fairly rare – only 384 (4%) of the 9,404 producing wells were more than 10 years old. 5,981 wells (64%) are between 5 and 10 years old, with the remaining 3,039 wells (32%) younger than 5 years old.
This does not take into account wells of any age that have been plugged or otherwise taken out of production.
Age of Pennsylvania’s active wells
< 5 years old
5-10 years old
> 10 years old
Utica Shale
The Utica Shale is worth a special mention here for a couple of reasons. First, we must acknowledge its prominence in neighboring Ohio, which has 2,160 permitted Utica wells to go with just 40 permitted Marcellus wells, the prevalence of the two plays seems to invert just as one passes over the state line. And yet, the most productive Utica wells are near the border with New York, not Ohio.
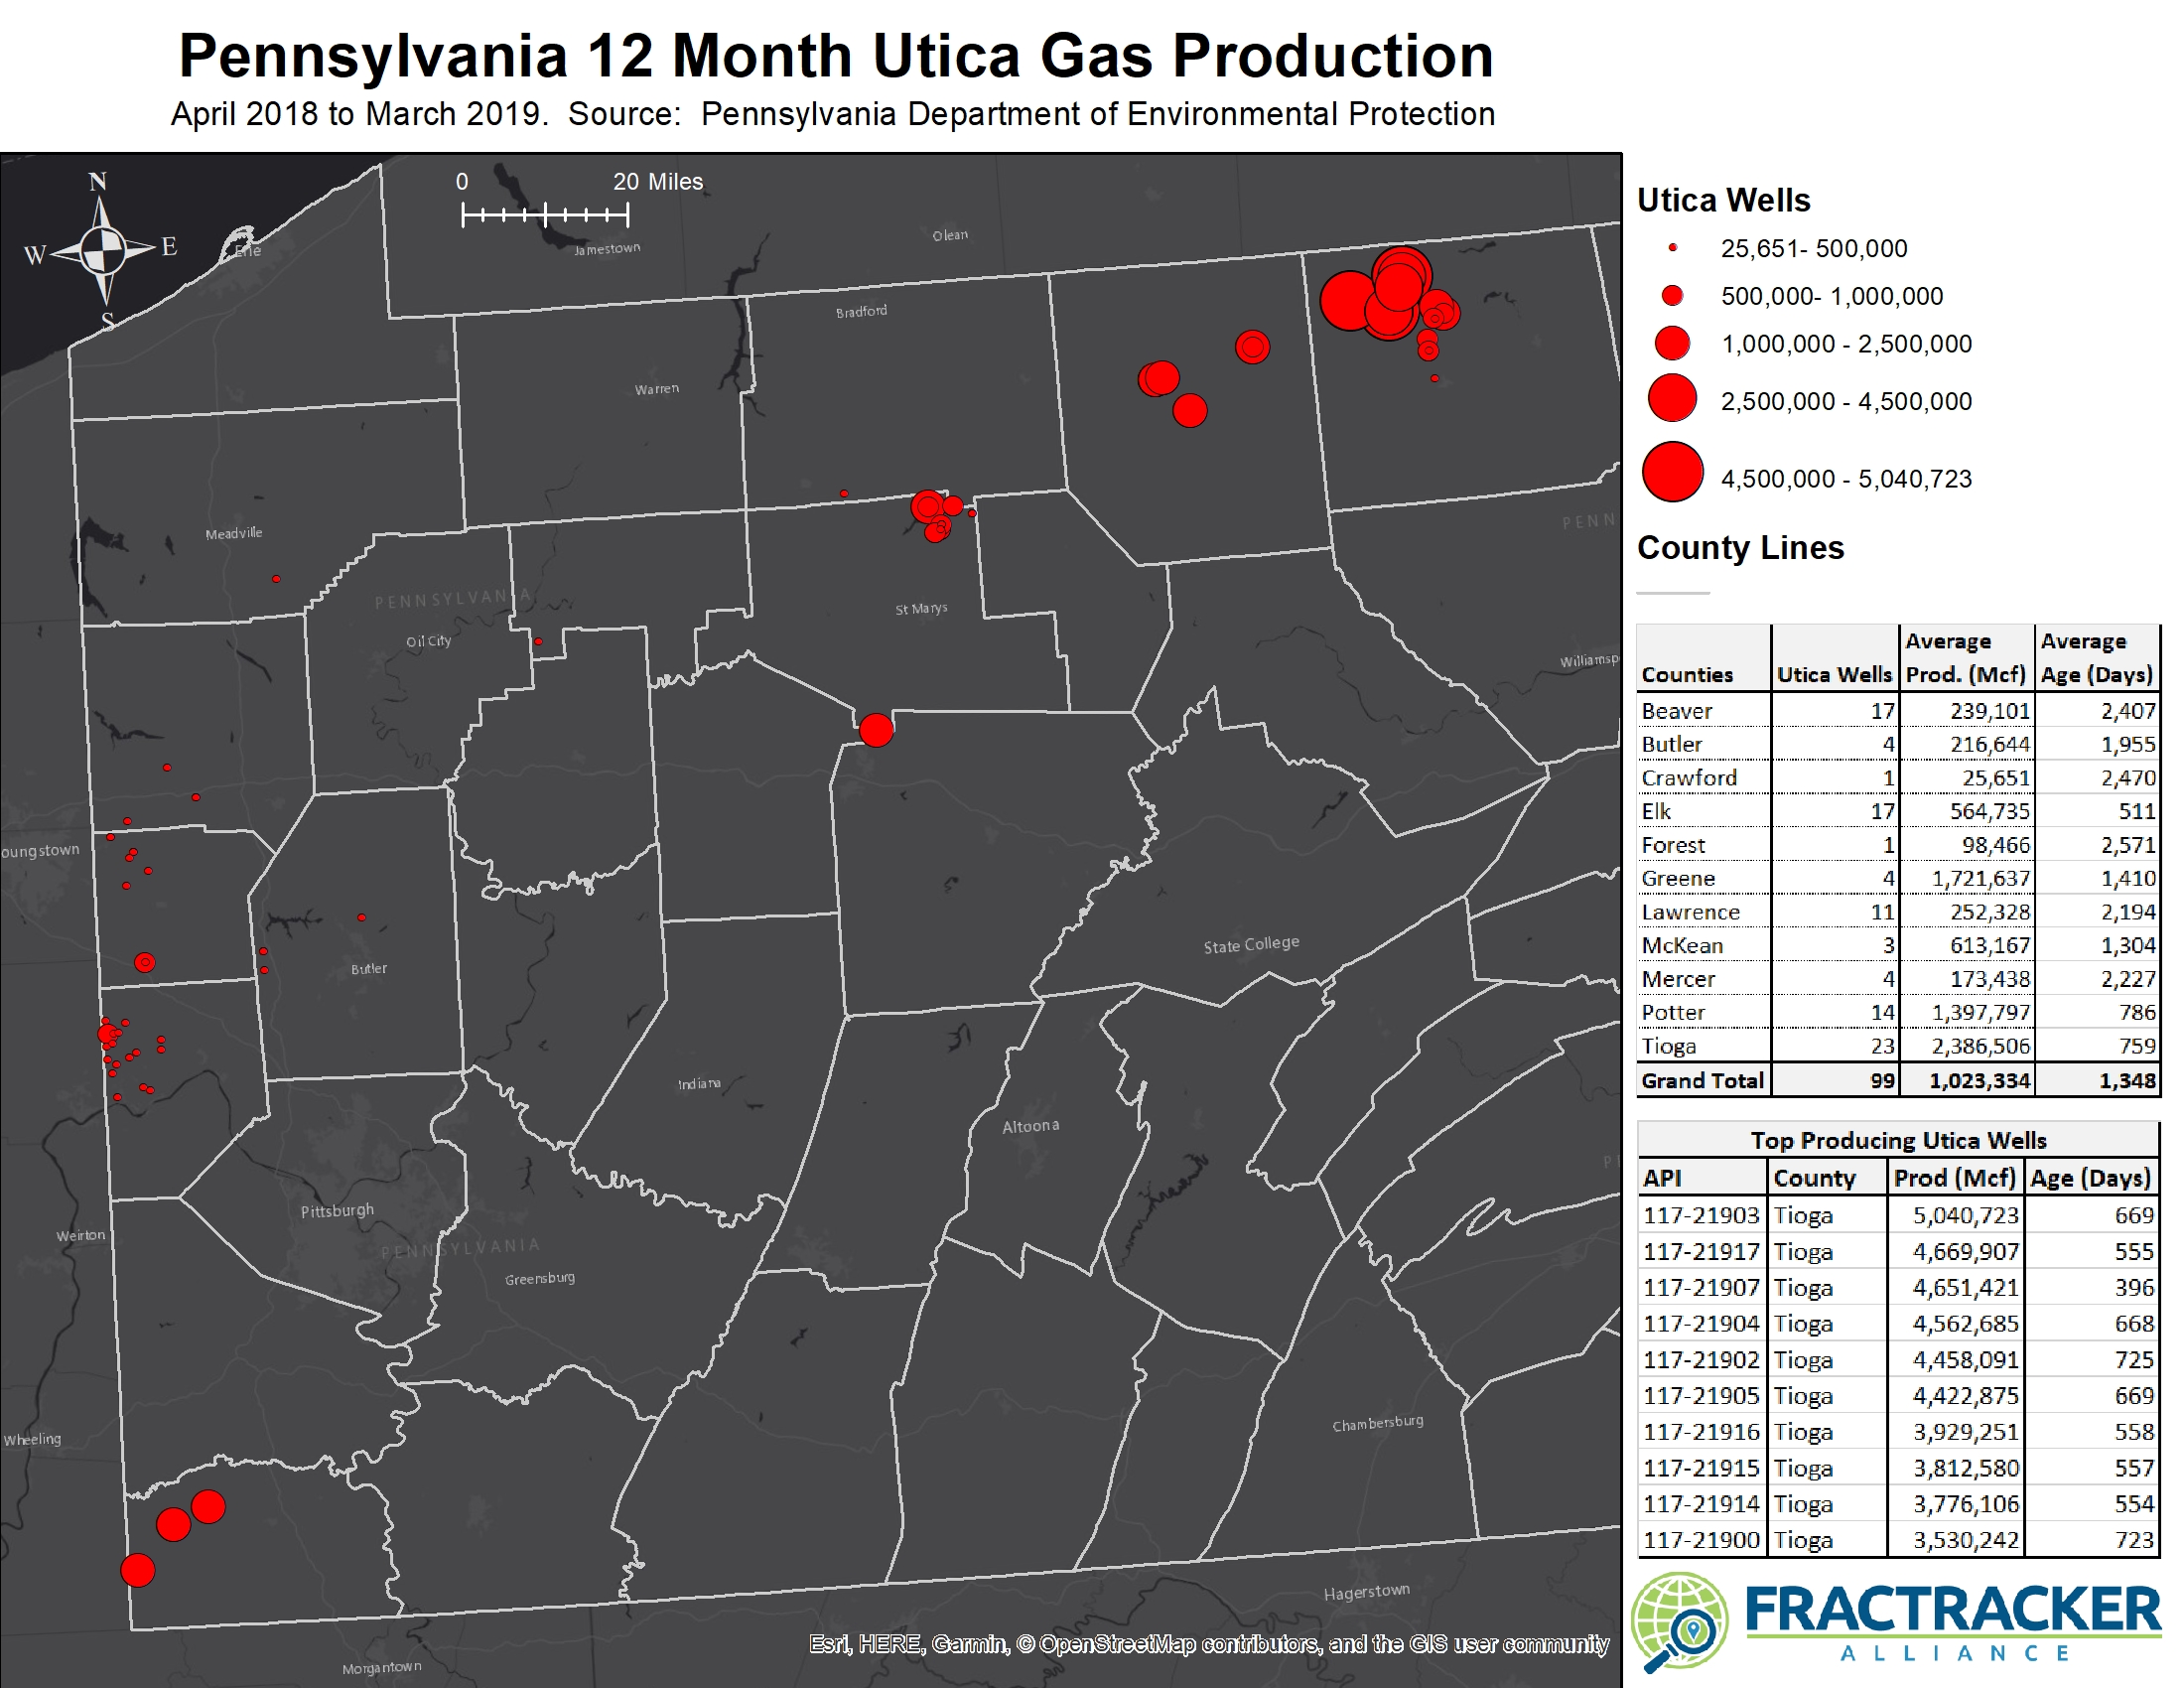
In fact, each of the top 11 producing Utica wells during the 12 month period were located in Tioga County. It’s worth noting that these are all between one and two years old, which would have given the wells time to be drilled, fracked, and brought into production, while still being in the prime of their production life. Compared to the Marcellus, sample size quickly becomes an issue when analyzing the Utica in Pennsylvania (Figure 4).
Figure 4 – Producing Utica wells in Pennsylvania. Note that the cluster of heavily producing wells in Tioga and Potter Counties near the New York border are mostly young wells where higher production would be expected. Click on image for full sized view.
Second, portions of the Utica are known for their wet gas content, meaning that the gas has significant quantities of natural gas liquids (NGLs) including ethane, propane, and butane, which are gaseous at ambient temperatures but typically condensed into liquid form by oil and gas companies. These are used for specialized fuels and petrochemical feedstocks, and are therefore more valuable than the methane in natural gas.
The production report does not capture the amount of NGLs in the gas, but a map from the Energy Information Administration shows the entire play, noting that the composition is dryer on the eastern portions of the play. In fact, a wet gas composition along the Ohio border might help to explain continued interest in what are otherwise well below average gas production results for Pennsylvania.
A Moving Target
It is difficult to predict where the industry will focus its attention in the coming months and years, but taking a look at production and formation data can give us a few clues. Obviously, operators who found a particularly productive pocket of hydrocarbons are likely to keep drilling more holes in the ground in those areas until production is no longer profitable. Therefore, impacts to water, air, and nearby residents can be expected to continue in heavily drilled areas largely because the production level makes it attractive for drillers.
On the other hand, we should not assume that areas that are currently not productive are off the table for future consideration, either. Different formations are productive in different geographies, so a sweet spot for the Marcellus might be a dud in the Utica, or vice versa.
Finally, when comparing production, we must always take the age of the well into consideration, as all oil and gas wells can be expected to start off with a short period of very high production, followed by years of ever-diminishing returns throughout the expected 10 to 11 year lifecycle of the well. Because of this, what seems like a hotspot now may look below average in a similar analysis in three to four years, particularly in formations with relatively light drilling activity. This means that the top list of production by well could change over time, so be sure to check back in with FracTracker to see how events unfold.
By Matt Kelso, Manager of Data and Technology, FracTracker Alliance
https://www.fractracker.org/a5ej20sjfwe/wp-content/uploads/2019/06/Washington-County-Rig-2-scaled.jpg6671500Matt Kelso, BAhttps://www.fractracker.org/a5ej20sjfwe/wp-content/uploads/2025/09/2025-Wordmark-Logo.pngMatt Kelso, BA2019-06-10 12:07:422021-04-15 14:56:30Production and Location Trends in PA: A Moving Target
Since the advent of unconventional shale gas drilling, some effects have been immediate, some have emerged over time, and some are just becoming apparent. Two reports recently published by the Delaware Riverkeeper Network advance our understanding of the breadth of the impacts of fracking in Pennsylvania. The first report, written by FracTracker, reviews research on the ways fracking impacts the health of Pennsylvanians. The second report by ECONorthwest calculates the economic costs of the industry.
“Fracking is heavily impacting Pennsylvania in multiple ways but the burden is not being fairly and openly calculated. These reports reveal the health effects and economic costs of fracking and the astounding burdens people and communities are carrying,” said Maya van Rossum, the Delaware Riverkeeper.
Learn what the latest science and analysis tells us about the costs of fracking, who is paying now, and what the future price is forecasted to be.
Access the full reports here:
Health Impact Report
“Categorical Review of Health Reports on Unconventional Oil and Gas Development; Impacts in Pennsylvania,” FracTracker Alliance, 2019 Issue Paper
“The FracTracker Alliance conducted a review of the literature studying the impact of unconventional oil and gas on health. Findings of this review show a dramatic increase in the breadth and volume of literature published since 2016, with 89% of the literature reporting that drilling proximity has human health effects. Pennsylvanian communities were the most studied sample populations with 49% of reviewed journal articles focused on Marcellus Shale development. These studies showed health impacts including cancer, infant mortality, depression, pneumonia, asthma, skin-related hospitalizations, and other general health symptoms were correlated with living near unconventional oil and gas development for Pennsylvania and other frontline communities.”
–Kyle Ferrar, FracTracker Alliance Western Program Coordinator
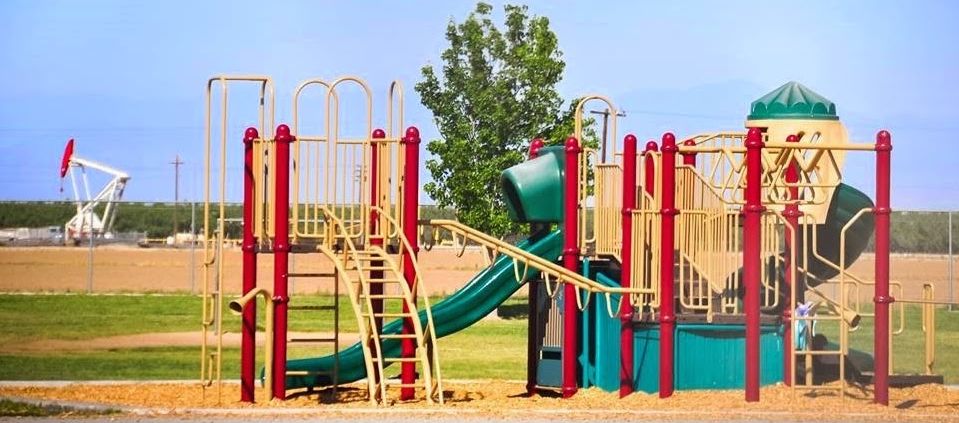
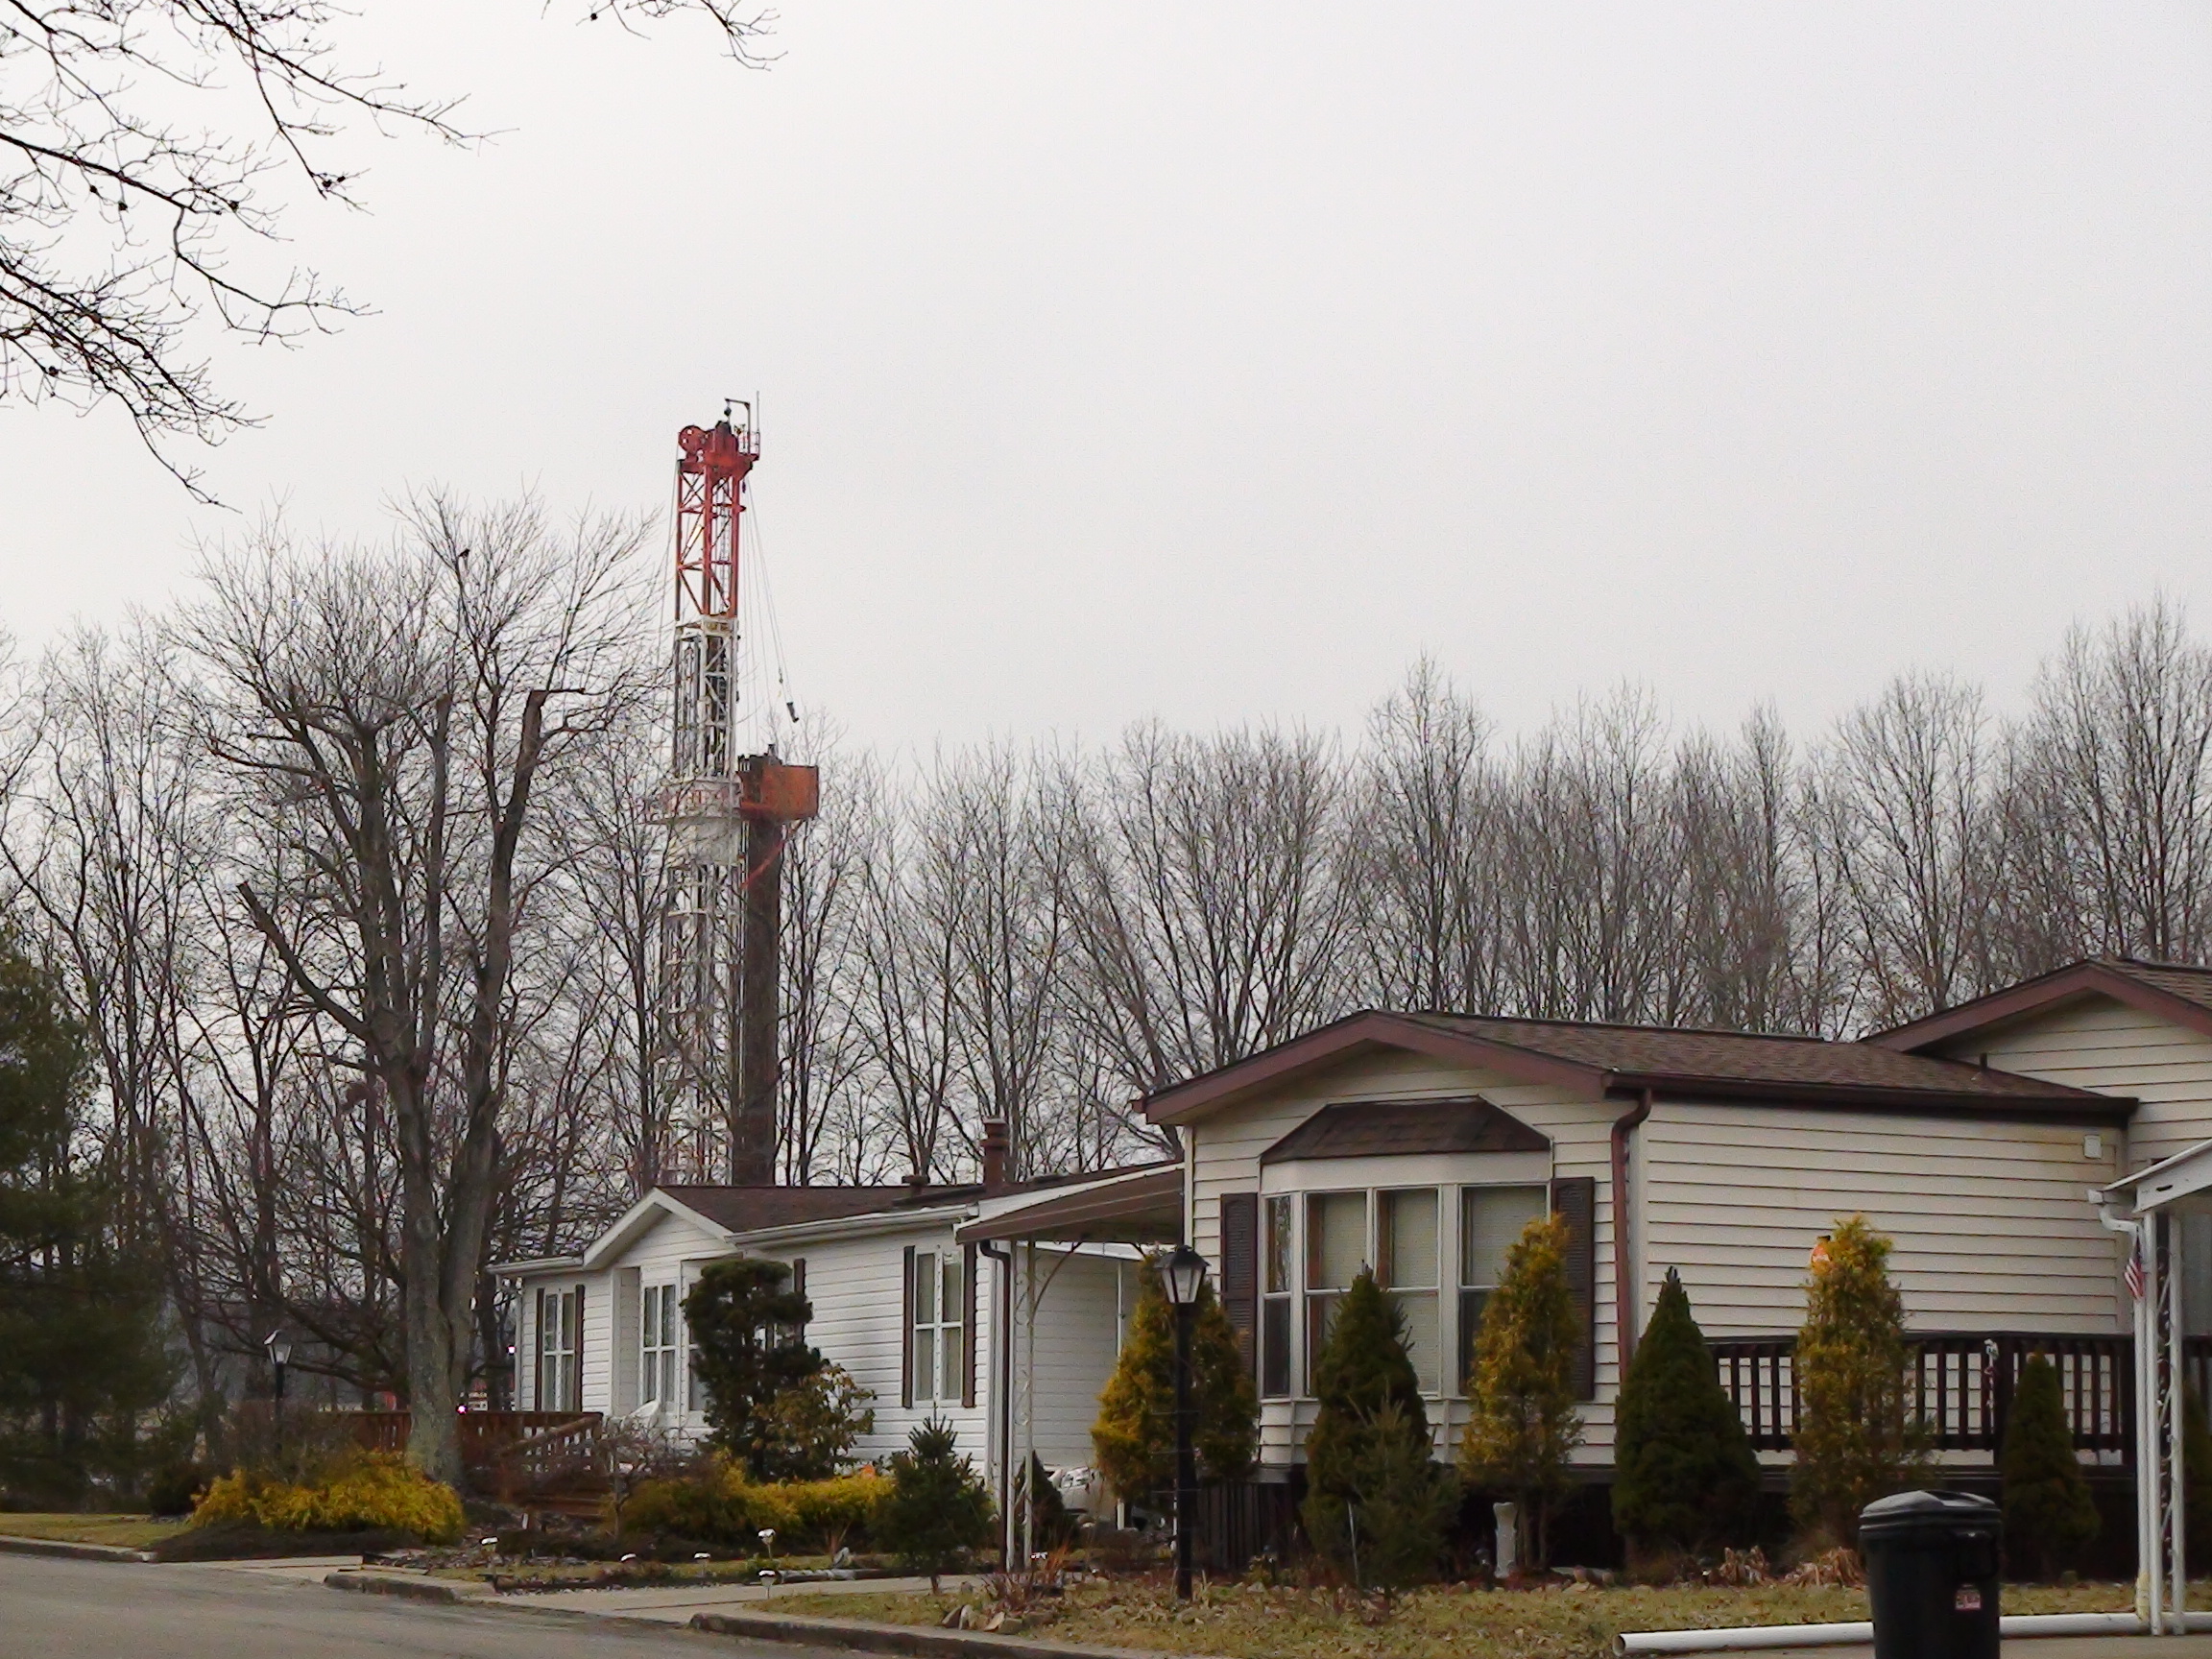
Rig and house. Westwood Lake Park. Photo by J Williams, 2013.
“Fracking wells have an extensive presence across Pennsylvania’s landscape – 20 percent of residents live within 2 miles of a well. This is close enough to cause adverse health outcomes. Collectively we found annual costs of current fracking activity over $1 billion, with cumulative costs given continued fracking activity over the next 20 years of over $50 billion in net present value for the effects that we can monetize. The regional economic benefits also seem to be less than stated, as the long-term benefits for local economies are quite low, and can disrupt more sustainable and beneficial economic trajectories that might not be available after a community has embraced fracking.”
–Mark Buckley, Senior Economist at the natural resource practice at ECONorthwest
These reports on the health effects and economic impacts of unconventional oil and natural gas development yield disheartening results. There are risks of extremely serious health issues for families in impacted areas, and the long term economic returns for communities are negative.
Arming ourselves with knowledge is an important first step towards the renewable energy transformation that is so clearly needed. The stakes are too high to allow the oil and natural gas industries to dictate the physical, social, and economic health of Pennsylvanians.
https://www.fractracker.org/a5ej20sjfwe/wp-content/uploads/2019/05/DrillingNearSchoolCA-1.jpg445959FracTracker Alliancehttps://www.fractracker.org/a5ej20sjfwe/wp-content/uploads/2025/09/2025-Wordmark-Logo.pngFracTracker Alliance2019-05-28 13:54:472021-04-15 14:56:31Who Pays? Health and Economic Impacts of Fracking in Pennsylvania
In March of 2019, two and a half years after Shell Pipeline Co. announced plans for the Falcon Ethane Pipeline System, the imported pipes arrived at the Port of Philadelphia. As tree clearing and construction begins, we share frustration with residents that the project is underway while many of our concerns remain unaddressed.
Between 2010 and 2018, over 280 pipeline incidents were reported in Ohio, West Virginia, and Pennsylvania (the three states the Falcon crosses). Of those incidents, 70 were fires and/or explosions. As regulatory agencies and operators fail to protect the public, communities are taking the reins.
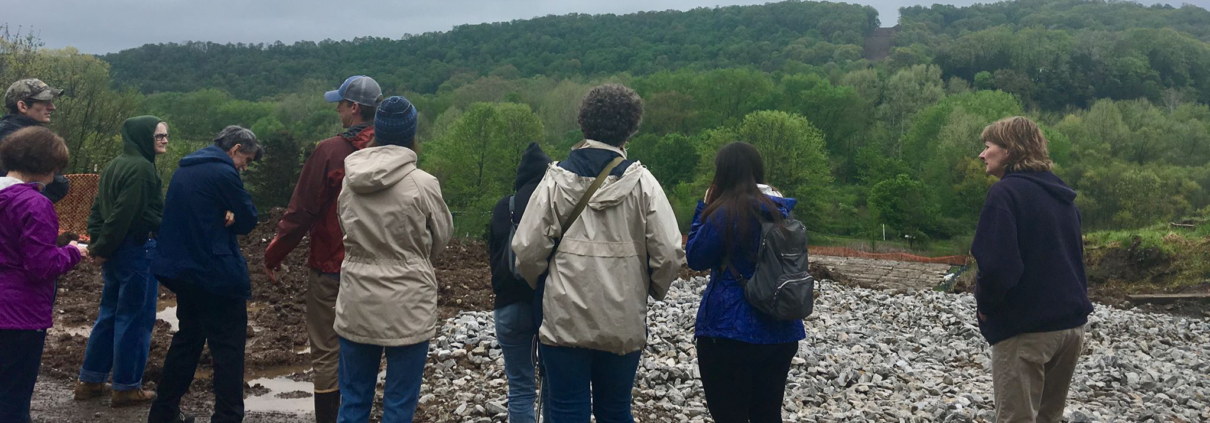
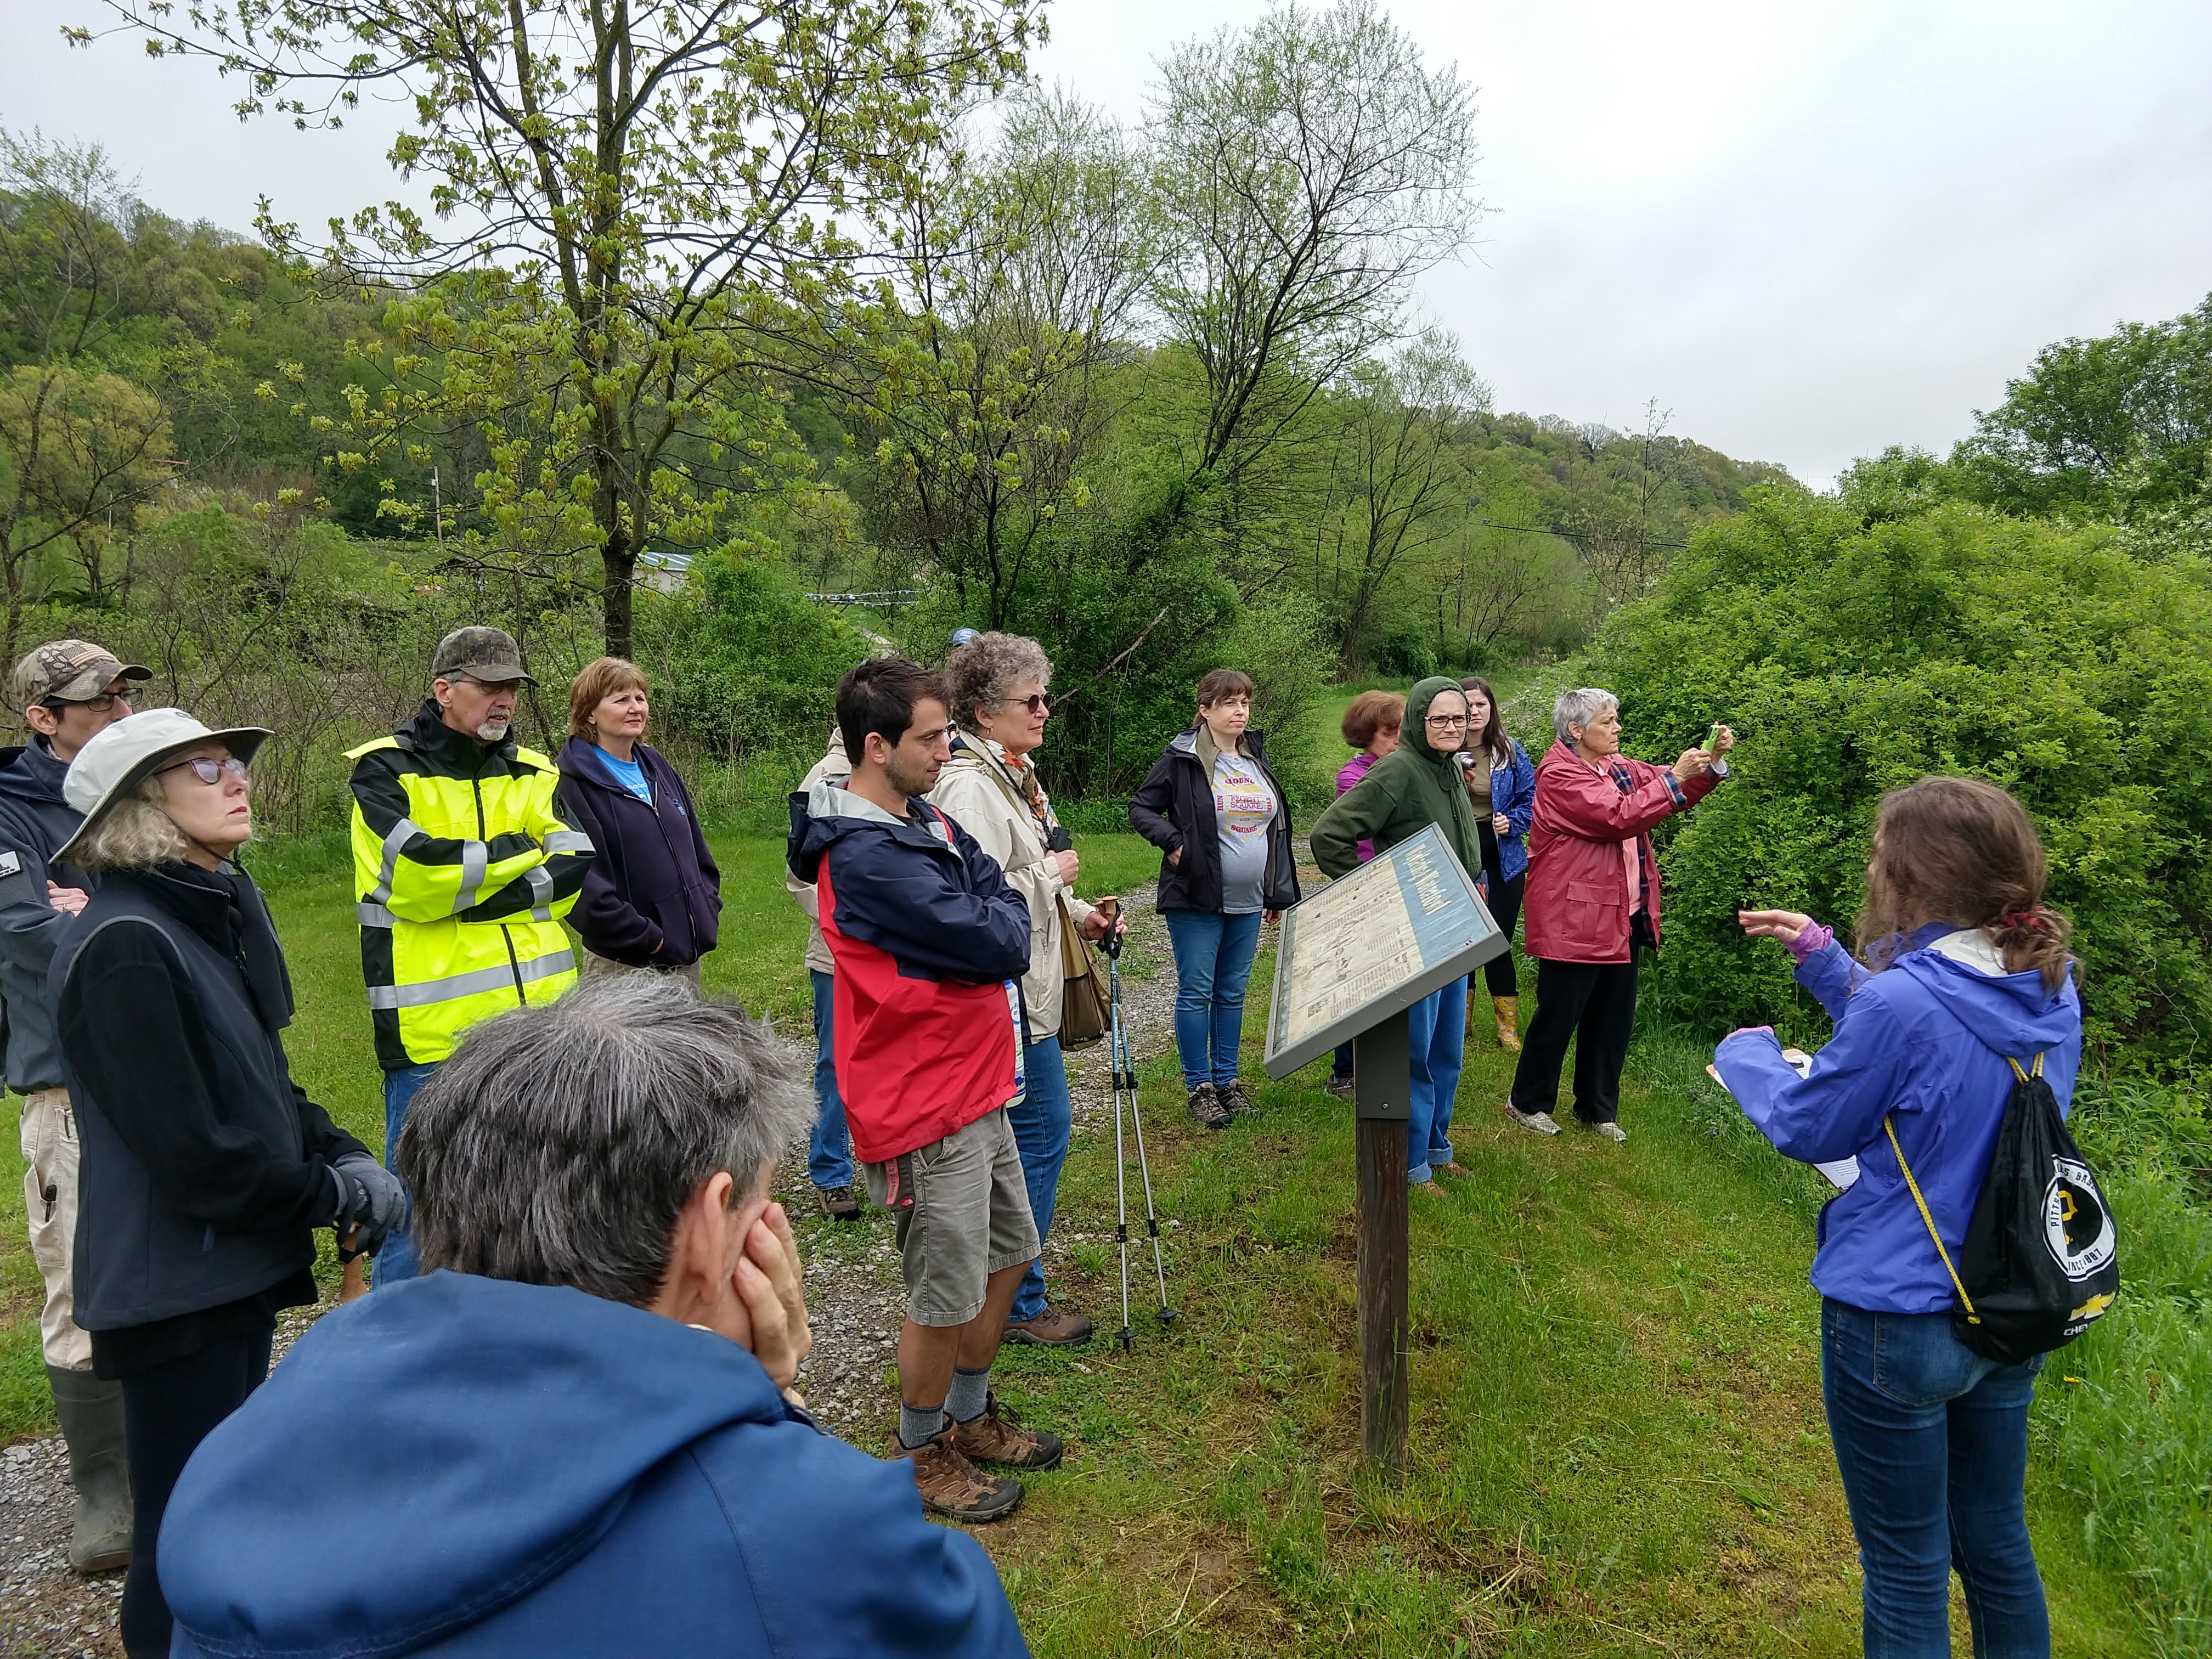
Residents of southwest PA gather along the Falcon route
These grassroots efforts are contributing to a shift in public perception about the safety and need of pipelines. In some cases, including with the Northeast Energy Direct Pipeline and the Constitution Pipeline, organizing efforts are helping stop projects before they begin.
We invite all residents along the Falcon route to get involved in ongoing efforts to monitor construction. Below, you’ll find a guide to reporting violations as well as high-risk areas along the Falcon route that require close monitoring.
Be a citizen watchdog
Taking photos of pipeline development and recording your observations is a great way to monitor impacts. One tool to use while monitoring is the FracTracker mobile app (search “FracTracker” in the App Store or Google Play to download for free). The app allows the public to submit geolocated photos and descriptions of development, such as pipelines and wells, and concerns, such as spills and noise pollution. These reports help FracTracker crowdsource data and alert us to concerns that need follow up action. The app also contains a map of wells, pipelines, and compressor stations, including the Falcon pipeline route for reference in the field.
Click on the images below to view app reports of Falcon construction.
Documenting violations
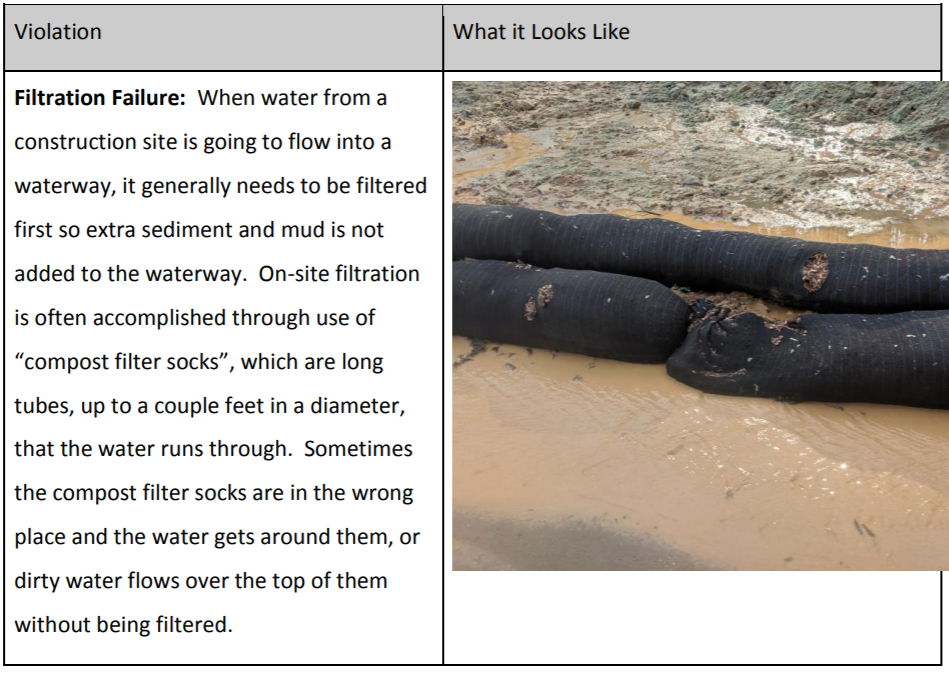
During the construction phase, incidents often occur when companies cause erosion of the ground and release sediment, equipment, or discharge into waterways. Mountain Watershed Association and Clean Air Council have provided the following information on the process of looking for and documenting violations.
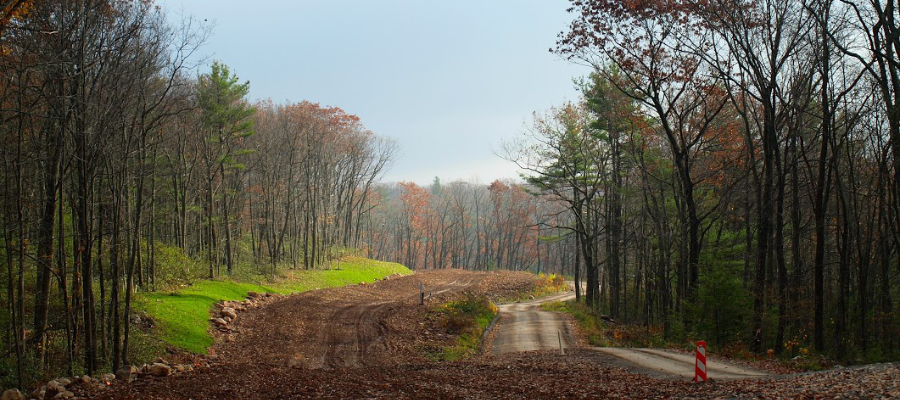
Step 1) Document baseline conditions. Documenting the pre-construction status of an area is crucial for understanding how it’s been impacted down the road. Document baseline conditions by taking photos, videos, and notes at different sites, and include the location and date on these materials (the Fractracker app does this for you automatically). Observing sites at different times and in different weather (such as during or after a storm) will give you the best data.
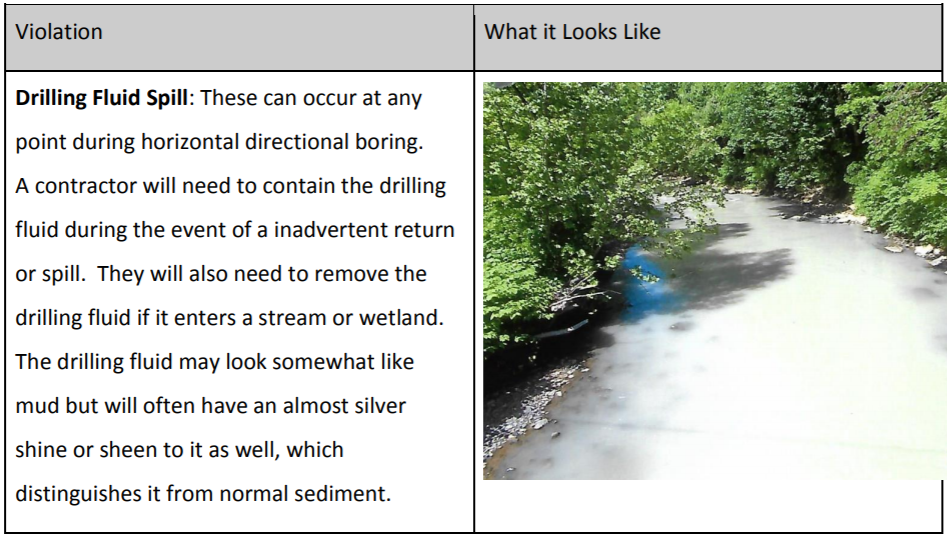
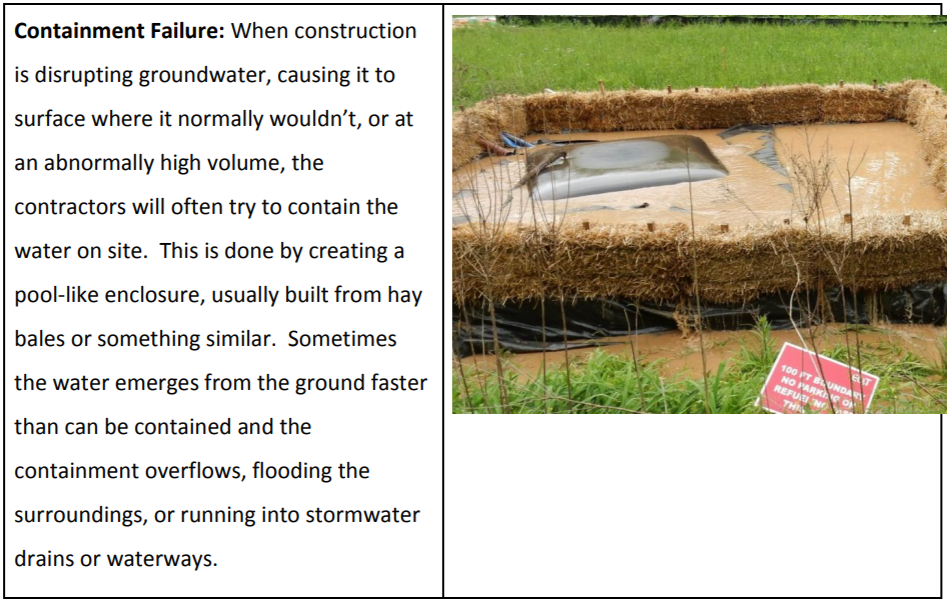
Step 2) Know what to look for. Below are images and descriptions of common construction violations.
4) Contact support organizations. There are several organizations ready to take action once violations have been confirmed. For confirmed violations in Beaver County, PA, contact Alex Bomstein, at the Clean Air Council (215-567-4004 x118) and for confirmed violations in Allegheny or Washington Counties, PA, contact Melissa Marshall at the Mountain Watershed Association (724-455-4200 x7#). For violations in Ohio or West Virginia, reach out to FracTracker (412-802-0273).
Reports made on the FracTracker App are shared with any app user and the FracTracker team, who look through the reports and contact users for any required follow up. App reports can also be submitted to regulatory agencies electronically. Simply visit the web version of the app, click on your report, and copy the URL (web address) of your report. Then “paste” it into the body of an email or online complaint form. The receiver will see the exact location, date, and any notes or photos you included in the report.
Where should you be monitoring?
Monitoring efforts must be limited to publicly accessible land. In general, areas that are most at-risk for environmental impact include stream and wetland crossings, steep slopes (particularly those near water crossings), flood-prone zones, and areas where storm water runoff will reach waterways. View a map of the Falcon’s water crossings here, and continue reading for more vulnerable locations to monitor.
The information below identifies high-risk areas along the pipeline route where monitoring efforts are extra necessary due to their impacts on drinking water, wetlands, undermined areas, and vulnerable species.
Drinking Water
We found 240 private water wells within 1/4 mile of the Falcon.
While all of these wells should be assessed for their level of risk with pipeline construction, the subset of wells nearest to horizontal directional drilling (HDD) sites deserve particular attention. HDD is a way of constructing a pipeline that doesn’t involve digging a trench. Instead, a directional drilling machine is used to drill horizontally underground and the pipe is pulled through.
While an HDD is designed to avoid surface impacts, if rushed or poorly executed, it can damage surface water, groundwater, and private property. The Mariner East 2 pipeline construction left several families without water after construction crews punctured an aquifer at an HDD site.
Shell’s data highlights 24 wells that are within 1,000 feet of a proposed HDD site.
We’ve isolated the groundwater wells and HDDs in a standalone map for closer inspection below. The 24 most at-risk wells are circled in blue.
Testing your groundwater quality before construction begins is crucial for determining impacts later on. Two upcoming workshops in Washington County, PA and another in Beaver County, PA will discuss how to protect your water and property.
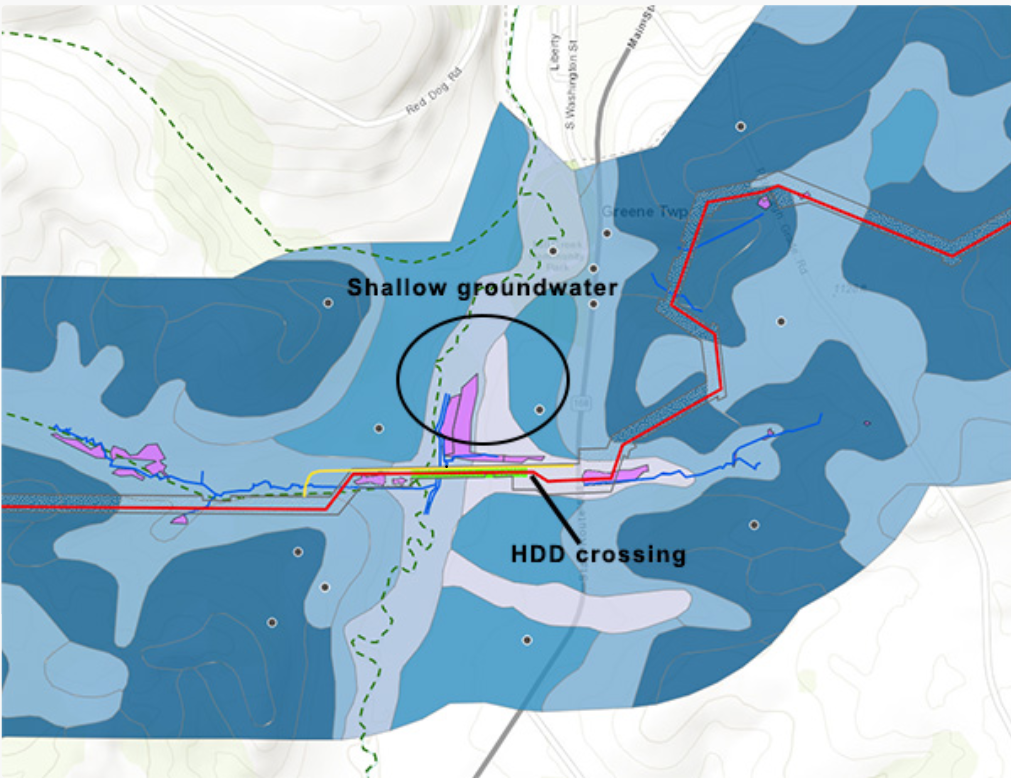
The Falcon’s HDD locations offer disturbing similarities to what caused the Mariner East pipeline spills. Many of Sunoco’s failures were due to inadequately conducted (or absent) geophysical surveys that failed to identify shallow groundwater tables, which then led to drilling mud entering streams and groundwater.
Figure 1 below shows Greene Township, Beaver County, just south of Hookstown, where the “water table depth” is shown. The groundwater at this HDD site averages 20ft on its western side and only 8ft deep on the eastern side.
Figure 1. Water table depth in Greene Township
Water Reservoirs
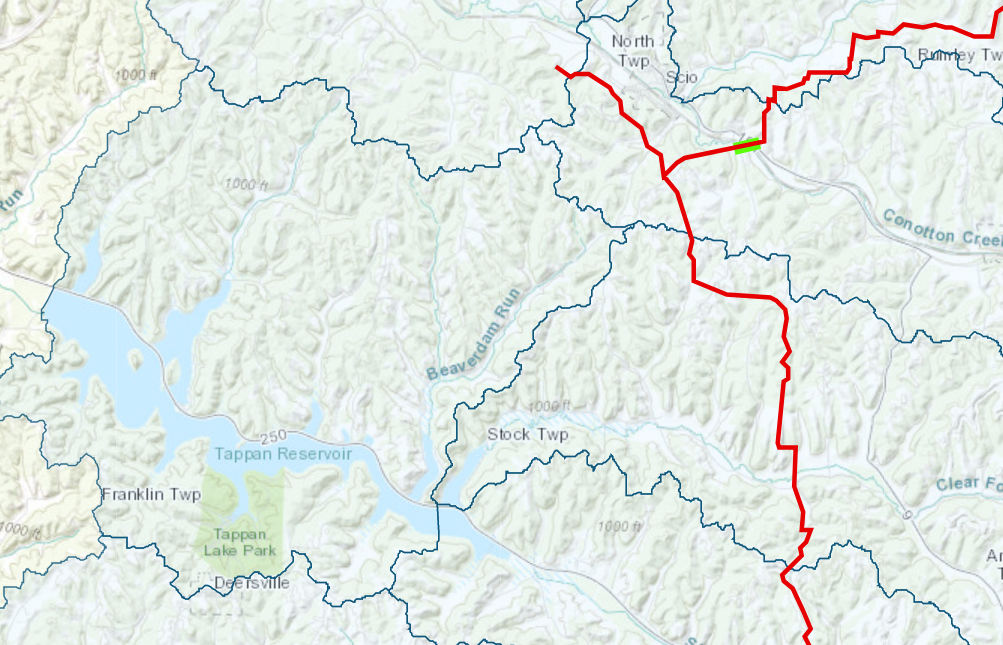
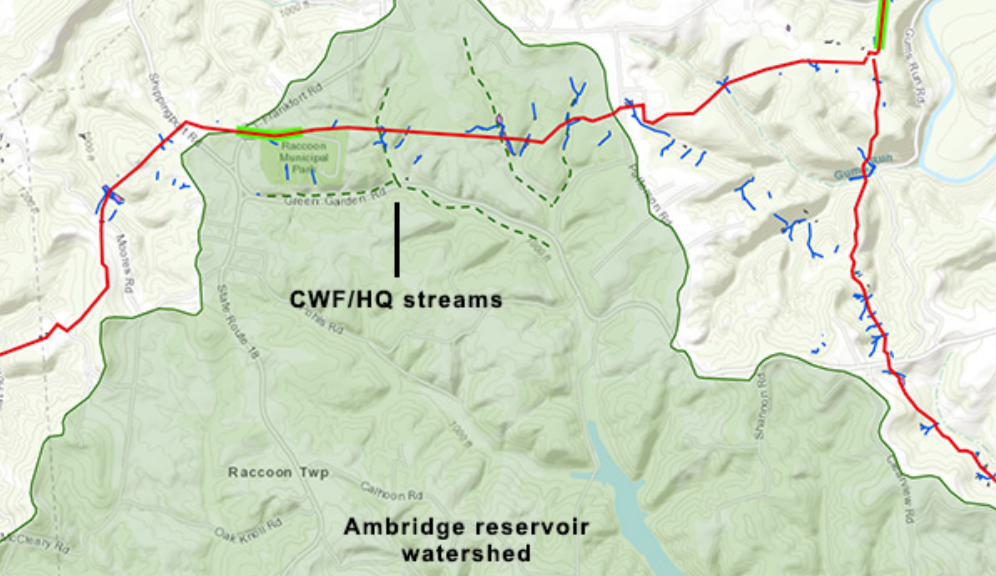
The Falcon also crosses the headwaters of two drinking water reservoirs: the Tappan Reservoir in Harrison County, OH (Figure 2) and the Ambridge Reservoir in Beaver County, PA (Figure 3). The Falcon will also cross the raw water line leading out of the Ambridge Reservoir.
The Ambridge Reservoir supplies water to five townships in Beaver County (Ambridge, Baden, Economy, Harmony, and New Sewickley) and four townships in Allegheny County (Leet, Leetsdale, Bell Acres & Edgeworth). The Tappan Reservoir is the primary drinking water source for residents in Scio.
Figure 2. Tappan Reservoir and the Falcon route in Harrison County, Ohio
Figure 3. Ambridge Reservoir and the Falcon route in Beaver County, Pennsylvania
Wetlands
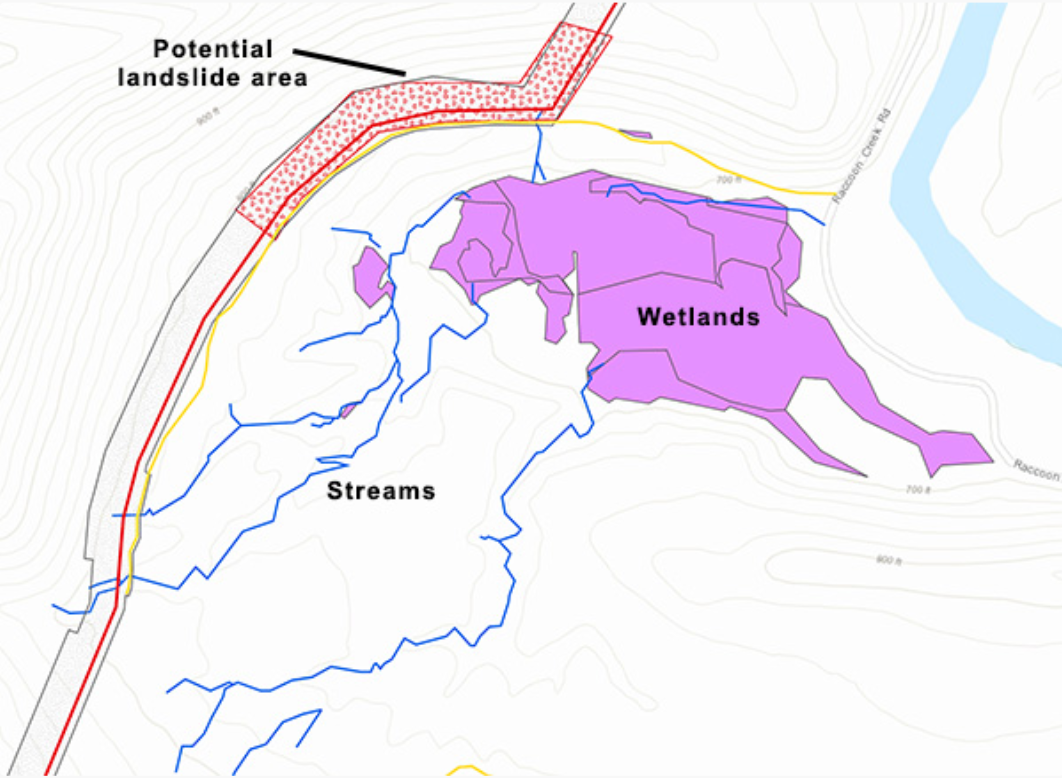
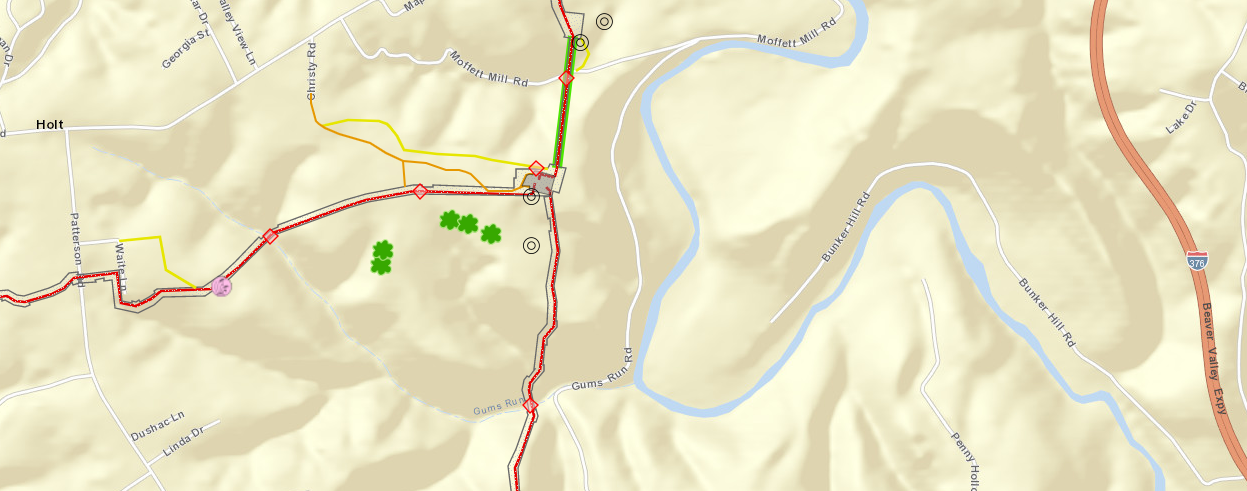
Wetlands that drain into Raccoon Creek in Beaver County, PA will be particularly vulnerable in 2 locations. The first is in Potter Township, off of Raccoon Creek Rd just south of Frankfort Rd, where the Falcon will run along a wooded ridge populated by half a dozen perennial and intermittent streams that lead directly to a wetland, seen in Figure 4. Complicating erosion control further, Shell’s survey data shows that this ridge is susceptible to landslides. This area is also characterized by the USGS as having a “high hazard” area for soil erosion.
Figure 4. Wetlands and streams in Potter Township, PA
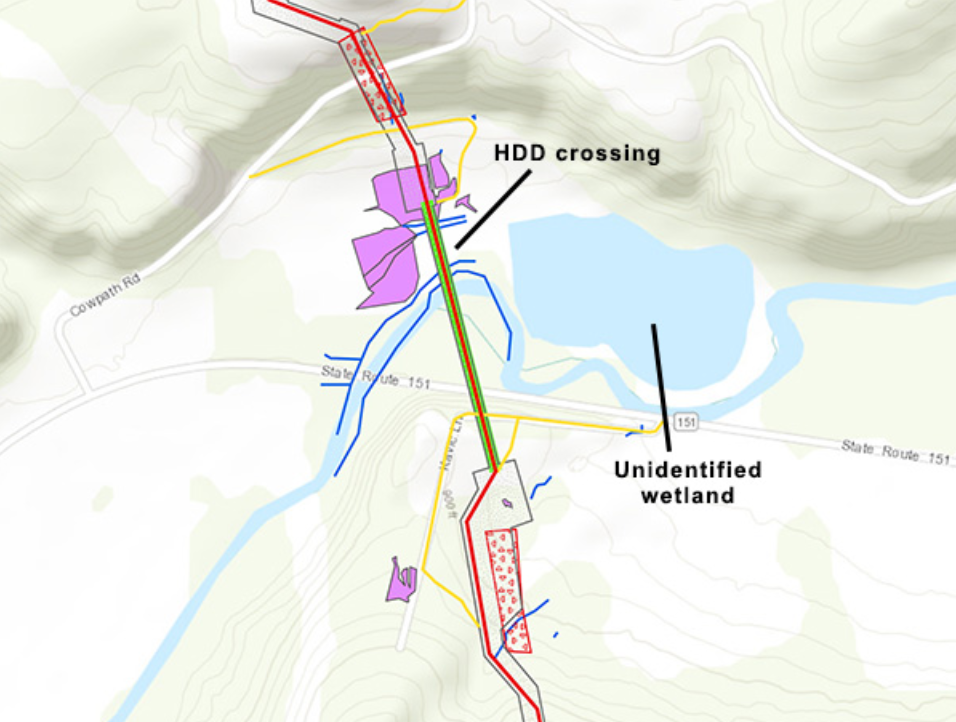
The other wetland area of concern along Raccoon Creek is found in Independence Township at the Beaver County Conservation District (Figure 5). Here, the Falcon will go under the Creek using HDD (highlighted in bright green). Nevertheless, the workspace needed to execute the crossing is within the designated wetland itself. An additional 15 acres of wetland lie only 300ft east of the crossing but are not accounted for in Shell’s data. This unidentified wetland is called Independence Marsh, considered the crown jewel of the Independence Conservancy’s watershed stewardship program.
Figure 5. Wetlands and Raccoon Creek in Independence Township, PA
Subsurface concerns
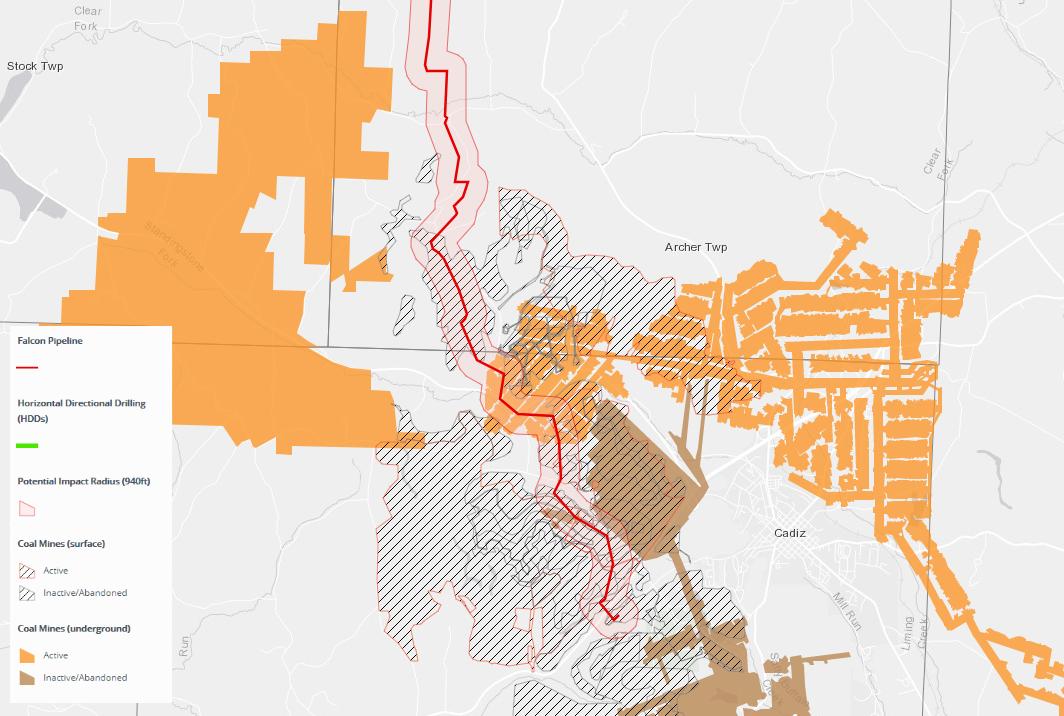
Shell’s analysis shows that 16.8 miles of the Falcon pipeline travel through land that historically has or currently contains coal mines. Our analysis using the same dataset suggests the figure is closer to 20 miles. Construction through undermined areas poses a risk for ground and surface water contamination and subsidence.
Of these 20 miles of undermined pipeline, 5.6 miles run through active coal mines and are located in Cadiz Township, OH (Harrison Mining Co. Nelms Mine, seen in Figure 6); Ross Township, OH (Rosebud Mining Co. Deep Mine 10); and in Greene Township, PA (Rosebud Mining Co. Beaver Valley Mine).
Figure 6. Coal mines and are located in Cadiz Township, OH
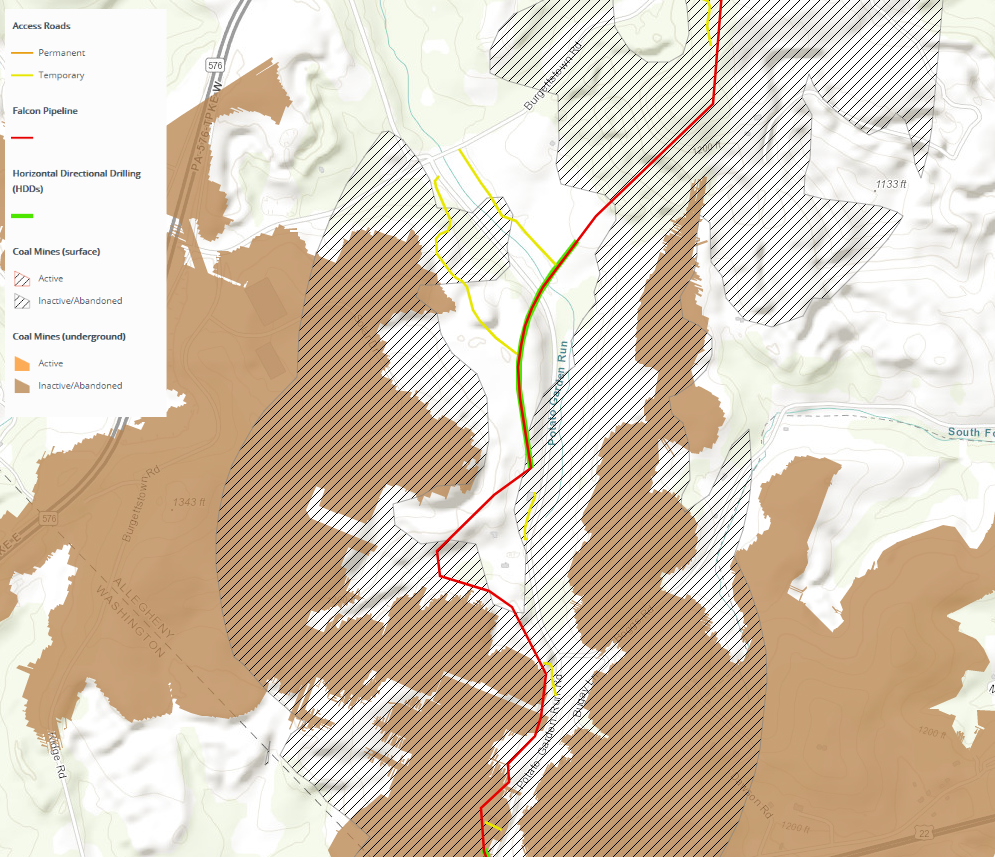
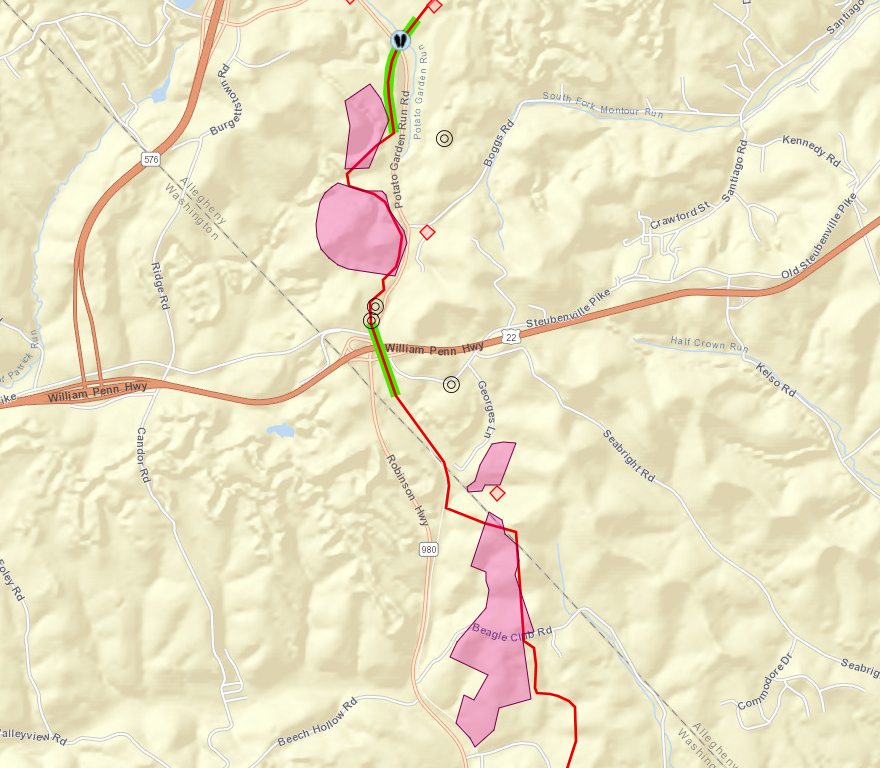
More than 25 of the Falcon’s 97 pipeline miles will be laid within karst landscapes, including 9 HDD sites. Karst is characterized by soluble rocks such as limestone prone to sinkholes and underground caves. A cluster of these are located in Allegheny and Washington counties, PA, with extensive historical surface mining operations.
The combination of karst and coal mines along Potato Garden Run, in Figure 7, make this portion of the pipeline route particularly risky. At this HDD site, the Falcon will cross a coal waste site identified in the permits as “Imperial Land Coal Slurry” along with a large wetland.
Figure 7. Coal mines in Imperial, Pennsylvania
Vulnerable species
Southern Redbelly Dace
The Southern Redbelly Dace, a threatened species, is especially vulnerable to physical and chemical (turbidity, temperature) changes to their environment. PA Fish and Boat Commission explicitly notes in their correspondence with Shell that “we are concerned about potential impacts to the fish, eggs and the hatching fry from any in-stream work.” Of note is that these sites of concern are located in designated “High Quality/Cold Water Fishes” streams of the Service Creek watershed (Figure 8). PFBC stated that that no in-stream work in these locations should be done between May 1 and July 31.
Figure 8. “High Quality/Cold Water Fishes” streams identified as habitat for the Southern Redbelly Dace
Northern Harriers & Short-Eared Owls
Portions of the Falcon’s workspace are located near 6 areas with known occurrences of Short-eared Owls (PA endangered species) and Northern Harriers (PA threatened species). Pennsylvania Game Commission requested a study of these areas to identify breeding and nesting locations, which were executed from April-July 2016 within a 1,000-foot buffer of the pipeline’s workspace (limited to land cover areas consisting of meadows and pasture). One Short-eared Owl observation and 67 Northern Harrier observations were recorded during the study. PGC’s determined that, “based on the unusually high number of observations at these locations” work should not be done in these areas during harrier breeding season, April 15 through August 31.
Figure 9. Surveyed areas for Short-eared Owls (PA endangered species) and Northern Harriers (PA threatened species)
Bald Eagles
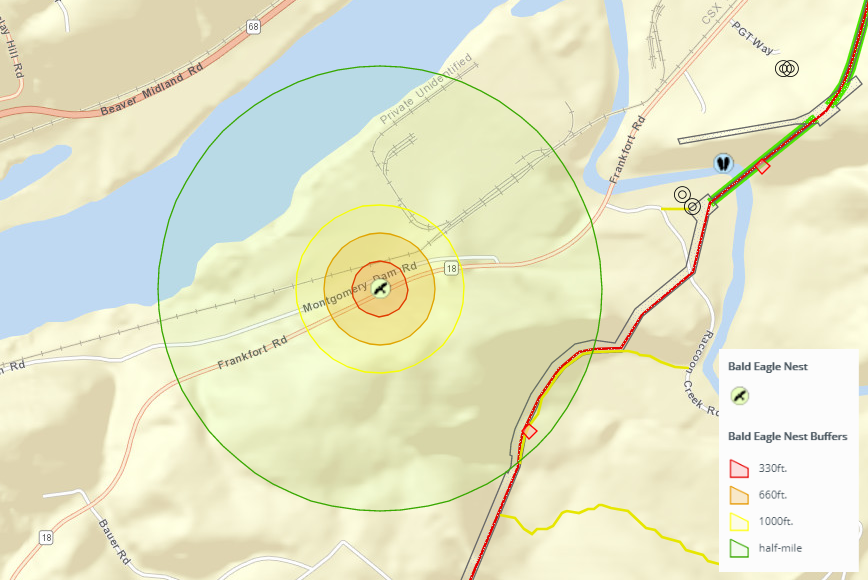
A known Bald Eagle nest is located in Beaver County. Two potential “alternate nests” are located where the Falcon crosses the Ohio River. National Bald Eagle Management Guidelines bar habitat disturbances that may interfere with the ability of eagles to breed, nest, roost, and forage. The 1 active nest in close proximity to the Falcon, called the Montgomery Dam Nest, is located just west of the pipeline’s terminus at Shell’s ethane cracker facility.
U.S. Fish and Wildlife Service requested that Shell only implement setback buffers for the one active nest at Montgomery Dam (Figure 10). These include no tree clearing within 330 feet, no visible disturbances with 660 feet, and no excessive noise with 1,000 feet of an active nest. Furthermore, Shell must avoid all activities within 660ft of the nest from January 1st to July 31st that may disturb the eagles, including but not limited to “construction, excavation, use of heavy equipment, use of loud equipment or machinery, vegetation clearing, earth disturbance, planting, and landscaping.
Figure 10. Bald Eagle nest in Potter Township, Pennsylvania
Bats
The Falcon is located within the range of federally protected Indiana Bats and Northern Long-eared Bats in Pennsylvania and West Virginia. In pre-construction surveys, 17 Northern Long-eared Bats were found at 13 of the survey sites, but no Indiana Bats were captured.
A total of 9 Northern Long-eared Bat roost trees were located, with the nearest roost tree located 318 feet from the pipeline’s workspace. Figure 11 below shows a cluster of roost trees in Raccoon Township, PA. For a map of all the roost trees, click here. The U.S. Fish and Wildlife Service stated that “Due to the presence of several Northern Long-eared Bat roost trees within the vicinity of the project footprint (although outside of the 150-foot buffer), we recommend the following voluntary conservation measure: No tree removal between June 1 and July 31.”
The Pennsylvania Game Commission noted in early correspondences that Silver-haired Bats may be in the region (a PA species of special concern). PGC did not require a further study for the species, but did request a more restrictive conservation of no tree clearing between April 1 and October 31.
Figure 11. Northern long-eared bat roost trees in Raccoon Township, Pennsylvania
For more information on the wildlife impacts of the Falcon Pipeline, click here.
By documenting the impacts of the Falcon Pipeline, you’re contributing to a growing body of work that shows the risks of fossil fuel pipelines. Not only does this evidence protect drinking water and vulnerable species, it serves as evidence against an inherently dangerous project that will contribute to climate change and the global plastics crisis.
We hope you’re inspired to take action and add your voice to a growing team in the region committed to safer and healthier environments. Thank YOU for your dedication to the cause!
By Erica Jackson, Community Outreach and Communications Specialist, FracTracker Alliance.
Portions of this article were adapted from previous posts in the Falcon Public EIA Project, written by Kirk Jalbert.
https://www.fractracker.org/a5ej20sjfwe/wp-content/uploads/2019/05/PipelineConstructionFeature.png6671500Erica Jacksonhttps://www.fractracker.org/a5ej20sjfwe/wp-content/uploads/2025/09/2025-Wordmark-Logo.pngErica Jackson2019-05-08 08:27:302021-04-15 14:56:31The Falcon Public Monitoring Project
Contact: Lee Ziesche, lee@saneenergyproject.org, 954-415-6282
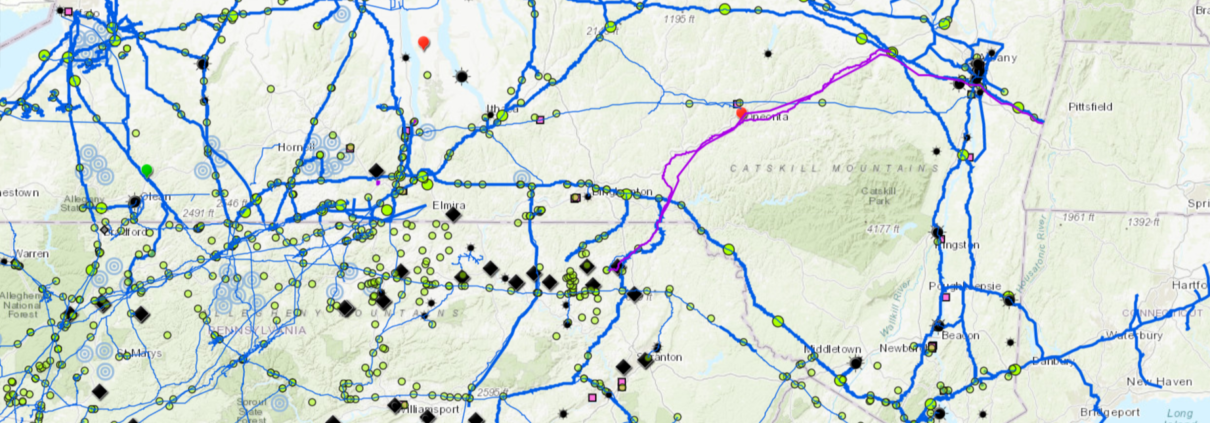
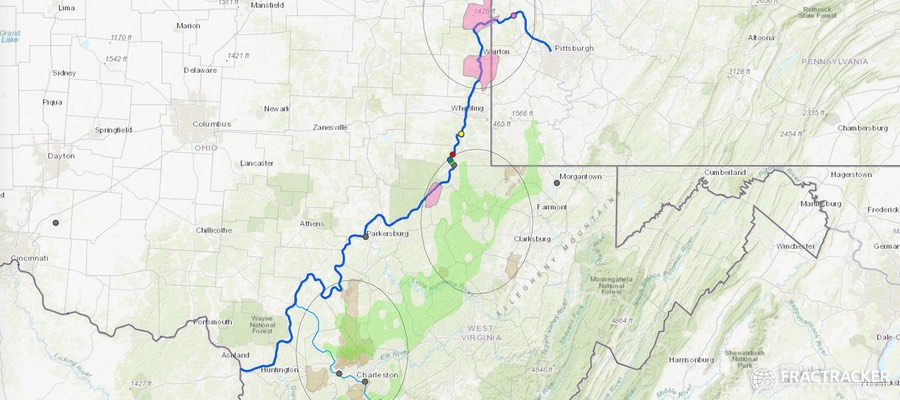
Interactive Map Shows Expansion of Fracked Gas Infrastructure in New York State
And showcases powerful community resistance to it
New York, NY – A little over a year after 55 New Yorkers were arrested outside of Governor Cuomo’s door calling on him to be a true climate leader and halt the expansion of fracked gas infrastructure in New York State, grassroots advocates Sane Energy Project re-launched the You Are Here (YAH) map, an interactive map that shows an expanding system of fracked infrastructure approved by the Governor.
“When Governor Cuomo announced New York’s climate goals in early 2019, it’s clear there is no room for more extractive energy, like fossil fuels.” said Kim Fraczek, Director of Sane Energy Project, “Yet, I look at the You Are Here Map, and I see a web of fracked gas pipelines and power plants trapping communities, poisoning our water, and contributing to climate change.”
Sane Energy originally launched the YAH map in 2014 on the eve of the historic People’s Climate March, and since then, has been working with communities that resist fracked gas infrastructure to update the map and tell their stories.
“If you read the paper, you might think Governor Cuomo is a climate leader, but one look at the YAH Map and you know that isn’t true. Communities across the state are living with the risks of Governor Cuomo’s unprecedented buildout of fracked gas infrastructure,” said Courtney Williams, a mother of two young children living within 400 feet of the AIM fracked gas pipeline. “The Governor has done nothing to address the risks posed by the “Algonquin” Pipeline running under Indian Point Nuclear Power Plant. That is the center of a bullseye that puts 20 million people in danger.”
Fracked gas infrastructure poses many of the same health risks as fracking and the YAH map exposes a major hypocrisy when it comes to Governor Cuomo’s environmental credentials. The Governor has promised a Green New Deal for New York, but climate science has found the expansion of fracking and fracked gas infrastructure is increasing greenhouse gas emissions in the United States.
“The YAH map has been an invaluable organizing tool. The mothers I work with see the map and instantly understand how they are connected across geography and they feel less alone. This solidarity among mothers is how we build our power ,” said Lisa Marshall who began organizing with Mothers Out Front to oppose the expansion of the Dominion fracked gas pipeline in the Southern Tier and a compressor station built near her home in Horseheads, New York. “One look at the map and it’s obvious that Governor Cuomo hasn’t done enough to preserve a livable climate for our children.”
“Community resistance beat fracking and the Constitution Pipeline in our area,” said Kate O’Donnell of Concerned Citizens of Oneonta and Compressor Free Franklin. “Yet smaller, lesser known infrastructure like bomb trucks and a proposed gas decompressor station and 25 % increase in gas supply still threaten our communities.”
The YAH map was built in partnership with FracTracker, a non-profit that shares maps, images, data, and analysis related to the oil and gas industry hoping that a better informed public will be able to make better informed decisions regarding the world’s energy future.
“It has been a privilege to collaborate with Sane Energy Project to bring our different expertise to visualizing the extent of the destruction from the fossil fuel industry. We look forward to moving these detrimental projects to the WINS layer, as communities organize together to take control of their energy future. Only then, can we see a true expansion of renewable energy and sustainable communities,” said Karen Edelstein, Eastern Program Coordinator at Fractracker Alliance.
Throughout May and June Sane Energy Project and 350.org will be traveling across the state on the ‘Sit, Stand Sing’ tour to communities featured on the map to hold trainings on nonviolent direct action and building organizing skills that connect together the communities of resistance.
“Resistance to fracking infrastructure always starts with small, volunteer led community groups,” said Lee Ziesche, Sane Energy Community Engagement Coordinator. “When these fracked gas projects come to town they’re up against one of the most powerful industries in the world. The You Are Here Map and ‘Sit, Stand Sing’ tour will connect these fights and help build the power we need to stop the harm and make a just transition to community owned renewable energy.”
https://www.fractracker.org/a5ej20sjfwe/wp-content/uploads/2019/04/YouAreHereMap2.png6671500Guest Authorhttps://www.fractracker.org/a5ej20sjfwe/wp-content/uploads/2025/09/2025-Wordmark-Logo.pngGuest Author2019-04-24 15:49:052021-04-15 14:56:34Release: The 2019 You Are Here map launches, showing New York’s hurdles to climate leadership
Oil and gas development generates a lot of liquid waste.
Some of the waste comes that comes out of a well is from the geologic layer where the oil and gas resources are located. These extremely saline brines may be described as “natural,” but that does not make them safe, as they contain dangerous levels of radiation, heavy metals, and other contaminants.
Additionally, a portion of the industrial fluid that was injected into the well to stimulate production, known as hydraulic fracturing fluid, returns to the surface. Some of these substances are known carcinogens, while others remain entirely secret, even to the personnel in the field who are employed to use the additives.
The industry likes to remind residents that they have used this technique for more than six decades, which is true. What separates “conventional” fracking from developing unconventional formations such as the Marcellus Shale is really a matter of scale. Conventional formations are often stimulated with around 10,000 gallons of fluid, while unconventional wells now average more than 10 million gallons per well.
Conventional Well: 10,000 gallons
Olympic Swimming Pool: 660,253 gal
Unconventional Well: >10 Million gal
In 2017 alone, Pennsylvania oil and gas wells generated 57,653,023 barrels (2.42 billion gallons) of liquid waste.
Managing the waste stream
Liquid waste can be reused to stimulate other oil and gas wells, but reuse concentrates the contaminant load in the fluid. There is a limit to this concentration that operators can use, even for this industrial purpose.
Another strategy is to decrease the volume of the waste through evaporation and other treatment methods. This also increases the contaminant concentration. Pennsylvania used to permit “treatment” of wastewater at sewage treatment facilities, before being forced to concede that the process was completely ineffective, and resulted in contaminating streams and rivers throughout the Commonwealth.
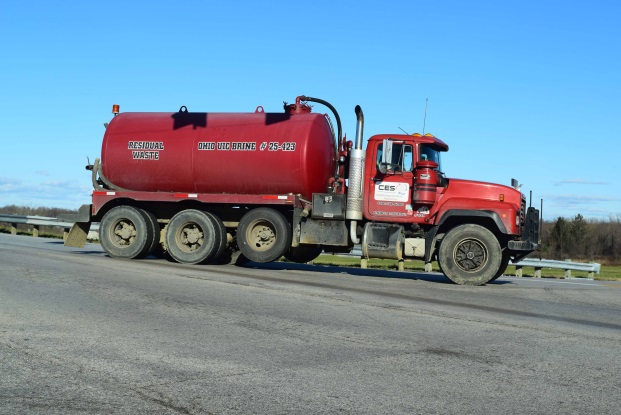
In many states, much of this waste is disposed of in facilities known as salt water disposal (SWD) wells, a specific type of injection well. These waste facilities fall under the auspices of the US Environmental Protection Agency’s Underground Injection Control (UIC) program. Such wells are co-managed with states’ oil and gas regulatory agencies, although the specifics vary by state.
These photos show SWD wells in other states, but what about in Pennsylvania?
The oil and gas industry in Pennsylvania has not used SWD wells as a primary disposal method, as the state’s geology has been considered unsuitable for this process. For example, on page 67 of this 2009 industry report, the authors saw treatment of flowback fluid at municipal facilities as a viable option (before the process was banned in 2011), but underground injection as less likely (emphasis added):
The disposal of flowback and produced water is an evolving process in the Appalachians. The volumes of water that are being produced as flowback water are likely to require a number of options for disposal that may include municipal or industrial water treatment facilities (primarily in Pennsylvania), Class II injection wells [SWDs], and on-site recycling for use in subsequent fracturing jobs. In most shale gas plays, underground injection has historically been preferred. In the Marcellus play, this option is expected to be limited, as there are few areas where suitable injection zones are available.
The ban on surface “treatment” being discharged into Pennsylvania waters has increased the pressure for finding new solutions for brine disposal. This is compounded by the fact that the per-well volume of fluid injected into shale gas wells in the region has nearly tripled in that time period. Much of what is injected comes back up to the surface and is added to the liquid waste stream.
Chemically-similar brine from conventional wells has been spread on roadways for dust suppression. This practice was originally considered a “beneficial use” of the waste product, but the Pennsylvania Department of Environmental Protection (DEP) halted that practice in May 2018.
None of these waste management decisions make the geology in Pennsylvania suddenly suitable for underground injection, however, they do increase the pressure on the state to find a disposal solution.
Concerns with SWD wells
There are numerous concerns with salt water disposal wells. In October 2018, the DEP held a hearing in Plum Borough, on the eastern edge of Allegheny County, where there is a proposal to convert the Sedat 3A conventional well to an injection well. Some of the concerns raised by residents include:
Fluid and/or gas migration- There are numerous routes for fluids and gas to migrate from the injection formation to drinking water aquifers or even surface water. Potential conduits include coal mines, abandoned gas wells, water wells, and naturally occurring fissures in crumbling sedimentary formations.
Induced seismicity- SWD wells have been linked to increased earthquake activity, either by lubricating or putting pressure on old faults that had been dormant. Earthquakes can occur miles away from the injection location, and in sedimentary formations, not just igneous basement rock.
Noise, diesel pollution, loss of privacy, and road degradation caused by a constant stream of industrial waste haulers to the well location.
Complicating existing issues- Plum Borough and surrounding communities are heavily undermined, and in fact the well bore goes right through the Renton Coal Mine (another part of which has been on fire for decades). Mine subsidence is already a widespread issue in the region, and many fear that even small seismic events could exacerbate this.
Possibility of surface spill- Oil and gas is, sadly, a sloppy industry, with unconventional operations having accumulated more than 13,000 violations in Pennsylvania since 2008. If a major spill were to happen at this location, there is the possibility of release into Pucketa Creek, which drains into the Allegheny River, the source of drinking water for multiple communities.
Radioactivity and other contaminants- Flowback fluids are often highly radioactive, contain heavy metals, and other contaminants that are challenging to effectively clean. The migration of radon gas into homes above the injection formation is also a possibility.
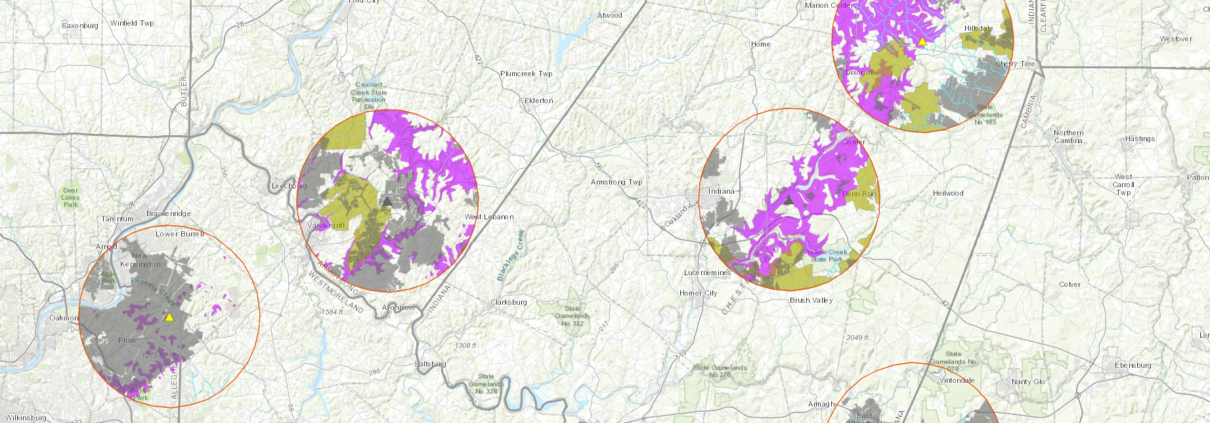
Pennsylvania has numerous data sources for oil and gas, but they are not always in agreement. To account for this, we have mapped SWDs (and a five mile buffer around them) from two different data sources in the map below. The first source is a subset of SWD wells from a larger dataset of oil and gas locations from the DEP’s mapping website. The second source is from a Waste Facility Report, represented in pink triangles that are offset at an angle to allow users to see both datasets simultaneously in instances where they overlap.
Map of existing, proposed, and plugged salt water disposal (SWD) injection wells in Pennsylvania.
According to the first data set of DEP’s oil and gas locations, Pennsylvania contains 13 SWDs with an active status, one SWD with a regulatory inactive status, and eight that are plugged. The Waste Facility Report shows 10 SWD wells total, including one well that was left out of the other data set in Annin Township, McKean County.
It is worth noting that Pennsylvania’s definition for an “active” well status is confusing, to put it charitably. It does not mean that a well is currently in operation, nor does it even mean that it is currently permitted for the activity, whether that is waste disposal or gas production, or some other function. An active status means that the well has been proposed for a given use, and the well hasn’t been plugged, or assigned some other status.
The Sedat 3A well in Plum, for example, has an active status, although the DEP has not yet granted it a permit to operate as a SWD well. Another status type is “regulatory inactive,” which is given to a well that hasn’t been used for its stated purpose in 12 months, but may potentially have some future utility.
Karst, coal mines, and streams
While there are numerous factors worthy of consideration when siting SWD wells, this map focuses on three: the proximity of karst formations, coal mines and nearby streams that the state designates as either high quality or exceptional value.
Karst formations are unstable soluble rock formations like limestone deposits which are likely to contain numerous subsurface voids. These voids are concerning in this context. For one reason, there’s the possibility of contaminated fluids and gasses migrating into underground freshwater aquifers. Also, the voids are inherently structurally unstable, which could compound the impacts of artificially-induced seismic activity caused by fluid injections in the well.
Our analysis found over 78,000 acres (123 square miles) of karst geology within five miles of current, proposed, or plugged SWD wells in Pennsylvania.
Coal mines, while a very different sedimentary formation, have similar concerns because of subsurface voids. Mine subsidence is already a widespread problem in many of the communities surrounding SWD well sites. Pennsylvania has several available data sets, including active underground mine permits and digitized mined areas, which are used in this map. Active mine permits show current permitted operations, while digitized mine areas offer a highly detailed look at existing mines, including abandoned mines, although the layer is not complete for all regions of the state.
In Pennsylvania, there are 56,542 acres (88 square miles) of active mines within five miles of SWD wells. Our analysis found 97,902 acres (153 square miles) of digitized mined areas within five miles of SWD wells. Combined, there are 139,840 acres (219 square miles) of existing and permitted mines within the 5 mile buffer zone around SWDs in Pennsylvania.
Streams with the designation “high quality” and “exceptional value” are the best streams Pennsylvania has to offer, in terms of recreation, fishing, and biological diversity. In this analysis, we have identified such streams within a five mile radius of SWD wells, irrespective of the given watershed of the well location.
While the rolling topography of Western Pennsylvania sheds rainwater in a complicated network of drainages, groundwater is not subject to that particular geography. Furthermore, groundwater regularly interacts with surface water through water wells, abandoned O&G wells, and natural seeps and springs. Therefore, it is possible for SWDs to contaminate these treasured streams, even if they are not located within the same watershed.
Altogether, there are 716 miles of high quality streams and 110 miles of exceptional value streams within 5 miles of the SWDs in this analysis.
Conclusion
For decades, geologists have concluded that the subsurface strata in Pennsylvania were not suitable for oil and gas liquid waste disposal in underground injection wells. The fact that vast quantities of this waste are now being produced in Pennsylvania has not suddenly made it a suitable location for the practice. If anything, additional shallow and deep wells have further fractured the sedimentary strata, thereby increasing the risk of contamination.
The only factor that has changed is the volume of waste being produced in the region. SWD wells in nearby Ohio and West Virginia have capacity issues from their own production wells, and it is not clear that the geologic formations across the border are that much better than in Pennsylvania. But as new wells are drilled and volumes of hydraulic fracturing fluid continue to spiral into the tens of millions of gallons per well, the pressure to open new SWD wells in the state will only increase.
Perhaps because of these pressures, DEP has become quite bullish on the technology:
Several successful disposal wells are operating in Pennsylvania and options for more sites are always being considered. The history of underground disposal shows that it is a practical, safe and effective method for disposing of fluids from oil and gas production.
Up against this attitude, residents are facing an uphill battle trying to prevent harm to their health and property from these industrial facilities in their communities. Municipalities that have attempted to stand up for their residents have been sued by DEP to allow for these injection wells. The Department’s actions, which put the interests of industry above the health of residents and the environment, is directly at odds with the agency’s mission statement:
The Department of Environmental Protection’s mission is to protect Pennsylvania’s air, land and water from pollution and to provide for the health and safety of its citizens through a cleaner environment. We will work as partners with individuals, organizations, governments and businesses to prevent pollution and restore our natural resources.
It’s time for DEP to live up to its promises.
By Matt Kelso, Manager of Data and Technology, FracTracker Alliance
https://www.fractracker.org/a5ej20sjfwe/wp-content/uploads/2019/01/SWD_PA2.png6671500Matt Kelso, BAhttps://www.fractracker.org/a5ej20sjfwe/wp-content/uploads/2025/09/2025-Wordmark-Logo.pngMatt Kelso, BA2019-01-31 10:54:552021-04-15 14:56:56Getting Rid of All of that Waste – Increasing Use of Oil and Gas Injection Wells in Pennsylvania
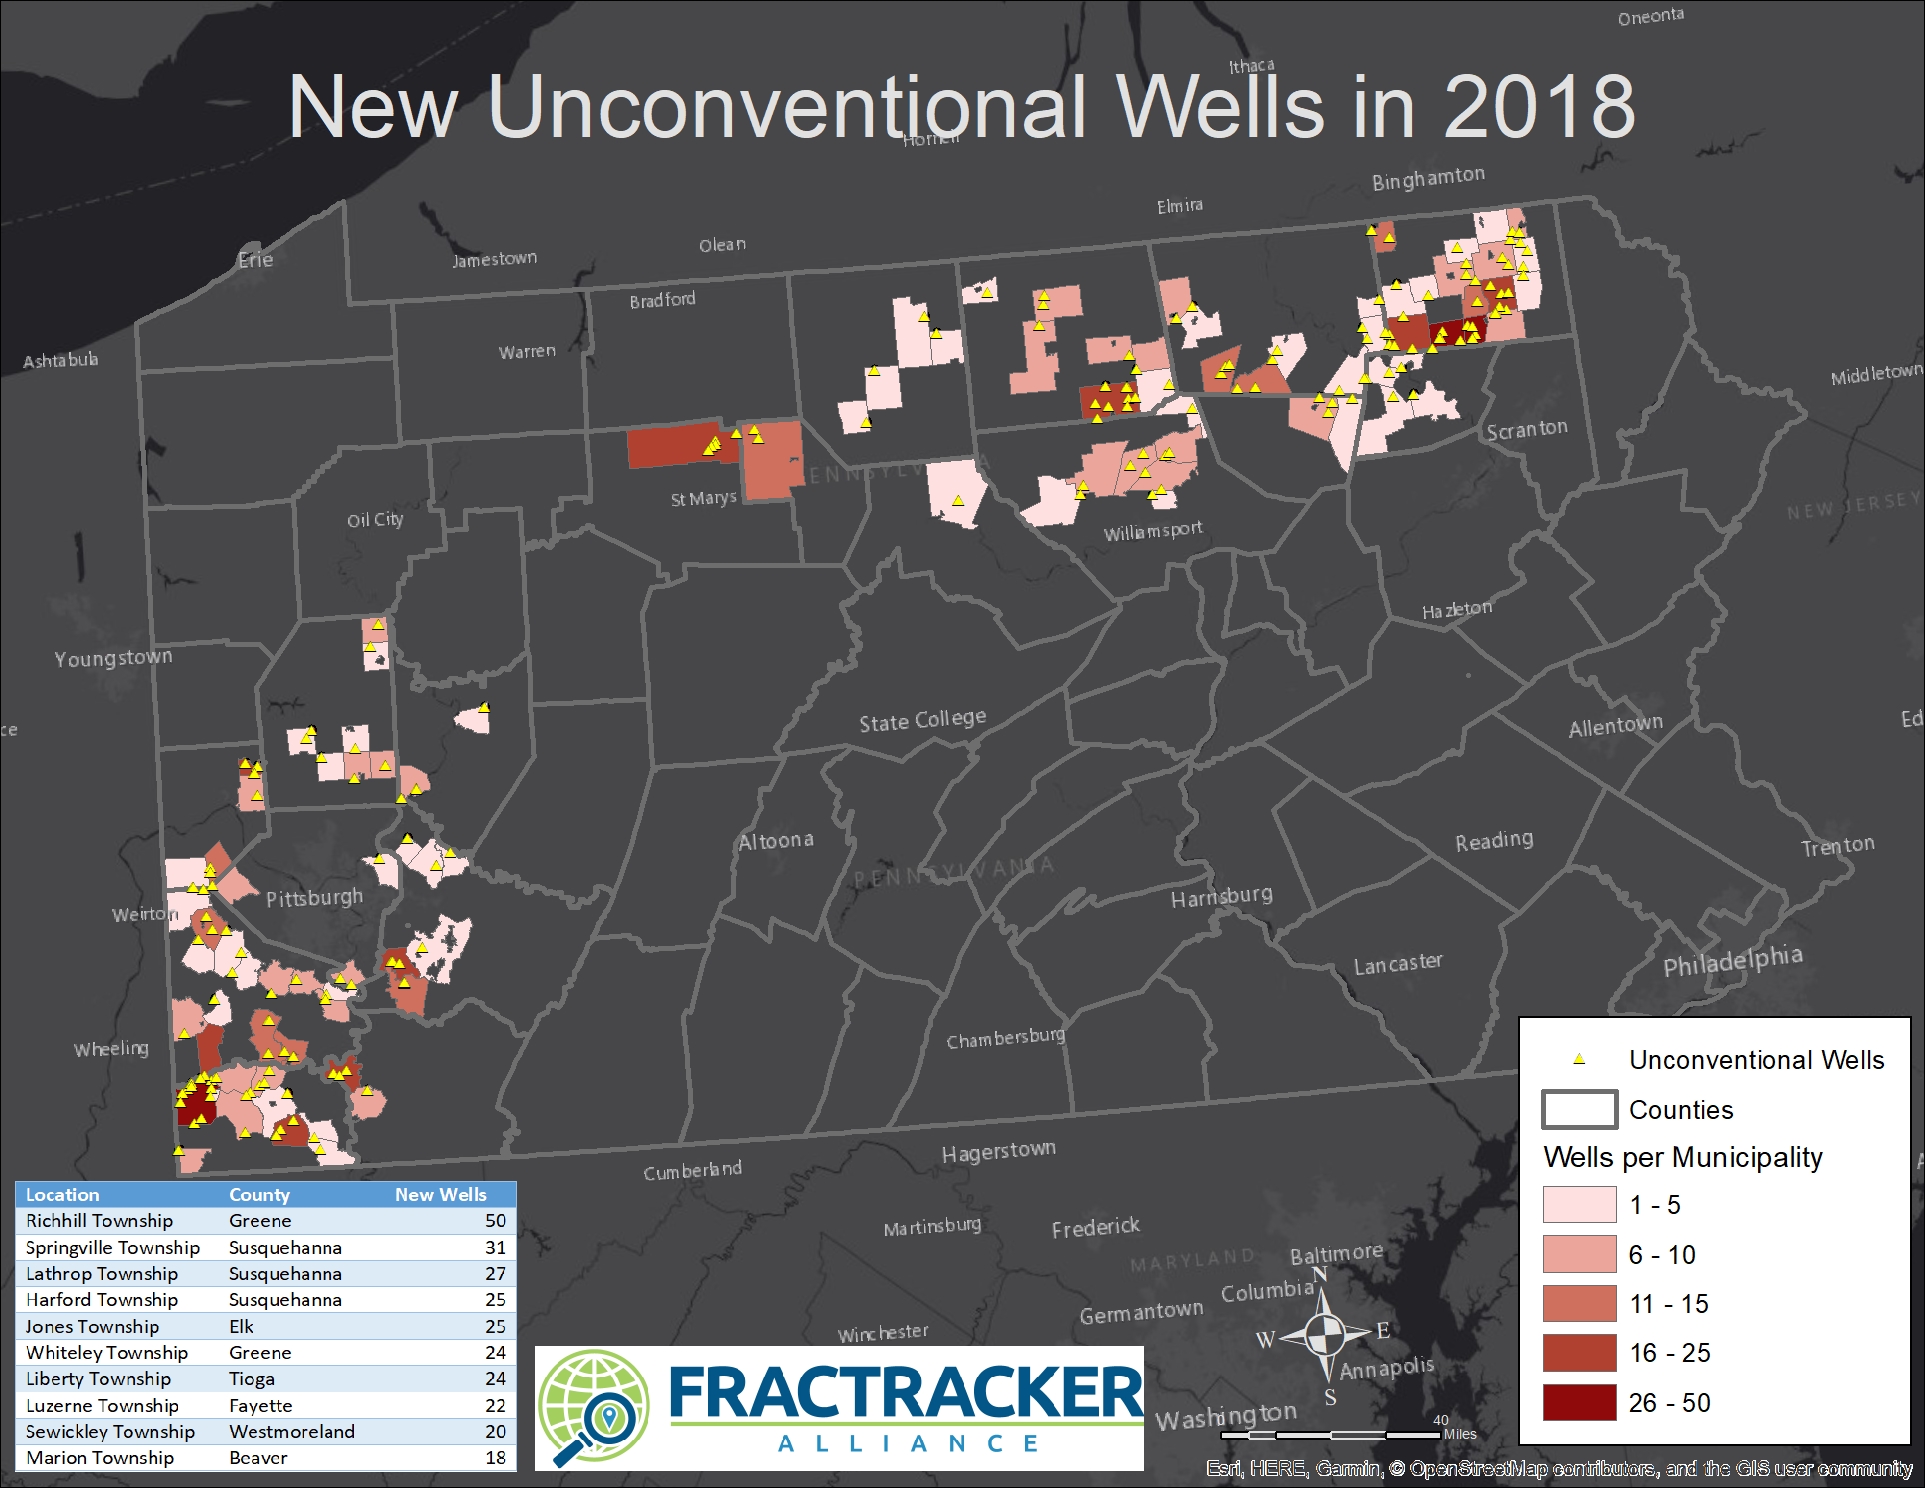
With the new year underway, it’s an opportune moment to reflect on the state of unconventional oil and gas extraction in Pennsylvania and examine a few of the drilling trends. A logical place to start is looking at the new wells drilled in 2018.
As always, but perhaps even more so than in previous years, unconventional drilling in Pennsylvania is a tale of two shale plays, with hotspots in the southwestern and northeastern corners of the state. The northeastern hotspot seems to be extending westward, including 25 new wells in Jones Township in Elk County (an area shown in dark red near the “St Marys” label on the map). In the southwestern hotspot, the industry continues to encircle Allegheny County, closing in on the City of Pittsburgh like a constrictor.
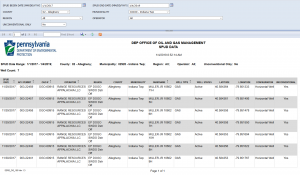
Screen shot showing spud report for Indiana Township, Allegheny County from 1/1/2017 through 1/4/2019. We suspect these spud dates of 11/29/17 and 11/30/17 are incorrect.
Data error? As Pittsburgh-area residents reflect on the past year, some of them must be wondering why a new well pad in Indiana Township, just northeast of the city isn’t shown on the map above. The answer is that the data the Department of Environmental Protection (DEP) has for these wells indicate they were drilled November 29-3o, 2017, although we believe this to be incorrect. FracTracker obtained the data from the Spud Report on January 2, 2019, which indicates seven wells spudded in that two day span on the “Miller Jr. 10602” well pad. This activity drew considerable opposition from families in the Fox Chapel School district in May of 2018, and was therefore widely reported on by the media. An article published on WESA indicates an expected drill date of July 2018, for example.
It turns out the new year is also a good time to remember that our understanding of the oil and gas industry around us is shaped, molded, and limited by the availability and quality of the data. We brought the Indiana Township data error to the attention of DEP, which only confirmed that the operator (Range Resources) entered the spud dates into the DEP’s online system. Perhaps these well were drilled in November of 2018 not 2017? There is even a possibility these wells have yet to be drilled.
Here are a few more dissections of the data, such as it is:
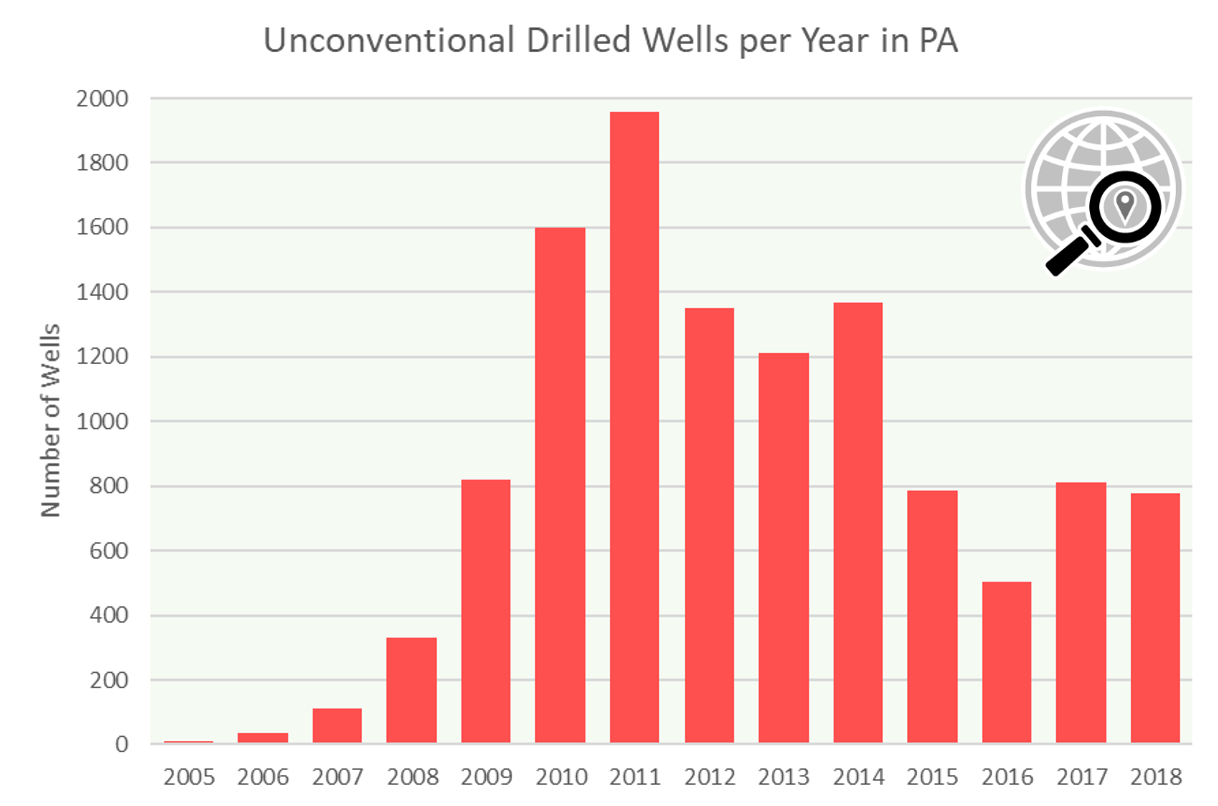
Figure 1: Unconventional wells drilled in PA by year: 2005 to 2018
Wells Drilled Over Time
Barring more widespread data issues, the status of a handful of wells in Indiana Township does not have much of an impact on the overall trend of drilling in the state. There were 779 wells on the report, representing just under 40% of the total from the peak year of 2011, when industry drilled 1,958 wells. The year 2019 was the fourth year in a row where the industry failed to drill 1,000 wells, averaging 719 per year over that span. In contrast, the five years between 2010 and 2014 saw an average of 1,497 wells per year, more than twice the more recent average. As mentioned in our Hazy Future report, projections based on very aggressive drilling patterns are already proving to be out of phase with reality, although petrochemical commodity markets might change drastically in the coming decades.
How long before wells are plugged?
We also like to periodically check to see how long these wells stay in service. In Pennsylvania, there are two relevant well statuses worth following: plugged and regulatory inactive. While there are a number of conditions that characterize regulatory inactive wells, they are essentially drilled wells that are not currently in production, but may have “future utility.” Therefore, the wells are not required to be permanently plugged at this time.
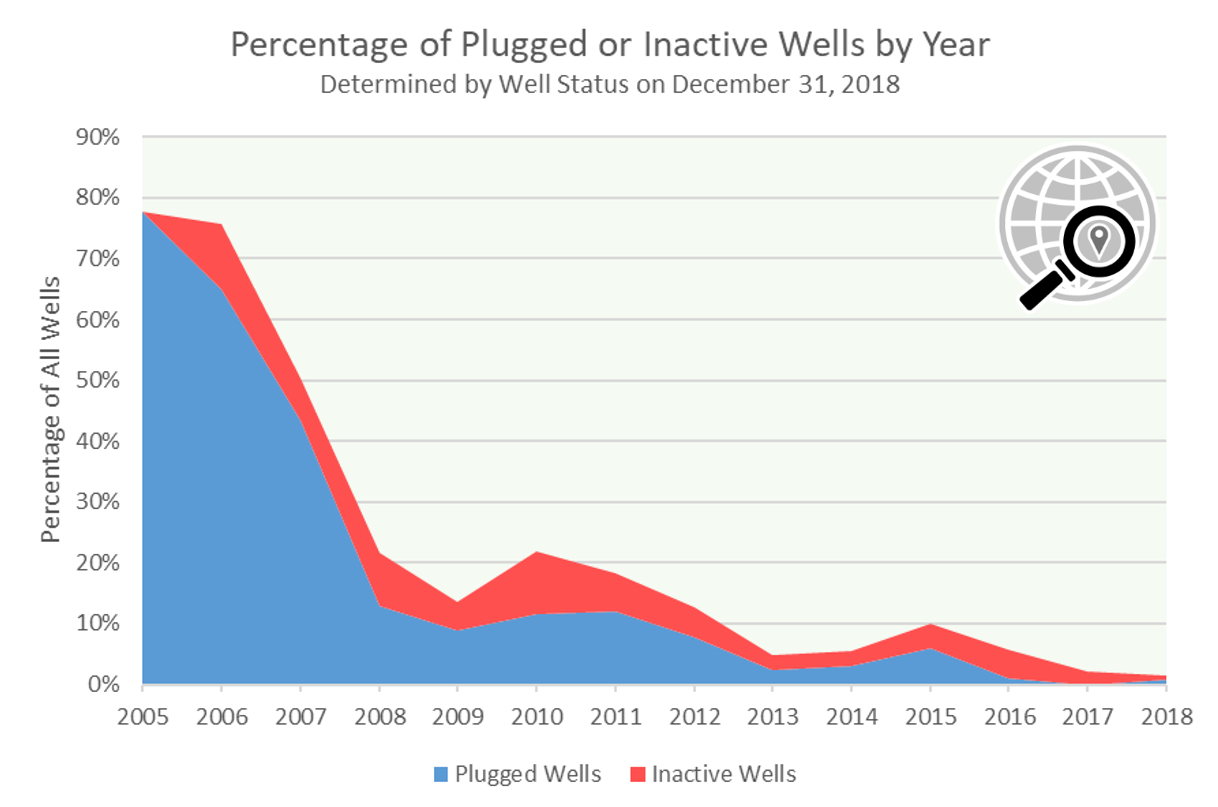
Figure 2: This chart shows the percentage of unconventional wells drilled since 2005 with a plugged or regulatory inactive status as of December 31, 2018.
In order to understand some of the finer points, it’s best to use Figure 1 (above) in conjunction with Figure 2. We can see that most of the wells drilled in the initial years of the Marcellus boom have already been plugged, although Figure 1 shows us that the sample size is fairly low for these years. In 2005, for example, 7 of the 9 (78%) unconventional wells drilled in the state that year are already plugged. The following year, 24 of the 37 (65%) wells drilled are now plugged, and an additional 4 (11%) wells have a regulatory inactive status as of the end of 2018. The following year, the combined plugged and inactive wells account for just over 50% of the 113 wells drilled that year, and this trend continues along a fairly predictable curve. An exception is the noticeable bump around the most active drilling years of 2010 and 2011, where there are slightly more wells with a plugged or inactive status than might be expected. It is interesting to note that even the most recent wells are not immune to being plugged, including 8 plugged wells and 4 inactive wells drilled in 2018 that were not able to get past their very first year in production.
Overall, of the 11,675 drilled wells accounted for on this graphic, 851 (7%) are plugged already, with an additional 572 (5%) of wells with an inactive status. Unconventional wells that are 11 years old have a roughly 50% chance of being plugged or inactive, and we would therefore expect to see the number of these wells skyrocket in the coming years before leveling off, roughly mirroring the drilling boom and subsequent slowdown of Marcellus Shale extraction in Pennsylvania.
Conclusions
Many factors contribute to fluctuations in drilling trends for the Marcellus Shale and other unconventional wells in Pennsylvania. Very cold winters result in high consumption by residential and commercial users. New gas-fired power plants can increase the demand for additional drilling. Recessions and economic conditions are known to reduce the demand for energy as well, and drillers’ heavy debt burdens can slow down operations appreciably. Additionally, other fossil fuel and renewable energy sources compete with one another, altering the market conditions even further. And finally, every oil and gas play eventually reaches a point where the expected results from new wells are not worth the money required to get the hydrocarbons to the surface, and unconventional wells are much more expensive to develop than more traditional operations.
Because of all of these variables, month to month or even year to year fluctuations are not necessarily that telling. On the other hand, a four-year period where drilling is roughly half of previous extraction is significant, and can’t be easily dismissed as a blip in the data.
By Matt Kelso, Manager of Data and Technology, FracTracker Alliance
Pittsburgh, PA – Yesterday, the Pennsylvania Department of Environmental Protection (DEP) announced their decision to issue a permit for the construction of Shell’s Falcon ethane pipeline project in southwest PA. FracTracker Alliance is extremely disappointed that DEP is allowing this project to proceed despite heavy opposition from the public and unaddressed concerns for the safety and well-being of nearby residents and the surrounding environment.
The past year has seen countless issues from the construction of new pipelines in the Commonwealth – from hundreds of “inadvertent returns,” (spills of bentonite drilling mud) along the path of the Mariner East II project to the catastrophic explosion of the week-old Revolution Pipeline in Beaver County. These reoccurring and serious incidents make it clear that oil and gas midstream companies are rushing to put infrastructure in place, and DEP and other regulatory agencies have been failing in their mission to adequately supervise the process.
According to data from the US Pipeline and Hazardous Materials Safety Administration, there were 108 pipeline incidents in Pennsylvania between January 2010 and mid-July 2018, resulting in 8 fatalities, 15 injuries, requiring over 1,100 people to be evacuated from their homes, and causing more than $66 million in property damage. This track record, which does not include the Revolution Pipeline explosion in September of 2018, is frankly unacceptable.
Certainly, the Commonwealth has invested heavily in the Shell Ethane Cracker facility, offering steep tax subsidies and even paying the global petrochemical giant $2.10 for every barrel of ethane it consumes from Pennsylvania wells, equivalent to $1.6 billion over the next 25 years. It appears to FracTracker that these business arrangements have made the continued extraction and exploitation of hydrocarbons the priority for DEP, not protecting the environment and health and safety of Pennsylvanians, as the mission of the Department suggests is their focus. DEP’s decision also traces an unfortunate pattern of opaqueness and poor timing by announcing unpopular decisions right before the holidays.
Fundamentally, oil and gas companies like Shell exist to make profits, and will therefore make decisions to maximize earnings and limit their costs, if left to their own devices. This approach is often directly at odds with public safety, so Pennsylvania entrusts DEP to oversee the operations. FracTracker feels that with their decision to move forward with the project on December 20, 2018, DEP brushed over dozens of substantial concerns regarding the Falcon ethane pipeline project, and therefore failed in this mission. We remain unconvinced that the “appropriate construction techniques and special conditions” required by DEP will adequately protect the environment and health and safety of residents along the Falcon pipeline route.
Dec. 21st Update: After this article was written, FracTracker learned that Ohio’s EPA issued an air quality permit for the cracker plant in Belmont County, Ohio on December 21st. The short public comment period and the rush to issue permits again illustrates that significant public health and environmental concerns are given minimal importance versus corporate wishes and political expediency. The regulatory paradigm is broken. The public has been ill served by the agencies entrusted to safeguard their interests. A collective regional voice should be raised in protest.
Started in 2010 as a southwestern Pennsylvania area website, FracTracker Alliance is now a national organization with regional offices across the United States in Pennsylvania, Washington DC, New York, Ohio, and California. The organization’s mission is to study, map, and communicate the risks of oil and gas development to protect our planet and support the renewable energy transformation. Its goal is to support advocacy groups at the local, regional and national level, informing their actions to positively shape our nation’s energy future. www.fractracker.org
Learn more about FracTracker’s coverage of the Falcon ethane pipeline project by exploring the posts below:
Last month, the Department of Energy (DOE) submitted a report titled Ethane Storage and Distribution Hub in the United States to Congress. The report sums up several other recent geologic studies and economic analyses that evaluate the potential to create a large petrochemical hub in southwest Pennsylvania, Ohio, West Virginia, and northeastern Kentucky.
Most people call this region Appalachia because of the mountains, or the Ohio River Valley because of the namesake river. The petrochemical industry looks deeper: they’ve branded it Shale Crescent USA, after the shale gas thousands of feet underground. This article summarizes recent developments on storing natural gas liquids, including ethane, in this region – whatever you prefer to call it.
Background
The United States currently produces more natural gas than any other country in the world, with much of the fracked gas coming from the Marcellus and Utica shales in Appalachia. The DOE report predicts that production in this region will continue growing from an estimated at 8.19 trillion cubic feet (Tcf) in 2017, to 13.55 Tcf in 2025 and 19.5 Tcf in 2050.
Natural Gas Production Estimates:
8.19 Tcf in 2017
13.55 Tcf in 2025
19.5 Tcf in 2050
In addition to oil and gas, fracking produces natural gas liquids (NGLs), such as ethane, propane, and butane. NGLs are a key component of the petrochemical industry, which takes these resources and converts them into plastics and resins. As industry extracts more natural gas, it will also be left with more NGLs to manage.
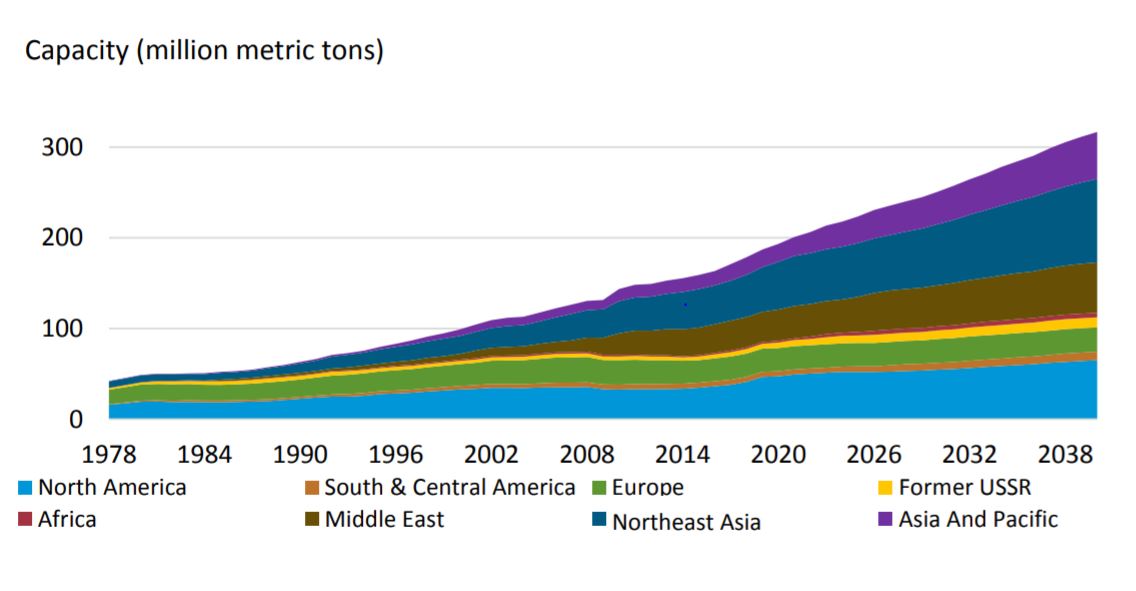
Hoping to profit off NGLs, the oil and gas industry is investing in petrochemical production. In the Appalachian basin, the DOE predicts that production of ethylene from ethane will reach 640,000 barrels a day by 2025 (this is 20 times the amount the region produced in 2013). The Gulf Coast of the U.S., as well as countries in Asia and the Middle East, are also growing their production capacities. Globally, ethylene production is projected to grow 31% from 2017 to 2025.
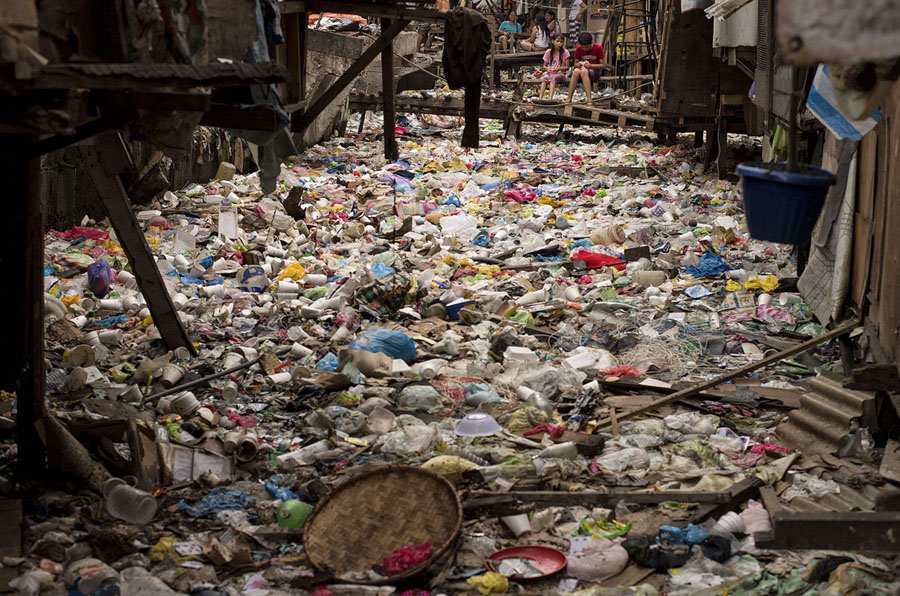
The rise of the petrochemical industry comes at a point when there’s an increasing global awareness of the disaster that is plastic pollution. As much as 12.7 million tons of plastic waste goes into the ocean each year, affecting over 700 species of marine animals. On land, plastic waste is often shipped to less developed nations, where it ends up polluting poor communities and contaminating their drinking water and air.
Nevertheless, politicians in PA, OH, and WV are working hard to attract petrochemical build-out in Appalachia. The region already houses much of the infrastructure needed for a petrochemical hub, such as fracked wells that pump out NGLs and processing plants to separate these liquids from the rest of the natural gas stream. One thing it’s missing, however, is significant capacity to store natural gas liquids – particularly ethane.
Why does industry need storage?
Ethane storage offers several benefits to the petrochemical industry. For one, it would serve as a steady supply of ethane for plants like ethane crackers, which “crack” ethane into ethylene to make polyethylene plastic. With this constant supply (transported to crackers via pipeline), plants can operate 24 hours a day, year round, and avoid using energy to shutdown and restart. Storage also allows industry to adapt to fluctuations in demand and price.
Another argument for expanding petrochemical activity in Appalachia is to diversify the industry’s geography. The current petrochemical hub in Texas and Louisiana (where over 95% of the country’s ethylene production takes place) is subject to extreme weather events. In 2017, Hurricane Harvey caused over half of the nation’s polyethylene production capacity to shut down. The report mentions “extreme weather events” multiple times as justification for building a petrochemical hub in Appalachia. This stance strongly suggests that the DOE is preparing for increased hurricanes and flooding from climate change, although this is never explicitly stated. Unsurprisingly, the industry’s role in causing climate change is left out from the report as well.
What does storage look like?
While the term ‘natural gas liquid’ may seem like an oxymoron, it refers to the different forms the substances take depending on temperature and pressure. At normal conditions, NGLs are a gas, but when pressurized or exposed to extremely cold temperatures, they act as a liquid. NGLs occupy significantly less space as a liquid, and are therefore moved and stored as a pressurized or refrigerated liquid.
Storage can be in above ground tanks, but is often underground in gas fields or underground caverns. NGLs are highly volatile, and storing them above ground puts workers and surrounding communities at risk. For example – last week, an above ground storage tank exploded at a natural gas processing plant in Washington County, PA, sending four people to the hospital. While underground storage is perceived as “safer,” it still poses significant risks, particularly in a geography like Appalachia full of wells, coal mines, and pipelines. This underground infrastructure can cause NGLs to leak during storage or the land above them to collapse.
A study out of West Virginia University, titled “A Geologic Study to Determine the Potential to Create an Appalachian Storage Hub For Natural Gas Liquids,” identified three different types of storage opportunities along the Ohio and Kanawha river valleys:
Underground storage options
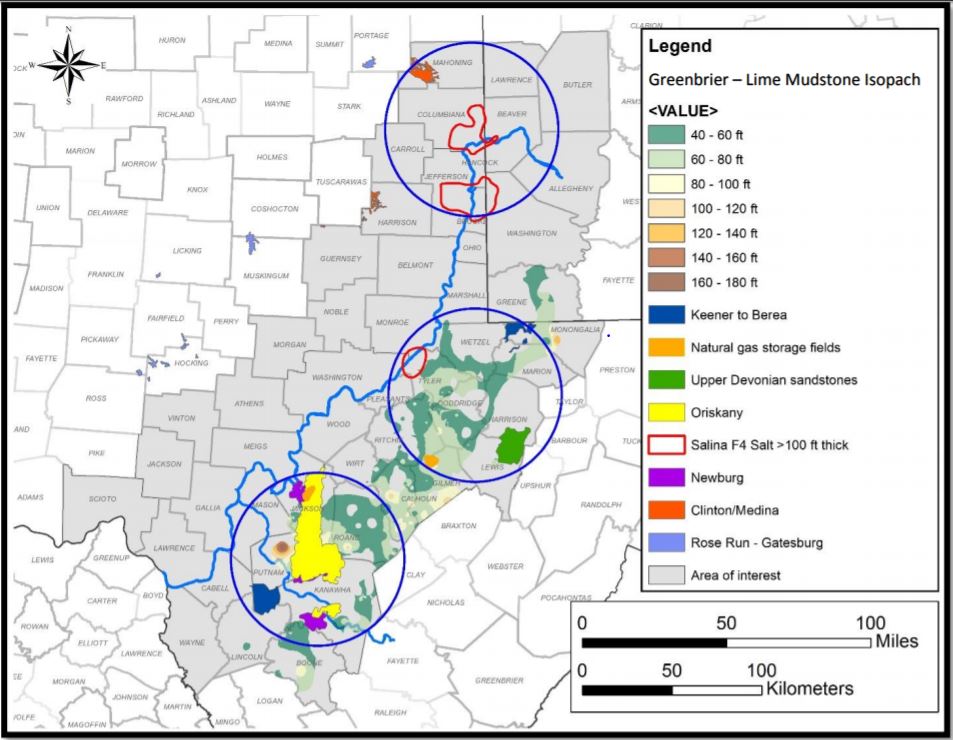
Mined-rock cavern: Companies can mine caverns in formations of limestone, dolomite, or sandstone. The formation must be at least 40 feet thick to hold NGLs. This study focused on formations of the Greenbrier Limestone, which occurs throughout southwestern Pennsylvania, West Virginia, and Kentucky.
Salt cavern: Developing salt caverns involves injecting water underground to create a void, and then pumping NGLs into the cavern. Suitable salt caverns have “walls” at least 100 feet thick above and below the cavern. The study recommended salt caverns 1,500 to 3,000 feet deep, but considered those as deep as 6,700 feet.
Gas field: NGLs can also be stored in natural gas fields or depleted gas fields in underground sandstone reservoirs. Suitable gas fields are 2,000 feet deep or more according to the WVU study.
Where could storage sites be located?
The West Virginia University study identified and ranked thousands of gas fields, several salt caverns, and many regions in the Greenbrier Limestone that could serve as NGL storage. Most of the top-ranked opportunities are in West Virginia, near the state’s borders with Ohio and Pennsylvania, and several cross beneath the Ohio or Kanawha rivers. The researchers conclude with three “prospects,” which are circled in Figure 1.
The table below lists the specific storage opportunities in each prospect, as well as the available data on depth, thickness, and acreage of the formations. Also listed are the counties that the storage facility would cross into.
Northern Prospect
Name
Type
Depth (feet)
Thickness (feet)
Counties
Land Size (acres)
Salina F4 Salt cavern
Salt cavern
–
>100 to 150
Primarily Columbiana, OH, also Hancock, WV & Beaver, PA
83,775
Salina F4 salt cavern
Salt cavern
–
100 to 150
Primarily Jefferson, OH, also Brooke & Hancock WV, & Washington, PA
2 possibilities for a cavern- one in northern Putnam & Roane WV, the other in Kanawha & Boone, WV
> 530,000 and >170,000
Burdett-St. Albans Field
Depleted gas field
1,824 to 2,510
4 to 27
Primarily Putnam, also Lincoln & Kanawha, WV
50,000
The Elk-Poca (Sissonville) Field
Depleted gas field
4,140 to 5,497
14
Putnam, Jackson, Kanawha, WV
245,000
Campbell Creek Field
Depleted gas field
4,825
15
Kanawha, WV
21,000
Ripley Field
Existing natural gas storage
4,660 to 5,012
15 to 56
Jackson, WV
>9000
North Ripley Field
Depleted gas field
5,379
77
Jackson, WV
19,000
Rocky Fork
Depleted gas field
5,623
140
Kanawha, Putnam ,WV
42,000
Cooper Creek
Depleted gas field
5,754
30
Kanawha, WV
8,600
Kanawha Forest
Depleted gas field
5,378
48
Kanawha, Boone, WV
28,000
Existing NGL Storage
Storage in the United States
The U.S. has two major NGL storage hubs (both in salt caverns): One is in Mont Belvieu, Texas and the other in Conway, Kansas. These facilities are strategically located near the petrochemical industry’s hub along the Gulf Coast. There is also underground storage in Sarnia, Ontario.
Industry in Appalachia is connected to these storage facilities via pipelines, including Sunoco’s Mariner West that transports ethane to Sarnia, and the Appalachia-Texas-Express (ATEX) pipeline that takes ethane to Mont Belvieu. However, as suggested above, NGL storage in Appalachia is also under development.
Appalachia Storage & Trading Hub
Appalachia Development Group LLC is heading the development of the Appalachia Storage & Trading Hub initiative. The company has not announced the specific location for underground storage, but has been working hard to secure the funds for this development.
In September of 2017, Appalachia Development Group submitted part 1 of a 2-part application for a $1.9 billion loan to the US DOE Loan Program Office. The DOE approved the application the following January, inviting the company to submit the second part, which is currently pending. This second part goes through the DOE’s Title XVII innovative clean energy projects loan program.
According to the DOE, this program “provides loan guarantees to accelerate the deployment of innovative clean energy technology.” Paradoxically, this means the DOE may give clean energy funds to the petrochemical industry, which is fueled by fossil fuels and does not provide energy but rather plastic and resins.
Steven Hedrick, the CEO of Appalachia Development Group, was part of a West Virginia trade delegation that traveled to China in 2017 to meet with China’s largest energy company. This meeting, which included President Trump and China’s President Xi Jinping, resulted in China Energy agreeing to invest $83.7 billion to support natural gas and petrochemical development in West Virginia. (Of note: This agreement has faced uncertainty following Trump’s tariffs on Chinese goods). West Virginia Governor Jim Justice later criticized Hedrick’s involvement in the meeting, where he promoted the interests of his private company.
Mountaineer NGL Storage Project
Another company, Energy Storage Ventures LLC, has plans to construct NGL storage near Clarington, Ohio. This facility would be on land formerly belonging to Quarto Mining Company’s Powhatan Mine No. 4. Called “Mountaineer NGL Storage,” the project would develop salt caverns to store propane, ethane, and butane. Each cavern could store 500,000 barrels (21 million gallons) of NGLs.
The video below, made by the Energy Storage Ventures, describes the process of developing salt caverns for storage.
The Mountaineer NGL Storage Project location is about 12 miles south of the PTTGC ethane cracker (if built), in Dilles Bottom Ohio. It’s also roughly 60 miles south of the Shell ethane cracker (under construction) in Potter Township, PA. If developed, the project could supply these plants with ethane and allow them to continuously operate. According to Energy Storage Ventures President, David Hooker, the project would also trigger $500 million in new pipelines in the region and $1 billion in fractionation facilities to separate NGLs.
Energy Storage Ventures wants to build three pipelines beneath the Ohio River. Two pipelines (one for ethane and one for propane and butane) would deliver NGLs to the storage site from Blue Racer Natrium, a fractionation plant that separates dry natural gas from NGLs. A third pipeline would take salt brine water from the caverns to the Marshall County chlorine plant (currently owned by Westlake Chemical Corp). These facilities, as well as the locations of the two ethane crackers storage could serve, are in the map below. This map also includes the potential storage opportunities the researchers at West Virginia University identified.
Referring to concerns about building pipelines and caverns near the Ohio River, a drinking water source for 5 million people, the company’s president David Hooker stated, “This is not rocket science. These things have operated safely for years… Salt, at depth, is impermeable. You won’t see any migration out of the salt.”
This video is a rendering of what the 200-acre site will look like, including the salt water impoundment structure (capable of holding 3.25 million barrels), and the infrastructure needed to deliver products and equipment by rail and truck:
The company has stated that it owns both the land and mineral rights it needs to develop the caverns, but the project has also faced delays.
Where is this plastic going?
One common argument for a petrochemical hub in Appalachia is the region’s proximity to the downstream sector of petrochemical industry. Manufacturers such as PPG Industries, Dow Chemical Inc., and BASF are all based in the area and could make use of the feedstock from an Appalachian hub.
However, the report doesn’t make it clear where the plastic and resin end products will land. It does state that the demand in the United States isn’t enough to swallow up two major petrochemical hubs worth of plastic.
Export markets
The DOE report states that, “the development of new petrochemical capacity in Appalachia is not necessarily in conflict with Gulf Coast expansion.” Since the Gulf Coast already has the infrastructure for export, it could focus on international markets while Appalachia meets domestic demand. Alternatively, the Appalachian hub could serve European destinations while the Gulf Coast hub delivers to Pacific Basin and South American destinations. Plastic consumption is highly correlated with population, so countries with large, growing populations such as India and China are likely markets.
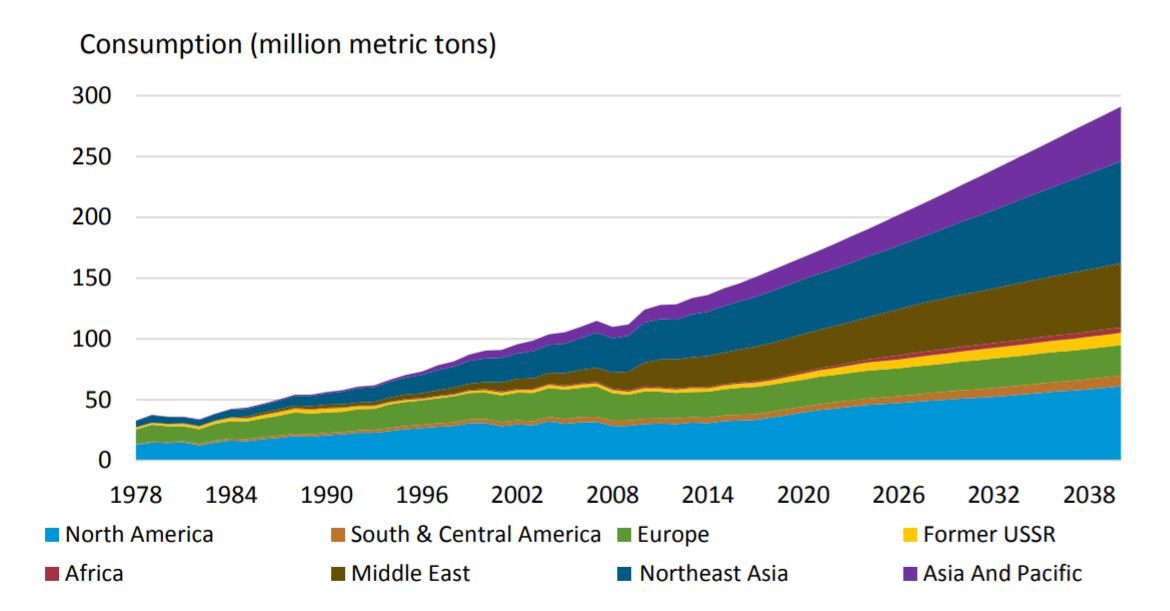
It’s important to note that the U.S. isn’t the only country increasing its production of petrochemical derivatives, and as the report notes, exports from the US “may face a challenge from global capacity surplus.” Figure 2 shows that global production of ethylene is expected to surpass global consumption, shown in Figure 3. The graph of consumption likely ignores the impact of plastic-reducing policies that hundreds of countries and cities are implementing. As such, it may be an over-estimation.
Figure 2. Historical and future ethylene production by global region. Source
Figure 3. Ethylene consumption by global region. Source
In the end, it appears that the industry’s plan is to build first, and worry about markets later, hoping that a growing supply of affordable plastic will increase consumption.
Perhaps the reason industry is so eager to forge a market is because oil and gas is struggling with a lot of debt. A study out of the Sightline Institute found that as of the first half of 2018, “US fracking-focused oil and gas companies continued their eight-year cash flow losing streak.” The Center for International Environmental Law found that petrochemicals generally have a larger profit margin than oil and gas: “In 2015, ExxonMobil’s Chemicals segment accounted for roughly 10% of its revenues but more than 25% of its overall profits.”
Plastic is one way to subsidize this dying industry…
Beyond Storing Natural Gas Liquids
The motive behind developing storage is to catalyze and support a major industry. The DOE report states that the new infrastructure required “would include gathering lines, processing plants, fractionation facilities, NGLs storage facilities, ethane crackers, and then…plants for polyethylene, ethylene dichloride, ethylene oxide, and other infrastructure.” A hub would require more fracking and wastewater injection wells, cause even more heavy truck traffic that adds stress to roadways, and require additional power plant capacity to serve its electricity demand.
In other words, an Appalachian petrochemical hub would profoundly impact the region. The report contains an in-depth analysis of the economic impacts, but fails to mention any environmental concerns, social impacts on communities, or health effects. The other major studies on this buildout, mentioned above, follow a similar pattern.
A quick look at industry along the Gulf Coast tells you that environmental, social, and health concerns are very real and produce their own economic debts. The petrochemical industry has created a “cancer alley” in Texas and Louisiana, disproportionately impacting low-income and minority communities. Yet, industry is preparing another hub without a single comprehensive environmental impact assessment or health assessment for the region. As each pipeline, fracked well, and plant is permitted separately, we can’t properly assess the cumulative negative impacts this development will have on our waterways, forests, soil, or air quality. Therefore, we also won’t know how it will affect our health.
Looking into the future
The report analyzes the industry through 2050. It states that NGL output in Appalachia:
… will continue to grow throughout the forecast period. As natural gas production gradually migrates away from liquids-rich gas areas, which are expected to slowly deplete, to dryer areas, the rate of growth in NGPL production will slow relative to the rate of natural gas production growth.
In 31 years, the kids growing up in Appalachia right now could be left with brownfields, dried-up wells, and abandoned ethane crackers. But it doesn’t have to be this way. Last year, the DOE reported that there are more jobs in clean energy, energy efficiency, and alternative vehicles than in fossil fuels. By using funds such as the DOE’s Title XVII innovative clean energy loan – for actual clean energy – we can bring economic development to the region that will be relevant past 2050 and that won’t sacrifice our health and natural resources for short-term private gains.
By Erica Jackson, Community Outreach and Communications Specialist
https://www.fractracker.org/a5ej20sjfwe/wp-content/uploads/2018/12/Appalachian-Storage-Feature.jpg400900Erica Jacksonhttps://www.fractracker.org/a5ej20sjfwe/wp-content/uploads/2025/09/2025-Wordmark-Logo.pngErica Jackson2018-12-19 12:31:022025-01-14 15:37:24Storing Natural Gas Liquids in Appalachia
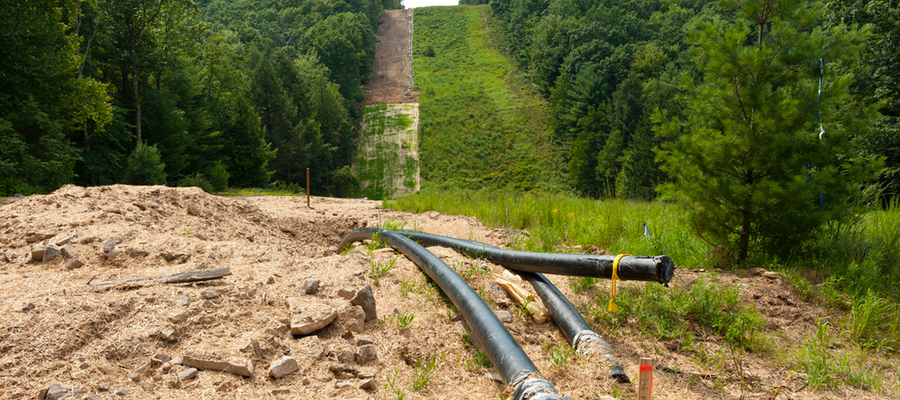
Pipelines play a major role in the oil and gas extraction industry, allowing for the transport of hydrocarbons from well sites to a variety of infrastructure, including processing plants, petrochemical facilities, power generation plants, and ultimately consumers. There are more than 2.7 million miles of natural gas and hazardous liquid pipelines in the United States, or more than 11 times the distance from Earth to the moon.
With all of this infrastructure in place, pipelines are inevitably routed close to homes, schools, and other culturally or ecologically important locations. But how safe are pipelines, really? While they are typically buried underground and out of sight, many residents are concerned about the constant passage of volatile materials through these pipes in close proximity to these areas, with persistent but often unstated possibility that something might go wrong some day.
Safety talking points
In an attempt to assuage these fears, industry representatives and regulators tend to throw around variants of the word “safe” quite a bit:
Pipelines are the safest and most reliable means of transporting the nation’s energy products.
— Keith Coyle, Marcellus Shale Coalition
Although pipelines exist in all fifty states, most of us are unaware that this vast network even exists. This is due to the strong safety record of pipelines and the fact that most of them are located underground. Installing pipelines underground protects them from damage and helps protect our communities as well.
— Pipeline and Hazardous Materials Safety Administration (PHMSA)
Pipelines are an extremely safe way to transport energy across the country.
— Pipeline 101
Knowing how important pipelines are to everyday living is a big reason why we as pipeline operators strive to keep them safe. Pipelines themselves are one of the safest ways to transport energy with a barrel of crude oil or petroleum product reaching its destination safely by pipeline 99.999% of the time.
— American Petroleum Institute
But are pipelines really safe?
Given these talking points, the general public can be excused for being under the impression that pipelines are no big deal. However, PHMSA keeps records on pipeline incidents in the US, and the cumulative impact of these events is staggering. These incidents are broken into three separate reports:
Gas Distribution (lines that take gas to residents and other consumers),
Gas Transmission & Gathering (collectively bringing gas from well sites to processing facilities and distant markets), and
Hazardous Liquids (including crude oil, refined petroleum products, and natural gas liquids).
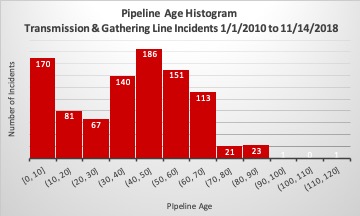
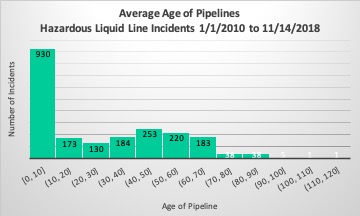
Below in Table 1 is a summary of pipeline incident data from 2010 through mid-November of this year. Of note: Some details from recent events are still pending, and are therefore not yet reflected in these reports.
Table 1: Summary of pipeline incidents from 1/1/2010 through 11/14/2018
Report
Incidents
Injuries
Fatalities
Evacuees
Fires
Explosions
Damages ($)
Gas Distribution
934
473
92
18,467
576
226
381,705,567
Gas Transmission & Gathering
1,069
99
24
8,614
121
51
1,107,988,837
Hazardous Liquids
3,509
24
10
2,471
111
14
2,606,014,109
Totals
5,512
596
126
29,552
808
291
4,095,708,513
Based on this data, on average each day in the US 1.7 pipeline incidents are reported (a number in line with our previous analyses), requiring 9 people to be evacuated, and causing almost $1.3 million in property damage. A pipeline catches fire every 4 days and results in an explosion every 11 days. These incidents result in an injury every 5 days, on average, and a fatality every 26 days.
Data shortcomings
While the PHMSA datasets are extremely thorough, they do have some limitations. Unfortunately, in some cases, these limitations tend to minimize our understanding of the true impacts. A notable recent example is a series of explosions and fires on September 13, 2018 in the towns of Lawrence, Andover, and North Andover, in the Merrimack Valley region of Massachusetts. Cumulatively, these incidents resulted in the death of a young man and the injuries to 25 other people. There were 60-80 structure fires, according to early reports, as gas distribution lines became over-pressurized.
The preliminary PHMSA report lists all of these Massachusetts fires as a single event, so it is counted as one fire and one explosion in Table 1. As of the November 14 download of the data, property damage has not been calculated, and is listed as $0. The number of evacuees in the report also stands at zero. This serves as a reminder that analysis of the oil and gas industry can only be as good as the available data, and relying on operators to accurately self-report the full extent of the impacts is a somewhat dubious practice.
This map shows pipeline incidents in the US from 1/1/2010 through 11/14/2018. Source: PHMSA. One record without coordinates was discarded, and 10 records had missing decimal points or negative (-) signs added to the longitude values. A few obvious errors remain, such as a 2012 incident near Winnipeg that should be in Texas, but we are not in a position to guess at the correct latitude and longitude values for each of the 5,512 incidents.
Another recent incident occurred in Center Township, a small community in Beaver County, Pennsylvania near Aliquippa on September 10, 2018. According to the PHMSA Gas Transmission & Gathering report, this incident on the brand new Revolution gathering line caused over $7 million in damage, destroying a house and multiple vehicles, and required 49 people to evacuate. The incident was indicated as a fire, but not an explosion. However, reporting by local media station WPXI quoted this description from a neighbor:
A major explosion, I thought it was a plane crash honestly. My wife and I jumped out of bed and it was just like a light. It looked like daylight. It was a ball of flame like I’ve never seen before.
From the standpoint of the data, this error is not particularly egregious. On the other hand, it does serve to falsely represent the overall safety of the system, at least if we consider explosions to be more hazardous than fires.
Big picture findings
Comparing the three reports against one another, we can see that the majority of incidents (64%) and damages (also 64%) are caused by hazardous liquids pipelines, even though the liquids account for less than 8% of the total mileage of the network. In all of the other categories, however, gas distribution lines account for more than half of the cumulative damage, including injuries (79%), deaths (73%), evacuees (62%), fires (71%), and explosions (78%). This is perhaps due to the vast network (more than 2.2 million miles) of gas distribution mains and service lines, as well as their nature of taking these hazardous products directly into populated areas. Comparatively, transmission and hazardous liquids lines ostensibly attempt to avoid those locations.
Is the age of the pipeline a factor in incidents?
Among the available attributes in the incident datasets is a field indicating the year the pipeline was installed. While this data point is not always completed, there is enough of a sample size to look for trends in the data. We determined the age of the pipe by subtracting the year the pipe was installed from the year of the incident, eliminating nonsensical values that were created when the pipeline age was not provided. In the following section, we will look at two tables for each of the three reports. The first table shows the cause of the failure compared to the average age, and the second breaks down results by the content that the pipe was carrying. We’ll also include a histogram of the pipe age, so we can get a sense of how representative the average age actually is within the sample.
A. Gas distribution
Each table shows some fluctuation in the average age of pipeline incidents depending on other variables, although the variation in the product contained in the pipe (Table 3) are minor, and may be due to relatively small sample sizes in some of the categories. When examining the nature of the failure in relation to the age of the pipe (Table 2), it does make sense that incidents involving corrosion would be more likely to afflict older pipelines, (although again, the number of incidents in this category is relatively small). On average, distribution pipeline incidents occur on pipes that are 33 years old.
When we look at the histogram (Figure 1) for the overall distribution of the age of the pipeline, we see that those in the first bin, representing routes under 10 years of age, are actually the most frequent. In fact, the overall trend, excepting those in the 40 t0 50 year old bin, is that the older the pipeline, the fewer the number of incidents. This may reflect the massive scale of pipeline construction in recent decades, or perhaps pipeline safety protocol has regressed over time.
Age of Pipeline - Histogram
Figure 1. Age of pipeline histogram for gas distribution line incidents between 1/1/2010 and 11/14/2018. Incidents where the age of the pipe is unknown are excluded.
Age/Cause of Incidents - Table 2
Table 2. Average age of pipe and cause for failure in gas distribution line incidents
Cause of Failure
Incidents – Total
Incidents – Pipe Age Known
Avg. Pipe Age
Corrosion Failure
18
15
53
Equipment Failure
47
41
30
Excavation Damage
271
239
32
Incorrect Operation
62
51
34
Material Failure Of Pipe Or Weld
63
56
40
Natural Force Damage
72
61
42
Other Incident Cause
96
53
41
Other Outside Force Damage
305
227
28
Grand Total
934
743
33
Age/Product Transported - Table 3
Table 3. Average age of pipe and material being transported in gas distribution lines
Product
Incidents – Total
Incidents – Pipe Age Known
Ave. Pipe Age
Natural Gas
862
706
34
Other Gas
3
Propane Gas
11
7
25
Synthetic Gas
1
1
38
(Blank)
57
29
27
Grand Total
934
743
33
B. Gas Transmission & Gathering
Transmission & Gathering line incidents occur on pipelines routes that are, on average, five years older than their distribution counterparts. Corrosion, natural force damage, and material failures on pipes and welds occur on pipelines with an average age above the overall mean, while excavation and “other outside force” incidents tend to occur on newer pipes (Table 4). The latter category would include things like being struck by vehicles, damaged in wildfires, or vandalism. The contents of the pipe does not seem to have any significant correlation with the age of the pipe when we take sample size into consideration (Table 5).
The histogram (Figure 2) for the age of pipes on transmission & gathering line incidents below shows a more normal distribution, with the noticeable exception of the first bin (0 to 10 years old) ranking second in frequency to the fifth bin (40 to 50 years old).
It is worth mentioning that, “PHMSA estimates that only about 5% of gas gathering pipelines are currently subject to PHMSA pipeline safety regulations.” My correspondence with the agency verified that the remainder is not factored into their pipeline mileage or incident reports in any fashion. Therefore, we should not consider the PHMSA data to completely represent the extent of the gathering line network or incidents that occur on those routes.
Age of Pipeline - Histogram
Figure 2. Age of pipeline histogram for transmission & gathering line incidents between 1/1/2010 and 11/14/2018. Incidents where the age of the pipe is unknown are excluded.
Age/Cause of Incidents - Table 4
Table 4. Average age of pipe and cause for failure in gas transmission & gathering line incidents
Cause of Failure
Incidents – Total
Incidents – Pipe Age Known
Ave. Pipe Age
Corrosion Failure
220
212
46
Equipment Failure
327
271
25
Excavation Damage
135
126
52
Incorrect Operation
59
52
26
Material Failure Of Pipe Or Weld
122
119
51
Natural Force Damage
82
76
32
Other Incident Cause
60
46
30
Other Outside Force Damage
64
52
40
Grand Total
1069
954
38
Age/Material Transported - Table 5
Table 5. Average age of pipe and material being transported in gas transmission & gathering lines
Product
Incidents – Total
Incidents – Pipe Age Known
Ave. Pipe Age
Hydrogen Gas
1
1
0
Landfill Gas
1
1
17
Natural Gas
1024
916
38
Other Gas
9
7
33
(Blank)
34
29
38
Grand Total
1069
954
38
C. Hazardous Liquids
The average incident on hazardous liquid lines occurs on pipelines that are 27 years old, which is 6 years younger than for distribution incidents, and 11 years younger than their transmission & gathering counterparts. This appears to be heavily skewed by the equipment failure and incorrect operation categories, both of which occur on pipes averaging 15 years old, and both with substantial numbers of incidents. On the other hand, excavation damage, corrosion, and material/weld failures tend to occur on pipes that are at least 40 years old (Table 6).
In terms of content, pipelines carrying carbon dioxide happen on pipes that average just 11 years old, although there are not enough of these incidents to account for the overall departure from the other two datasets (Table 7).
The overall shape of the histogram (Figure 3) is similar to that of transmission & gathering line incidents, except that the first bin (0 to 10 years old) is by far the most frequent, with more than 3 and a half times as many incidents as the next closest bin (4o to 50 years old). Operators of new hazardous liquid routes are failing at an alarming rate. In descending order, these incidents are blamed on equipment failure (61%), incorrect operation (21%), and corrosion (7%), followed by smaller amounts in other categories. The data indicate that pipelines installed in previous decades were not subject to this degree of failure.
Age of Pipeline - Histogram
Figure 3. Age of pipeline histogram for hazardous liquid line incidents between 1/1/2010 and 11/14/2018. Incidents where the age of the pipe is unknown are excluded.
Age/Cause of Incidents - Table 6
Table 6. Average age of pipe and cause for failure in hazardous liquid line incidents
Cause of Failure
Incidents – Total
Incidents – Pipe Age Known
Avg. Pipe Age
Corrosion Failure
711
465
42
Equipment Failure
1589
879
15
Excavation Damage
126
102
46
Incorrect Operation
500
287
15
Material Failure Of Pipe Or Weld
249
207
41
Natural Force Damage
156
100
29
Other Incident Cause
108
63
33
Other Outside Force Damage
70
53
39
Grand Total
3509
2156
27
Age/Material Transported - Table 7
Table 7. Average age of pipe and material being transported in hazardous liquid lines
Product
Incidents – Total
Incidents – Pipe Age Known
Avg. Pipe Age
Biofuel / Ethanol Blends
4
2
30
CO2 (Carbon Dioxide)
50
40
11
Crude Oil
1764
1090
25
Highly Volatile Liquids*
546
383
23
Refined Petroleum Product
1145
641
32
Grand Total
3509
2156
27
* Highly volatile liquids are transported as liquids but would revert to a gaseous state in ambient conditions, including natural gas liquids like ethane, propane, and butane.
Conclusions
When evaluating quotes, like those listed above, that portray pipelines as a safe way of transporting hydrocarbons, it’s worth taking a closer look at what they are saying.
Are pipelines the safest way of transporting our nation’s energy products? This presupposes that our energy must be met with liquid or gaseous fossil fuels. Certainly, crude shipments by rail and other modes of transport are also concerning, but movements of solar panels and wind turbines are far less risky.
Does the industry have the “strong safety record” that PHMSA proclaims? Here, we have to grapple with the fact that the word “safety” is inherently subjective, and the agency’s own data could certainly argue that the industry is falling short of reasonable safety benchmarks.
And what about the claim that barrels of oil or petroleum products reach their destination “99.999% of the time? First, it’s worth noting that this claim excludes gas pipelines, which account for 92% of the pipelines, even before considering that PHMSA only has records on about 5% of gas gathering lines in their pipeline mileage calculations. But more to the point, while a 99.999% success rate sounds fantastic, in this context, it isn’t good enough, as this means that one barrel in every 100,000 will spill.
For example, the Dakota Access Pipeline has a daily capacity of 470,000 barrels per day (bpd). In an average year, we can expect 1,715 barrels (72,030 gallons) to fail to reach its destination, and indeed, there are numerous spills reported in the course of routine operation on the route. The 590,000 bpd Keystone pipeline leaked 9,700 barrels (407,400 gallons) late last year in South Dakota, or what we might expect from four and a half years of normal operation, given the o.001% failure rate. In all, PHMSA’s hazardous liquid report lists 712,763 barrels (29.9 million gallons) were unintentionally released, while an additional 328,074 barrels (13.8 million gallons) were intentionally released in this time period. Of this, 284,887 barrels (12 million gallons) were recovered, meaning 755,950 barrels (31.7 million gallons) were not.
Beyond that, we must wonder whether the recent spate of pipeline incidents in new routes is a trend that can be corrected. Between the three reports, 1,283 out of the 3,853 (32%) incidents occurred in pipelines that were 10 years old or younger (where the year the pipeline’s age is known). A large number of these incidents are unforced errors, due to poor quality equipment or operator error.
One wonders why regulators are allowing such shoddy workmanship to repeatedly occur on their watch.
By Matt Kelso, Manager of Data and Technology, FracTracker Alliance
In recent years, Pennsylvanians have had to endure numerous massive pipeline projects in the Commonwealth. Some of these, such as the Mariner East 2, the Revolution, and the Atlantic Sunrise, have been beset with continuous problems. In fact, both the Mariner East 2 and the Revolution projects had their operations suspended in 2018. The operators have struggled to grapple with a variety of issues – ranging from sinkholes near houses, erosion and sediment issues, hundreds ofbentonite spillsinto the waters and upland areas of Pennsylvania, and more.
Part of the reason for the recent spate of incidents is the fact that so many pipelines are being built right now. These lines are traversing through undermined areas and land known to have underground karst formations, which are prone to subsidence and sinkholes. With more than 90,000 miles of pipelines and 84,000 miles of streams in Pennsylvania, substantial erosion and runoff issues are unfortunately quite common.
Map of pipeline routes in southwestern PA, various pipeline incidents, and karst formations:
Click here to learn more about recent pipeline incidents in Pennsylvania, along with how users of the FracTracker App have helped to chronicle problems associated with them.
Residents keeping track
Many residents have been trying to document issues in their region of Pennsylvania for a long time. Any pipeline incident should be reported to the Department of Environmental Protection (DEP), but in some instances, people want other residents to know and see what is going on, and submission to DEP does not allow for that. FracTracker’s Mobile App allow users to submit a detailed report, including photographs, which are shared with the public. App users have submitted more than 50 photographs of pipelines in Pennsylvania, including these images below.
The FracTracker Mobile App uses crowd-sourced data to document and map a notoriously nontransparent industry. App users can also report violations, spills, or whatever they find striking. For example, the first image shows construction of the Mariner East 2 in extreme proximity to high density housing. While regulators did approve this construction, and it is therefore not a violation, the app user wanted others to see the impact to nearby residents. Other photos do show incidents, such as the second photo on the second row, showing the sinkhole that appeared along the Mariner East 1 during the construction of the nearby Mariner East 2 pipeline.
Please note that app submissions are not currently shared with DEP, so if you happen to submit an incident on our app that you think they should know about, please contact their office, as well. The FracTracker Mobile App provides latitude and longitude coordinates to make it easier for regulators to find the issue in question.
Why have there been so many problems with pipelines in recent years?
Drillers in Pennsylvania’s Marcellus Shale and other unconventional formations predicted that they would find a lot of natural gas, and they have been right about that. However, the large resulting supply of natural gas from this industrial-scaled drilling is more than the region can use. As a result, gas prices remain low, making drilling unprofitable in many cases, or keep profit margins very low in others.
The industry’s solution to this has been two-pronged. First, there is a massive effort underway to export the gas to other markets. Although there are already more than 2.5 million miles of natural gas pipelines in the United States, or more than 10 times the distance from the Earth to the Moon, it was apparently an insufficient network to achieve the desired outcome in commodity prices. The long list of recent and proposed pipeline projects, complete with information about their status, can be downloaded from the Energy Information Administration (Excel format).
The industry’s other grand effort is to create demand for natural gas liquids (NGLs, mostly ethane, propane, and butane) that accompanies the methane produced in the southwestern portion of the state. The centerpiece of this plan is the construction of multiple ethane crackers, such as the one currently being built in Beaver County by Royal Dutch Shell, for the creation of a new plastics industry in northern Appalachia. These sites will be massive consumers of NGLs which will have to be piped in through pressurized hazardous liquid routes, and would presumably serve to lock in production of unconventional gas in the region for decades to come.
Are regulators doing enough to help prevent these pipeline development problems?
In 2010, the Pipeline and Hazardous Materials Safety Administration (PHMSA) led the formation of an advisory group called Pipelines and Informed Planning Alliance (PIPA), comprised mostly of industry and various state and local officials. Appendix D of their report includes a long list of activities that should not occur in pipeline rights-of-way, from all-terrain vehicle use to orchards to water wells. These activities could impact the structural integrity of the pipeline or impede the operator’s ability to promptly respond to an incident and excavate the pipe.
However, we find this list to be decidedly one-directional. While the document states that these activities should be restricted in the vicinity of pipelines, it does not infer that pipelines shouldn’t be constructed where the activities already occur:
This table should not be interpreted as guidance for the construction of new pipelines amongst existing land uses as they may require different considerations or limitations. Managing land use activities is a challenge for all stakeholders. Land use activities can contribute to the occurrence of a transmission pipeline incident and expose those working or living near a transmission pipeline to harm should an incident occur.
Pipeline being constructed near a home
While we understand the need to be flexible, and we certainly agree that every measure should be taken by those engaging in the dozens of use types listed in the PIPA report, it equally makes sense for the midstream industry to take its own advice, and refrain from building pipelines where these other land uses are already in place, as well. If a carport is disallowed because, “Access for transmission pipeline maintenance, inspection, and repair activities preclude this use,” then what possible excuse can there be to building pipelines adjacent to homes?
What distance is far enough away to escape catastrophic failure in the event of a pipeline fire or blast?
This chart shows varying hazard distances from natural gas pipelines, based on the pipe’s diameter and pressure. Source: Mark J. Stephens, A Model for Sizing High Consequence Areas Associated with Natural Gas Pipelines
It turns out that it depends pretty dramatically on the diameter and pressure of the pipe, as well as the nature of the hydrocarbon being transported. A 2000 report estimates that it could be as little as a 150-foot radius for low-pressure 6-inch pipes carrying methane, whereas a 42-inch pipe at 1,400 pounds per square inch (psi) could be a threat to structures more than 1,000 feet away on either side of the pipeline. There is no way that the general public, or even local officials, could know the hazard zone for something so variable.
While contacting Pennsylvania One Call before any excavation is required, many people may not consider a large portion of the other use cases outlined in the PIPA document to be a risk, and therefore may not know to contact One Call. To that end, we think that hazard placards would be useful, not just at the placement of the pipeline itself, but along its calculated hazard zone, so that residents are aware of the underlying risks.
Valve spacing
If there is an incident, it is obviously critical for operators to be able to respond as quickly as possible. In most cases, a part of this process will be shutting off the flow at the nearest upstream valve, thereby stopping the flow of the hydrocarbons to the atmosphere in the case of a leak, and cutting the source of fuel in the event of a fire. Speed is only one factor in ameliorating the problem, however, with the spacing between shutoff valves being another important component.
Comprehensive datasets on pipeline valves are difficult to come by, but in FracTracker’s deep dive into the Falcon ethane pipeline project, which is proposed to supply the Shell ethane cracker facility under construction Beaver County, we see that there are 18 shutoff valves planned for the 97.5 mile route, or one per every 5.4 miles of pipe. We also know that the Falcon will operate at a maximum pressure of 1,440 psi, and has pipe diameters ranging from 10 to 16 inches. The amount of ethane that could escape is considerable, even if Shell were able to shut the flow off at the valve instantly. It stands to reason that more shutoff valves would serve to lessen the impact of releases or the severity of fires and explosions, by reducing the flow of fuel to impacted area.
Conclusion
Groups promoting the oil and gas industry like to speak of natural gas development as clean and safe, but unless we are comparing the industry to something else that is dirtier or more dangerous, these words are really just used to provoke an emotional response. Even governmental agencies like PHMSA are using the rhetoric.
PHMSA’s mission is to protect people and the environment by advancing the safe transportation of energy and other hazardous materials that are essential to our daily lives.
If the safe transportation of hazardous materials sounds oxymoronic, it should. Oil and gas, and related processed hydrocarbons, are inherently dangerous and polluting.
Report
Events
Fatalities
Injuries
Explosions
Evacuees
Total Damages
Gas Distribution
29
8
19
12
778
$6,769,061
Gas Transmission / Gathering
30
0
2
2
292
$51,048,027
Hazardous Liquids
49
0
0
1
48
$9,115,036
Grand Total
108
8
21
15
1,118
$66,932,124
Impacts of pipeline incidents in Pennsylvania from January 1, 2010 through July 13, 2018. National totals for the same time include 5,308 incidents resulting 125 fatalities, 550 injuries, 283 explosions, and nearly $4 billion in property damage.
Current investments in large-scale transmission pipelines and those facilitating massive petrochemical facilities like ethane crackers are designed to lock Pennsylvania into decades of exposure to this hazardous industry, which will not only adversely the environment and the people who live here, but keep us stuck on old technology. Innovations in renewable energy such as solar and wind will continue, and Pennsylvania’s impressive research and manufacturing capacity could make us well positioned to be a leader of that energy transformation. But Pennsylvania needs to make that decision, and cease being champions of an industry that is hurting us.