
A Community Sentinel’s leadership continues: Melissa Troutman since 2019
2019 Community Sentinel winner Melissa Troutman shares with FracTracker what she has been up to since winning the Sentinel award.
2019 Community Sentinel winner Melissa Troutman shares with FracTracker what she has been up to since winning the Sentinel award.
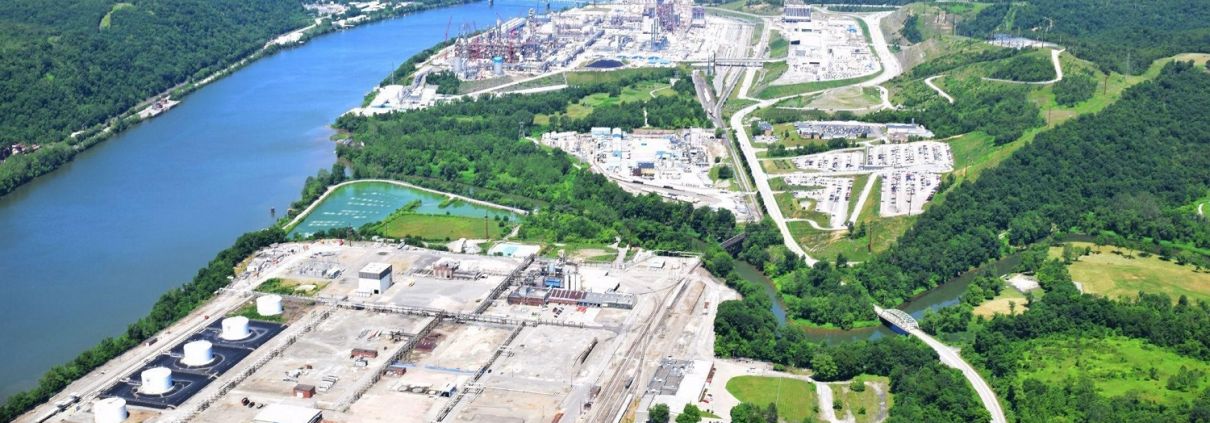
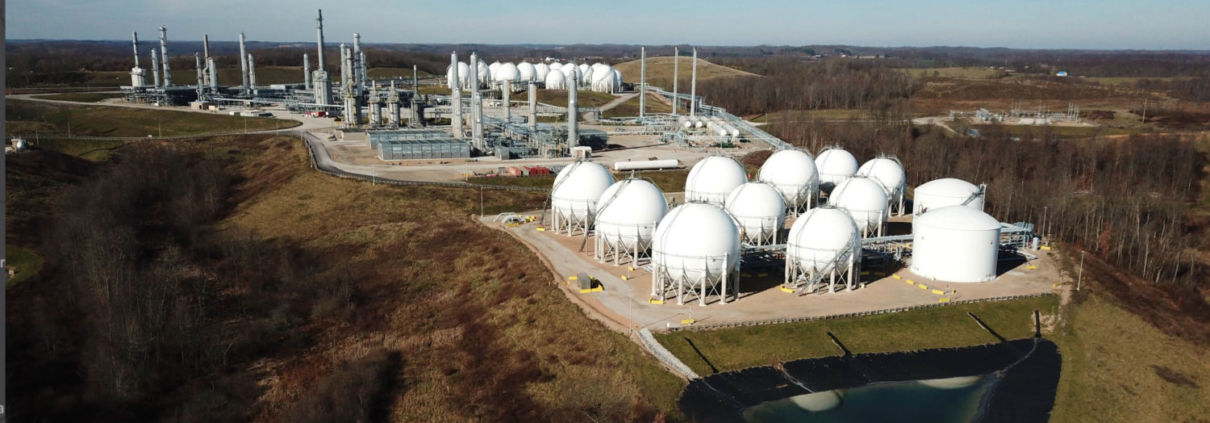
The petrochemical industry on the Ohio River regularly discharges wastewater into the river, toxic pollution harmful to public and environmental health.
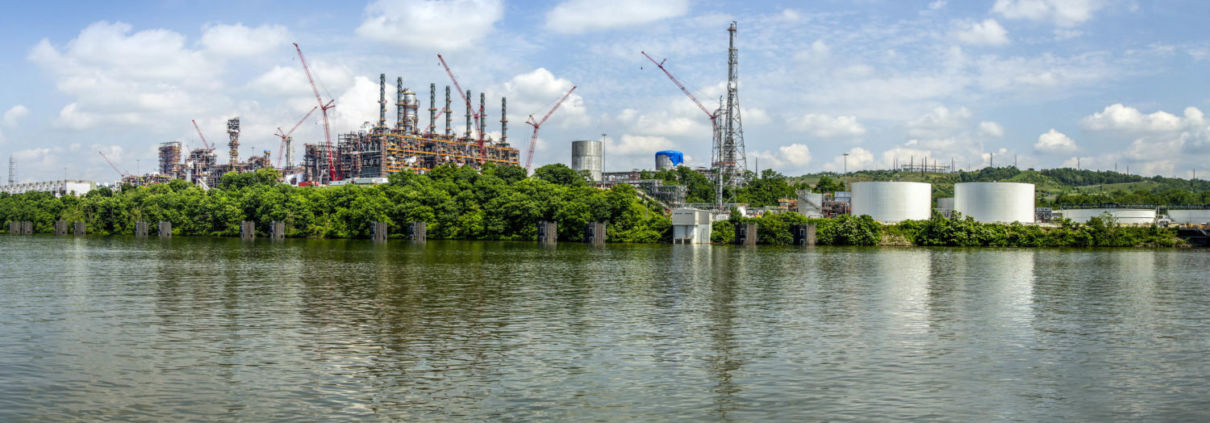
A look at the petrochemical industry’s footprint in the Ohio River Watershed and how much toxic pollution is discharged into waterways.
FracTracker received a letter from federal regulators with news on Shell’s Falcon Pipeline investigation, but many concerns still remain.
Though a 2018 legal win resulted in a statewide ban on the practice, unauthorized brine spreading in PA continues. Guest post by Fair Shake.
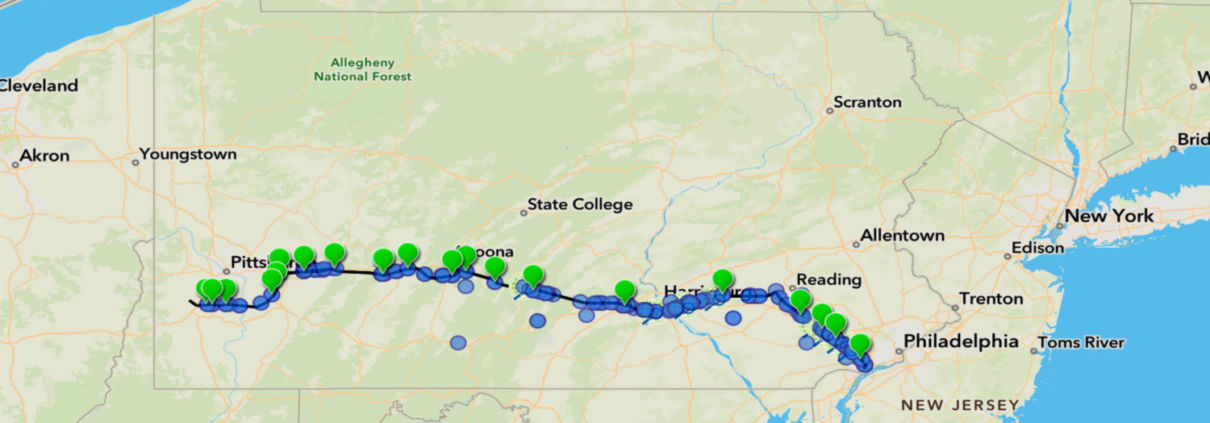
FracTracker mapped the 21 locations and over 120 violations by Energy Transfer Partner since Mariner East 2 Pipeline construction began.
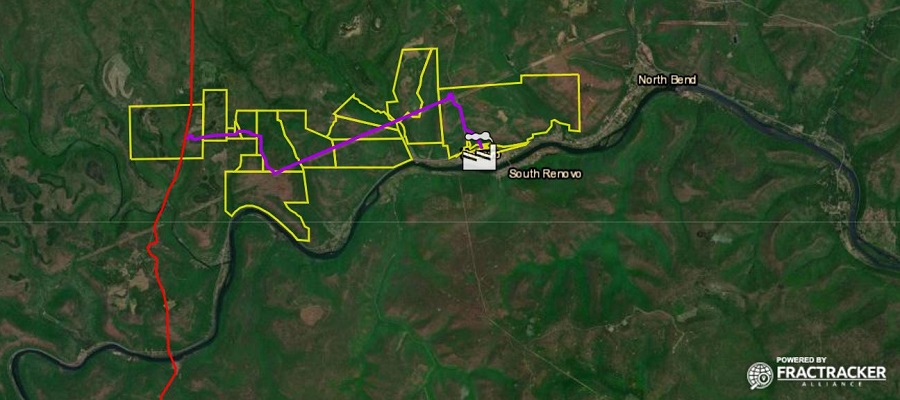
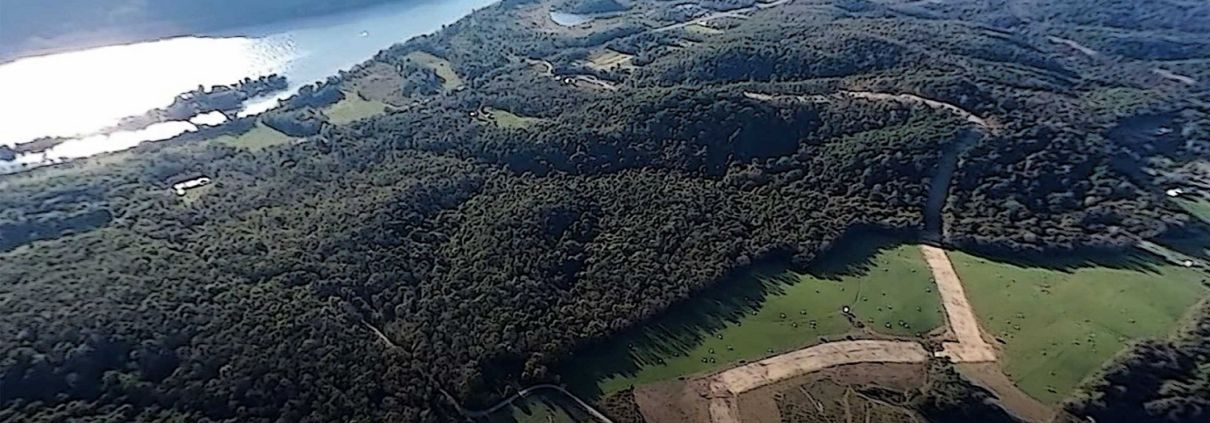
Residents and local advocacy groups are fighting a new power plant in Renovo, PA, planned to be constructed on an abandoned rail yard.
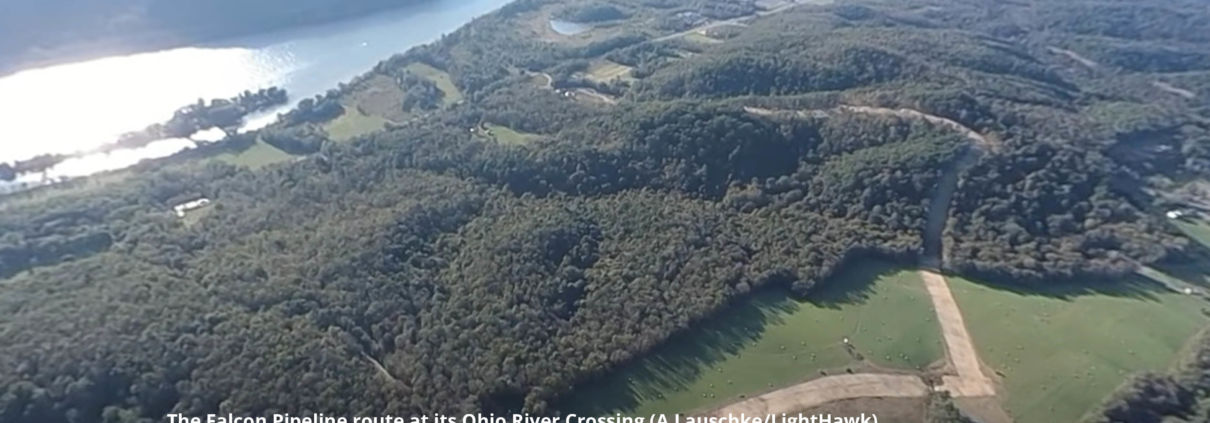
Ohio River Valley Groups react to a new safety warning issued by federal regulators to Shell regarding the troubled Falcon Pipeline
FracTracker’s aerial survey of unconventional oil & gas infrastructure and activities in northeast PA to southern OH and central WV
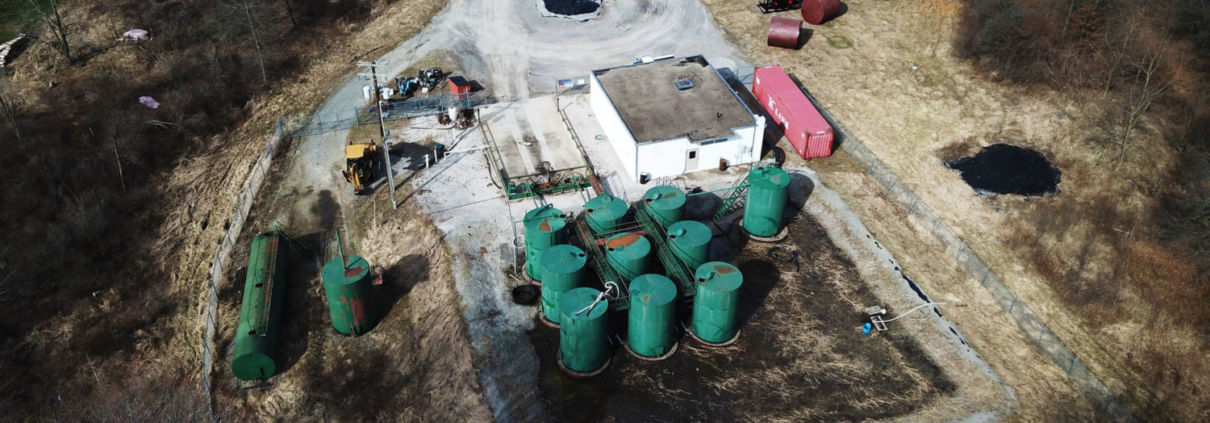
Insights on Ohio’s massive fracking waste gap, Class II injection well activity, and fracking waste related legislation
Sorry, no posts matched your criteria
![]()
216 Franklin St, Suite 400, Johnstown, PA 15901
Phone: +1 (717) 303-0403 | info@fractracker.org
FracTracker Alliance is a 501(c)3 non-profit: Tax identification number: 80-0844297