Ethane Cracker Discussion in Regional Air Pollution Report
Pittsburgh Regional Environmental Threats Analysis (PRETA) Air: Hazardous Air Pollutants
Although now we are an independent non-profit, FracTracker.org actually started as a project of CHEC at the University of Pittsburgh Graduate School of Public Health. At that time, Matt, Kyle, and I worked with researchers such as Drew Michanowicz and Jim Fabisiak of Pitt, as well as Jill Kriesky now of the Southwest PA Environmental Health Project, on a data mapping and analysis project called PRETA. The Pittsburgh Regional Environmental Threats Analysis (PRETA) is intended to inform stakeholders about Southwest Pennsylvania’s major environmental health risks and provide ways to manage them. CHEC worked with key decision makers and other academics to identify, prioritize, and assess these risks. The top three risks identified were ozone, particulate matter (PM), and hazardous air pollutants (HAPs). Due to the extensive time that research like this takes, the final report about hazardous air pollutants was just recently released.
Relevant to our oil and gas readers, the HAPs report included a piece about the proposed ethane cracker slated to be built in Beaver County, PA. Below is an excerpt of PRETA HAPs that discusses how the air quality in our region may change as a result of the removal of the present zinc smelter on that site, in place of the new cracker facility.
Excerpt: The Proposed Monaca, PA Ethane Cracker
Future Trends: New Sources of HAPs in Western Pennsylvania?
All of the previous risk analyses and data discussed [earlier in the report] were drawn using historical data collected in previous years. There is considerable delay around emissions inventory collection, air monitoring data collection, atmospheric modeling, and the calculated risk estimates’ being made public. Hence, these analyses speak best toward past and present trends. They often are less useful in predicting future risks, especially when sources and technologies are constantly changing. For example, better pollution mitigation and retrofitting processes should curtail future emissions from present levels. In addition, changing the profile of various industries within a region also will alter atmospheric chemistry and subsequent risks in future scenarios.
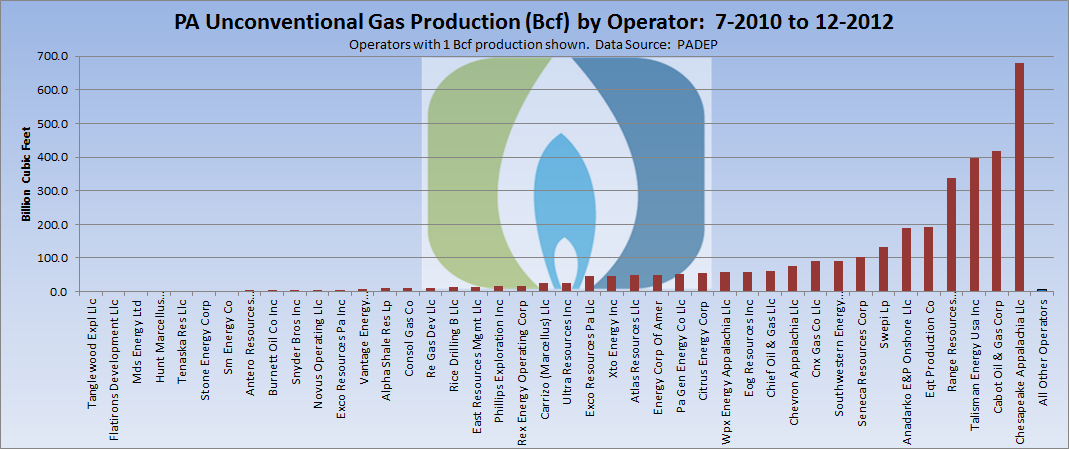
In recent years, there has been an unprecedented expansion of unconventional natural gas development (UNGD) in Western Pennsylvania, Ohio, and West Virginia driven in part by the recent feasibility of hydraulic fracturing, which is part of a drilling procedure that allows for the tapping of the vast methane deposits contained in the Marcellus and Utica shales beneath Pennsylvania and surrounding states. Primarily, drillers are seeking to extract methane (CH4), the primary component of natural gas. However, a portion of the natural gas present in our area is considered “wet gas,” which includes heavier hydrocarbons like ethane, propane, and butane that are typically dissolved in a liquid phase or condensate. These compounds are separated from the methane to be marketed as such products as liquid propane or used as feedstock in numerous other chemical processes. Therefore, a high demand remains for wet gas deposits regardless of fluctuating natural gas (methane) market prices. Thus, a large-scale expansion in other industries (e.g., chemical manufacturing) is anticipated to follow UNGD; new industrial facilities are needed to support the refining of wet gas condensates. For example, an ethane cracker converts or “cracks” ethane, a by-product of natural gas, into ethylene so that it can be used in the production of plastics.
Located in Monaca, Pa. (Beaver County), about 12 miles east of the West Virginia border, is an aging zinc smelter owned by the Horsehead Corporation. The present Horsehead facility is currently the largest zinc refining site in the United States, producing metallic zinc and zinc oxide from recycled material and steelmaking waste. The plant opened in the 1920s to take advantage of the by-products of steel manufacturing and has expanded and modernized over time. It employed about 600 workers until recently, when the company announced its relocation to a new state-of-the-art facility in North Carolina in the near future. The scope of this metal-refining operation was such that it was a significant source of metals and criteria air pollutants.
Recently, Shell Chemical, U.S. subsidiary of Royal Dutch Shell PLC, announced plans to build an ethane cracker in the northeast to take advantage of UNGD. Lured by substantial tax benefits and other economic incentives, Shell chose the former zinc smelting site in Monaca as its proposed new location for such a facility and, in March 2012, received the approval from Pennsylvania officials to build this petrochemical complex. The cracker, according to industry representatives, will be a multibillion-dollar structure and provide thousands of jobs for Pennsylvanians 43, 44. However, many of these jobs depend on the influx of concurrent industries and technologies, which are projected to follow in the wake of sufficient petrochemical refining facilities like the ethane cracker. Thus, it is not likely to be the sole source of pollutants in the area once constructed. Though plant construction remains years away, regional air pollutant composition and chemistry are poised to change as well. Adding to the issue is the fact that the zinc smelter, ranked as one of the worst air polluters in the country in 2002 45, will be decommissioned and have its operations moved to North Carolina.
Here, we will attempt to compare the pollutant profiles of the old and new air pollution sources in order to deduce potential air pollutant changes to existing air quality in the region. Previous emission inventories are available for the Horsehead zinc smelter (EPA Toxic Release Inventory for 2008) 46. Although the proposed cracker facility’s engineering specifics are not available yet, using the records of a similar existing wet gas processing plant, we can approximate the proposed cracker’s yearly emissions. In this case, we have chosen the similarly sized Williams Olefins Cracker Facility currently operating in Geismar, La., whose emissions profiles for 2008 also were available 46. This plant, owned by Williams Partners, L.P., processes approximately 37,000 barrels of ethane and 3,000 barrels of propane per day and annually produces 1.35 billion pounds of ethylene.

In assessing the emission inventories at the two sites, we first sought to compare those pollutants that were common to both facilities. Table 5 (above) compares the annual release of criteria pollutants for which National Ambient Air Quality Standards (NAAQS) exist. These include ozone, sulfur dioxide, nitrogen oxides, particulate matter (PM10, PM2.5), lead, and carbon monoxide, for which health-based regulatory standards exist for their concentration in ambient air1. Not surprisingly, the zinc smelter released large amounts of lead into the air (five tons per year). The proposed ethane cracker, on the other hand, would release only trace amounts of lead into the air and about 0.1 percent of the sulfur dioxide, 3 percent of the carbon monoxide, and 50 percent of the nitrogen oxides of the zinc smelter. Overall, release of PM would be of a similar order of magnitude at the two sites. Thus, the representative cracker facility by itself emits less NAAQS criteria pollutants than the smelter facility.

Similarly, Table 6 (above) examines similarly reported HAPs released from both of the facilities in question. A comparison of available emissions inventories of HAPs reveals a list of common pollutants, including acrolein, benzene, ethylbenzene, xylene, and volatile organic compounds (VOCs). Note the projected increase in release of acrolein and VOCs by the proposed ethane cracker. The latter are a rather broad class of organic chemicals that have high vapor pressure (low boiling point), allowing appreciable concentrations in the air as a gaseous phase 47, 48. Examples of VOCs include formaldehyde, d-limonene, toluene, acetone, ethanol (ethyl alcohol), 2-propanol (isopropyl alcohol), and hexanal, among others. They are common components of paints, paint strippers, and other solvents; wood preservatives; aerosol sprays; cleansers and disinfectants; moth repellents and air fresheners; stored fuels and automotive products; hobby supplies; and dry-cleaned clothing. They also possess a diverse range of health effects, including, but not limited to, eye and throat irritation, nausea, headaches, nosebleeds, and skin rashes at low doses, and kidney, liver, and central nervous system damage at high doses. Some are known or suspected carcinogens. These chemicals are more often known for their role in indoor air pollution and have been linked to allergies and asthma 49. Recall that acrolein is already the primary driver of noncancer respiratory risk in the PRETA area, and releases from the proposed cracker would theoretically add to that burden.

Table 7 shows a compiled list of HAPs that were released from the Geismar plant in 2008 but not from the zinc smelter, highlighting the potential change in the pollutant mixture. For comparison, the pollutants highlighted in yellow represent those that are several orders of magnitude greater than those emitted by the Clairton Coke Works in 2008. Note the rather large emissions of formaldehyde and acetaldehyde that were discussed above as the number one and number five existing cancer drivers in the area.
Other VOCs of note include ethylene glycol, ethylene oxide, methyl-tert-butyl ether and propionaldehyde. While all these pollutants may have toxic effects on their own, one of the primary concerns, especially in outdoor air, should be their ability to form secondary pollutants. For example, we have noted previously that both acetaldehyde and formaldehyde can be formed via photo-oxidation reactions of other hydrocarbons and VOCs. Thus, the direct emissions reported in the table are likely to be significant underestimations of the true burden of acetaldehyde and formaldehyde in the area near the cracker. It also should be mentioned that a complex nonlinear sensitivity exists among VOCs, NOX, and the production rate of ozone (O3). Most urban areas are considered NOX saturated or VOC sensitive and therefore have low VOC/NOX ratios. In these environments, ozone actually decreases with increasing NOX and increases with increasing VOCs—a potentially likely situation within the urban areas of Southwestern Pennsylvania.
In conclusion, it would appear that the replacement of the existing zinc smelter with the proposed ethane cracker has the potential to significantly transform the current pollutant mixture in the region. The elimination of lead and other heavy metal emissions would be replaced by increases in formaldehyde and acetaldehyde. In addition, it does not appear that the proposed ethane cracker alone would increase any of the NAAQS criteria air pollutants, with the possible exception of ozone. On the other hand, the rather large releases of several known cancer drivers, such as formaldehyde and acetaldehyde, from the proposed cracker could increase cancer risk in the immediate proximity. In addition, the large influx of VOCs and fugitive emissions from these operations warrants further predictive analysis, especially with regard to current pollution-mitigating strategies that may not be anticipating a transforming pollutant mix.

Authors and Credits
University of Pittsburgh Graduate School of Public Health
Center for Healthy Environments and Communities
Pittsburgh, PA | August 2013
Authors
Drew Michanowicz, MPH, CPH
Kyle Ferrar, MPH
Samantha Malone, MPH, CPH
Matt Kelso, BA
Jill Kriesky, PhD
James P. Fabisiak, PhD
Technical Support
Department of Communications Services
Marygrace Reder, BA
Alison Butler, BA
Full HAPs Report (PDF) | Ozone (PDF) | Particulate Matter (PDF)
For questions related to the full report, please contact CHEC.
References Mentioned in Excerpt
43. Detrow , S. (2012). What’s an ethane cracker? StateImpact – Pennsylvania. Accessed 12-18-12: http://stateimpact.npr.org/pennsylvania/tag/ethane-cracker.
44. Kelso, M. (2012). Jobs impact of cracker facility likely exaggerated. FracTracker Alliance. Accessed 12-18-12: www.fractracker.org/2012/06/jobs-impact-of-cracker-facility-likely-exaggerated.
45. SCORECARD: The Pollution Information Site. (2002). Environmental Release Report: Zinc Corp. of America Monaca Smelter. Accessed 12-18-12: http://scorecard.goodguide.com/envreleases/facility.tcl?tri_id=15061ZNCCR300FR#major_chemical_releases.
46. U.S. EPA. (2008). Technology Transfer Network, Clearinghouse for Inventories and Emissions Factors The National Emissions Inventory. The National Emissions Inventory. Accessed 1-25-13: www.epa.gov/ttn/chief/net/2008inventory.html.
47. U.S. EPA. (2012). An Introduction to Indoor Air Quality (IAQ). Volatile Organic Compounds. Accessed 12-18-12: www.epa.gov/iaq/voc.html.
48. U.S. EPA. (2012). Volatile Organic Compounds (VOCs). Accessed 12-18-12: www.epa.gov/iaq/voc2.html.
49. Nielsen, G.D., S.T. Larsen, O. Olsen, M. Lovik , L.K. Poulsen, C. Glue , and P. Wolkoff. (2007). Do indoor chemicals promote development of airway allergy? Indoor Air 17: pp. 236–255.
![]()