Central Penn Pipeline Under Debate
By Karen Edelstein, NY Program Coordinator, FracTracker Alliance
Background
Over the past month and a half, a new pipeline controversy has been stirring in Pennsylvania. The proposed $2 billion “Central Penn Pipeline” will be built to carry shale gas throughout the country. Starting in Susquehanna County, the 178 mile pipeline will run through Lebanon and Lancaster counties to connect the existing Tennessee Pipeline in the north with the Transco Pipeline in the south.
Oklahoma-based Williams Partners, the company proposing the pipeline, says that the project would help move gas from PA to locations as far south as Georgia and Alabama, in addition to adding relief from higher energy bills. The “Atlantic Sunrise Project,” as it is formally known, would also require the construction of two new 30,000 horse-power compressor stations: “Station 605” along the northern leg of the pipeline in Susquehanna County, as well as “Station 610” on the southern part of the pipeline. The northern part of the proposed pipeline will be 30 inches in diameter and run for about 56 miles; the southern portion will be 42 inches in diameter and about 122 miles long.
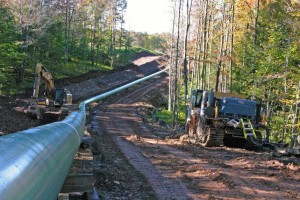
According to the US Energy Information Agency (EIA), in 2008, PA had over 8,700 miles of pipeline. Since then, that figure has increased significantly as the shale plays in PA continue to be exploited. Industry maintains that pipelines are the safest method for moving gas from the well to market, and has noted that for safety concerns they have intentionally co-located 36% of the northern part of the pipeline within the rights-of-way of Transco’s or other utility’s pipelines.
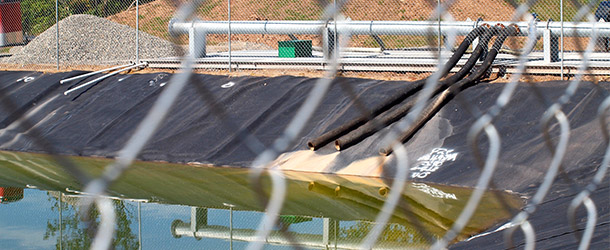
Despite the sanguine view of this project by industry, residents have rallied against the pipeline since mid-April, when landowners started getting information packets in the mail about the proposal.
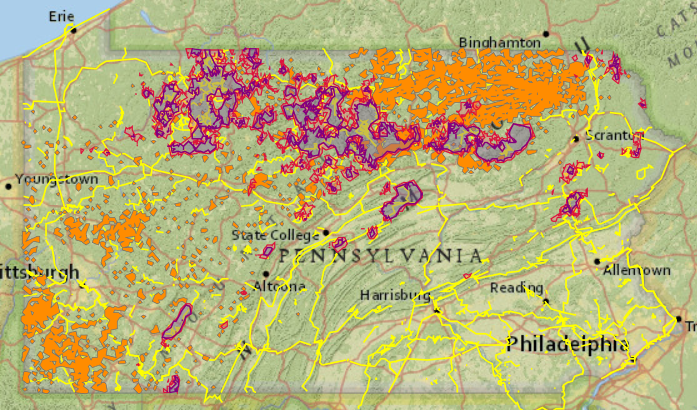
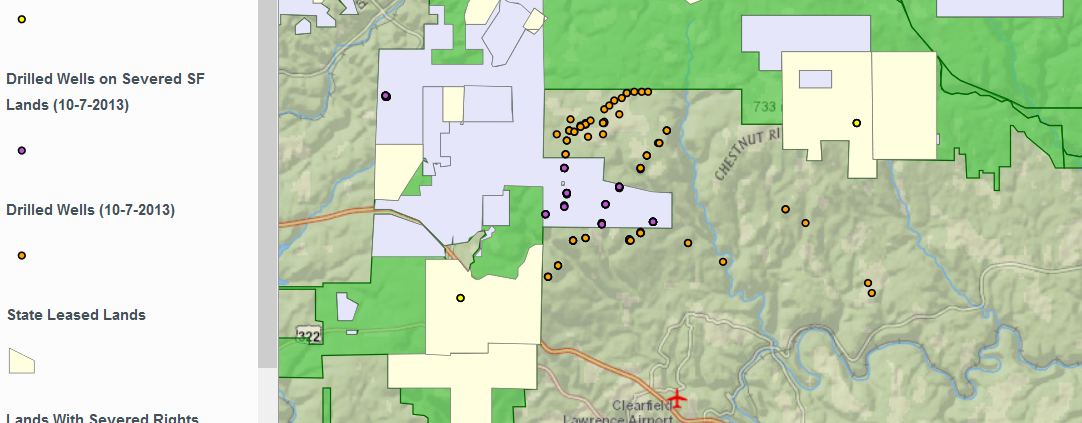
Pipeline Proposal Map
While the exact route of the pipeline has yet to be determined, FracTracker has adapted documents from Oklahoma-based Williams Partners Company to provide this interactive map below. The proposed pipeline is shown in red.
For a full-screen version of this map (with legend), click here.
Proposal Concerns
Public awareness and concern about the pipeline continues to build, as was evident when 1,100 residents attended an open house in Millersville, PA on June 10th hosted by Williams. For more information see this article in Lancaster Online.
The Lancaster County Conservancy has advocated moving the pipeline away from various sensitive habitats including the Tucquan Glen Nature Preserve, Shenk’s Ferry Wildflower Preserve, Fishing Creek, Kelly’s Run, and Rock Springs to preserve the wildlife and beauty of those areas. According to Williams:
The pipeline company must evaluate a number of environmental factors, including potential impacts on residents, threatened and endangered species, wetlands, water bodies, groundwater, fish, vegetation, wildlife, cultural resources, geology, soils, land use, air and noise quality… More
Despite what the website says, Williams admitted to not analyzing the pipeline route for possible sensitive habitat encroachment, and instead, they will simply follow the existing utility routes.
Williams, according to a report by WGAL Channel 8 in PA “relies on the communities affected to bring up any potential problems.” His statement was backed up when residents in a packed hearing room in Lancaster County voiced their opposition, resulting in Williams Partners now considering extending their pipeline by 2 ½ miles to get around the sensitive natural area at Tucquan Glen. An alternate route to avoid Shenk’s Ferry, however, had not been put forward.
Lancaster Farmland Trust is concerned about the plan for the pipeline to pass through several protected farms, and Lebanon County Commissioner Jo Ellen Litz has also taken a strong stand against the current proposed route. The proposed pipeline would not only go through farmlands, but it is also expected to cross the Appalachian Trail, Swatara State Park, and Lebanon Valley Rails to Trails.
Pipeline impacts are not limited to conservation and agriculture. There is increasing concern that the risks posed by large-diameter, high pressure pipelines such as this one may prevent nearby homeowners from keeping their mortgage loans or homeowner’s insurance. Future purchasers of the property may also encounter difficulty being approved for a mortgage loan or homeowner’s insurance.
While the pipeline company can purchase pipeline easements from property owners, industry can also petition the government to take the land by eminent domain from unwilling property owners. Pipeline rights-of-way acquired through eminent domain for these pipelines could potentially complicate a private property owner’s mortgage financing and homeowner’s insurance.
The final decisions about the siting of the pipeline is ultimately up to FERC, the Federal Energy Regulatory Commission.
Resources
Williams’ original maps of the pipelines can be viewed here: SOUTH | NORTH

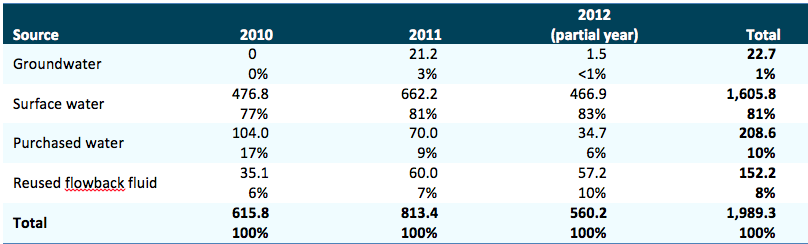
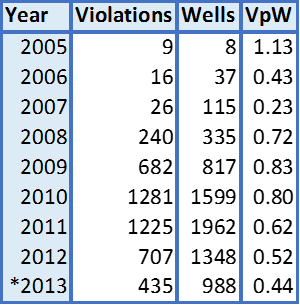
 The use of hydraulic fracturing for natural gas extraction has greatly increased in recent years in the Marcellus Shale. Since the beginning of this shale gas boom, water resources have been a key concern; however, many questions have yet to be answered with a comprehensive analysis. Some of these questions include: