 https://www.fractracker.org/a5ej20sjfwe/wp-content/uploads/2021/04/49770601811_6cc7e18996_k.jpg
716
1500
Matt Kelso, BA
https://www.fractracker.org/a5ej20sjfwe/wp-content/uploads/2025/09/2025-Wordmark-Logo.png
Matt Kelso, BA2025-04-07 15:42:272025-04-07 15:42:27Pipeline Incidents Are a Daily Occurrence
https://www.fractracker.org/a5ej20sjfwe/wp-content/uploads/2021/04/49770601811_6cc7e18996_k.jpg
716
1500
Matt Kelso, BA
https://www.fractracker.org/a5ej20sjfwe/wp-content/uploads/2025/09/2025-Wordmark-Logo.png
Matt Kelso, BA2025-04-07 15:42:272025-04-07 15:42:27Pipeline Incidents Are a Daily OccurrenceInfrastructure Networks in Texas
Overview
The map below displays selected infrastructure networks in Texas. Visualization of these networks helps us recognize our reliance upon them. Their immensity, ubiquity, and overlapping nature is a result of our unfettered demand for the services they provide; visualization also draws attention to the potential issues of complex and poorly understood infrastructure networks. This map is only one visualization and analysis, and we hope others can use it for further exploration.
In the book Disrupted Cities, editor Stephen Graham writes that when infrastructure networks such as electricity, communications, and sewage work best, they are “invisible and mundane,” often unnoticed and deemed more ordinary with time.[1] The network of pipes, satellites, generating stations, tarmac, concrete, and cables is “black-boxed”—complex, intertwined, obscure, and unseen.[2] Their ubiquity in advanced industrial societies renders them “banal artifacts” and “give[s] no hint to the average user of the huge and geographically stretched infrastructural complexes that invisibly sustain them.”[3] While these networks are mundane, they are also integral; we the users depend on them for our basic needs, and only when the networks fail do they become wholly apparent to and appreciated by the user.
This map and its layers attempt to unbox certain infrastructural networks, without the disruption of network failure, demonstrating the breadth of energy, transportation, education, and their interconnectedness. My hope is that users not only gain an appreciation for infrastructure, but can utilize the map for their own research and interests.
Infrastructure Networks in Texas
This map offers a visualization of specific infrastructure networks in Texas. The map contains layers and information pertaining to natural gas pipelines, other hazardous material pipelines, and incidents on natural gas pipelines. The map then shows schools, roads, bridges, and electric transmission lines that are close to natural gas pipelines—highlighting proximal pipeline incidences. View the map “Details” tab below in the top left corner to learn more and access the data, or click on the map to explore the dynamic version of this data. Data sources are also listed at the end of this article. In order to turn layers on and off in the map, use the “Contents” menu under “Details.” Items will activate in this map dependent on the level of zoom in or out.
View Full Size Map | Updated 8/3/2021 | Map Tutorial
I began constructing this map by compiling natural gas and oil pipeline data from the state. I did this because Texas makes the data available only in piecemeal files, thus the scope of the data is difficult to grasp. In visualizing the oil and gas infrastructure network through maps, a black-boxed infrastructure network slowly opens. The breadth of the pipeline infrastructure is astounding. I was first looking at this data in February, when many Texans were enduring freezing temperatures and significant disruptions to infrastructural networks—electricity, heat, water, and sewage.
With so much built infrastructure physically crossing and utilizing existing network paths of one another—all the while interdependent—complexity is inevitable, but crippling disruptions are not. The United States’ built infrastructure is in a general state of disrepair, and our telecommunications networks are vulnerable to nefarious intrusion. [4] [5]
The recent ransomware attack on the Colonial Pipeline speaks to this.[6] A massive network of built energy infrastructure serving transportation demands on the Eastern seaboard was intentionally shut down to mitigate fallout from a cyber-attack on its data networks. The pipeline operations rely on cyber infrastructure, while transportation infrastructure on the Eastern seaboard is reliant on the continued flow of fossil fuels. Suddenly, a pipeline carrying vast quantities of refined gasoline, oil, and jet fuel, unknown and certainly underappreciated, was thrown into the spotlight and, at least momentarily, unboxed.
The Take Away
A dizzying web of global infrastructure networks connects us. It facilitates economic transactions, strengthens diplomacy, and nurtures the interpersonal relationships we seek. A coffee shop is only a good place to see an old friend if there is electricity and the water is potable, and the coffee bean shipment arrives from Ethiopia. We mustn’t take these delicate networks for granted, nor should we prioritize a network at the expense of our health, safety, or environment.
The map of Texas does two things for me: it reminds me of our obsequious dependence on fossil fuels and the sacrifices we as a nation make to accommodate its infrastructure, and the map reminds me to always ask: Does it have to be this way? How can we make this better?
References & Where to Learn More
[1] Graham, Disrupted Cities, 6.
[2] Hinchliffe, “Technology, Power, and Space—The Means and Ends of Geographies of Technology.”
[3] Graham, Disrupted Cities, 6.
[4] LePatner, Too Big to Fall.
[5] “U.S. Threat Assessment Report.”
[6] Sanger and Perlroth, “Pipeline Attack Yields Urgent Lessons About U.S. Cybersecurity.”
Graham, Stephen, ed. Disrupted Cities: When Infrastructure Fails. New York: Routledge, 2010.
Hinchliffe, Steve. “Technology, Power, and Space—The Means and Ends of Geographies of Technology.” Environment and Planning D: Society and Space 14, no. 6 (December 1996): 659–82. https://doi.org/10.1068/d140659.
LePatner, Barry B. Too Big to Fall: America’s Failing Infrastructure and the Way Forward. New York : Hanover, [N.H.]: Foster Pub. ; University Press of New England, 2010.
Sanger, David E., and Nicole Perlroth. “Pipeline Attack Yields Urgent Lessons About U.S. Cybersecurity.” The New York Times, May 14, 2021, sec. U.S. https://www.nytimes.com/2021/05/14/us/politics/pipeline-hack.html.
“U.S. Threat Assessment Report.” The New York Times, April 13, 2021, sec. U.S. https://www.nytimes.com/interactive/2021/04/13/us/annual-threat-assessment-report-pdf.html.
Topics in This Article:
Join the Conversation
Stay Informed
Support Our Work
FracTracker Alliance helps communicate the risks of oil and gas and petrochemical development to advance just energy alternatives that protect public health, natural resources, and the climate.
By contributing to FracTracker, you are helping to make tangible changes, such as decreasing the number of oil and gas wells in the US, protecting the public from toxic and radioactive chemicals, and stopping petrochemical expansion into vulnerable communities.
Your donations help fund the sourcing and analysis of new data so that we can keep you informed and continually update our resources.
Please donate to FracTracker today as a way to advocate for clean water, clean air, and healthy communities.
What You Should Read Next
https://www.fractracker.org/a5ej20sjfwe/wp-content/uploads/2021/04/49770601811_6cc7e18996_k.jpg
716
1500
Matt Kelso, BA
https://www.fractracker.org/a5ej20sjfwe/wp-content/uploads/2025/09/2025-Wordmark-Logo.png
Matt Kelso, BA2025-04-07 15:42:272025-04-07 15:42:27Pipeline Incidents Are a Daily Occurrence https://www.fractracker.org/a5ej20sjfwe/wp-content/uploads/2023/04/EatonTwnshp_Zoning_CommissionMeeting_Capacity_March_22_2023.jpg
1129
1500
Ted Auch, PhD
https://www.fractracker.org/a5ej20sjfwe/wp-content/uploads/2025/09/2025-Wordmark-Logo.png
Ted Auch, PhD2023-04-03 13:49:182023-04-25 13:22:55East Palestine Train Derailment Waste: Community Impacts
https://www.fractracker.org/a5ej20sjfwe/wp-content/uploads/2023/04/EatonTwnshp_Zoning_CommissionMeeting_Capacity_March_22_2023.jpg
1129
1500
Ted Auch, PhD
https://www.fractracker.org/a5ej20sjfwe/wp-content/uploads/2025/09/2025-Wordmark-Logo.png
Ted Auch, PhD2023-04-03 13:49:182023-04-25 13:22:55East Palestine Train Derailment Waste: Community Impacts https://www.fractracker.org/a5ej20sjfwe/wp-content/uploads/2022/09/DSC_1021_LowRes__1607617394306__w1920-e1663613850641.jpg
667
1500
Ted Auch, PhD
https://www.fractracker.org/a5ej20sjfwe/wp-content/uploads/2025/09/2025-Wordmark-Logo.png
Ted Auch, PhD2022-09-19 15:08:172022-11-03 11:56:26Desalination: The Chemical Industry’s Demand for Water in Texas
https://www.fractracker.org/a5ej20sjfwe/wp-content/uploads/2022/09/DSC_1021_LowRes__1607617394306__w1920-e1663613850641.jpg
667
1500
Ted Auch, PhD
https://www.fractracker.org/a5ej20sjfwe/wp-content/uploads/2025/09/2025-Wordmark-Logo.png
Ted Auch, PhD2022-09-19 15:08:172022-11-03 11:56:26Desalination: The Chemical Industry’s Demand for Water in Texas https://www.fractracker.org/a5ej20sjfwe/wp-content/uploads/2021/11/TAuch_Plastics_Refinery_TankFarm_Terminal-Trafigura_CorpusChristiPolymers_Valero_Citgo_FlintHillsResources-CorpusChristi_TX_LightHawk_Nov2019-feature.jpg
667
1500
Ted Auch, PhD
https://www.fractracker.org/a5ej20sjfwe/wp-content/uploads/2025/09/2025-Wordmark-Logo.png
Ted Auch, PhD2021-11-05 09:43:472021-11-05 09:47:30Southeastern Texas Petrochemical Industry Needs 318 Billion Gallons of Water, but the US EPA Says Not So Fast
https://www.fractracker.org/a5ej20sjfwe/wp-content/uploads/2021/11/TAuch_Plastics_Refinery_TankFarm_Terminal-Trafigura_CorpusChristiPolymers_Valero_Citgo_FlintHillsResources-CorpusChristi_TX_LightHawk_Nov2019-feature.jpg
667
1500
Ted Auch, PhD
https://www.fractracker.org/a5ej20sjfwe/wp-content/uploads/2025/09/2025-Wordmark-Logo.png
Ted Auch, PhD2021-11-05 09:43:472021-11-05 09:47:30Southeastern Texas Petrochemical Industry Needs 318 Billion Gallons of Water, but the US EPA Says Not So Fast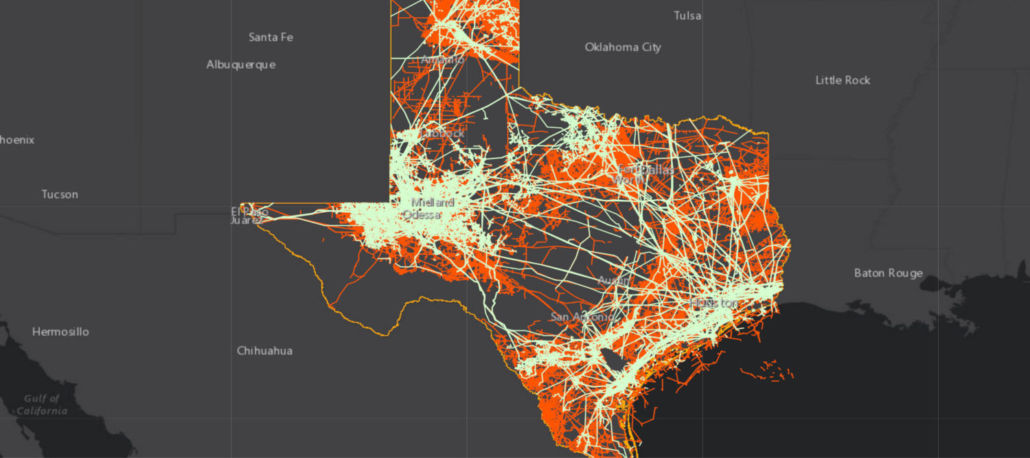 https://www.fractracker.org/a5ej20sjfwe/wp-content/uploads/2021/08/Texas-Infrastructure-Feature-.jpg
667
1500
Intern FracTracker
https://www.fractracker.org/a5ej20sjfwe/wp-content/uploads/2025/09/2025-Wordmark-Logo.png
Intern FracTracker2021-09-14 08:00:002022-01-24 17:49:20Infrastructure Networks in Texas
https://www.fractracker.org/a5ej20sjfwe/wp-content/uploads/2021/08/Texas-Infrastructure-Feature-.jpg
667
1500
Intern FracTracker
https://www.fractracker.org/a5ej20sjfwe/wp-content/uploads/2025/09/2025-Wordmark-Logo.png
Intern FracTracker2021-09-14 08:00:002022-01-24 17:49:20Infrastructure Networks in Texas https://www.fractracker.org/a5ej20sjfwe/wp-content/uploads/2021/07/PSR-PFAS-feature.jpg
667
1500
Matt Kelso, BA
https://www.fractracker.org/a5ej20sjfwe/wp-content/uploads/2025/09/2025-Wordmark-Logo.png
Matt Kelso, BA2021-07-15 07:55:282021-07-15 07:55:28Mapping PFAS “Forever Chemicals” in Oil & Gas Operations
https://www.fractracker.org/a5ej20sjfwe/wp-content/uploads/2021/07/PSR-PFAS-feature.jpg
667
1500
Matt Kelso, BA
https://www.fractracker.org/a5ej20sjfwe/wp-content/uploads/2025/09/2025-Wordmark-Logo.png
Matt Kelso, BA2021-07-15 07:55:282021-07-15 07:55:28Mapping PFAS “Forever Chemicals” in Oil & Gas Operations https://www.fractracker.org/a5ej20sjfwe/wp-content/uploads/2020/12/TAuch_Infrastructure-Refinery-BritishPetroleum-TexasCity_TX_LightHawk_Nov2019-Feature-scaled.jpg
667
1500
Ted Auch, PhD
https://www.fractracker.org/a5ej20sjfwe/wp-content/uploads/2025/09/2025-Wordmark-Logo.png
Ted Auch, PhD2020-12-23 16:23:392021-04-15 14:16:01Channels of Life: The Gulf Coast Buildout in Texas
https://www.fractracker.org/a5ej20sjfwe/wp-content/uploads/2020/12/TAuch_Infrastructure-Refinery-BritishPetroleum-TexasCity_TX_LightHawk_Nov2019-Feature-scaled.jpg
667
1500
Ted Auch, PhD
https://www.fractracker.org/a5ej20sjfwe/wp-content/uploads/2025/09/2025-Wordmark-Logo.png
Ted Auch, PhD2020-12-23 16:23:392021-04-15 14:16:01Channels of Life: The Gulf Coast Buildout in Texas https://www.fractracker.org/a5ej20sjfwe/wp-content/uploads/2020/07/Foreign-Trade-Zone-Sign-Feature.jpg
833
1875
FracTracker Alliance
https://www.fractracker.org/a5ej20sjfwe/wp-content/uploads/2025/09/2025-Wordmark-Logo.png
FracTracker Alliance2020-07-09 09:12:212021-04-15 14:16:12Industry Targets Peaceful Protest via “Critical Infrastructure” Legislation
https://www.fractracker.org/a5ej20sjfwe/wp-content/uploads/2020/07/Foreign-Trade-Zone-Sign-Feature.jpg
833
1875
FracTracker Alliance
https://www.fractracker.org/a5ej20sjfwe/wp-content/uploads/2025/09/2025-Wordmark-Logo.png
FracTracker Alliance2020-07-09 09:12:212021-04-15 14:16:12Industry Targets Peaceful Protest via “Critical Infrastructure” Legislation https://www.fractracker.org/a5ej20sjfwe/wp-content/uploads/2020/02/National-map-feature-3.png
400
900
Erica Jackson
https://www.fractracker.org/a5ej20sjfwe/wp-content/uploads/2025/09/2025-Wordmark-Logo.png
Erica Jackson2020-02-28 17:35:142022-05-02 15:21:42National Energy and Petrochemical Map
https://www.fractracker.org/a5ej20sjfwe/wp-content/uploads/2020/02/National-map-feature-3.png
400
900
Erica Jackson
https://www.fractracker.org/a5ej20sjfwe/wp-content/uploads/2025/09/2025-Wordmark-Logo.png
Erica Jackson2020-02-28 17:35:142022-05-02 15:21:42National Energy and Petrochemical Map![]()
216 Franklin St, Suite 400, Johnstown, PA 15901
Phone: +1 (717) 303-0403 | info@fractracker.org
FracTracker Alliance is a 501(c)3 non-profit: Tax identification number: 80-0844297