Comment Opposing the Southeast Supply Enhancement Project (SSEP) – Clean Water Act Section 404 Permit Application (SAW-2024-01961)
FracTracker Alliance strongly opposes the Southeast Supply Enhancement Project and its Clean Water Act permit application.
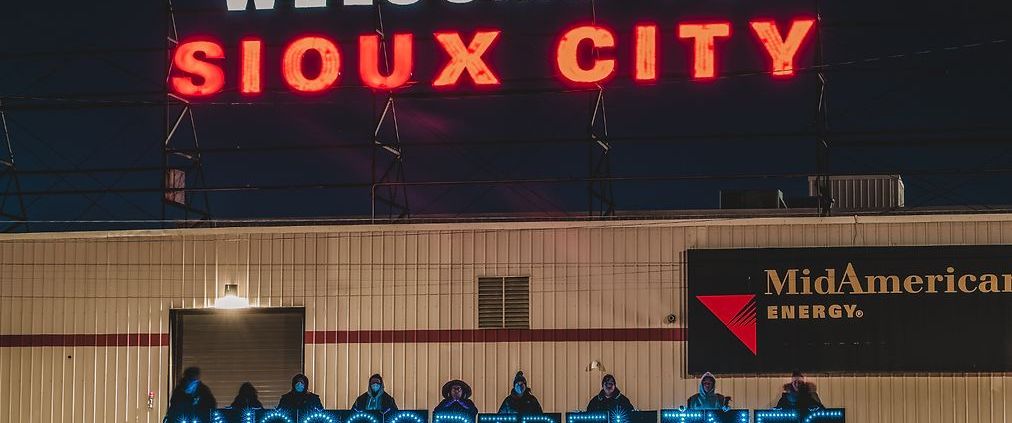 Great Plains Action Society
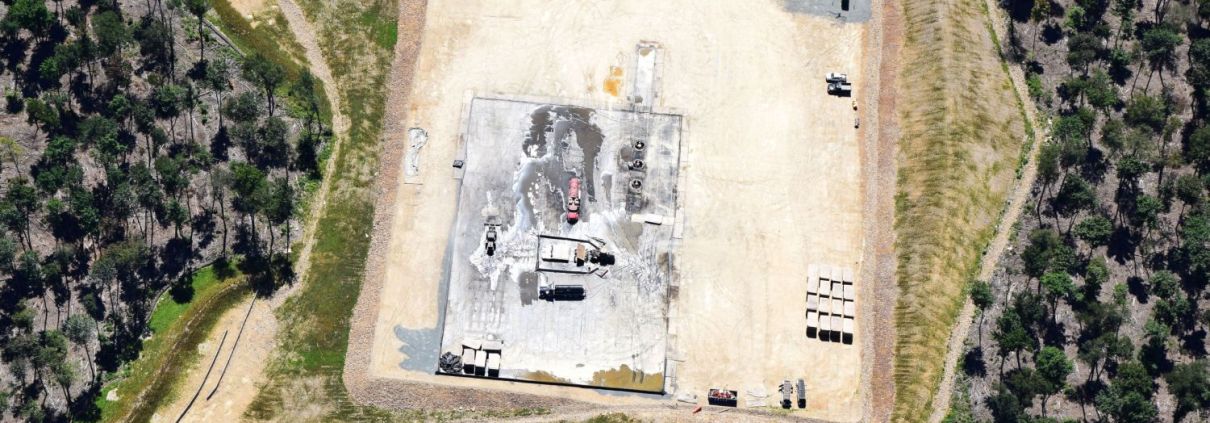
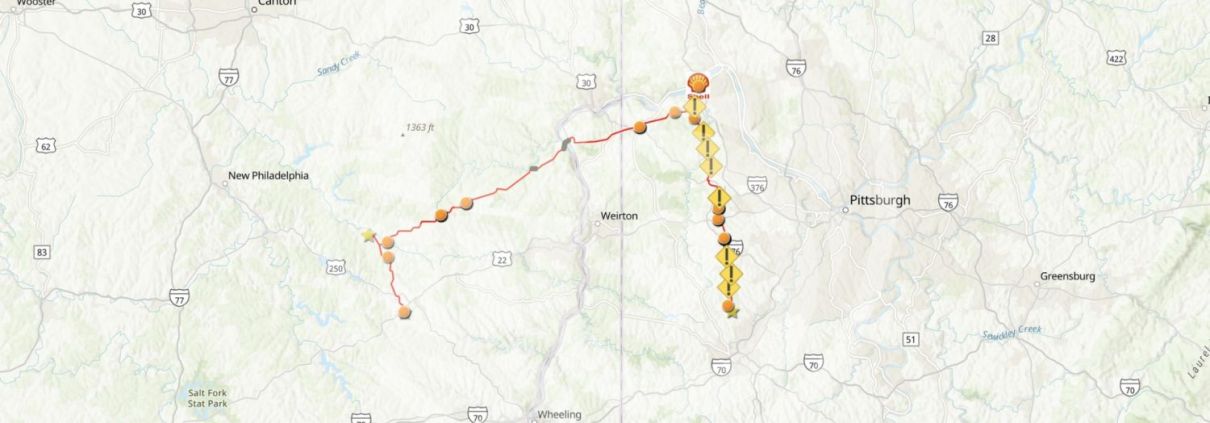 FracTracker Alliance, 2024
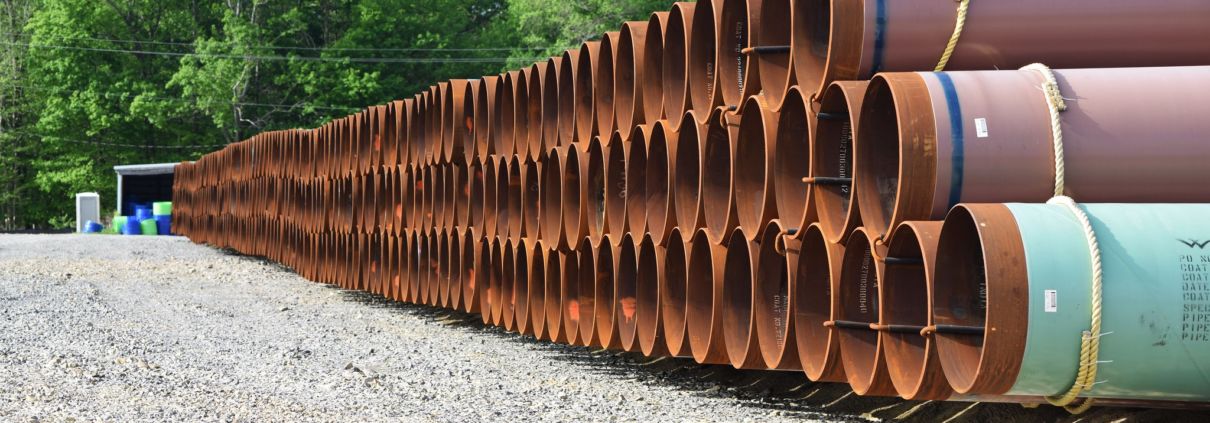
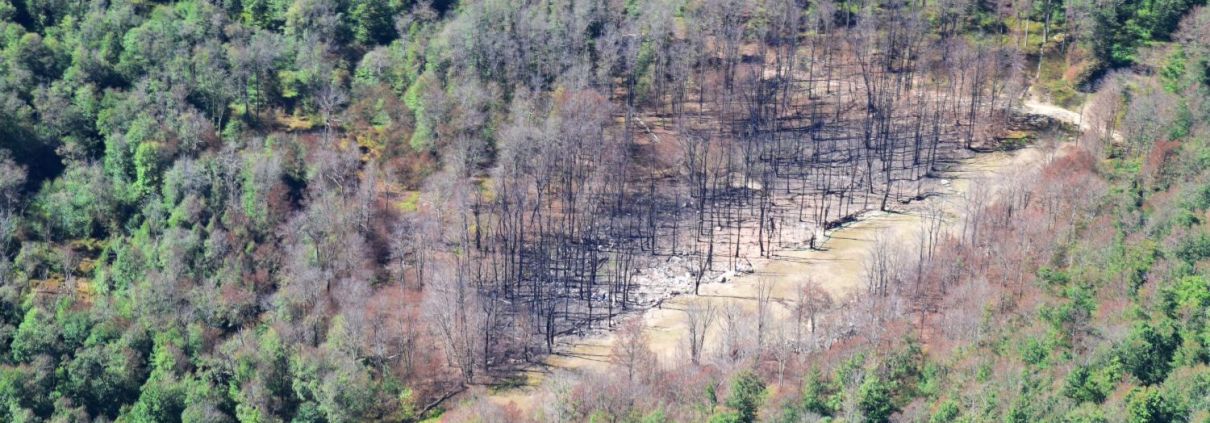 Ted Auch, FracTracker Alliance, 2022
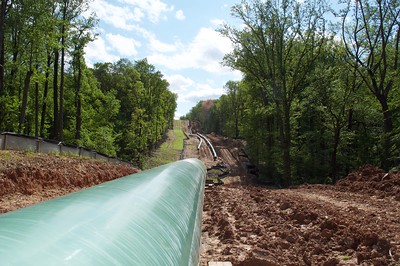
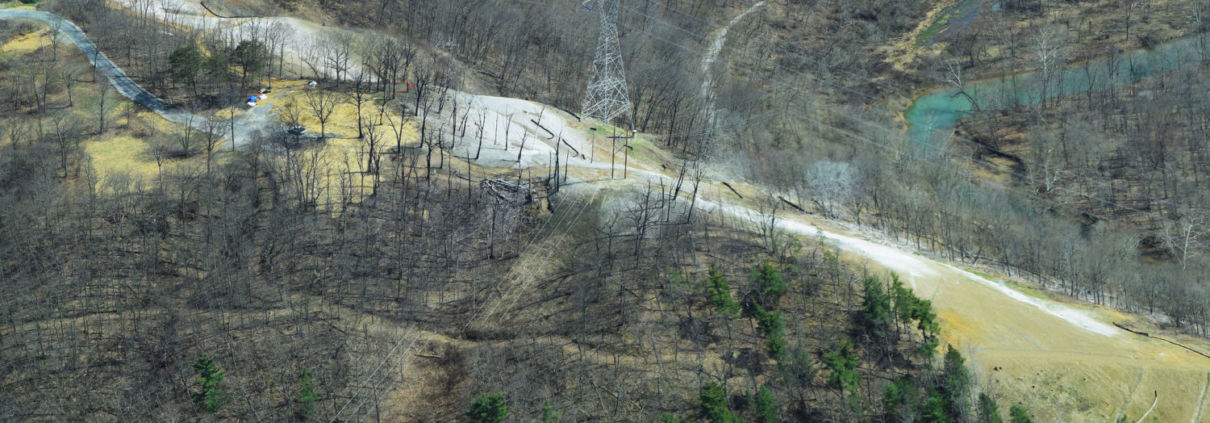